Post Syndicated from Nada Tlohi original https://aws.amazon.com/blogs/devops/how-property-finder-automated-incident-management-with-aws-devops-agent/
When a production service starts saturating the CPU at 1 AM, every minute counts for incident management. For Property Finder, a production incident could mean failed searches, frustrated users, and direct revenue impact. Property Finder is the leading property portal in the Middle East and North Africa (MENA), serving millions of property seekers across five markets.
Before adopting AWS DevOps Agent, incident response followed a familiar pattern: an alert fires, an on-call engineer wakes up, spends 20–40 minutes correlating metrics across tools, manually documents findings, and opens a fix. Mean Time to Resolution stretched to 2–3 days for non-critical issues.
Today, that entire workflow runs autonomously. From alert to root cause analysis, Slack notification, Jira ticket, on-call phone call with context, and auto-remediation pull request (PR), the full lifecycle completes in 14 minutes. This post walks through the implementation and shows how a separate custom agent that automatically generates code fixes is the key differentiator.
The business problem
Property Finder runs a distributed microservices architecture on Amazon Elastic Container Service (Amazon ECS) fronted by Application Load Balancers (ALBs). When infrastructure issues occur, the impact is immediate: users see failed searches, agents cannot update listings, and revenue is directly impacted during peak hours.
The traditional workflow had three gaps:
- Detection lag. Non-critical anomalies could go undetected for days.
- Context switching. Engineers bounced between five or more tools per incident.
- Knowledge silos. Runbooks lived in people’s heads, not automation.
Solution architecture
Property Finder’s implementation connects AWS DevOps Agent at the center of a three-tier pipeline: Detection and Trigger, Autonomous Investigation, and Event-Driven Output.
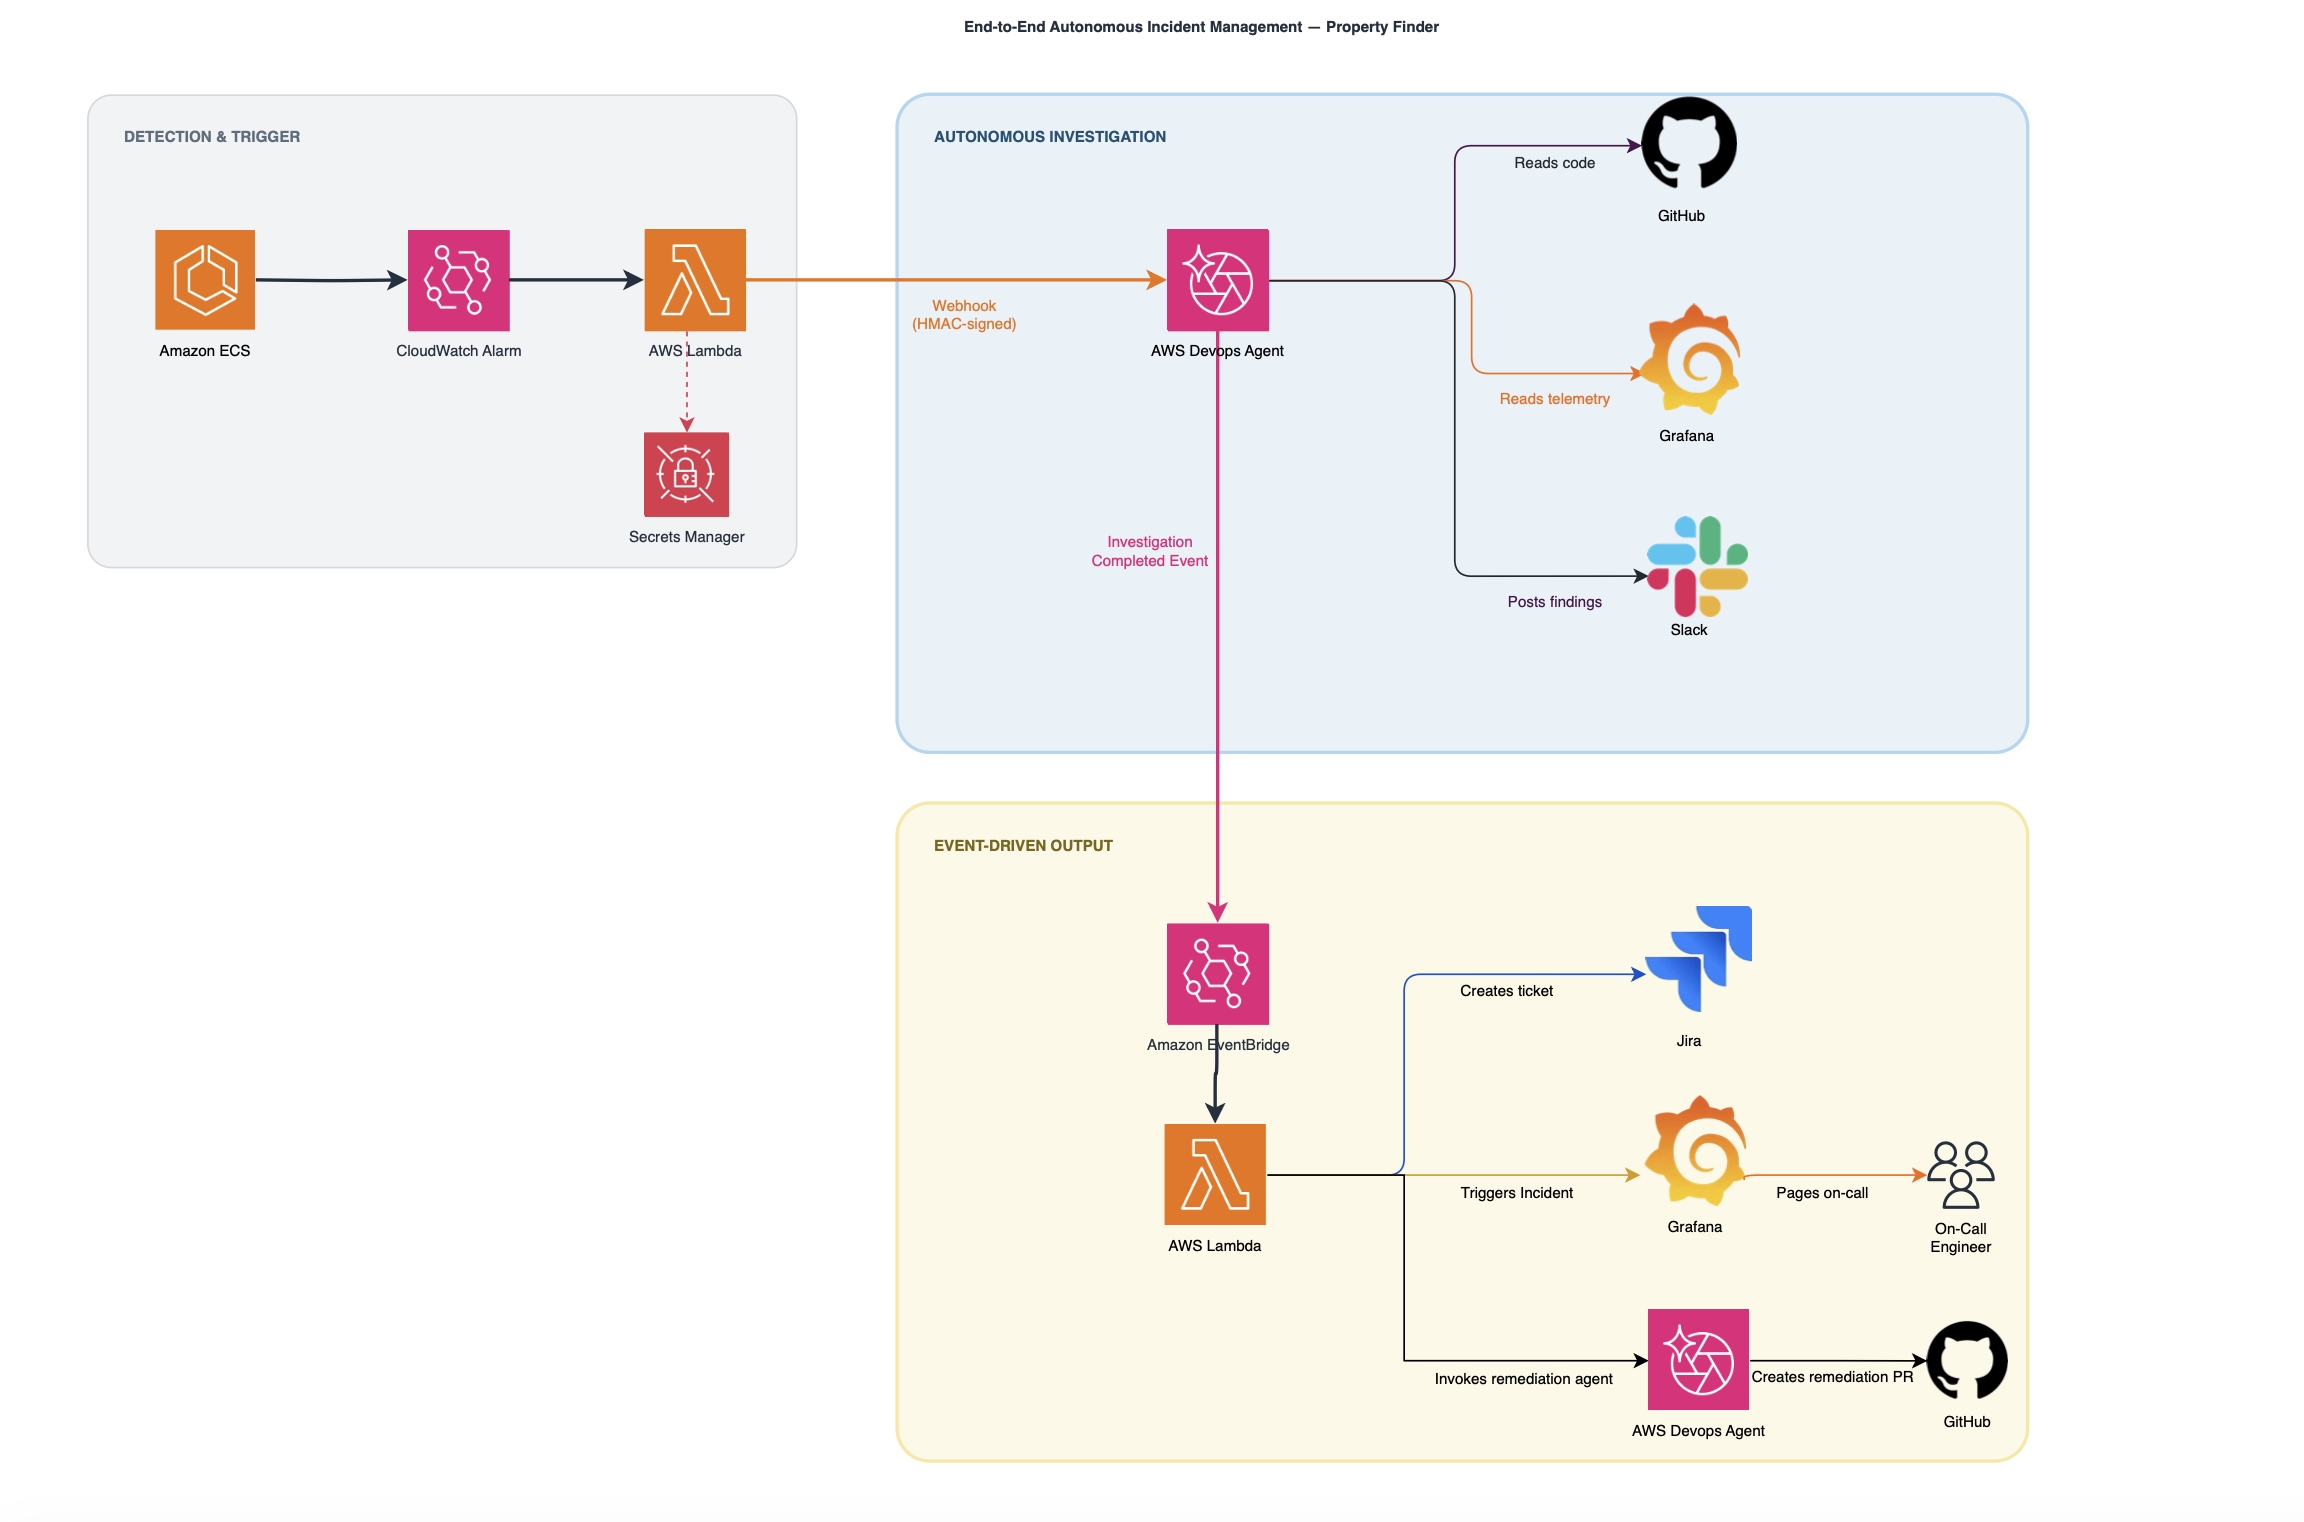
Figure 1: End-to-end autonomous incident management architecture
The numbered steps correspond to the data flow in Figure 1:
- ECS CPU spike triggers an Amazon CloudWatch Alarm. CloudWatch Metrics Insights monitors service health across all ECS clusters. When sustained CPU exceeds 98%, the alarm transitions to ALARM state.
- AWS Lambda formats and HMAC-signs the payload. Triggered directly by the CloudWatch alarm action (which fires only on ALARM state transitions), AWS Lambda enriches the payload with service metadata, signs it with HMAC-SHA256 using credentials from AWS Secrets Manager, and POSTs to the webhook.
- The agent begins autonomous investigation. Parallel subagents query ECS metrics, AWS CloudTrail, ALB traffic patterns, and Grafana telemetry (Prometheus, Loki, Pyroscope). The agent reads relevant source code from GitHub for correlation.
- Findings post to Slack in real time. The native Slack integration posts investigation progress to #incidents. The full root cause analysis, impact assessment, and mitigation plan appear at the end of the thread.
- Investigation Completed event fires to Amazon EventBridge. Amazon EventBridge triggers an orchestrator Lambda that fans out to three independent targets simultaneously.
- Lambda creates a Jira ticket with the full root cause analysis. The Lambda retrieves the investigation summary from journal records and creates a prioritized ticket with root cause, severity, and affected service.
- Grafana IRM pages the on-call engineer by phone. A Lambda posts a Grafana Alerting-compatible payload to the IRM webhook. The escalation chain calls the engineer with full investigation context: what broke, why, and the recommended fix.
- The remediation agent opens a GitHub PR with the auto-fix. It receives the root cause, generates a Terraform or code fix, and opens a Draft PR through a GitHub Model Context Protocol (MCP) server. Engineers review before merging.
A real incident
The example-service, Property Finder’s core property search microservice serving millions of queries per day across five MENA markets, experienced CPU saturation at 99.11%. The pipeline resolved it end-to-end in 14 minutes.
1:21 AM │ Alarm fires (ECS CPU > 98%)
1:22 AM │ Investigation starts + Slack posted
1:22 AM │ 4 parallel subagents launched
1:32 AM │ Root cause identified
1:33 AM │ Jira ticket [redacted] created
1:34 AM │ On-call paged via phone call
1:35 AM │ GitHub PR [redacted] opened with fix
The detection Lambda handles three tasks: (1) retrieves the webhook secret from AWS Secrets Manager, (2) enriches the CloudWatch alarm event with ECS service metadata (cluster name, service name, task count), and (3) HMAC-signs the payload before POSTing to the webhook. The key authentication pattern:
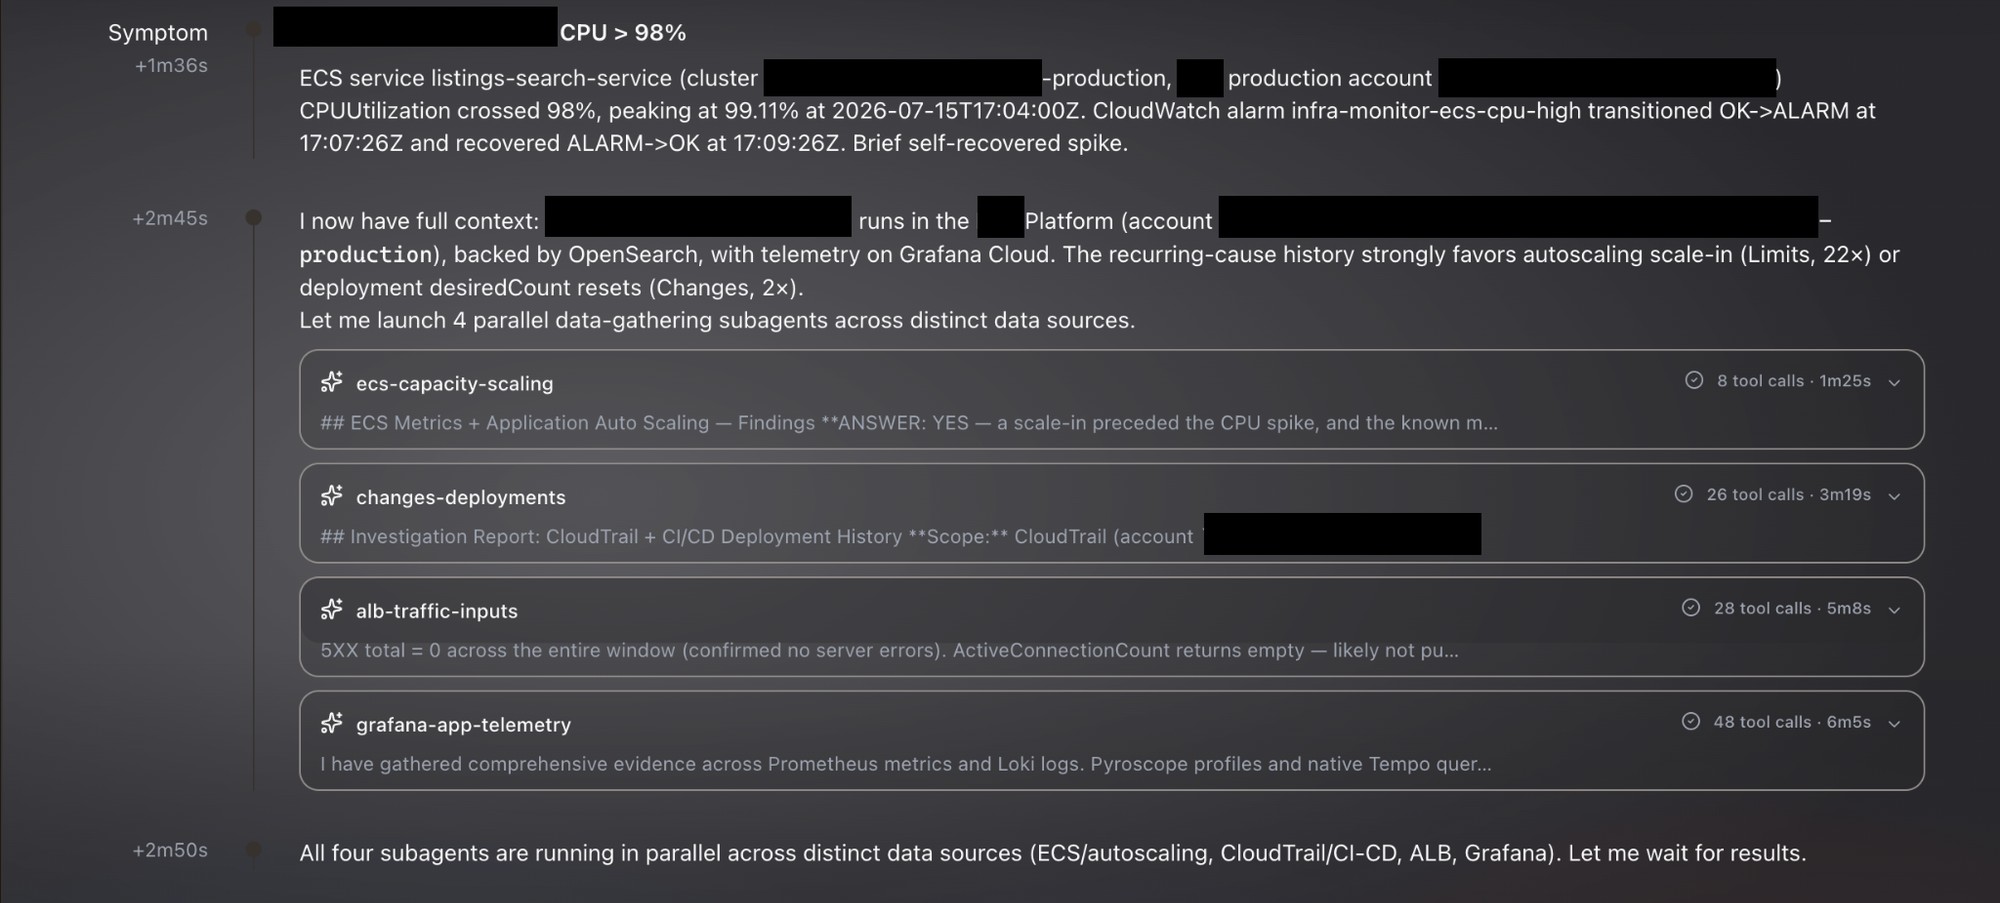
Figure 2: Four parallel subagents investigating ECS, CloudTrail, ALB, and Grafana data sources simultaneously
Root cause: Conflicting CPU and memory target-tracking autoscaling policies combined with an insufficient capacity floor. The service had both a CPU policy (target 70%) and a memory policy (target 75%). Actual memory usage sat at 3–8%, creating a persistent conflict between the two policies.
With MinCapacity set too low, the service could not sustain the task count needed to absorb CPU load. The resulting instability (22+ scaling flips observed) prevented stable scale-out, leaving the service effectively pinned at two tasks with no CPU headroom.
This is a common organizational issue: teams configure both scaling dimensions without realizing the interaction, especially when the capacity floor is not sized for baseline traffic. The agent identified the pattern in 10 minutes, a task that typically requires senior engineers with deep scaling expertise and hours of CloudWatch metric correlation.
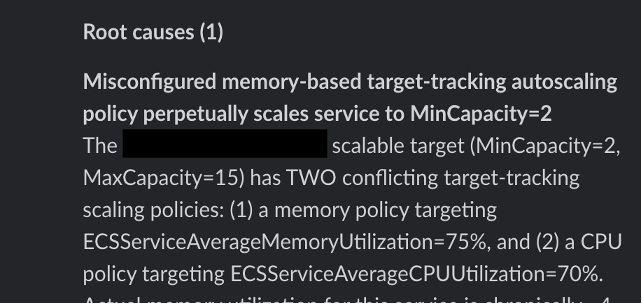
Figure 3: Root cause analysis identifying the conflicting autoscaling policy
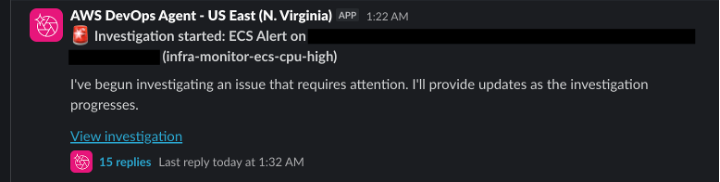
Figure 4: Slack notification with investigation link posted at 1:22 AM
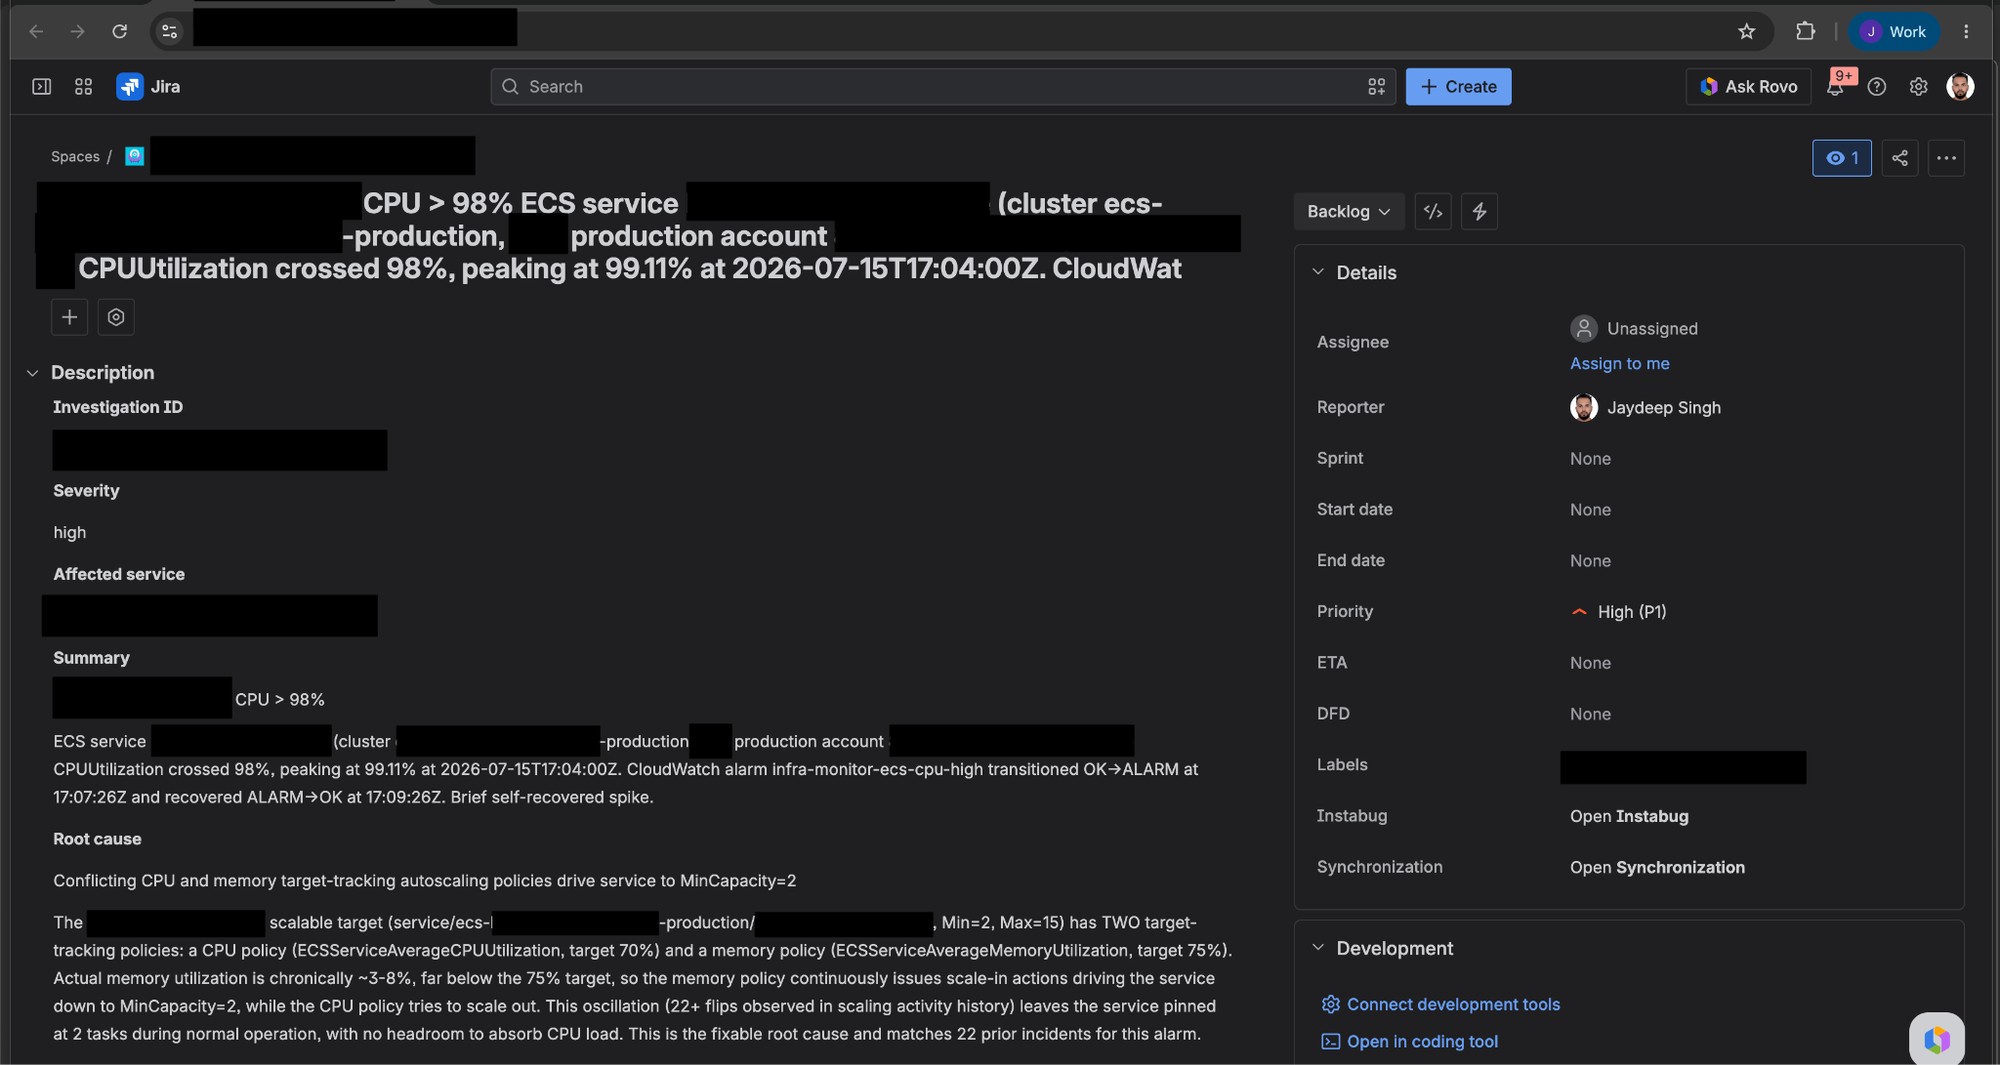
Figure 5: Jira ticket [redacted] auto-created with priority, root cause, and affected service
At 1:34 AM, the on-call engineer received a phone call through Grafana IRM with the complete investigation context. No need to wake up and hunt for root cause across dashboards.
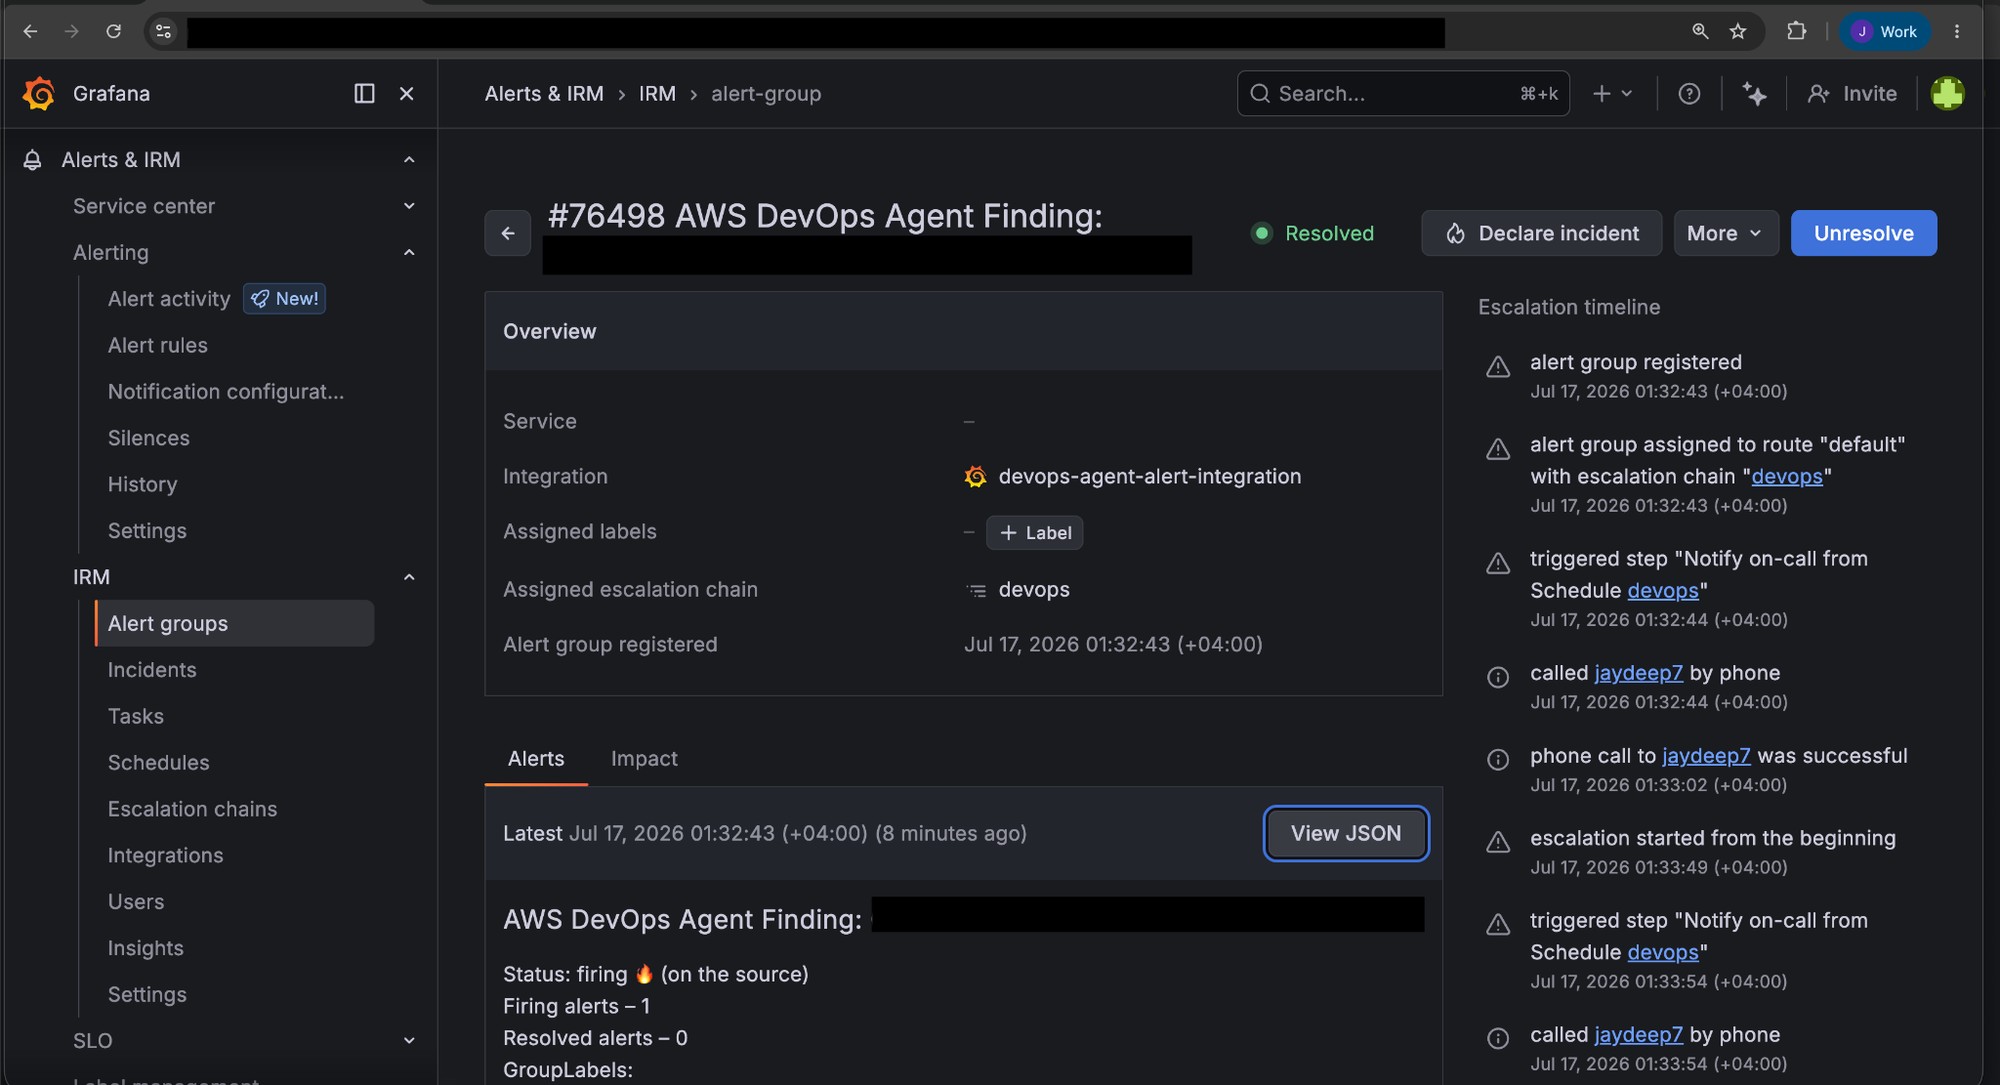
Figure 6: Grafana IRM escalation chain routing the alert and calling the on-call engineer
Figure 7: Incoming phone call at 1:34 AM with investigation context
Mitigation plan generated: (1) Remove the memory-based scaling policy, (2) raise MinCapacity to handle baseline traffic, (3) implement CPU-only target tracking at 70%. This plan was passed to a separate custom agent for remediation.
Remediation
Remediation is the key differentiator in this pipeline. It is a dedicated remediation agent (pr-creation-agent) invoked only after investigation completes. AWS DevOps Agent enforces read-only access to infrastructure through a per-session permission guardrail. Effective permissions are the intersection of the execution role’s IAM policy and the guardrail, and write actions are excluded.
The split separates concerns: investigation stays within that read-only envelope, whereas the remediation agent is scoped to a GitHub MCP server as its only external integration. Safety at the remediation layer does not rely on the agent’s built-in directed actions approval mechanism. Instead, two controls enforce the boundary. First, the remediation agent is a separate, narrowly scoped agent with access limited to GitHub MCP. Second, every output is a Draft pull request that requires human review and merge before taking effect. The GitHub MCP connection is authenticated with a fine-grained personal access token scoped to the specific infrastructure repositories, with an expiration and rotation policy. No elevated IAM role or additional agent permissions are required.
How it works
When the “Investigation Completed” Amazon EventBridge event fires, a Lambda orchestrator invokes the remediation agent with the investigation ID. The agent then:
- Reads findings from journal records to understand the root cause and recommended fix.
- Maps the AWS account to the correct repository. Property Finder has six infrastructure repos for different teams (B2B, B2C, core-platform, growth, data-engineering, shared-infra). The agent extracts the account ID from resource ARNs and routes to the right repo. This mapping is validated through automated tests and updated as new accounts or repositories are onboarded.
- Checks for duplicate PRs by searching existing PR titles and bodies for the investigation ID. If a matching PR exists, it reports the URL and exits without creating a duplicate.
- Reads the relevant Terraform files through GitHub MCP (GITHUB-MCP_get_file_contents), identifies the exact changes required, and plans the fix.
- Creates a feature branch (fix/{investigation_id}), commits the changes, and opens a Draft PR with a structured template including problem summary, root cause, changes made, and a testing checklist.
AWS also supports remediation through Kiro CLI with AWS CodeBuild or Kiro-ready prompts. Property Finder chose an approach that fits their multi-team repository structure: the remediation agent runs entirely within the Agent Space (the managed environment where custom agents execute), uses GitHub MCP for repository access, and maps multiple repositories to different teams automatically.
The orchestrator Lambda is triggered by the “Investigation Completed” Amazon EventBridge event. It first retrieves the investigation findings from journal records, then fans out to three targets simultaneously. Target one creates a Jira ticket with the full root cause analysis, severity, and affected service. Target two posts a Grafana Alerting-compatible payload to the Grafana IRM webhook to trigger phone call escalation. Target three invokes the remediation agent through the CreateChat and SendMessage API, passing the investigation ID and root cause context so it can generate the appropriate code fix.
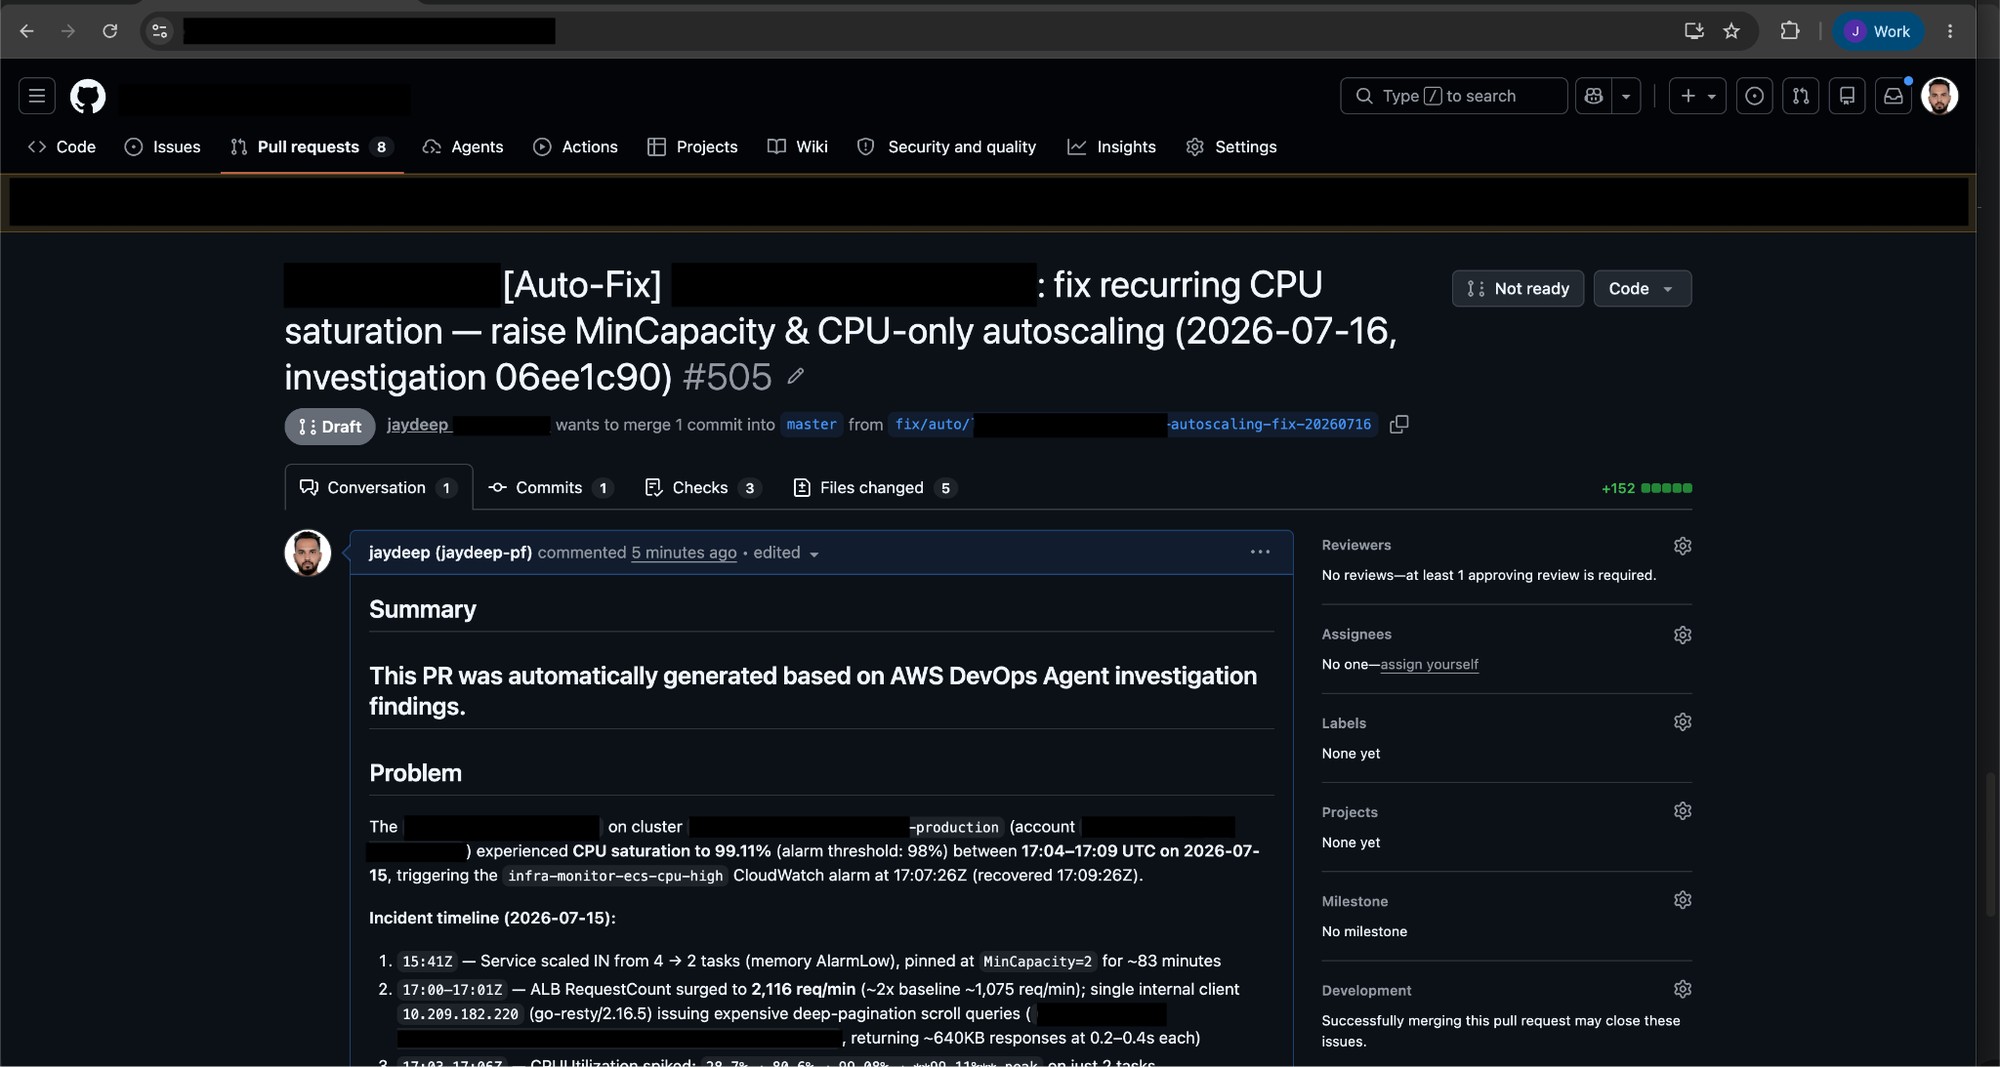
Figure 8: GitHub PR [redacted] generated by the remediation agent with a structured problem, root cause, and changes template
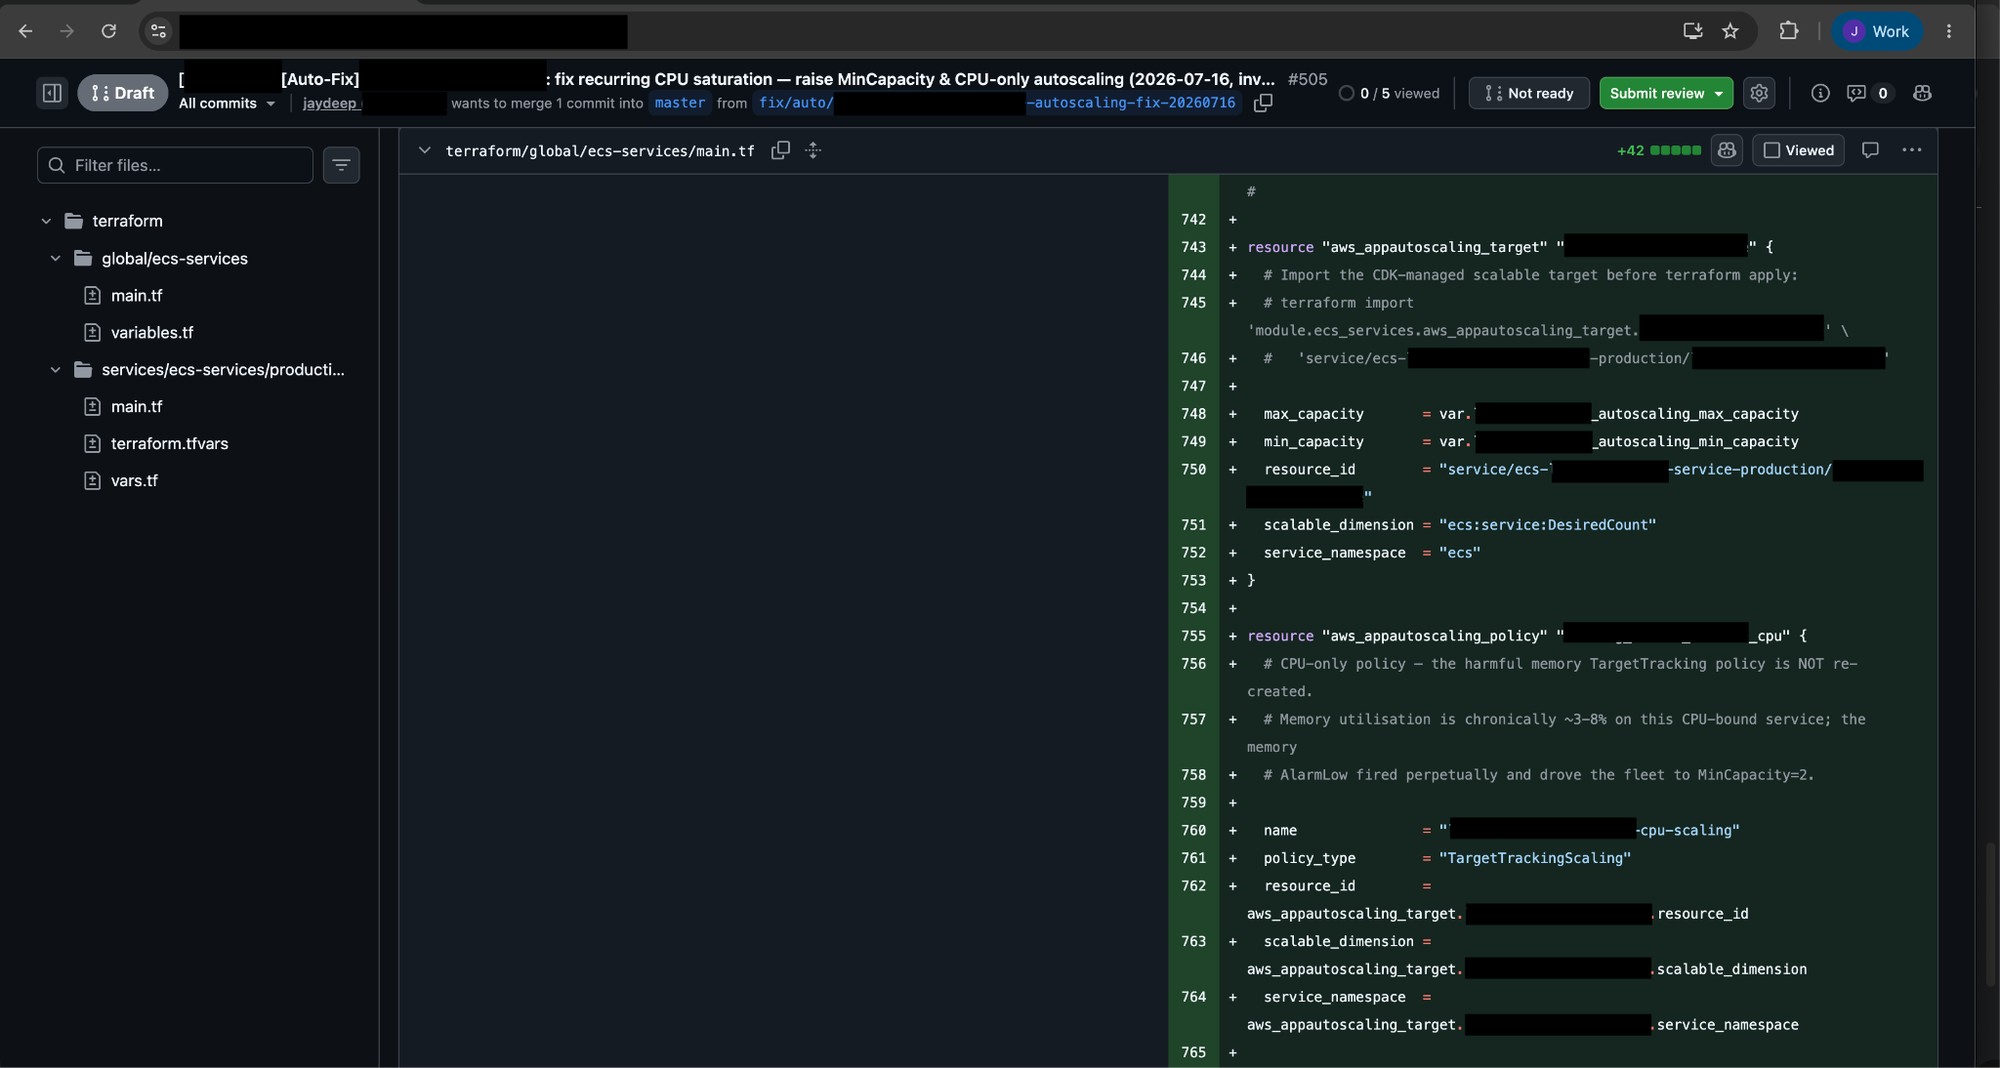
Figure 9: Terraform diff showing the new CPU-only scaling policy replacing the conflicting memory configuration
The PR is always opened as Draft. Engineers review, run terraform plan, validate in staging, and merge. The agent never auto-merges.
Results
| Metric | Before | After | Improvement |
| End-to-end time | Hours to days | 14 minutes | >88% reduction |
| Investigation | 20 to 40 min (manual) | 10 min (autonomous) | 50–75% reduction |
| Documentation | Manual, incomplete | Auto-generated root cause analysis + Jira | 100% documented |
| Remediation | Manual PR by engineer | Auto-fix PR + review | Minutes to code fix |
Cost considerations: Each incident invokes two agent sessions (investigation + remediation) with up to four parallel subagents. Billing is based on agent minutes. For detailed pricing, see the AWS DevOps Agent pricing page. We recommend reviewing pricing for all services used in this architecture.
“We now rely fully on AWS DevOps Agent to identify infrastructure-related issues. It has helped us identify multiple complex issues without even opening a support ticket. Even if we had raised tickets, it would likely have taken support engineers hours to find the root cause, whereas we resolved these issues in minutes.”
— Yasitha Bogamuwa, Cloud Engineering Manager, Property Finder
Getting started
Prerequisites:
- An Agent Space configured in your account.
- Amazon CloudWatch and AWS CloudTrail enabled for observability.
- Slack, Grafana, and GitHub connected as capabilities.
- Infrastructure resources tagged for topology mapping.
Step 1: Configure the webhook trigger. Set up CloudWatch Alarm action to invoke a Lambda function. The Lambda enriches the payload, HMAC-signs it, and POSTs to your Agent Space webhook endpoint.
Step 2: Set up event-driven outputs. Create an Amazon EventBridge rule for “Investigation Completed” events (source: aws.aidevops). Add Lambda targets for Jira, Grafana IRM, and optionally a remediation custom agent.
Step 3: Test end-to-end. Trigger a test alarm and verify the full pipeline: investigation starts, Slack posts, Jira ticket created, on-call paged, and PR opened.
For a similar integration pattern with Salesforce, see Automating Incident Investigation with AWS DevOps Agent and Salesforce MCP Server on the AWS DevOps Blog.
Clean up
This post describes an architecture pattern implemented by Property Finder. If you deployed test resources while following along, remember to delete any CloudWatch Alarms, Lambda functions, Amazon EventBridge rules, and Agent Space configurations to avoid ongoing charges. For a full list of resources and associated costs, review the pricing pages for each AWS service used in this architecture.
Conclusion
Property Finder’s implementation shows that autonomous incident management works in production today, with their pipeline running since early 2026. The agent never auto-merges. Human review remains in the loop by design: the agent accelerates, the engineer decides. The on-call engineer wakes up to a phone call with the root cause already identified, a Jira ticket filed, and a PR ready for review.
Explore the AWS DevOps Agent documentation to get started with your own autonomous pipeline.
Related resources
- Getting Started with AWS DevOps Agent.
- Automating Incident Investigation with Salesforce MCP.
- Building an End-to-End Agentic SRE.
- Amazon EventBridge User Guide.
- Grafana IRM Documentation.