Cloudflare Stream loves video. But we know not every workflow needs the full picture, and the popularity of podcasts highlights how compelling stand-alone audio can be. For developers, processing a video just to access audio is slow, costly, and complex.
What makes video so expensive? A video file is a dense stack of high-resolution images, stitched together over time. As such, it is not just “one file” — it’s a container of high-dimensional data such as frames per second, resolution, codecs. Analyzing video means traversing time resolution frame rate.
Why audio extraction
By comparison, an audio file is far simpler. If an audio file consists of only one channel, it is defined as a single waveform. The technical characteristics of this waveform are defined by the sample rate (the number of audio samples taken per second), and the bit depth (the precision of each sample).
With the rise of computationally intensive AI inference pipelines, many of our customers want to perform downstream workflows that require only analyzing the audio. For example:
Power AI and Machine Learning: In addition to translation and transcription, you can feed the audio into Voice-to-Text models for speech recognition or analysis, or AI-powered summaries.
Improve content moderation: Analyze the audio within your videos to ensure the content is safe and compliant.
Using video data in such cases is expensive and unnecessary.
That’s why we’re introducing audio extraction. Through this feature, with just a single API call or click in the dashboard, you can now extract a lightweight M4A audio track from any video.
We’re introducing two flexible methods to extract audio from your videos.
1. On-the-Fly audio extraction through Media Transformations
Media Transformations is perfect for processing and transforming short-form videos, like social media clips, that you store anywhere you’d like. It works by fetching your media directly from its source, optimizing it at our edge, and delivering it efficiently.
We extended this workflow to include audio. By simply adding mode=audio to the transformation URL, you can now extract audio on-the-fly from a video file stored anywhere.
The above request generates a 10 second M4A audio clip from the source video, beginning at the 5-second mark. You can learn more about setup and other options in the Media Transformations documentation.
2. Audio downloads
You can now download the audio track directly for any content that you manage within Stream. Alongside the ability to generate a downloadable MP4 for offline viewing, you can also now create and store a persistent M4A audio file.
Workers AI demo
Here, you can see a sample piece of code that demonstrates how to use Media Transformations with one of Cloudflare’s own products — Workers AI. The following code creates a two-step process: first transcribing the video’s audio to English, then translating it into Spanish.
export default {
 async fetch(request, env, ctx) {


   // 1. Use Media Transformations to fetch only the audio track
   const res = await fetch( "https://blog.cloudflare.com/cdn-cgi/media/mode=audio/https://pub-d9fcbc1abcd244c1821f38b99017347f.r2.dev/announcing-audio-mode.mp4" );
   const blob = await res.arrayBuffer();


   // 2. Transcribe the audio to text using Whisper
   const transcript_response = await env.AI.run(
     "@cf/openai/whisper-large-v3-turbo",
     {
       audio: base64Encode(blob), // A base64 encoded string is required by @cf/openai/whisper-large-v3-turbo
     }
   );


   // Check if transcription was successful and text exists
   if (!transcript_response.text) {
       return Response.json({ error: "Failed to transcribe audio." }, { status: 500 });
   }


   // 3. Translate the transcribed text using the M2M100 model
   const translation_response = await env.AI.run(
     '@cf/meta/m2m100-1.2b',
     {
       text: transcript_response.text,
       source_lang: 'en', // The source language (English)
       target_lang: 'es'  // The target language (Spanish)
     }
   );


   // 4. Return both the original transcription and the translation
    return Response.json({
        transcription: transcript_response.text,
        translation: translation_response.translated_text
    });


 }
};


export function base64Encode(buf) {
 let string = '';
 (new Uint8Array(buf)).forEach(
   (byte) => { string += String.fromCharCode(byte) }
 )
 return btoa(string)
}
After running, the worker returns a clean JSON response. Shown below is a snippet of the transcribed and then translated response the worker returned.
Transcription:
{
  "transcription": "I'm excited to announce that Media Transformations from Cloudflare has added audio-only mode. Now you can quickly extract and deliver just the audio from your short form video. And from there, you can transcribe it or summarize it on Worker's AI or run moderation or inference tasks easily.",
  "translation": "Estoy encantado de anunciar que Media Transformations de Cloudflare ha añadido el modo solo de audio. Ahora puede extraer y entregar rápidamente sólo el audio de su vídeo de forma corta. Y desde allí, puede transcribirlo o resumirlo en la IA de Worker o ejecutar tareas de moderación o inferencia fácilmente."
}
Technical details
As a summer intern on the Stream team, I worked on shipping this long-requested feature. My first step was to understand the complex architecture of Stream’s media pipelines.
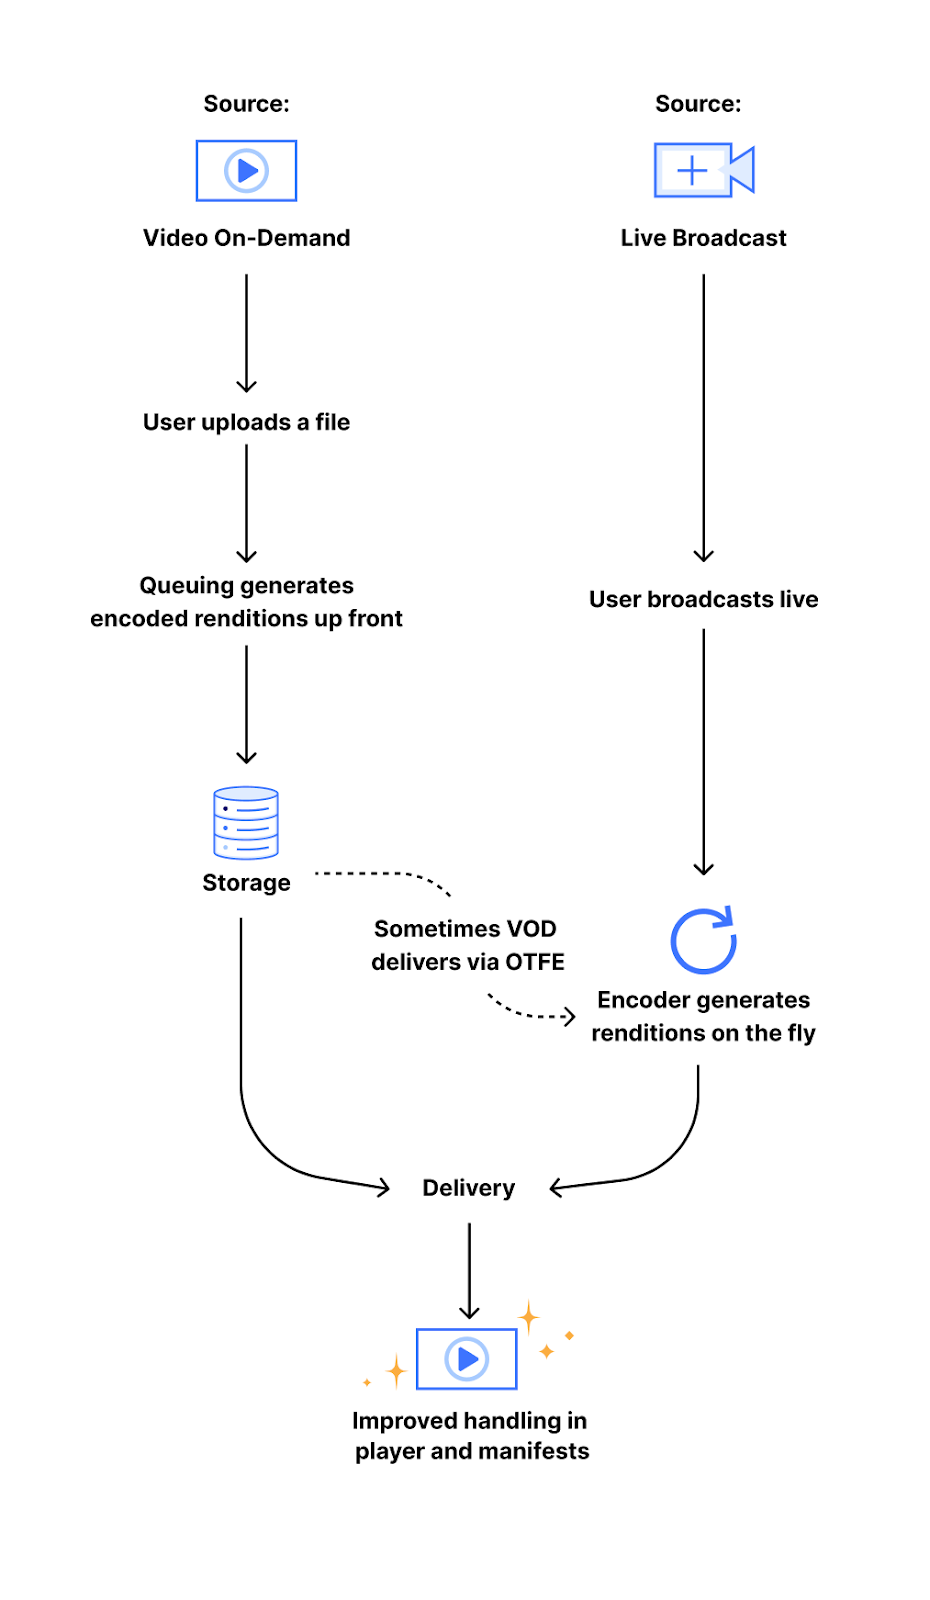
When a video is processed by Stream, it can follow one of two paths. The first is our video-on-demand (VOD) pipeline, which handles videos directly uploaded to Stream. It generates and stores a set of encoded video segments for adaptive bitrate streaming that can be streamed via HLS/DASH. The other path is our on-the-fly-encoding (or OTFE) pipeline, that drives the Stream Live and Media Transformations service. Instead of pre-processing and storing files, OTFE fetches media from a customer’s own website and performs transformations at the edge.
My project involved extending both of these pipelines to support audio extraction.
OTFE pipeline
The OTFE pipeline is designed for real-time operations. The existing flow was engineered for visual tasks. When a customer with Media Transformations enabled makes a request on their own website, it’s routed to our edge servers, which acts as the entry point. The request is then validated, and per the user’s request, OTFE would fetch the video and generate a resized version or a still-frame thumbnail.
In order to support audio-only extraction, I built upon our existing workflow to add a new mode. This involved:
Extending the validation logic: Specifically for audio, a crucial validation step was to verify that the source video contained an audio track before attempting extraction. This was in addition to pre-existing validation steps that ensure the requested URL was correctly formatted.
Building a new transformation handler: This was the core of my project. I built a new handler within the OTFE platform that specifically discarded the visual tracks in order to deliver a high-quality M4A file.
VOD pipeline
Similar to my work on OTFE, this project involved extending our current MP4 downloads workflow to audio-only, M4A downloads. This presented a series of interesting technical decisions.
The typical flow for creating a video download begins with a POST request to our main API layer, which handles authentication and validation, and creates a corresponding database record. Which then enqueues a job in our asynchronous queue where workers perform the processing task. To enable audio downloads for VOD, I introduced new, type-specific API endpoints (POST /downloads/{type}) while preserving the legacy POST /downloads route as an alias for creating downloads of the default, or video, download type. This ensured full backward compatibility.
The core work, of creating a download, is performed by our asynchronous queue. Which included:
Adding logic to the consumer to detect the new audio download type
Pulling the ffmpeg template we define in our API layer to properly encode the audio stream into a high-quality M4A container
By extending each component of this pipeline– from the API routes to the media processing commands– I was able to deliver a new, highly-requested feature that unlocks audio-centric workflows for our customers!
Dash screenshots
We’re excited to announce that this feature is also available in the Stream dashboard. Simply navigate to any of your videos, and you’ll find the option to download the video or just the audio.
Once the download is ready, you will see the URL for the file, along with the option to disable it.
That’s a wrap
This project addressed a long-standing customer need, providing a simpler way to work with audio from video. I’m truly grateful for this entire journey, from understanding the problem to shipping the solution, and especially for the mentorship and guidance I received from my team along the way. We are excited to see how developers use this new capability to build more efficient and exciting applications on Cloudflare Stream.
Cloudflare Workflows is our take on “Durable Execution.” They provide a serverless engine, powered by the Cloudflare Developer Platform, for building long-running, multi-step applications that persist through failures. When Workflows became generally available earlier this year, they allowed developers to orchestrate complex processes that would be difficult or impossible to manage with traditional stateless functions. Workflows handle state, retries, and long waits, allowing you to focus on your business logic.
However, complex orchestrations require robust testing to be reliable. To date, testing Workflows was a black-box process. Although you could test if a Workflow instance reached completion through an await to its status, there was no visibility into the intermediate steps. This made debugging really difficult. Did the payment processing step succeed? Did the confirmation email step receive the correct data? You couldn’t be sure without inspecting external systems or logs.
Why was this necessary?
As developers ourselves, we understand the need to ensure reliable code, and we heard your feedback loud and clear: the developer experience for testing Workflows needed to be better.
The black box nature of testing was one part of the problem. Beyond that, though, the limited testing offered came at a high cost. If you added a workflow to your project, even if you weren’t testing the workflow directly, you were required to disable isolated storage because we couldn’t guarantee isolation between tests. Isolated storage is a vitest-pool-workers feature to guarantee that each test runs in a clean, predictable environment, free from the side effects of other tests. Being forced to have it disabled meant that state could leak between tests, leading to flaky, unpredictable, and hard-to-debug failures.
This created a difficult choice for developers building complex applications. If your project used Workers, Durable Objects, and R2 alongside Workflows, you had to either abandon isolated testing for your entire project or skip testing. This friction resulted in a poor testing experience, which in turn discouraged the adoption of Workflows. Solving this wasn’t just an improvement, it was a critical step in making Workflows part of any well-tested Cloudflare application.
Introducing isolated testing for Workflows
We’re introducing a new set of APIs that enable comprehensive, granular, and isolated testing for your Workflows, all running locally and offline with vitest-pool-workers, our testing framework that supports running tests in the Workers runtime workerd. This enables fast, reliable, and cheap test runs that don’t depend on a network connection.
They are available through the cloudflare:test module, with @cloudflare/vitest-pool-workers version 0.9.0 and above. The new test module provides two primary functions to introspect your Workflows:
introspectWorkflowInstance: useful for unit tests with known instance IDs
introspectWorkflow: useful for integration tests where IDs are typically generated dynamically.
Let’s walk through a practical example.
A practical example: testing a blog moderation workflow
Imagine a simple Workflow for moderating a blog. When a user submits a comment, the Workflow requests a review from workers-ai. Based on the violation score returned, it then waits for a moderator to approve or deny the comment. If approved, it calls a step.do to publish the comment via an external API.
Testing this without our new APIs would be impossible. You’d have no direct way to simulate the step’s outcomes and simulate the moderator’s approval. Now, you can mock everything.
Here’s the test code using introspectWorkflowInstance with a known instance ID:
This test mocks the outcomes of steps that require external API calls, such as the ‘AI content scan’, which calls Workers AI, and the ‘publish comment’ step, which calls an external blog API.
If the instance ID is not known, because you are either making a worker request that starts one/multiple Workflow instances with random generated ids, you can call introspectWorkflow(env.MY_WORKFLOW). Here’s the test code for that scenario, where only one Workflow instance is created:
Notice how in both examples we’re calling the introspectors with await using – this is the Explicit Resource Management syntax from modern JavaScript. It is crucial here because when the introspector objects go out of scope at the end of the test, its disposal method is automatically called. This is how we ensure each test works with its own isolated storage.
The modify and modifyAll functions are the gateway to controlling instances. Inside its callback, you get access to a modifier object with methods to inject behavior such as mocking step outcomes, events and disabling sleeps.
To understand the solution, you first need to understand the local architecture. When you run wrangler dev, your Workflows are powered by Miniflare, a simulator for testing Cloudflare Workers, and workerd. Each running workflow instance is backed by its own SQLite Durable Object, which we call the “Engine DO”. This Engine DO is responsible for executing steps, persisting state, and managing the instance’s lifecycle. It lives inside the local isolated Workers runtime.
Meanwhile, the Vitest test runner is a separate Node.js process living outside of workerd. This is why we have a Vitest custom pool that allows tests to run inside workerd called vitest-pool-workers. Vitest-pool-workers has a Runner Worker, which is a worker to run the tests with bindings to everything specified in the user wrangler.json file. This worker has access to the APIs under the “cloudflare:test” module. It communicates with Node.js through a special DO called Runner Object via WebSocket/RPC.
The first approach we considered was to use the test runner worker. In its current state, Runner worker has access to Workflow bindings from Workflows defined on the wrangler file. We considered also binding each Workflow’s Engine DO namespace to this runner worker. This would give vitest-pool-workers direct access to the Engine DOs where it would be possible to directly call Engine methods.
While promising, this approach would have required undesirable changes to the core of Miniflare and vitest-pool-workers, making it too invasive for this single feature.
Firstly, we would have needed to add a new unsafe field to Miniflare’s Durable Objects. Its sole purpose would be to specify the service name of our Engines, preventing Miniflare from applying its default user prefix which would otherwise prevent the Durable Objects from being found.
Secondly, vitest-pool-workers would have been forced to bind every Engine DO from the Workflows in the project to its runner, even those not being tested. This would introduce unwanted bindings into the test environment, requiring an additional cleanup to ensure they were not exposed to the user’s tests env.
The breakthrough
The solution is a combination of privileged local-only APIs and Remote Procedure Calls (RPC).
First, we added a set of unsafe functions to the local implementation of the Workflows binding, functions that are not available in the production environment. They act as a controlled access point, accessible from the test environment, allowing the test runner to get a stub to a specific Engine DO by providing its instance ID.
Once the test runner has this stub, it uses RPC to call specific, trusted methods on the Engine DO via a special RpcTarget called WorkflowInstanceModifier. Any class that extends RpcTarget has its objects replaced by a stub. Calling a method on this stub, in turn, makes an RPC back to the original object.
This simpler approach is far less invasive because it’s confined to the Workflows environment, which also ensures any future feature changes are safely isolated.
Introspecting Workflows with unknown IDs
When creating Workflows instances (either by create() or createBatch()) developers can provide a specific ID or have it automatically generated for them. This ID identifies the Workflow instance and is then used to create the associated Engine DO ID.
The logical starting point for implementation was introspectWorkflowInstance(binding, instanceID), as the instance ID is known in advance. This allows us to generate the Engine DO ID required to identify the engine associated with that Workflow instance.
But often, one part of your application (like an HTTP endpoint) will create a Workflow instance with a randomly generated ID. How can we introspect an instance when we don’t know its ID until after it’s created?
The answer was to use a powerful feature of JavaScript: Proxy objects.
When you use introspectWorkflow(binding), we wrap the Workflow binding in a Proxy. This proxy non-destructively intercepts all calls to the binding, specifically looking for .create() and .createBatch(). When your test triggers a workflow creation, the proxy inspects the call. It captures the instance ID — either one you provided or the random one generated — and immediately sets up the introspection on that ID, applying all the modifications you defined in the modifyAll call. The original creation call then proceeds as normal.
env[workflow] = new Proxy(env[workflow], {
  get(target, prop) {
    if (prop === "create") {
      return new Proxy(target.create, {
        async apply(_fn, _this, [opts = {}]) {

          // 1. Ensure an ID exists
          const optsWithId = "id" in opts ? opts : { id: crypto.randomUUID(), ...opts };

          // 2. Apply test modifications before creation
          await introspectAndModifyInstance(optsWithId.id);

          // 3. Call the original 'create' method
          return target.create(optsWithId);
        },
      });
    }

    // Same logic for createBatch()
  }
}
When the await using block from introspectWorkflow() finishes, or the dispose() method is called at the end of the test, the introspector is disposed of, and the proxy is removed, leaving the binding in its original state. It’s a low-impact approach that prioritizes developer experience and long-term maintainability.
Get started with testing Workflows
Ready to add tests to your Workflows? Here’s how to get started:
Update your dependencies: Make sure you are using @cloudflare/vitest-pool-workers version 0.9.0 or newer. Run the following command in your project: npm install @cloudflare/vitest-pool-workers@latest
Start writing tests: Import introspectWorkflowInstance or introspectWorkflow from cloudflare:test in your test files and use the patterns shown in this post to mock, control, and assert on your Workflow’s behavior. Also check out the official API reference.
Cloudflare launched 15 years ago this week. We like to celebrate our birthday by announcing new products and features that give back to the Internet, which we’ll do a lot of this week. But, on this occasion, we’ve also been thinking about what’s changed on the Internet over the last 15 years and what has not.
With some things there’s been clear progress: when we launched in 2010 less than 10 percent of the Internet was encrypted, today well over 95 percent is encrypted. We’re proud of the role we played in making that happen.
Some other areas have seen limited progress: IPv6 adoption has grown steadily but painfully slowly over the last 15 years, in spiteofourefforts. That’s a problem because as IPv4 addresses have become scarce and expensive it’s held back new entrants and driven up the costs of things like networking and cloud computing.
The Internet’s Business Model
Still other things have remained remarkably consistent: the basic business model of the Internet has for the last 15 years been the same — create compelling content, find a way to be discovered, and then generate value from the resulting traffic. Whether that was through ads or subscriptions or selling things or just the ego of knowing that someone is consuming what you created, traffic generation has been the engine that powered the Internet we know today.
Make no mistake, the Internet has never been free. There’s always been a reward system that transferred value from consumers to creators and, in doing so, filled the Internet with content. Had the Internet not had that reward system it wouldn’t be nearly as vibrant as it is today.
A bit of a trivia aside: why did Cloudflare never build an ad blocker despite many requests? Because, as imperfect as they are, ads have been the only micropayment system that has worked at scale to encourage an open Internet while also compensating content creators for their work. Our mission is to help build a better Internet, and a core value is that we’re principled, so we weren’t going to hamper the Internet’s fundamental business model.
Traffic ≠ Value
But that same traffic-based reward system has also created many of the problems we lament about the current state of the Internet. Traffic has always been an imperfect proxy for value. Over the last 15 years we’ve watched more of the Internet driven by annoying clickbait or dangerous ragebait. Entire media organizations have built their businesses with a stated objective of writing headlines to generate the maximum cortisol response because that’s what generates the maximum amount of traffic.
Over the years, Cloudflare has at times faced calls for us to intervene and control what content can be published online. As an infrastructure provider, we’ve never felt we were the right place for those editorial decisions to be made. But it wasn’t because we didn’t worry about the direction the traffic-incentivized Internet seemed to be headed. It always seemed like what fundamentally needed to change was not more content moderation at the infrastructure level but instead a healthier incentive system for content creation.
Today the conditions to bring about that change may be happening. In the last year, something core to the Internet we’ve all known has changed. It’s being driven by AI and it has an opportunity with some care and nurturing to help bring about what we think may be a much better Internet.
From Search to Answers
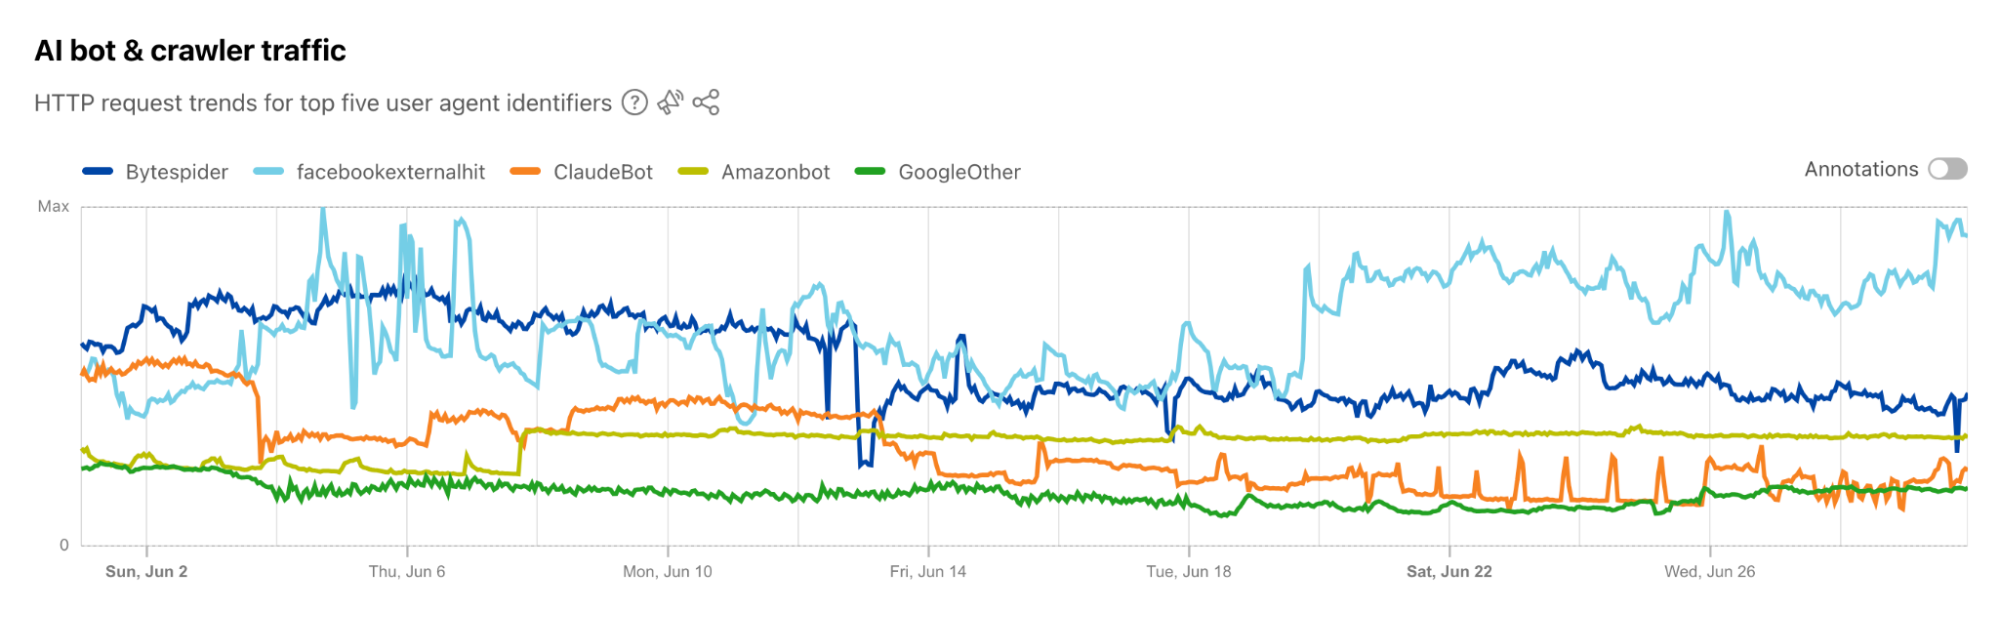
What’s the change? The primary discovery system of the Internet for the last 15 years has been Search Engines. They scraped the Internet’s content, built an index, and then presented users with a treasure map which they followed generating traffic. Content creators were happy to let Search Engines scrape their content because there were a limited number of them, so the infrastructure costs were relatively low and, more importantly, because the Search Engines gave something to sites in the form of traffic — the Internet’s historic currency — sent back to sites.
It’s already clear that the Internet’s discovery system for the next 15 years will be something different: Answer Engines. Unlike Search Engines which gave you a map where you hunted for what you were looking for, driving traffic in the process, Answer Engines just give you the answer without you having to click on anything. For 95 percent of users 95 percent of the time, that is a better user experience.
You don’t have to look far to see this is changing rapidly before our eyes. ChatGPT, Anthropic’s Claude, and other AI startups aren’t Search Engines — they’re Answer Engines. Even Google, the search stalwart, is increasingly serving “AI Overviews” in place of 10 blue links. We can often look to sci-fi movies to have a glimpse into our most likely future. In them, the helpful intelligent robot character didn’t answer questions with: “Here are some links you can click on to maybe find what you’re looking for.” Whether you like it or not, the future will increasingly be answers not searches.
Short Term Pain
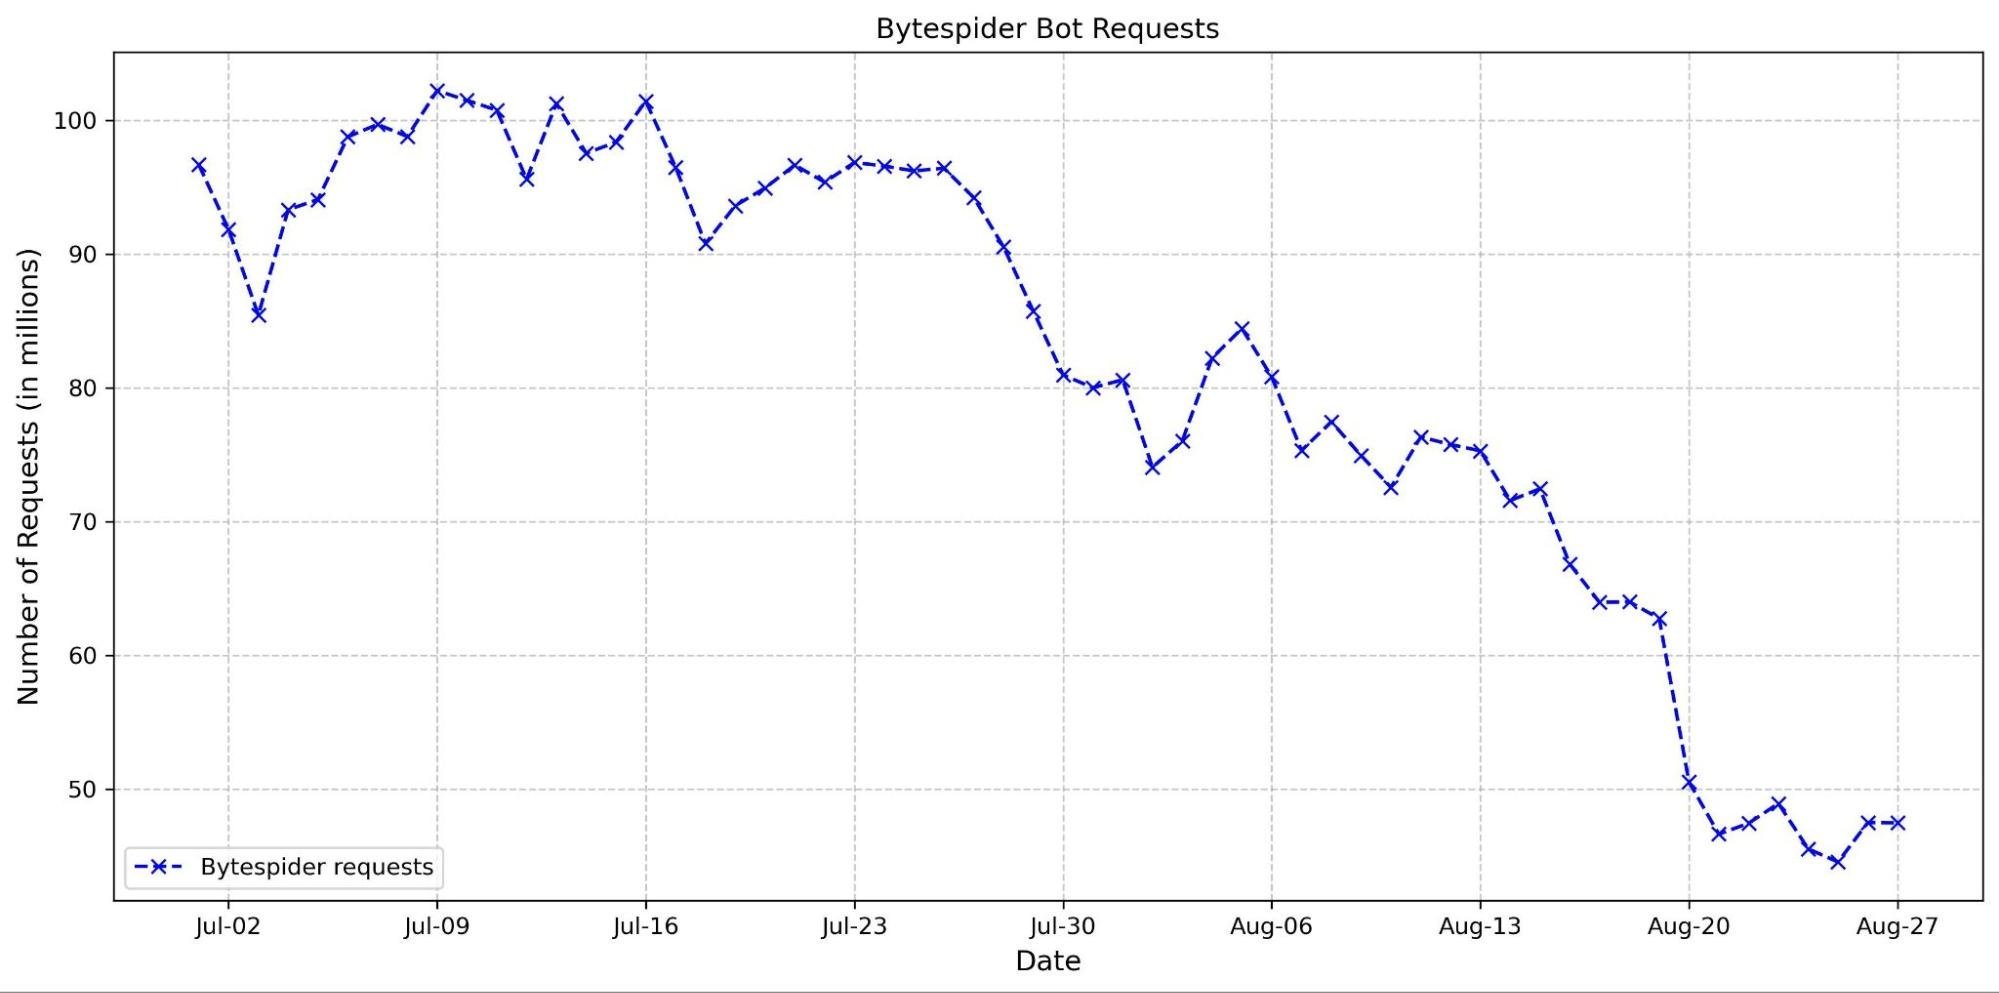
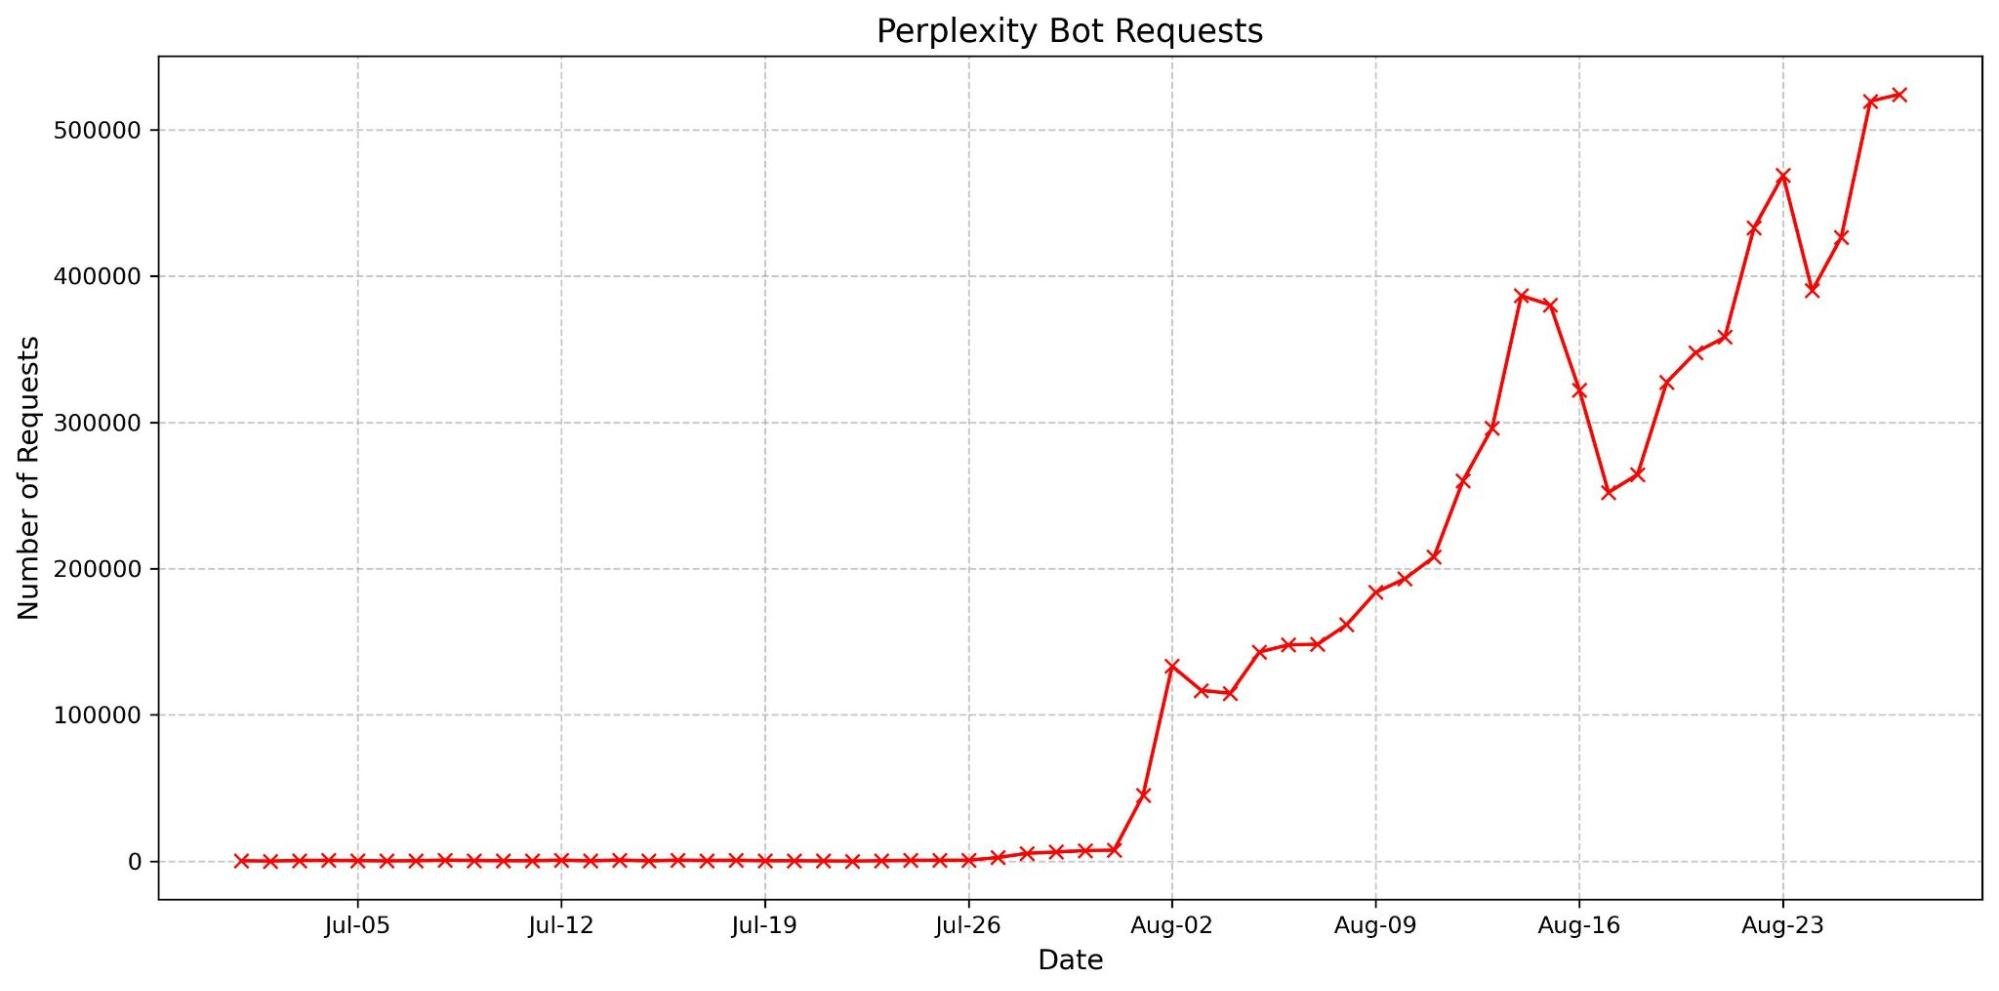
In the short term, this is going to be extremely painful for some industries that are built based on monetizing traffic. It already is. While ecommerce and social applications haven’t yet seen a significant drop in traffic as the world switches to Answer Engines, media companies have. Why the difference? Well, for the former, you still need to buy the thing the Answer Engine recommends and, for now, we still value talking with other humans.
But for media companies, if the Answer Engine gives you the summary of what you’re looking for in most cases you don’t need to read the story. And the loss of traffic for media companies has already been dramatic. It’s not just traditional media. Research groups at investment banks, industry analysts, major consulting firms — they’re all seeing major drops in people finding their content because we are increasingly getting answers not search treasure maps.
Some say these answer engines or agents are just acting on behalf of humans. Sure but so what? Without a change they will still kill content creators’ businesses. If you ask your agent to summarize twenty different news sources but never actually visit any of them you’re still undermining the business model of those news sources. Agents don’t click on ads. And if those agents are allowed to aggregate information on behalf of multiple users it’s an even bigger problem because then subscription revenue is eliminated as well. Why subscribe to the Wall Street Journal or New York Times or Financial Times or Washington Post if my agent can free ride off some other user who does?
Unless you believe that content creators should work for free, or that they are somehow not needed anymore — both of which are naive assumptions — something needs to change. A visit from an agent isn’t the same as a visit from a human and therefore should have different rules of the road. If nothing changes, the drop in human traffic to the media ecosystem writ large will kill the business model that has built the content-rich Internet we enjoy today.
We think that’s an existential threat to one of humanity’s most important creations: the Internet.
Rewarding Better Content
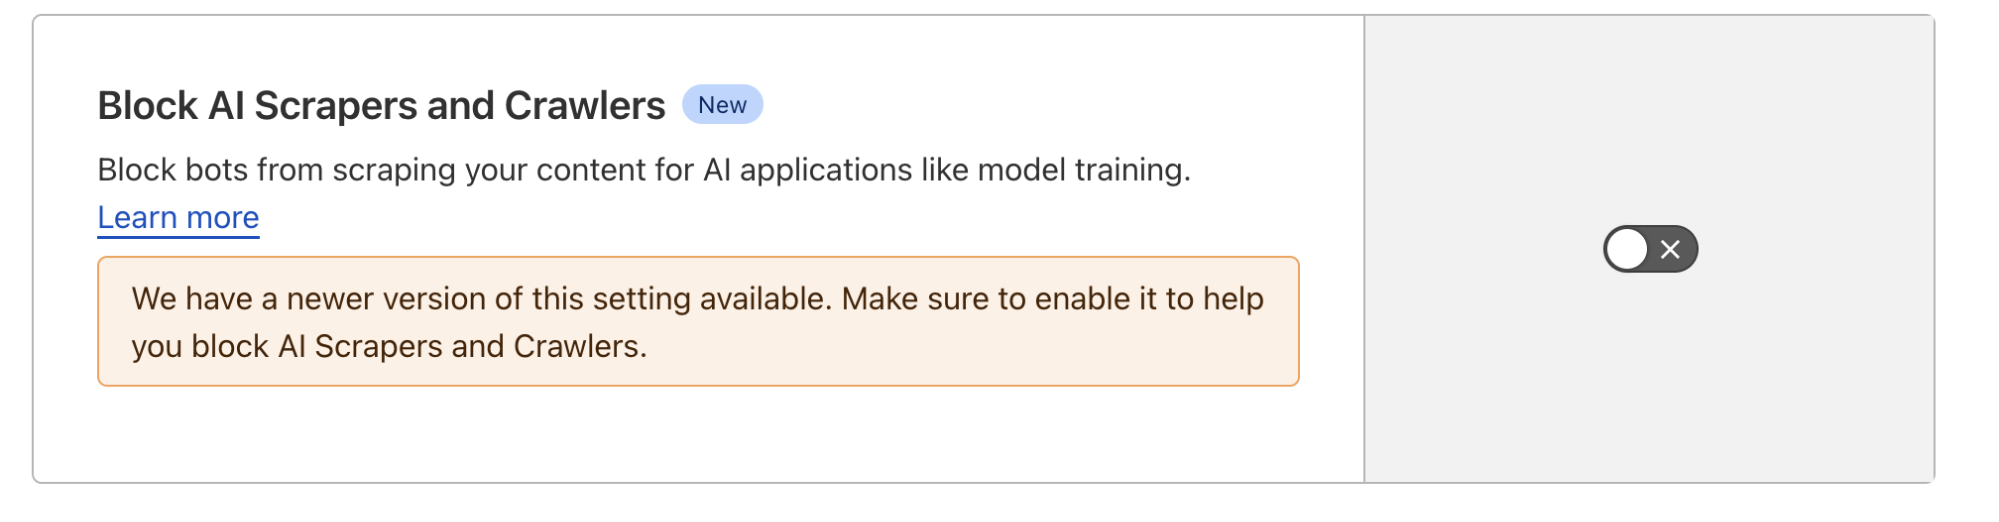
But there’s reason for optimism. Content is the fuel that powers every AI system and the companies that run those AI systems know ultimately they need to financially support the ecosystem. Because of that it seems potentially we’re on the cusp of a new, better, and maybe healthier Internet business model. As content creators use tools like the ones provided by Cloudflare to restrict AI robots from taking their content without compensation, we’re already seeing a market emerge and better deals being struck between AI and content companies.
What’s most interesting is what content companies are getting the best deals. It’s not the ragebait headline writers. It’s not the news organizations writing yet another take on what’s going on in politics. It’s not the spammy content farms full of drivel. Instead, it’s Reddit and other quirky corners that best remind us of the Internet of old. For those of you old enough, think back to the Internet not of the last 15 years but of the last 35. We’ve lost some of what made that early Internet great, but there are indications that we might finally have the incentives to bring more of it back.
It seems increasingly likely that in our future, AI-driven Internet — assuming the AI companies are willing to step up, support the ecosystem, and pay for the content that is the most valuable to them — it’s the creative, local, unique, original content that’ll be worth the most. And, if you’re like us, the thing you as an Internet consumer are craving more of is creative, local, unique, original content. And, it turns out, having talked with many of them, that’s the content that content creators are most excited to create.
A New Internet Business Model
So how will the business model work? Well, for the first time in history, we have a pretty good mathematical representation of human knowledge. Sum up all the LLMs and that’s what you get. It’s not perfect, but it’s pretty good. Inherently, the same mathematical model serves as a map for the gaps in human knowledge. Like a block of Swiss Cheese — there’s a lot of cheese, but there’s also a lot of holes.
Imagine a future business model of the Internet that doesn’t reward traffic-generating ragebait but instead rewards those content creators that help fill in the holes in our collective metaphorical cheese. That will involve some portion of the subscription fees AI companies collect, and some portion of the revenue from the ads they’ll inevitably serve, going back to content creators who most enrich the collective knowledge.
As a rough and simplistic sketch, think of it as some number of dollars per AI company’s monthly active users going into a collective pool to be distributed out to content creators based on what most fills in the holes in the cheese.
You could imagine an AI company suggesting back to creators that they need more created about topics they may not have enough content about. Say, for example, the carrying capacity of unladened swallows because they know their subscribers of a certain age and proclivity are always looking for answers about that topic. The very pruning algorithms the AI companies use today form a roadmap for what content is worth enough to not be pruned but paid for.
While today the budget items that differentiate AI companies are how much they can afford to spend on GPUs and top talent, as those things inevitably become more and more commodities it seems likely what will differentiate the different AIs is their access to creative, local, unique, original content. And the math of their algorithms provides them a map of what’s worth the most. While there are a lot of details to work out, those are the ingredients you need for a healthy market.
Cloudflare’s Role
As we think about our role at Cloudflare in this developing market, it’s not about protecting the status quo but instead helping catalyze a better business model for the future of Internet content creation. That means creating a level playing field. Ideally there should be lots of AI companies, large and small, and lots of content creators, large and small.
It can’t be that a new entrant AI company is at a disadvantage to a legacy search engine because one has to pay for content but the other gets it for free. But it’s also critical to realize that the right solution to that current conundrum isn’t that no one pays, it’s that, new or old, everyone who benefits from the ecosystem should contribute back to it based on their relative size.
It may seem impossibly idealistic today, but the good news is that based on the conversations we’ve had we’re confident if a few market participants tip — whether because they step up and do the right thing or are compelled — we will see the entire market tipping and becoming robust very quickly.
Supporting the Ecosystem
We can’t do this alone and we have no plans to try to. Our mission is not to “build a better Internet” but to “help build a better Internet.” The solutions developed to facilitate this market need to be open, collaborative, standardized, and shared across many organizations. We’ll take some encouraging steps in that direction with announcements on partnerships and collaborations this week. And we’re proud to be a leader in this space.
The Internet is an ecosystem and we, other infrastructure providers, along with most importantly both AI companies and content creators, will be critical in ensuring that ecosystem is healthy. We’re excited to partner with those who are ready to step up and do their part to also help build a better Internet. It is possible.
And we’re optimistic that if others can collaborate in supporting the ecosystem we may be at the cusp of a new golden age of the Internet. Our conversations with the leading AI companies nearly all acknowledge that they have a responsibility to give back to the ecosystem and compensate content creators. Confirming this, the largest publishers are reporting they’re having much more constructive conversations about licensing their content to those AI companies. And, this week, we’ll be announcing new tools to help even the smallest publishers take back control of who can use what they’ve created.
It may seem impossible. We think it’s a no-brainer. We’re proud of what Cloudflare has accomplished over the last 15 years, but there’s a lot left to do to live up to our mission. So, more than ever, it’s clear: giddy up, because we’re just getting started!
At Cloudflare, we have a simple but audacious goal: to help build a better Internet. That mission has driven us to build one of the world’s largest networks, to stand up for content providers, and to innovate relentlessly to make the Internet safer, faster, and more reliable for everyone, everywhere.
Building world-class products is only part of the battle, however. Fulfilling our mission means making these products accessible, including a pricing model that is fair, predictable, and aligned with the value we provide. If our packaging is confusing, or if our pricing penalizes you for using the service, then we’re not living up to our mission. And the best way to ensure that alignment?
Listen to our customers.
Over the years, your feedback has shaped our product roadmap, helping us evolve to offer nearly 100 products across four solution areas — Application Services, Network Services, Zero Trust Services, and our Developer Platform — on a single, unified platform and network infrastructure. Recently, we’ve heard a new theme emerge: the need for simplicity. You’ve asked us, “A hundred products is a lot. Can you please be more prescriptive?” and “Can you make your pricing more straightforward?”
We heard that feedback loud and clear. That’s why we are incredibly excited to introduce Externa and Interna,two new families of use-case bundles designed to simplify your journey with Cloudflare.
Two challenges, two solutions
When we speak with CIOs, CTOs, and CISOs, their challenges almost always boil down to connecting and protecting two fundamental domains: (1) their external, public-facing infrastructure and (2) their internal, private systems.
Historically, the industry has sold dozens of point products to solve these problems with a series of band-aids. A WAF from one vendor, a DDoS scrubber from another, a VPN from a third. The result is a mess of complexity, vendor lock-in, and a security posture riddled with gaps. It’s expensive, inefficient, and insecure.
We think that’s backwards. There’s a simpler, more integrated approach with our new solution packages:
Externa to connect and protect the part of your business facing the public Internet — the websites, APIs, applications, and networks that are the front doors and face of your business
Interna to connect and protect your internal private systems and resources — the employees, devices, data, and networks that are at the heart of your organization
These packages represent our prescriptive view on what a modern connectivity and security architecture should look like. And, they’re best when used together.
Externa: Connect and protect external, public-facing systems
With Externa, we’re solving for the complexity of connecting and protecting your public-facing infrastructure. A key principle here is fairness. We’ve seen competitors send customers astronomical bills after a DDoS attack because they charge for all traffic — clean or malicious. It’s like a fire department charging you for the water they use to save your house. We don’t do that and never have, which is why with Externa, you only pay for legitimate traffic.
We believe a simple, integrated model will reduce total cost of ownership and lead to a stronger security posture. A patchwork of band-aids is a lot of overhead to manage. Externa bundles our WAF, DDoS, API security, networking, application performance services, and more, into a simple package with units of measure that scale with value.
What does this mean for you?
No attack traffic tax: your costs remain predictable, even during a massive DDoS attack.
Simple, value-driven price units: no origin fetch fees, duplicate charges per request, or paying per rule.
And because security shouldn’t stop at your perimeter, every Externa package includes 50 seats of Interna, our SASE solution package.
Interna: Connect and protect internal, private systems
With Interna, we’re fixing the broken economics of networking and security. The old models were built for a world where everyone came into an office. The world has changed: in today’s hybrid work environment, your internal network isn’t just confined to your offices and data centers anymore. It’s wherever your employees and data are. But many vendors still effectively charge you twice for the same user — once for the seat and again when they’re using the office network.
We believe you should never pay for user bandwidth. Our model recognizes that a user is a user, wherever they are; we don’t double-charge for bandwidth; we actually subtract the traffic that’s generated from user device clients from your WAN meter. We’ve gone a step further: every Interna user license contributes to a shared bandwidth pool that you can use to build a modern, secure, and fast corporate WAN. With Interna, the budget you already have for security now builds your corporate network, too.
What does this mean for you?
Never pay for user bandwidth: a single per-seat price covers your users wherever they work, reducing your WAN bill and eliminating the hybrid work penalty.
Each license expands your WAN: pooled bandwidth from user licenses helps you replace expensive, dedicated WAN contracts.
All-inclusive security: premium features like Digital Experience Monitoring (DEM) and both in-line and API-based Cloud Access Security Broker (CASB) are included, not expensive add-ons.
The unifying Cloudflare advantage
Our unique advantage has always been our network. Serving millions of customers — from individual developers on our Free plan to the world’s largest enterprises — on one platform and one global network gives us incredible leverage. It’s what allows us to offer robust free services and protect journalists and nonprofits. It’s also what makes our platform structurally better: our AI models are trained on data from 20% of the web, providing more effective threat detection than siloed platforms ever could.
We believe that the same structural advantage should help businesses of all sizes scale without compromise. As companies grow, they often face a difficult choice: does the patchwork of point products they started with become too complex to manage, or does the integrated platform they chose become too limited? You asked for a more prescriptive path, one that solves this false choice.
With our new Externa and Interna bundles, that trade-off is over. The Essentials, Advantage, and Premier tiers in each family are designed to provide a clear path for businesses of all sizes, allowing you to adopt stage-appropriate networking and security solutions that scale seamlessly. As your business grows, you move up the tiers from Essentials to Advantage to Premier, gaining access to more advanced features along the way. It’s growth, simplified.
Ready for the next steps towards simplified security and connectivity?
We’ve aimed to deliver pricing and packaging that is fair, accessible, predictable, and scales with value. This is what it means to align our pricing and packaging with our principles. It’s another step toward a better Internet.
We are thrilled to announce the General Availability of Cloudflare Log Explorer, a powerful new product designed to bring observability and forensics capabilities directly into your Cloudflare dashboard. Built on the foundation of Cloudflare’s vast global network, Log Explorer leverages the unique position of our platform to provide a comprehensive and contextualized view of your environment.
Security teams and developers use Cloudflare to detect and mitigate threats in real-time and to optimize application performance. Over the years, users have asked for additional telemetry with full context to investigate security incidents or troubleshoot application performance issues without having to forward data to third party log analytics and Security Information and Event Management (SIEM) tools. Besides avoidable costs, forwarding data externally comes with other drawbacks such as: complex setups, delayed access to crucial data, and a frustrating lack of context that complicates quick mitigation.
Log Explorer has been previewed by several hundred customers over the last year, and they attest to its benefits:
“Having WAF logs (firewall events) instantly available in Log Explorer with full context — no waiting, no external tools — has completely changed how we manage our firewall rules. I can spot an issue, adjust the rule with a single click, and immediately see the effect. It’s made tuning for false positives faster, cheaper, and far more effective.”
“While we use Logpush to ingest Cloudflare logs into our SIEM, when our development team needs to analyze logs, it can be more effective to utilize Log Explorer. SIEMs make it difficult for development teams to write their own queries and manipulate the console to see the logs they need. Cloudflare’s Log Explorer, on the other hand, makes it much easier for dev teams to look at logs and directly search for the information they need.”
With Log Explorer, customers have access to Cloudflare logs with all the context available within the Cloudflare platform. Compared to external tools, customers benefit from:
Reduced cost and complexity: Drastically reduce the expense and operational overhead associated with forwarding, storing, and analyzing terabytes of log data in external tools.
Faster detection and triage: Access Cloudflare-native logs directly, eliminating cumbersome data pipelines and the ingest lags that delay critical security insights.
Accelerated investigations with full context: Investigate incidents with Cloudflare’s unparalleled contextual data, accelerating your analysis and understanding of “What exactly happened?” and “How did it happen?”
Minimal recovery time: Seamlessly transition from investigation to action with direct mitigation capabilities via the Cloudflare platform.
Log Explorer is available as an add-on product for customers on our self serve or Enterprise plans. Read on to learn how each of the capabilities of Log Explorer can help you detect and diagnose issues more quickly.
Monitor security and performance issues with custom dashboards
Custom dashboards allow you to define the specific metrics you need in order to monitor unusual or unexpected activity in your environment.
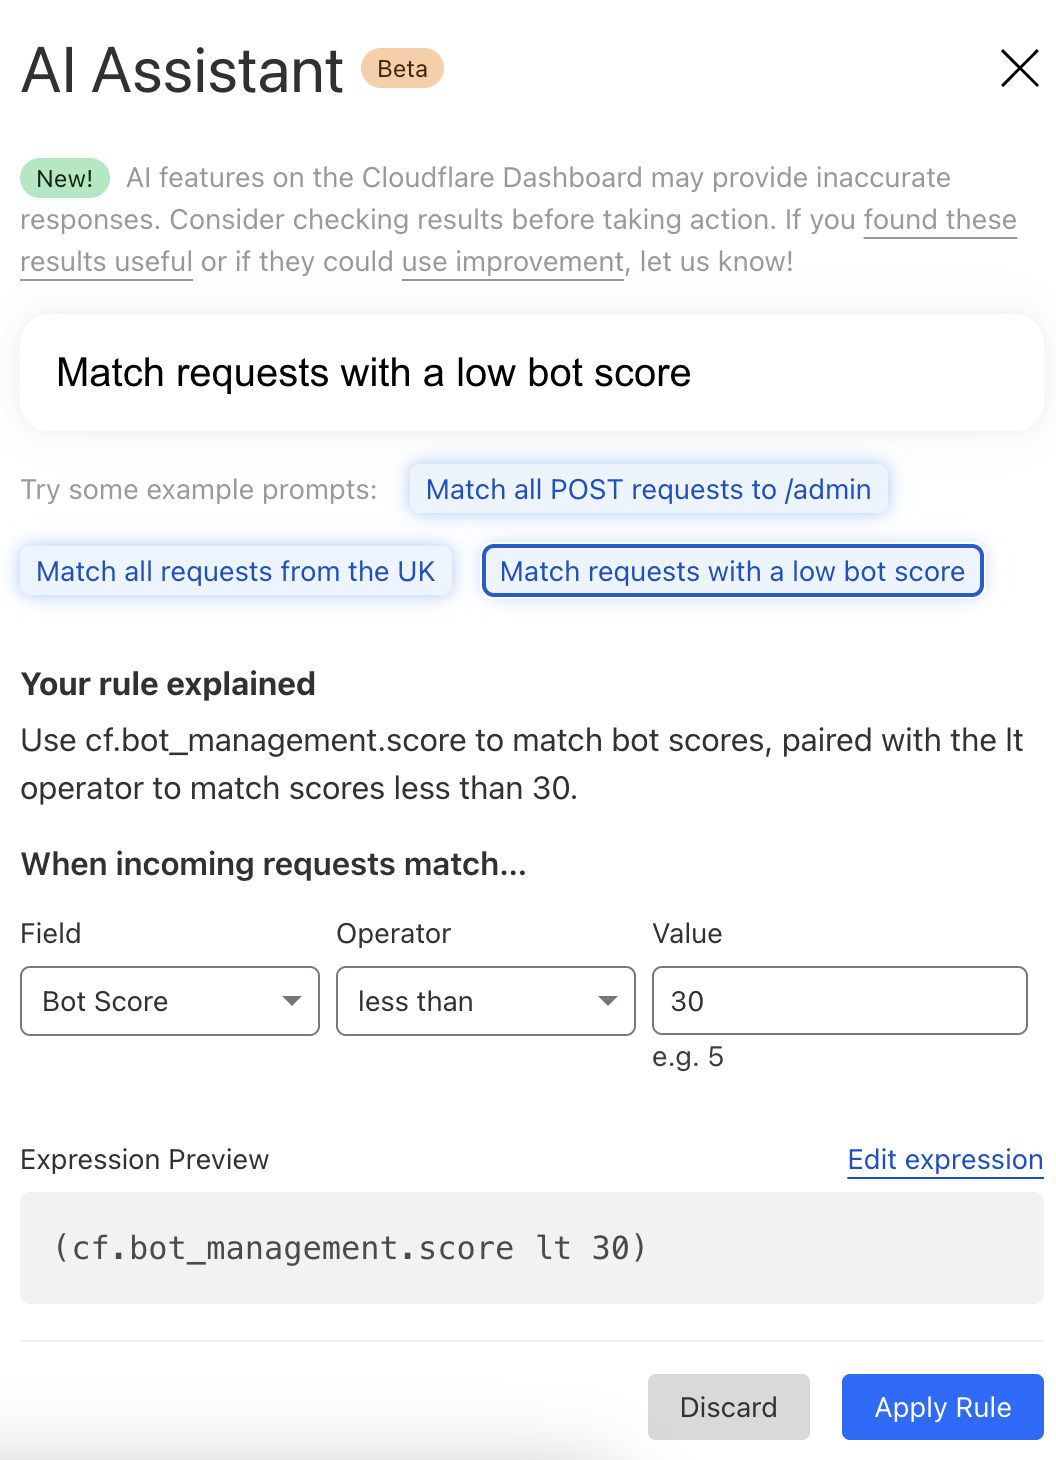
Getting started is easy, with the ability to create a chart using natural language. A natural language interface is integrated into the chart create/edit experience, enabling you to describe in your own words the chart you want to create. Similar to the AI Assistant we announced during Security Week 2024, the prompt translates your language to the appropriate chart configuration, which can then be added to a new or existing custom dashboard.
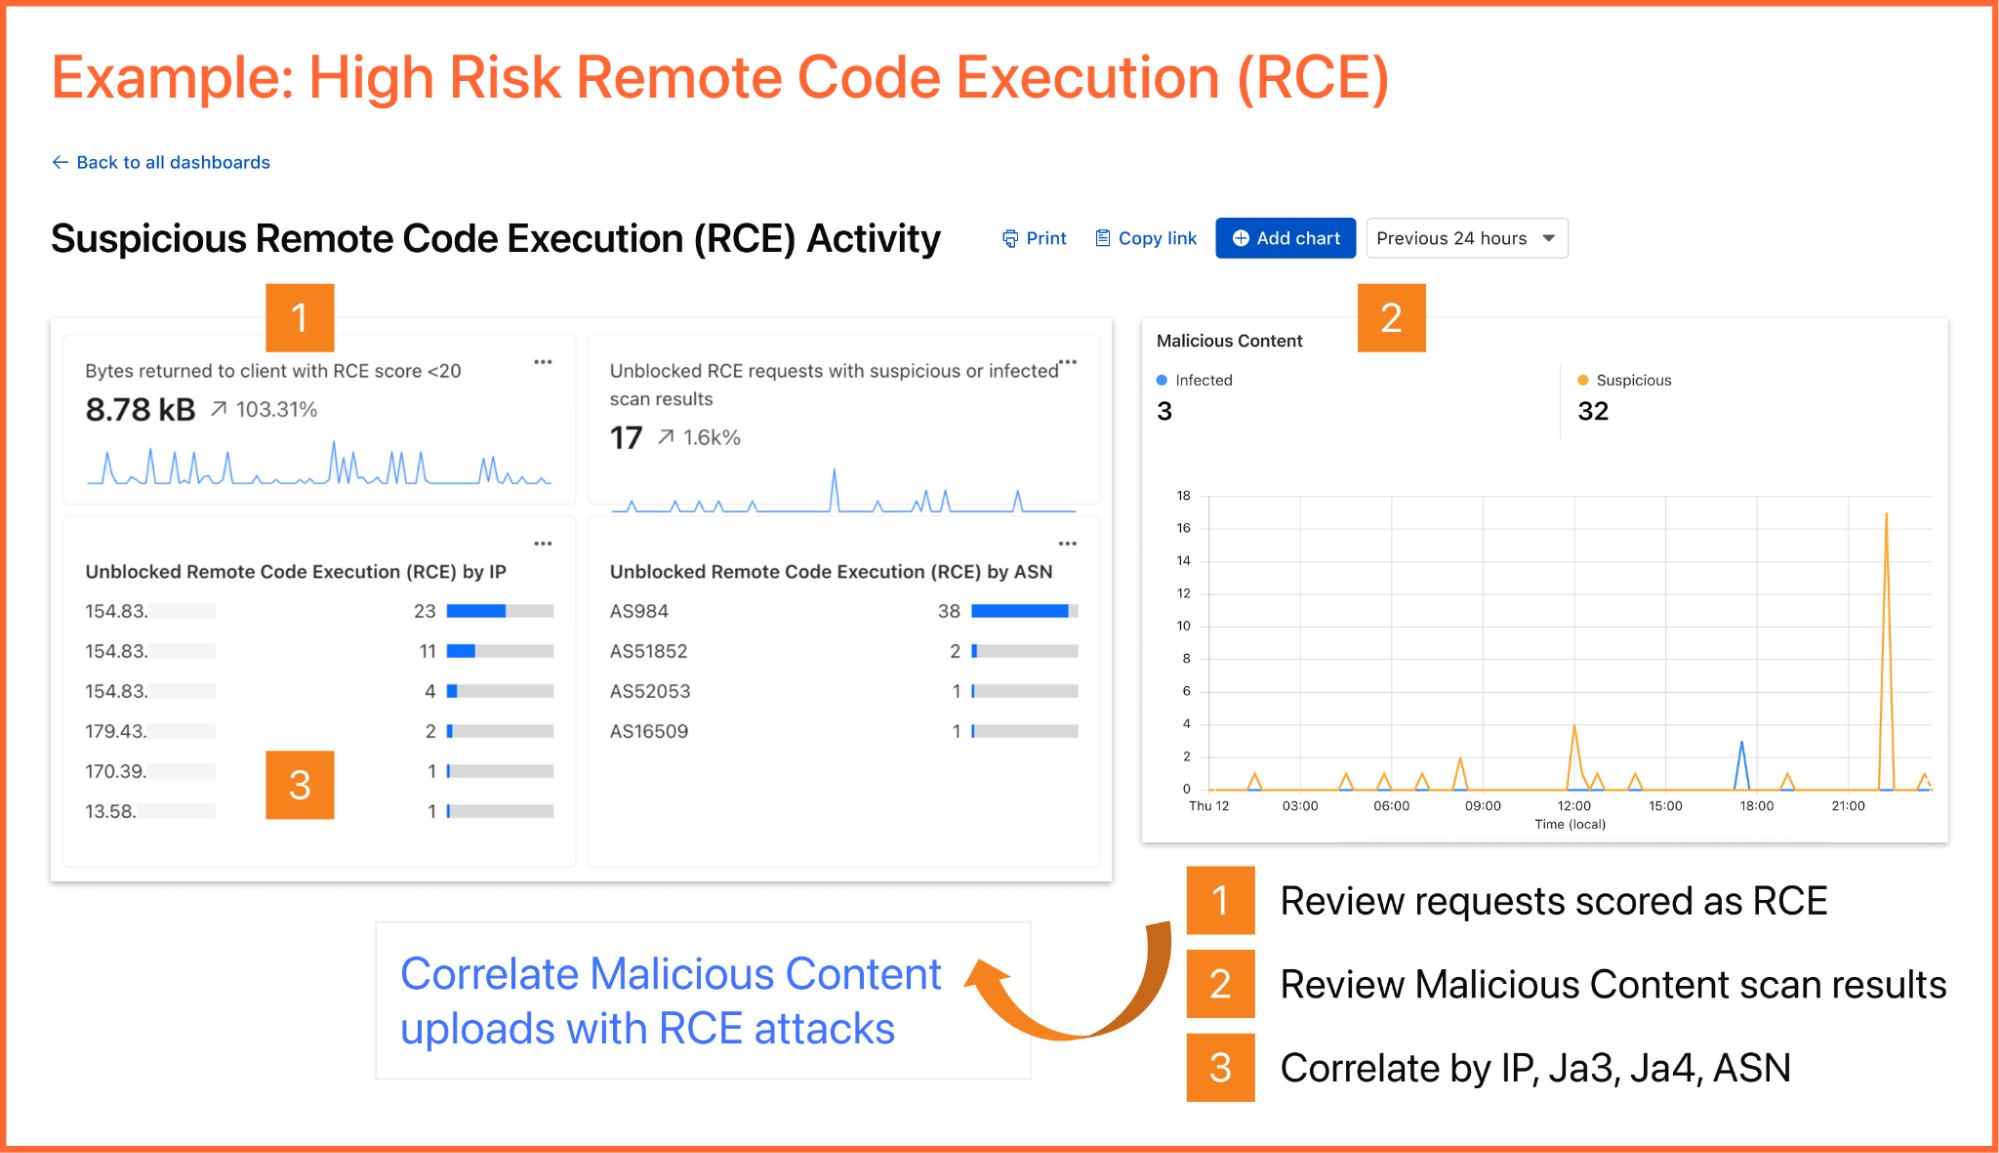
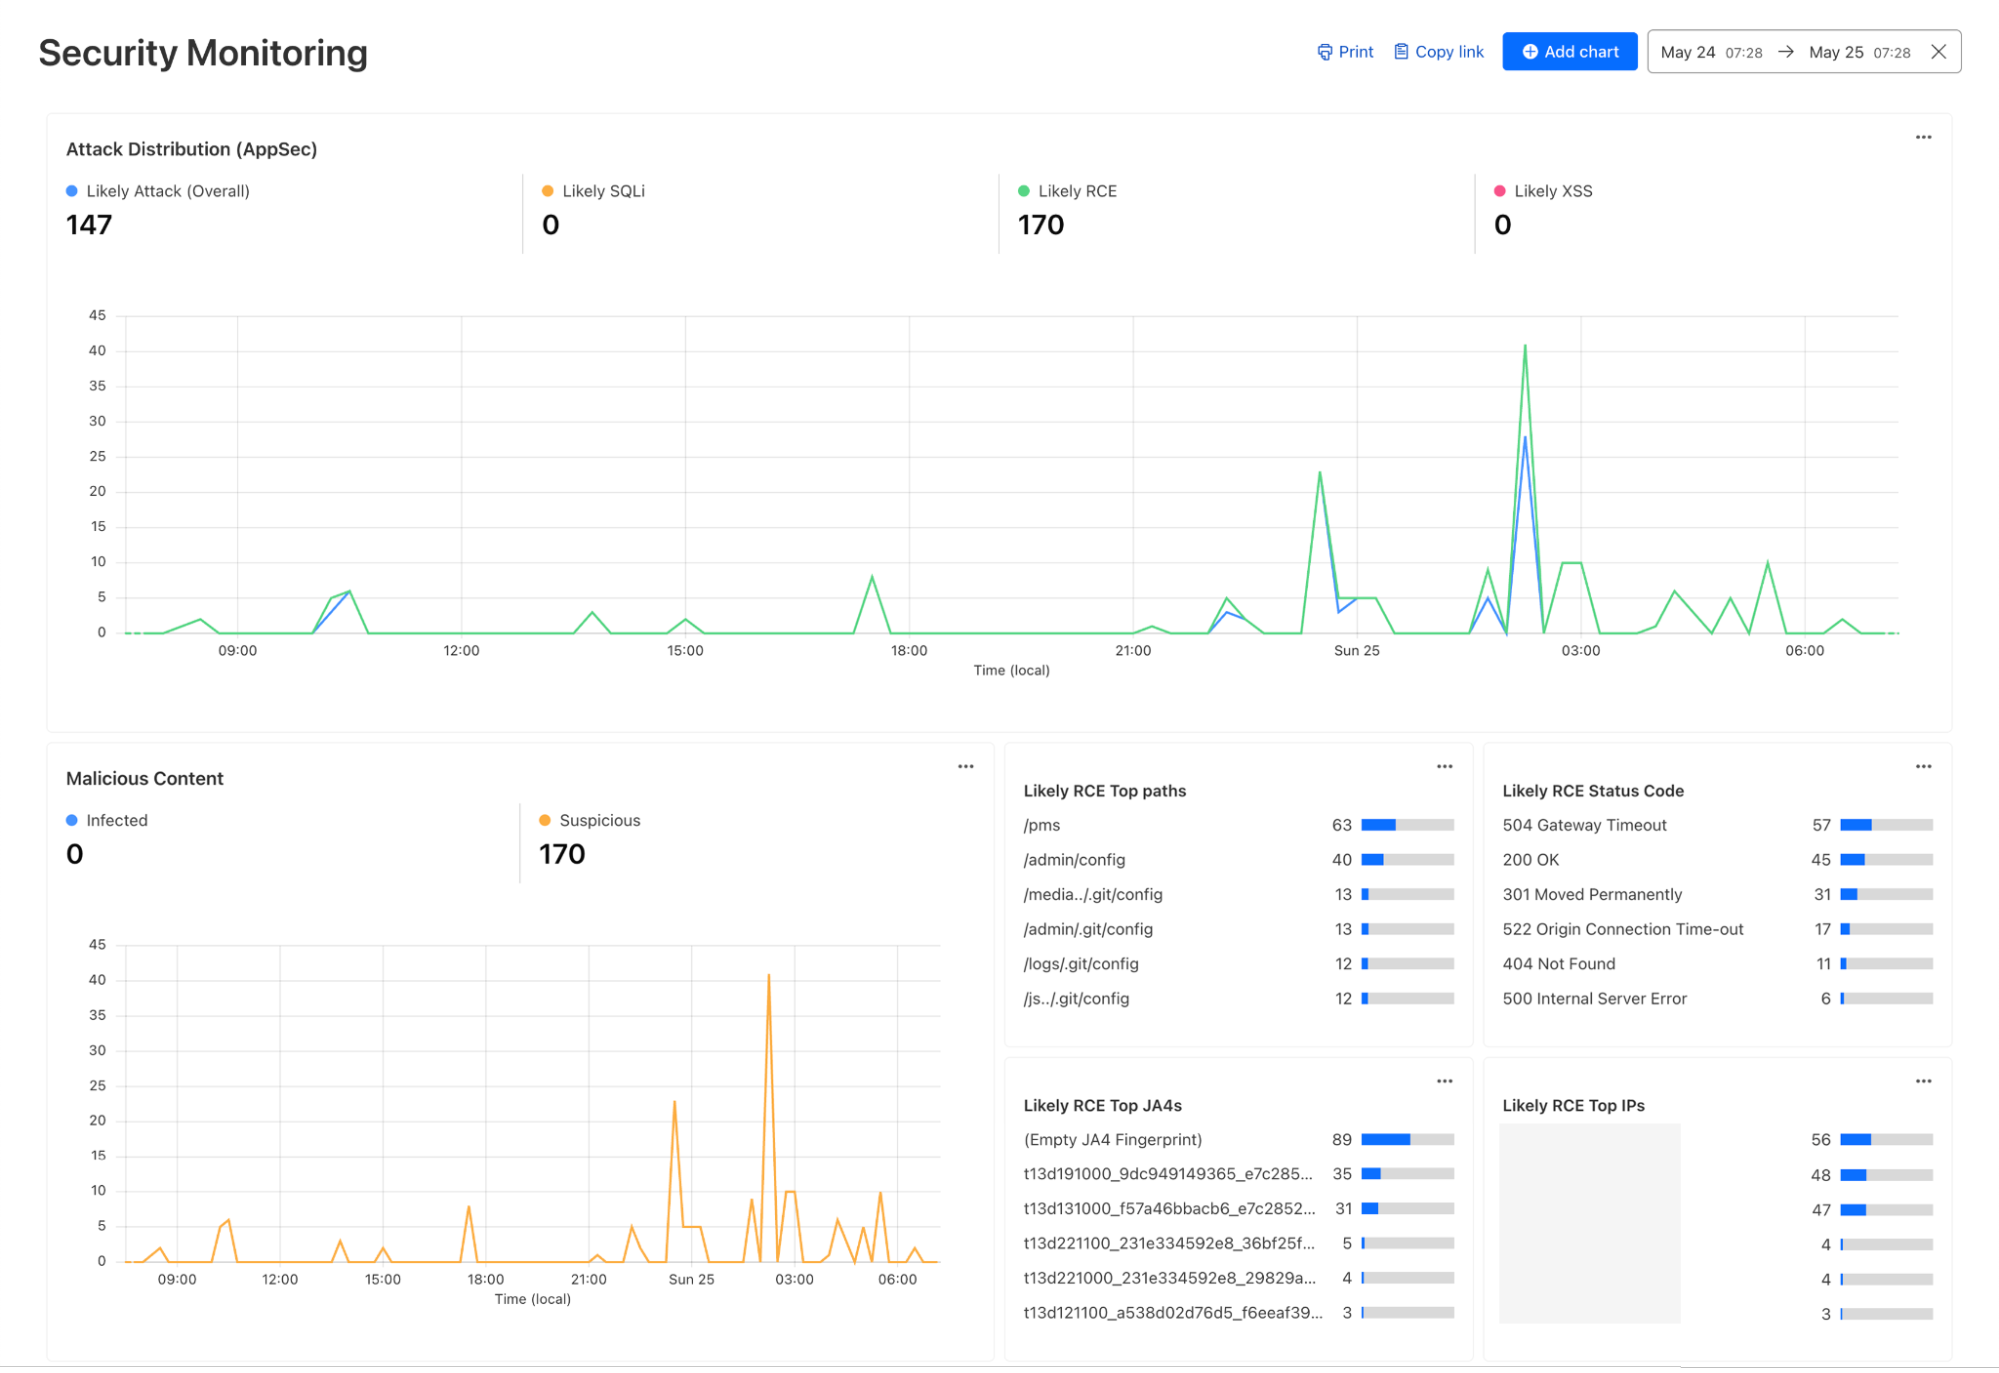
As an example, you can create a dashboard for monitoring for the presence of Remote Code Execution (RCE) attacks happening in your environment. An RCE attack is where an attacker is able to compromise a machine in your environment and execute commands. The good news is that RCE is a detection available in Cloudflare WAF. In the dashboard example below, you can not only watch for RCE attacks, but also correlate them with other security events such as malicious content uploads, source IP addresses, and JA3/JA4 fingerprints. Such a scenario could mean one or more machines in your environment are compromised and being used to spread malware — surely, a very high risk incident!
A reliability engineer might want to create a dashboard for monitoring errors. They could use the natural language prompt to enter a query like “Compare HTTP status code ranges over time.” The AI model then decides the most appropriate visualization and constructs their chart configuration.
While you can create custom dashboards from scratch, you could also use an expert-curated dashboard template to jumpstart your security and performance monitoring.
Available templates include:
Bot monitoring: Identify automated traffic accessing your website
API Security: Monitor the data transfer and exceptions of API endpoints within your application
API Performance: See timing data for API endpoints in your application, along with error rates
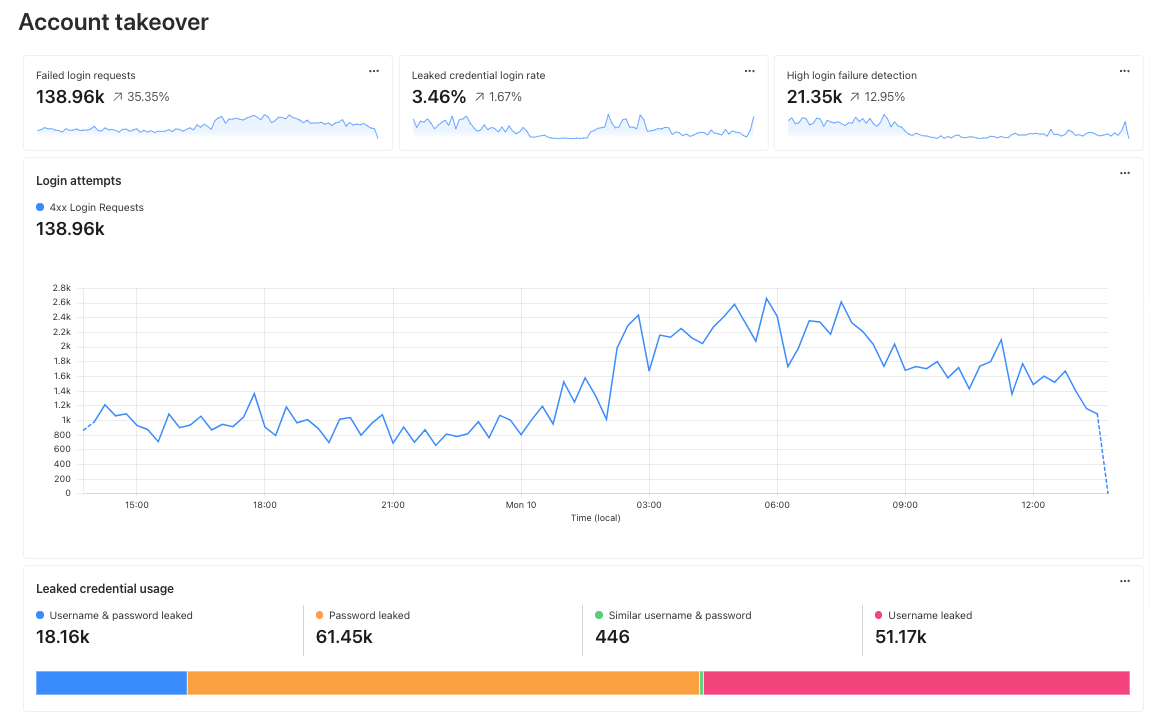
Account Takeover: View login attempts, usage of leaked credentials, and identify account takeover attacks
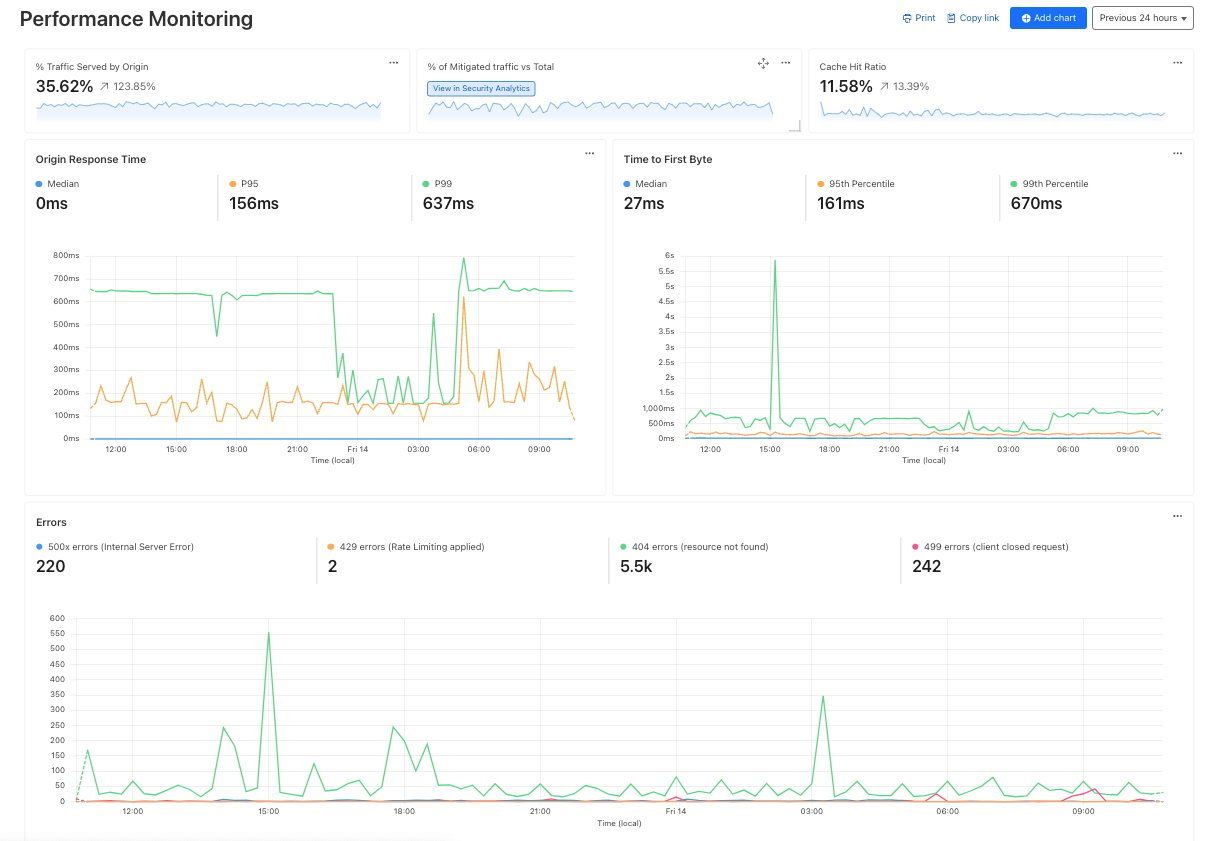
Performance Monitoring: Identify slow hosts and paths on your origin server, and view time to first byte (TTFB) metrics over time
Security Monitoring: monitor attack distribution across top hosts and paths, correlate DDoS traffic with origin Response time to understand the impact of DDoS attacks.
Investigate and troubleshoot issues with Log Search
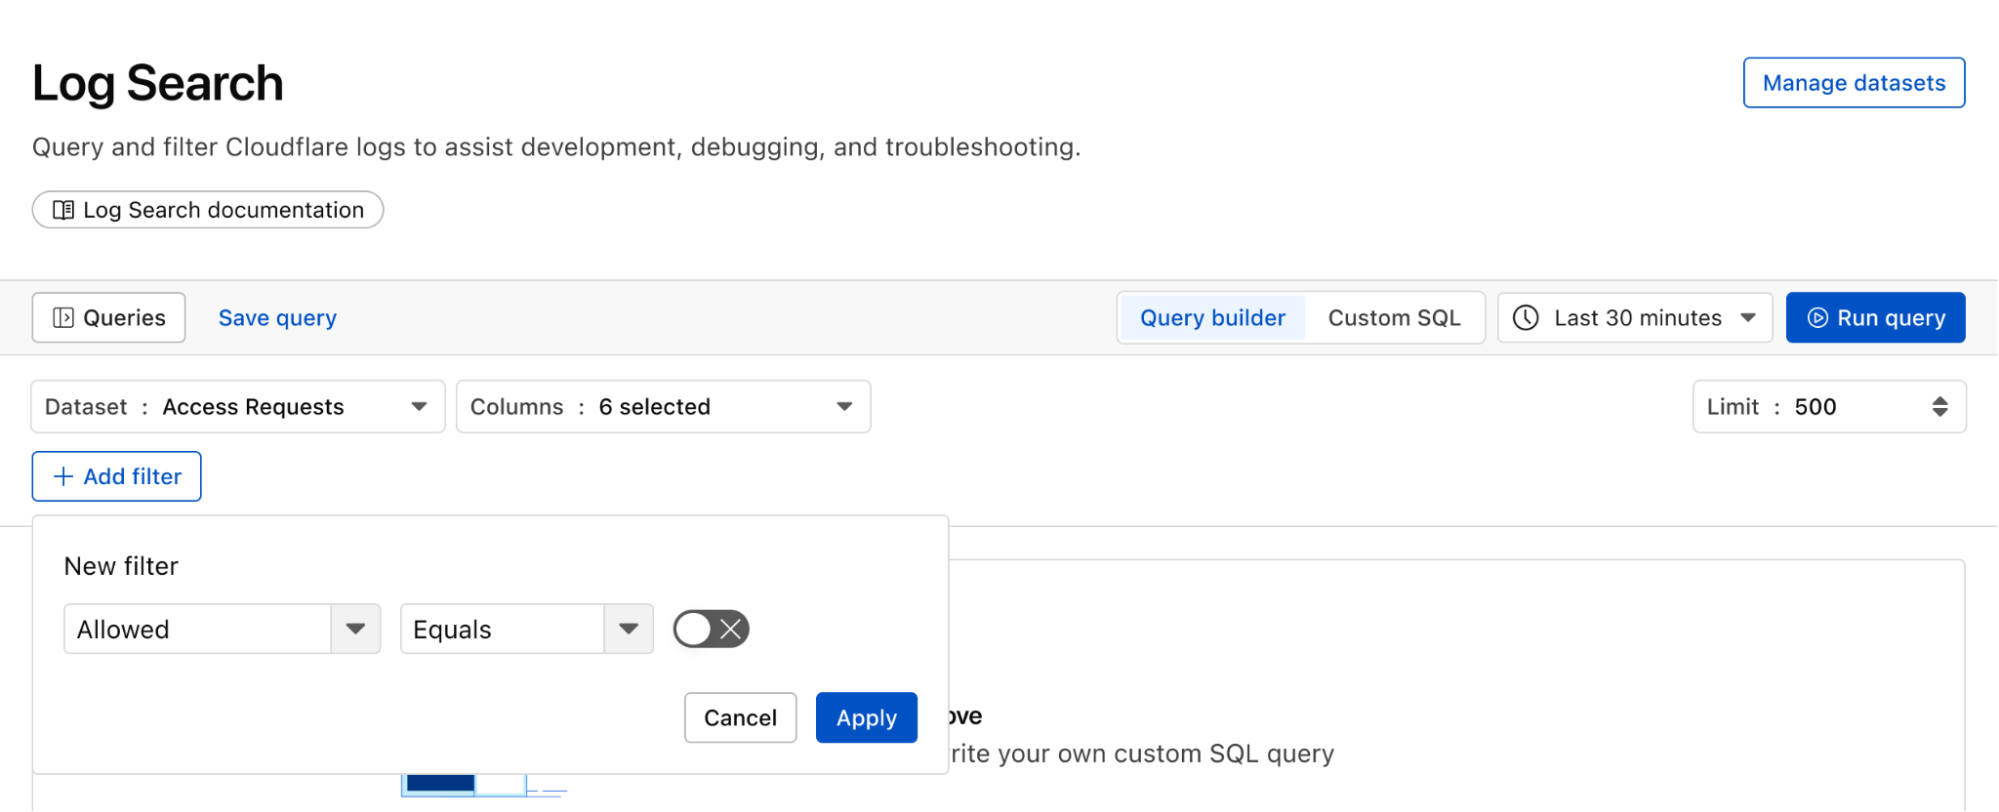
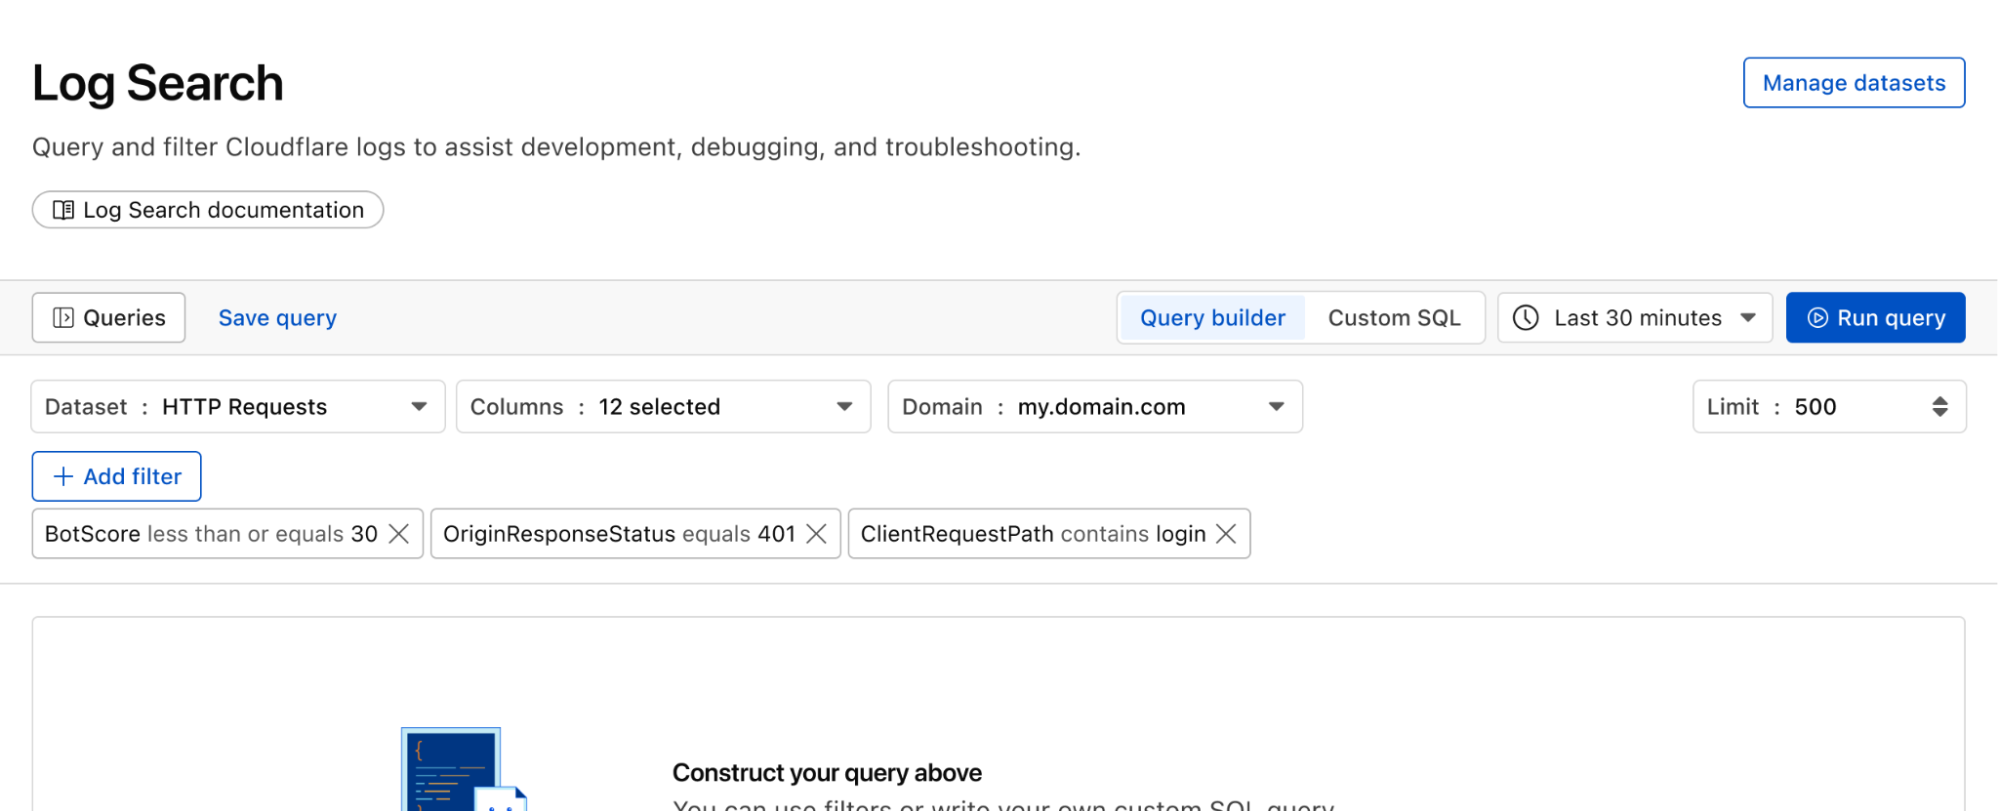
Continuing with the example from the prior section, after successfully diagnosing that some machines were compromised through the RCE issue, analysts can pivot over to Log Search in order to investigate whether the attacker was able to access and compromise other internal systems. To do that, the analyst could search logs from Zero Trust services, using context, such as compromised IP addresses from the custom dashboard, shown in the screenshot below:
Log Search is a streamlined experience including data type-aware search filters, or the ability to switch to a custom SQL interface for more powerful queries. Log searches are also available via a public API.
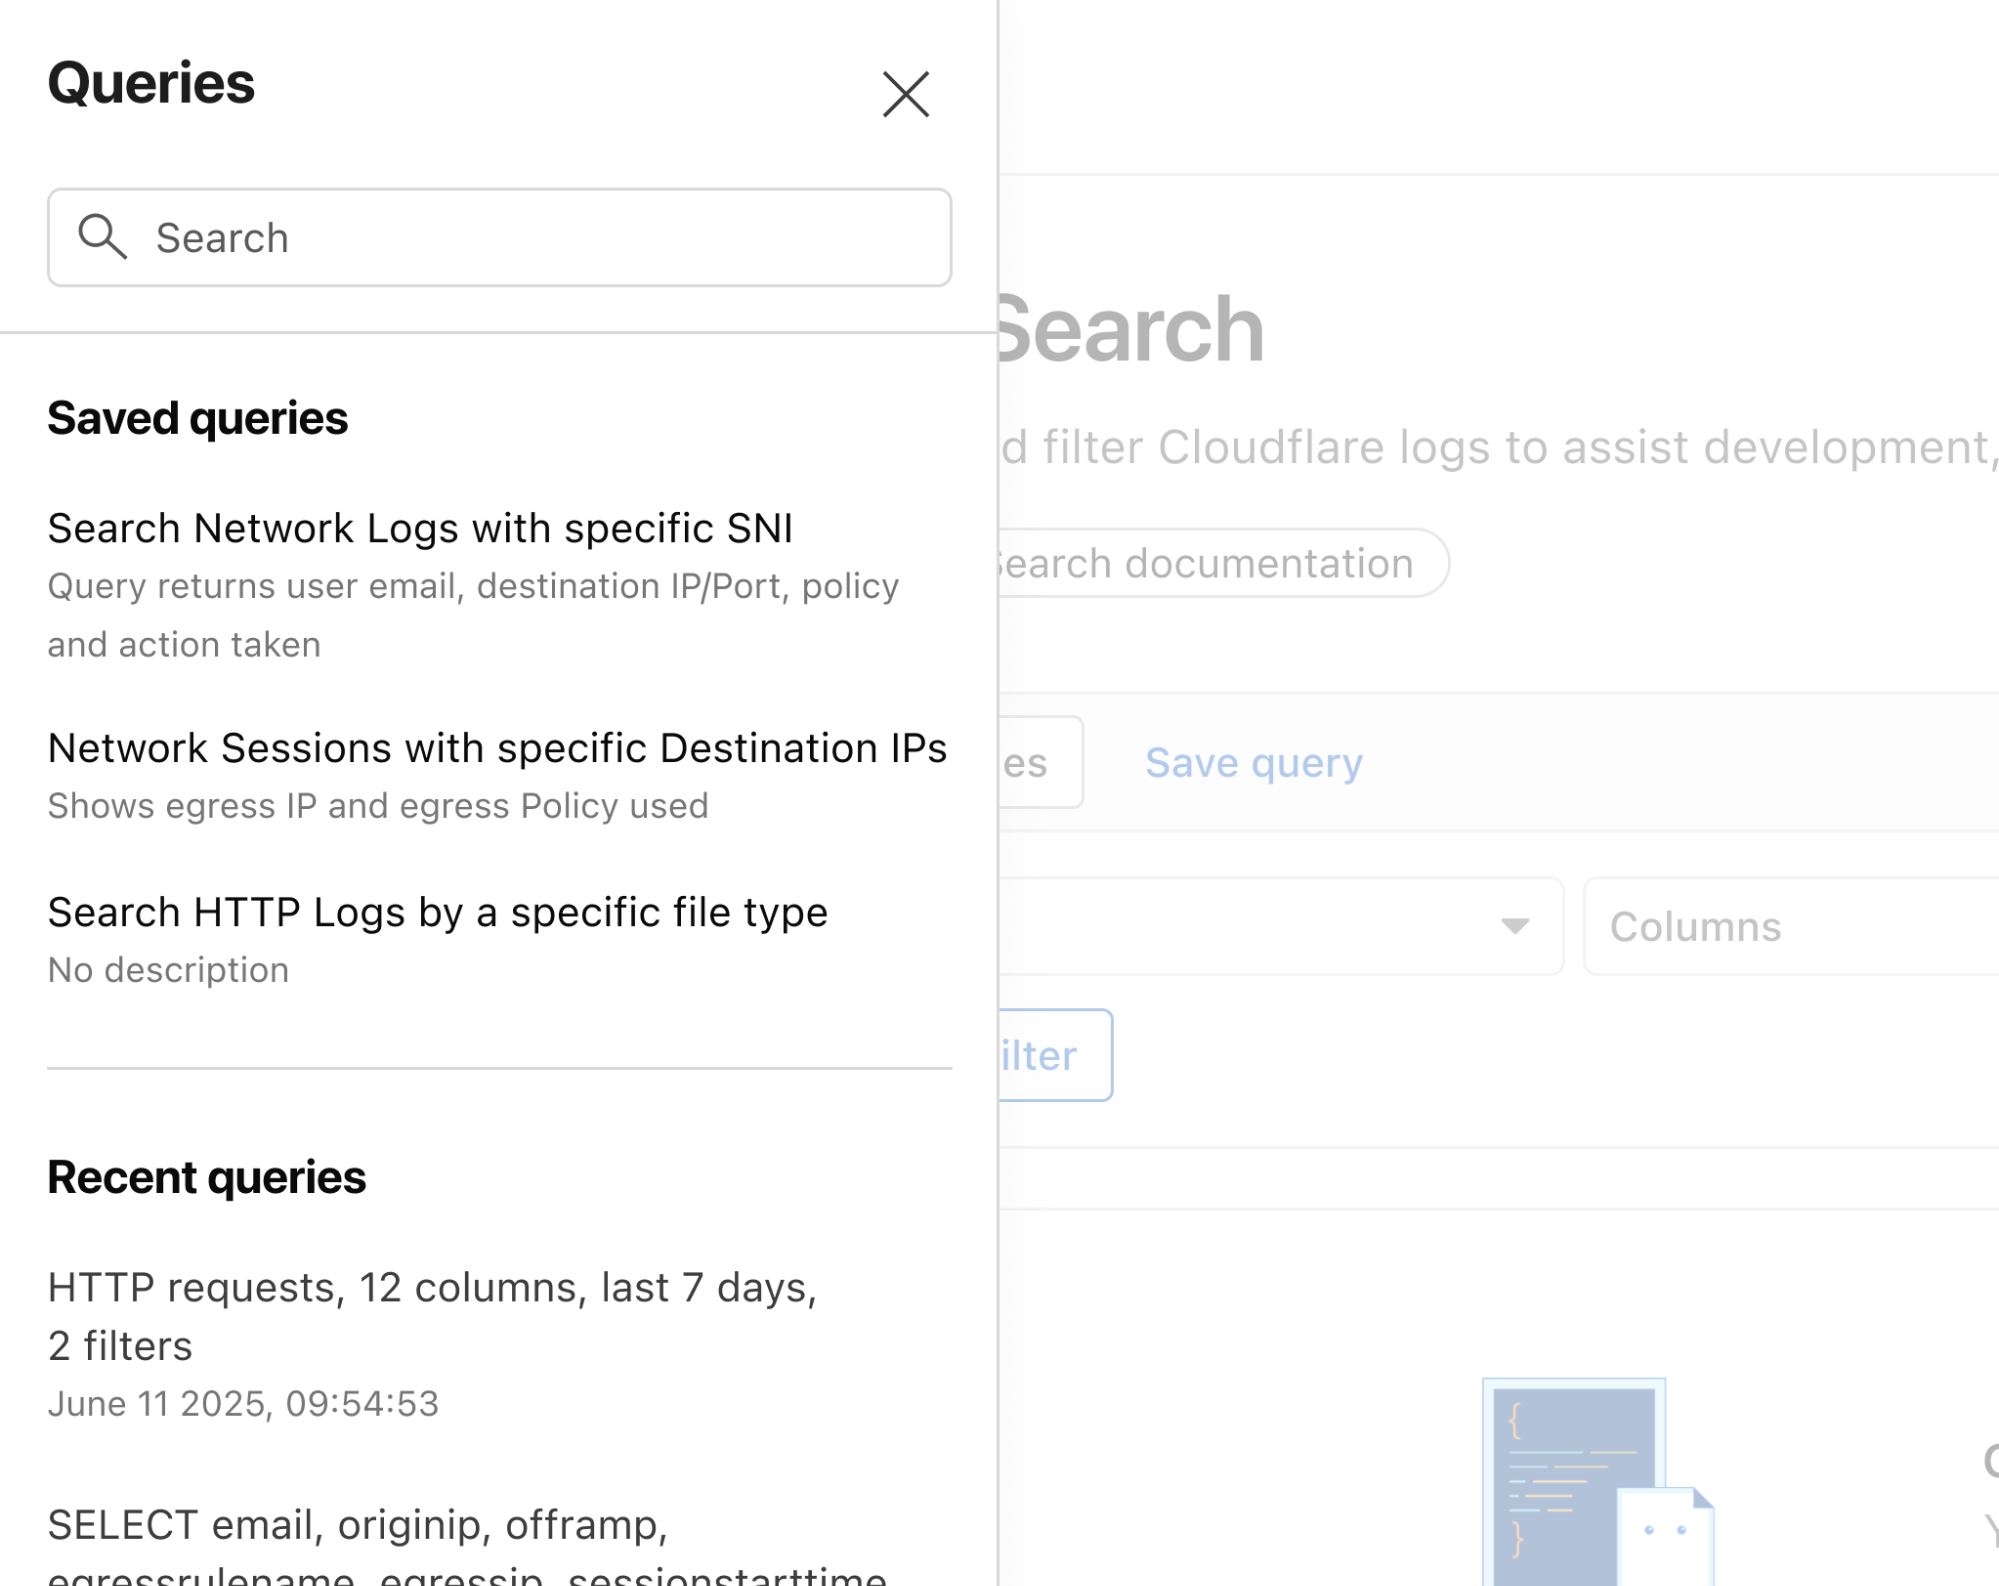
Save time and collaborate with saved queries
Queries built in Log Search can now be saved for repeated use and are accessible to other Log Explorer users in your account. This makes it easier than ever to investigate issues together.
Monitor proactively with Custom Alerting (coming soon)
With custom alerting, you can configure custom alert policies in order to proactively monitor the indicators that are important to your business.
Starting from Log Search, define and test your query. From here you can opt to save and configure a schedule interval and alerting policy. The query will run automatically on the schedule you define.
Tracking error rate for a custom hostname
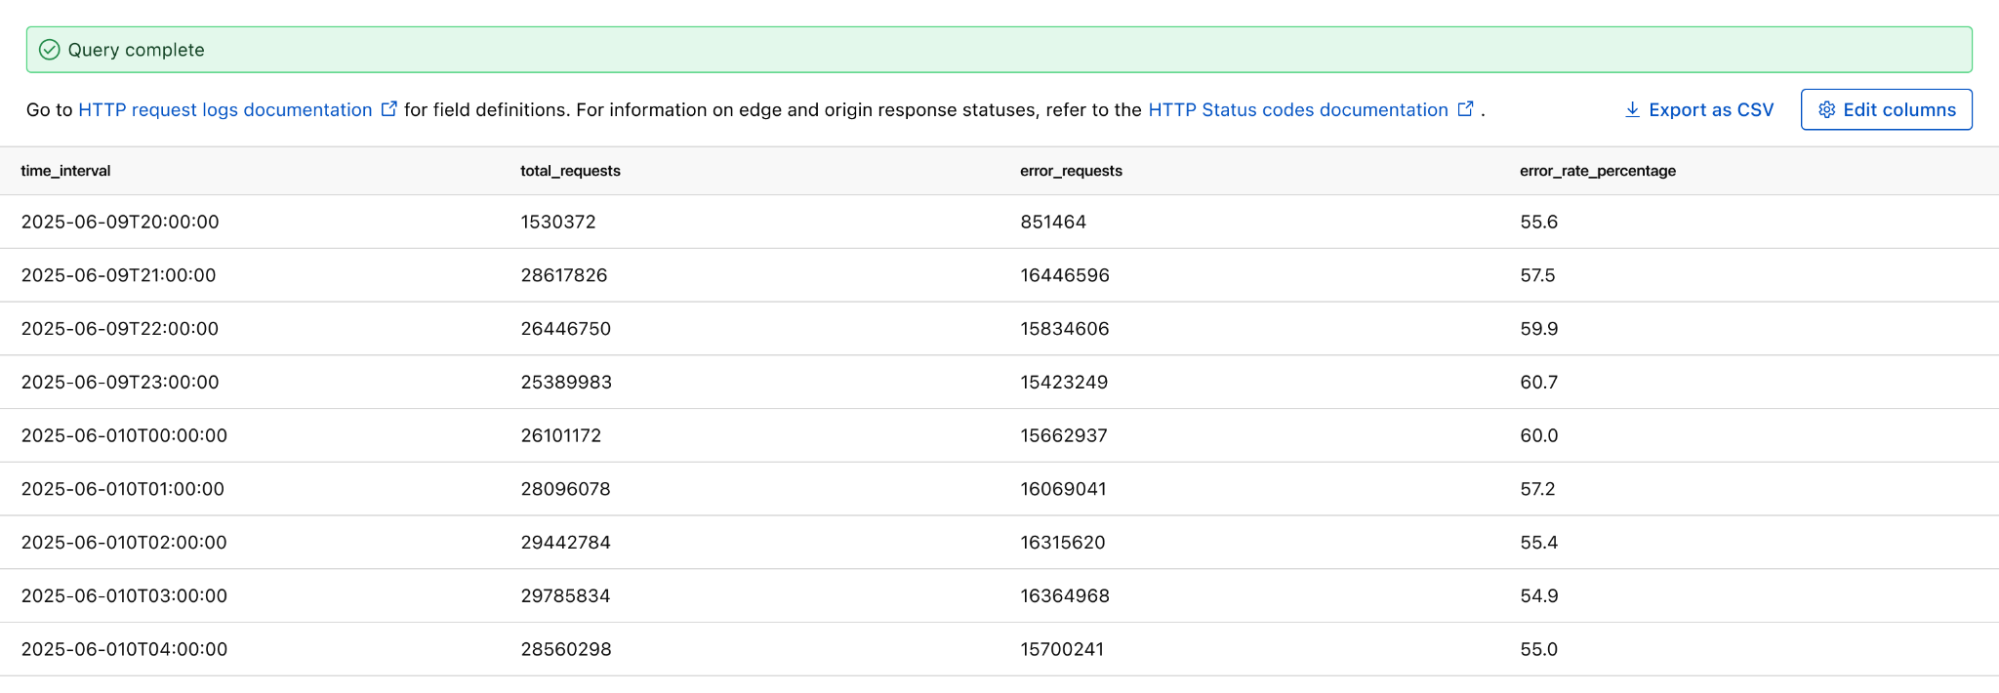
If you want to monitor the error rate for a particular host, you can use this Log Search query to calculate the error rate per time interval:
SELECT SUBSTRING(EdgeStartTimeStamp, 1, 14) || '00:00' AS time_interval,
       COUNT() AS total_requests,
       COUNT(CASE WHEN EdgeResponseStatus >= 500 THEN 1 ELSE NULL END) AS error_requests,
       COUNT(CASE WHEN EdgeResponseStatus >= 500 THEN 1 ELSE NULL END) * 100.0 / COUNT() AS error_rate_percentage
 FROM http_requests
WHERE EdgeStartTimestamp >= '2025-06-09T20:56:58Z'
  AND EdgeStartTimestamp <= '2025-06-10T21:26:58Z'
  AND ClientRequestHost = 'customhostname.com'
GROUP BY time_interval
ORDER BY time_interval ASC;
Running the above query returns the following results. You can see the overall error rate percentage in the far right column of the query results.
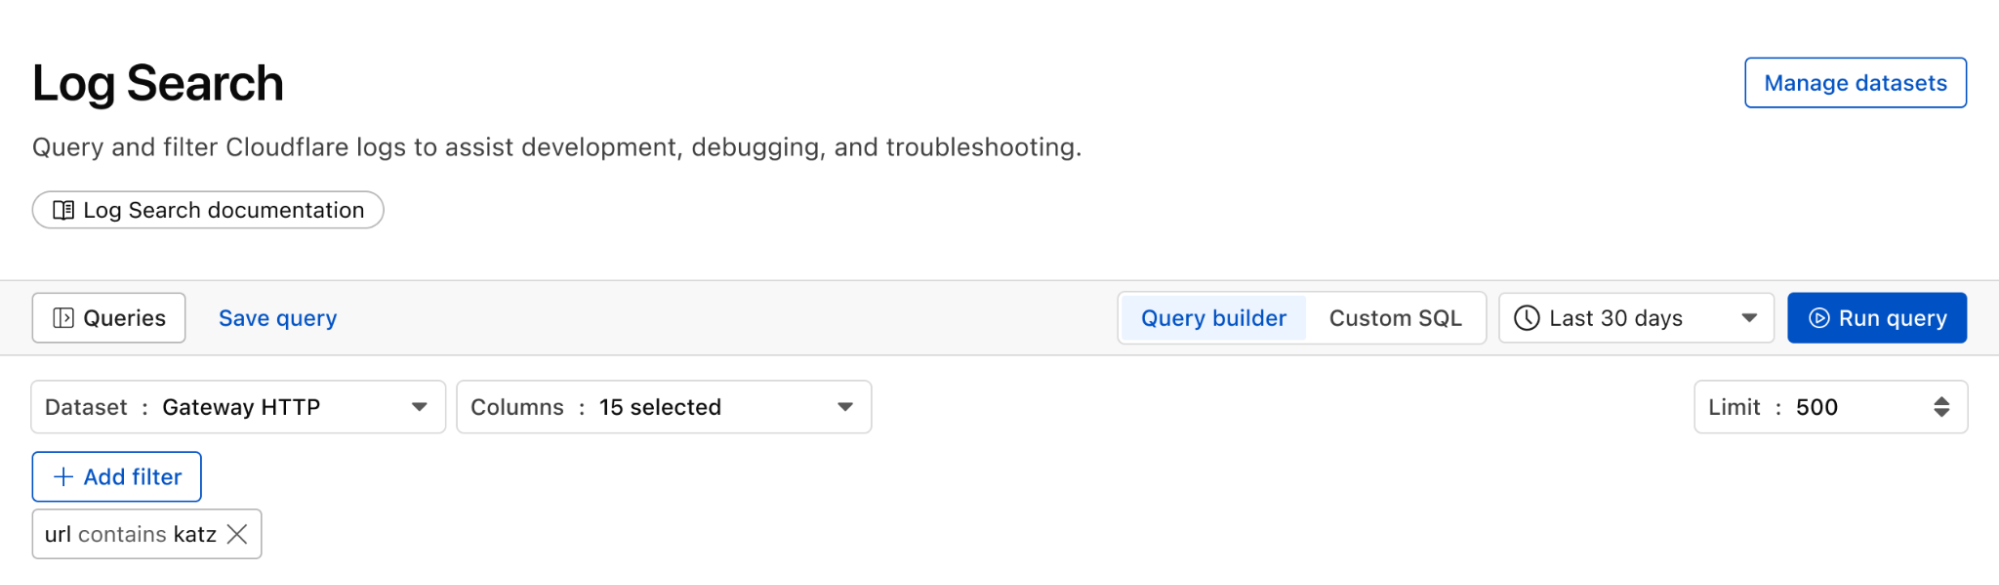
Proactively detect malware
We can identify malware in the environment by monitoring logs from Cloudflare Secure Web Gateway. As an example, Katz Stealer is malware-as-a-service designed for stealing credentials. We can monitor DNS queries and HTTP requests from users within the company in order to identify any machines that may be infected with Katz Stealer malware.
And with custom alerts, you can configure an alert policy so that you can be notified via webhook or PagerDuty.
Maintain audit & compliance with flexible retention (coming soon)
With flexible retention, you can set the precise length of time you want to store your logs, allowing you to meet specific compliance and audit requirements with ease. Other providers require archiving or hot and cold storage, making it difficult to query older logs. Log Explorer is built on top of our R2 storage tier, so historical logs can be queried as easily as current logs.
How we built Log Explorer to run at Cloudflare scale
With Log Explorer, we have built a scalable log storage platform on top of Cloudflare R2 that lets you efficiently search your Cloudflare logs using familiar SQL queries. In this section, we’ll look into how we did this and how we solved some technical challenges along the way.
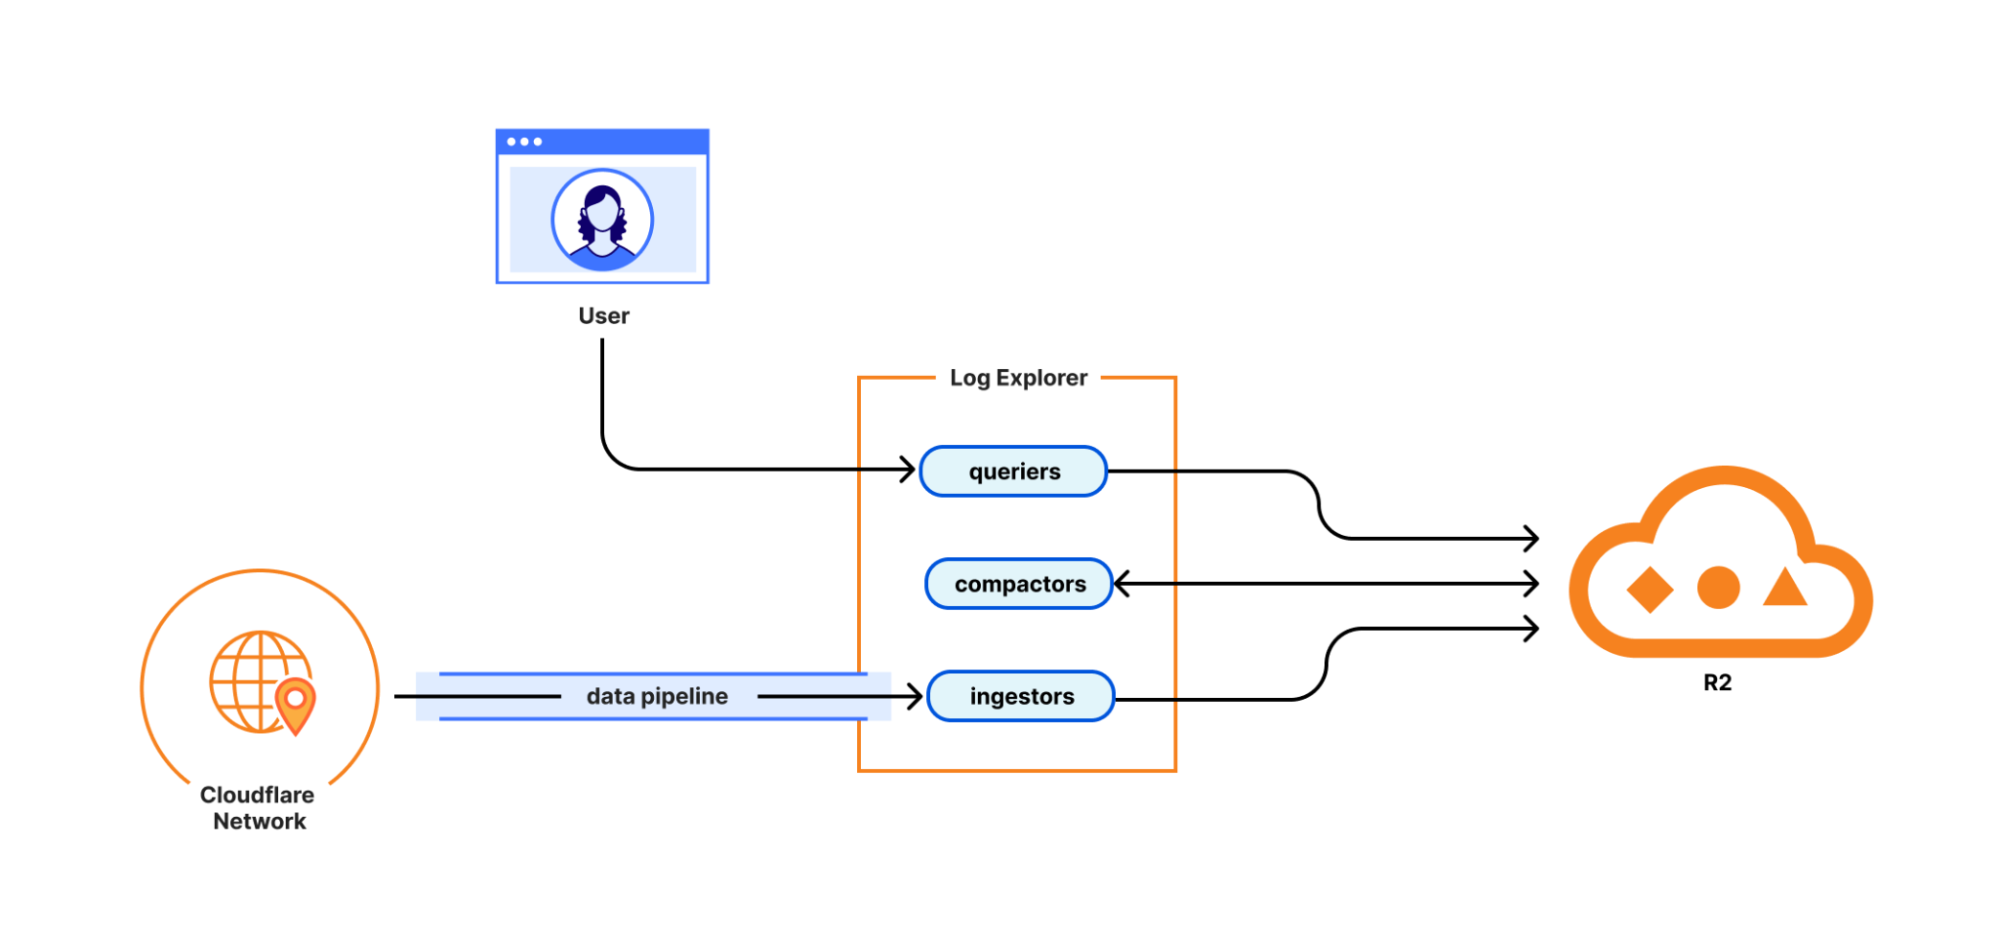
Log Explorer consists of three components: ingestors, compactors, and queriers. Ingestors are responsible for writing logs from Cloudflare’s data pipeline to R2. Compactors optimize storage files, so they can be queried more efficiently. Queriers execute SQL queries from users by fetching, transforming, and aggregating matching logs from R2.
During ingestion, Log Explorer writes each batch of log records to a Parquet file in R2. Apache Parquet is an open-source columnar storage file format, and it was an obvious choice for us: it’s optimized for efficient data storage and retrieval, such as by embedding metadata like the minimum and maximum values of each column across the file which enables the queriers to quickly locate the data needed to serve the query.
Log Explorer stores logs on a per-customer level, just like Cloudflare D1, so that your data isn’t mixed with that of other customers. In Q3 2025, per-customer logs will allow you the flexibility to create your own retention policies and decide in which regions you want to store your data.
But how does Log Explorer find those Parquet files when you query your logs? Log Explorer leverages the Delta Lake open table format to provide a database table abstraction atop R2 object storage. A table in Delta Lake pairs data files in Parquet format with a transaction log. The transaction log registers every addition, removal, or modification of a data file for the table – it’s stored right next to the data files in R2.
Given a SQL query for a particular log dataset such as HTTP Requests or Gateway DNS, Log Explorer first has to load the transaction log of the corresponding Delta table from R2. Transaction logs are checkpointed periodically to avoid having to read the entire table history every time a user queries their logs.
Besides listing Parquet files for a table, the transaction log also includes per-column min/max statistics for each Parquet file. This has the benefit that Log Explorer only needs to fetch files from R2 that can possibly satisfy a user query. Finally, queriers use the min/max statistics embedded in each Parquet file to decide which row groups to fetch from the file.
Log Explorer processes SQL queries using Apache DataFusion, a fast, extensible query engine written in Rust, and delta-rs, a community-driven Rust implementation of the Delta Lake protocol. While standing on the shoulders of giants, our team had to solve some unique problems to provide log search at Cloudflare scale.
Log Explorer ingests logs from across Cloudflare’s vast global network, spanning more than 330 cities in over 125 countries. If Log Explorer were to write logs from our servers straight to R2, its storage would quickly fragment into a myriad of small files, rendering log queries prohibitively expensive.
Log Explorer’s strategy to avoid this fragmentation is threefold. First, it leverages Cloudflare’s data pipeline, which collects and batches logs from the edge, ultimately buffering each stream of logs in an internal system named Buftee. Second, log batches ingested from Buftee aren’t immediately committed to the transaction log; rather, Log Explorer stages commits for multiple batches in an intermediate area and “squashes” these commits before they’re written to the transaction log. Third, once log batches have been committed, a process called compaction merges them into larger files in the background.
While the open-source implementation of Delta Lake provides compaction out of the box, we soon encountered an issue when using it for our workloads. Stock compaction merges data files to a desired target size S by sorting the files in reverse order of their size and greedily filling bins of size S with them. By merging logs irrespective of their timestamps, this process distributed ingested batches randomly across merged files, destroying data locality. Despite compaction, a user querying for a specific time frame would still end up fetching hundreds or thousands of files from R2.
For this reason, we wrote a custom compaction algorithm that merges ingested batches in order of their minimum log timestamp, leveraging the min/max statistics mentioned previously. This algorithm reduced the number of overlaps between merged files by two orders of magnitude. As a result, we saw a significant improvement in query performance, with some large queries that had previously taken over a minute completing in just a few seconds.
Follow along for more updates
We’re just getting started! We’re actively working on even more powerful features to further enhance your experience with Log Explorer. Subscribe to the blog and keep an eye out for more updates in our Change Log to our observability and forensics offering soon.
Get access to Log Explorer
To get access to Log Explorer, reach out for a consultation or contact your account manager. Additionally, you can read more in our Developer Documentation.
Apache Iceberg is quickly becoming the standard table format for querying large analytic datasets in object storage. We’re seeing this trend firsthand as more and more developers and data teams adopt Iceberg on Cloudflare R2. But until now, using Iceberg with R2 meant managing additional infrastructure or relying on external data catalogs.
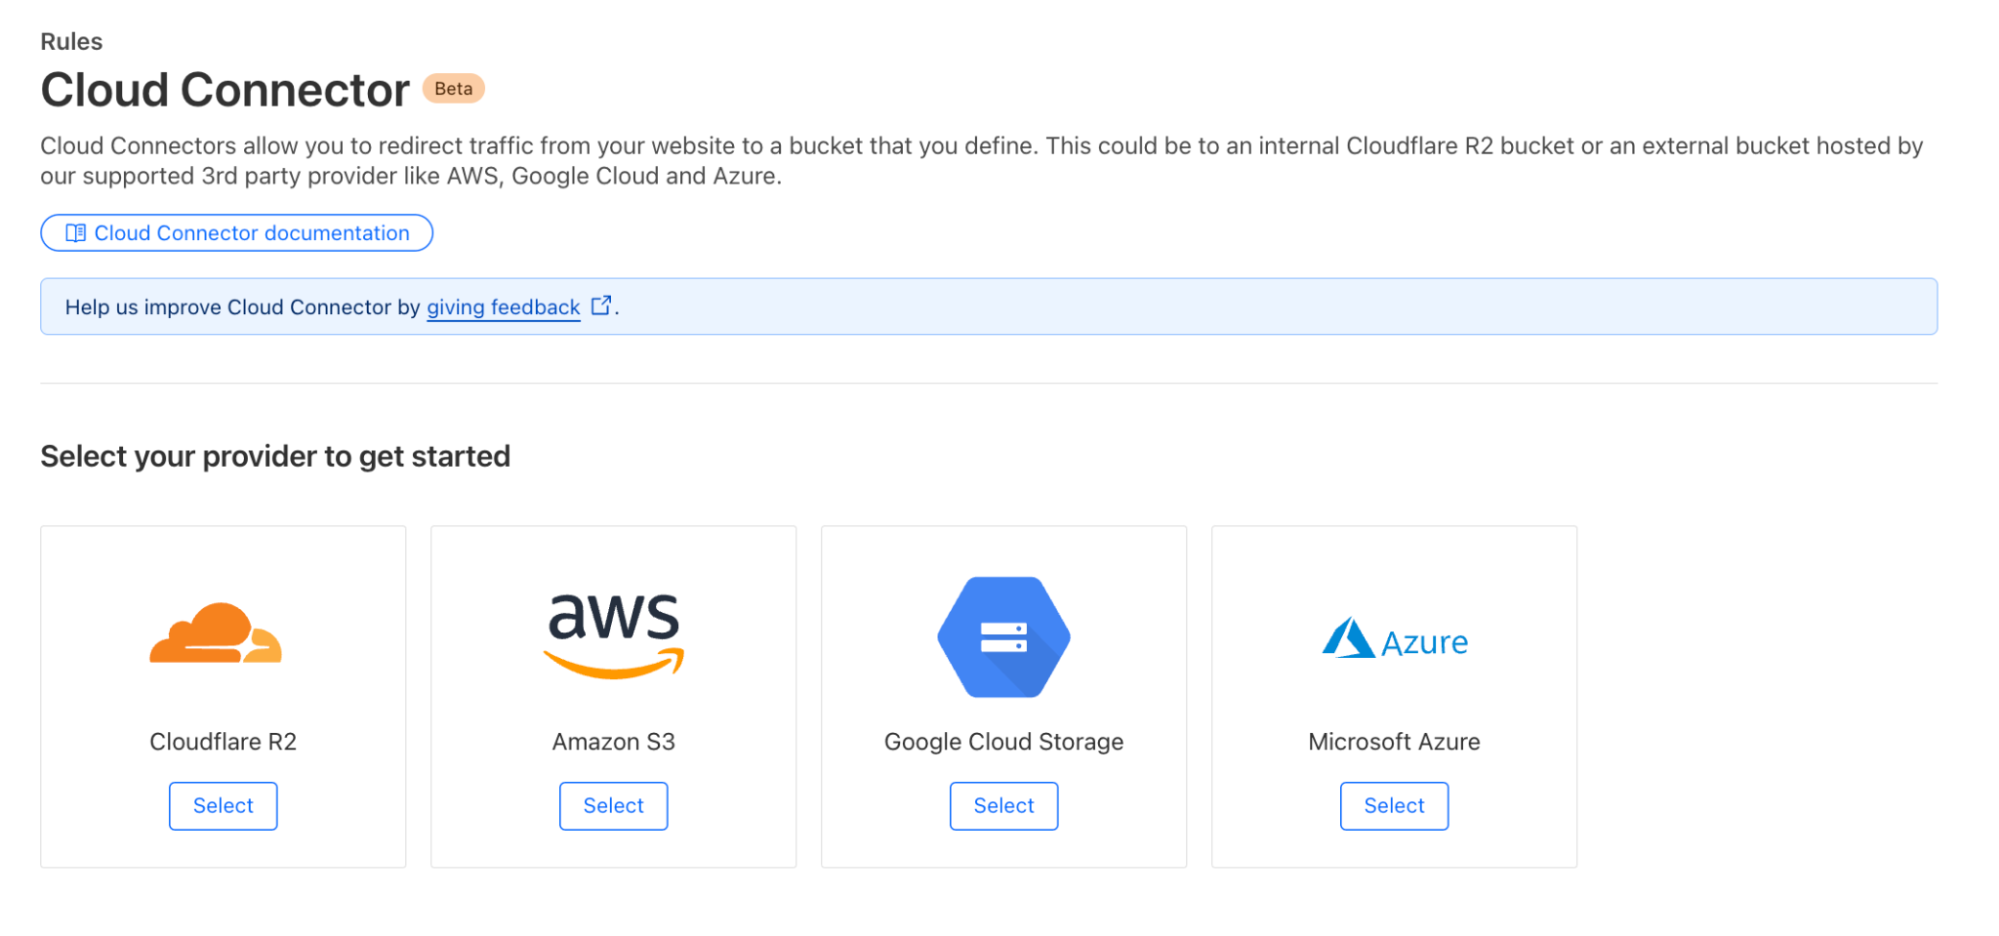
So we’re fixing this. Today, we’re launching the R2 Data Catalog in open beta, a managed Apache Iceberg catalog built directly into your Cloudflare R2 bucket.
If you’re not already familiar with it, Iceberg is an open table format built for large-scale analytics on datasets stored in object storage. With R2 Data Catalog, you get the database-like capabilities Iceberg is known for – ACID transactions, schema evolution, and efficient querying – without the overhead of managing your own external catalog.
R2 Data Catalog exposes a standard Iceberg REST catalog interface, so you can connect the engines you already use, like PyIceberg, Snowflake, and Spark. And, as always with R2, there are no egress fees, meaning that no matter which cloud or region your data is consumed from, you won’t have to worry about growing data transfer costs.
Ready to query data in R2 right now? Jump into the developer docs and enable a data catalog on your R2 bucket in just a few clicks. Or keep reading to learn more about Iceberg, data catalogs, how metadata files work under the hood, and how to create your first Iceberg table.
What is Apache Iceberg?
Apache Iceberg is an open table format for analyzing large datasets in object storage. It brings database-like features – ACID transactions, time travel, and schema evolution – to files stored in formats like Parquet or ORC.
Historically, data lakes were just collections of raw files in object storage. However, without a unified metadata layer, datasets could easily become corrupted, were difficult to evolve, and queries often required expensive full-table scans.
Iceberg solves these problems by:
Providing ACID transactions for reliable, concurrent reads and writes.
Maintaining optimized metadata, so engines can skip irrelevant files and avoid unnecessary full-table scans.
Supporting schema evolution, allowing columns to be added, renamed, or dropped without rewriting existing data.
Iceberg is already widely supported by engines like Apache Spark, Trino, Snowflake, DuckDB, and ClickHouse, with a fast-growing community behind it.
How Iceberg tables are stored
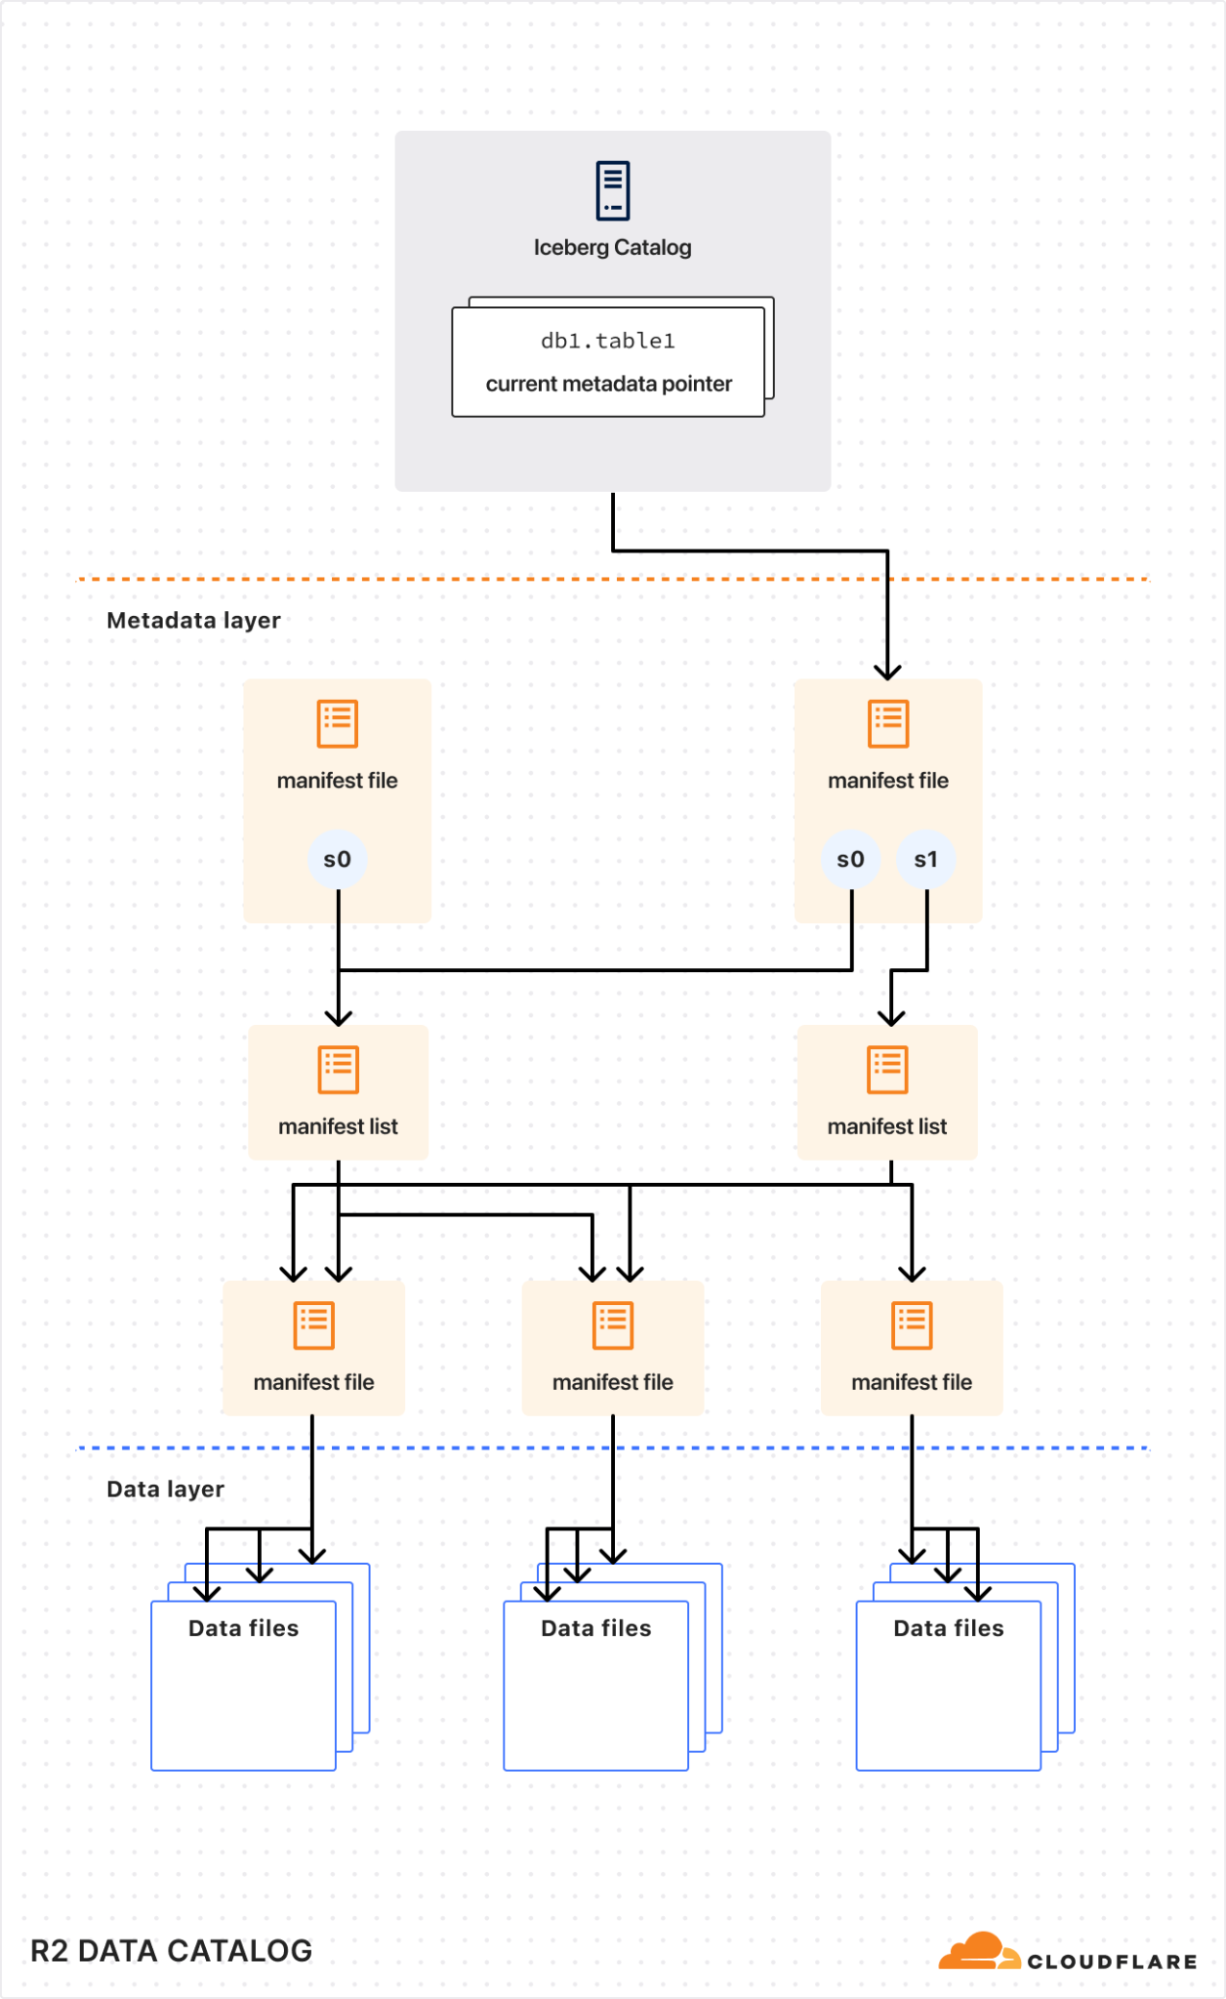
Internally, an Iceberg table is a collection of data files (typically stored in columnar formats like Parquet or ORC) and metadata files (typically stored in JSON or Avro) that describe table snapshots, schemas, and partition layouts.
To understand how query engines interact efficiently with Iceberg tables, it helps to look at an Iceberg metadata file (simplified):
schemas: Iceberg tracks schema changes over time. Engines use schema information to safely read and write data without needing to rewrite underlying files.
snapshots: Each snapshot references a specific set of data files that represent the state of the table at a point in time. This enables features like time travel.
partition-specs: These define how the table is logically partitioned. Query engines leverage this information during planning to skip unnecessary partitions, greatly improving query performance.
By reading Iceberg metadata, query engines can efficiently prune partitions, load only the relevant snapshots, and fetch only the data files it needs, resulting in faster queries.
Why do you need a data catalog?
Although the Iceberg data and metadata files themselves live directly in object storage (like R2), the list of tables and pointers to the current metadata need to be tracked centrally by a data catalog.
Think of a data catalog as a library’s index system. While books (your data) are physically distributed across shelves (object storage), the index provides a single source of truth about what books exist, their locations, and their latest editions. Without this index, readers (query engines) would waste time searching for books, might access outdated versions, or could accidentally shelve new books in ways that make them unfindable.
Similarly, data catalogs ensure consistent, coordinated access, allowing multiple query engines to safely read from and write to the same tables without conflicts or data corruption.
Create your first Iceberg table on R2
Ready to try it out? Here’s a quick example using PyIceberg and Python to get you started. For a detailed step-by-step guide, check out our developer docs.
1. Enable R2 Data Catalog on your bucket:
npx wrangler r2 bucket catalog enable my-bucket
Or use the Cloudflare dashboard: Navigate to R2 Object Storage > Settings > R2 Data Catalog and click Enable.
2. Create a Cloudflare API token with permissions for both R2 storage and the data catalog.
3. Install PyIceberg and PyArrow, then open a Python shell or notebook:
You can now append more data or run queries, just as you would with any Apache Iceberg table.
Pricing
While R2 Data Catalog is in open beta, there will be no additional charges beyond standard R2 storage and operations costs incurred by query engines accessing data. Storage pricing for buckets with R2 Data Catalog enabled remains the same as standard R2 buckets – \$0.015 per GB-month. As always, egress directly from R2 buckets remains \$0.
In the future, we plan to introduce pricing for catalog operations (e.g., creating tables, retrieving table metadata, etc.) and data compaction.
Below is our current thinking on future pricing. We’ll communicate more details around timing well before billing begins, so you can confidently plan your workloads.
Pricing
R2 storage
For standard storage class
$0.015 per GB-month (no change)
R2 Class A operations
$4.50 per million operations (no change)
R2 Class B operations
$0.36 per million operations (no change)
Data Catalog operations
e.g., create table, get table metadata, update table properties
$9.00 per million catalog operations
Data Catalog compaction data processed
$0.05 per GB processed
$4.00 per million objects processed
Data egress
$0 (no change, always free)
What’s next?
We’re excited to see how you use R2 Data Catalog! If you’ve never worked with Iceberg – or even analytics data – before, we think this is the easiest way to get started.
Next on our roadmap is tackling compaction and table optimization. Query engines typically perform better when dealing with fewer, but larger data files. We will automatically re-write collections of small data files into larger files to deliver even faster query performance.
We’re also collaborating with the broad Apache Iceberg community to expand query-engine compatibility with the Iceberg REST Catalog spec.
In 2024, we announced Log Explorer, giving customers the ability to store and query their HTTP and security event logs natively within the Cloudflare network. Today, we are excited to announce that Log Explorer now supports logs from our Zero Trust product suite. In addition, customers can create custom dashboards to monitor suspicious or unusual activity.
Every day, Cloudflare detects and protects customers against billions of threats, including DDoS attacks, bots, web application exploits, and more. SOC analysts, who are charged with keeping their companies safe from the growing spectre of Internet threats, may want to investigate these threats to gain additional insights on attacker behavior and protect against future attacks. Log Explorer, by collecting logs from various Cloudflare products, provides a single starting point for investigations. As a result, analysts can avoid forwarding logs to other tools, maximizing productivity and minimizing costs. Further, analysts can monitor signals specific to their organizations using custom dashboards.
Zero Trust dataset support in Log Explorer
Log Explorer stores your Cloudflare logs for a 30-day retention period so that you can analyze them natively and in a single interface, within the Cloudflare Dashboard. Cloudflare log data is diverse, reflecting the breadth of capabilities available. For example, HTTP requests contain information about the client such as their IP address, request method, autonomous system (ASN), request paths, and TLS versions used. Additionally, Cloudflare’s Application Security WAF Detections enrich these HTTP request logs with additional context, such as the WAF attack score, to identify threats.
Today we are announcing that seven additional Cloudflare product datasets are now available in Log Explorer. These seven datasets are the logs generated from our Zero Trust product suite, and include logs from Access, Gateway DNS, Gateway HTTP, Gateway Network, CASB, Zero
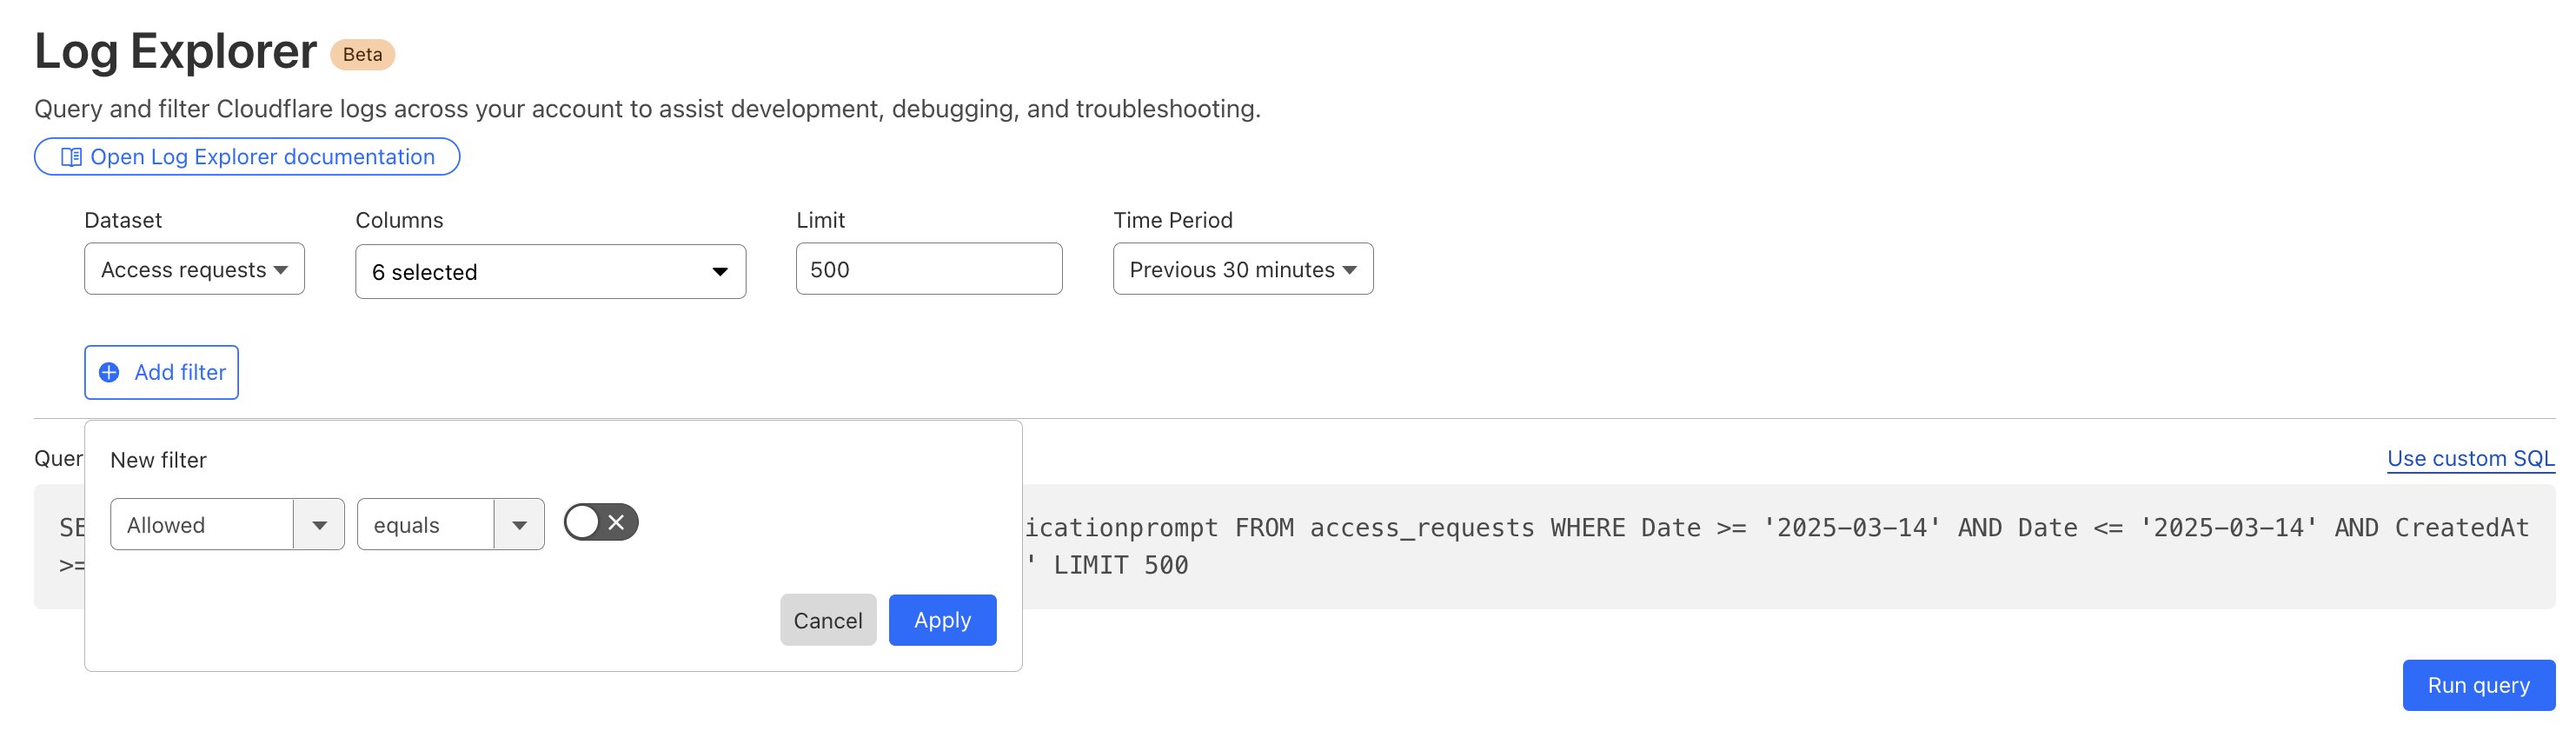
By reviewing Access logs and HTTP request logs, we can reveal attempts to access resources or systems without proper permissions, including brute force password attacks, indicating potential security breaches or malicious activity.
Below, we filter Access Logs on the Allowed field, to see activity related to unauthorized access.
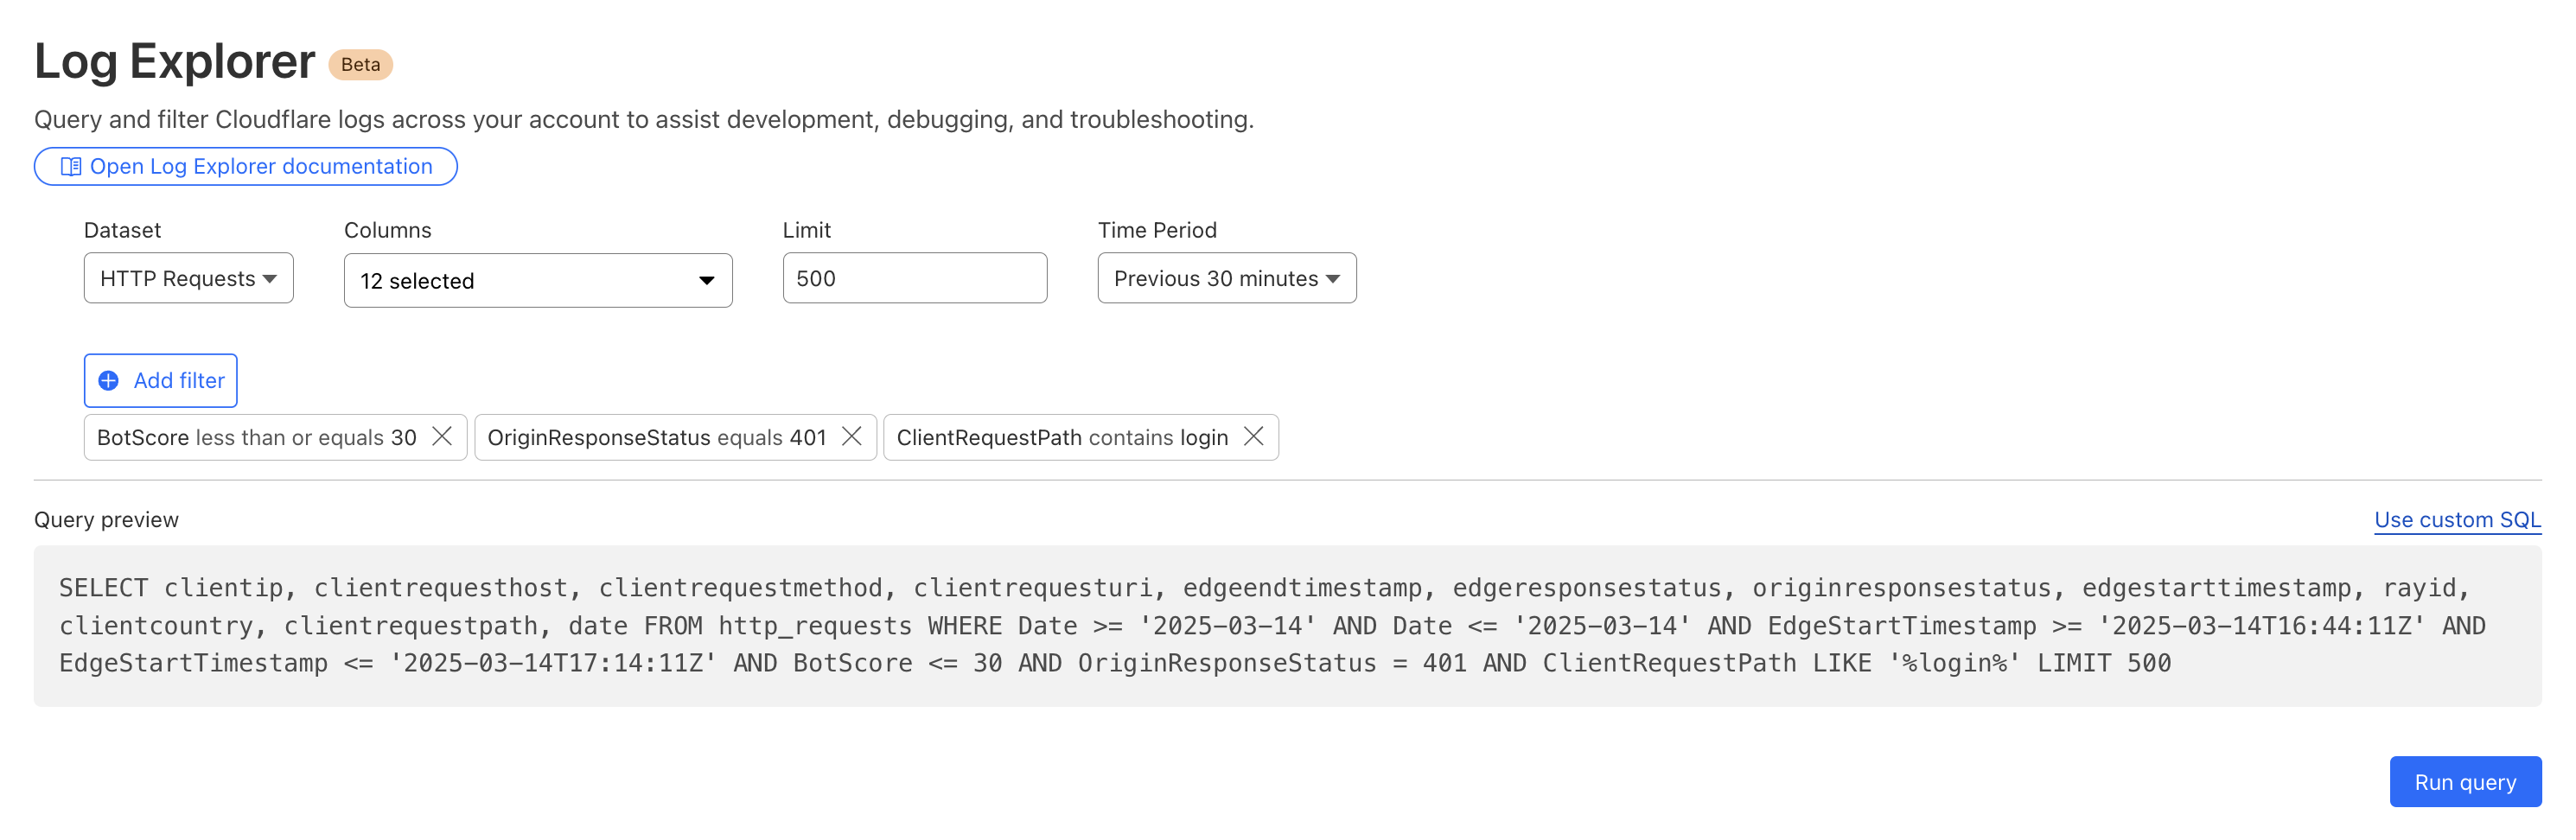
By then reviewing the HTTP logs for the requests identified in the previous query, we can assess if bot networks are the source of unauthorized activity.
With this information, you can craft targeted Custom Rules to block the offending traffic.
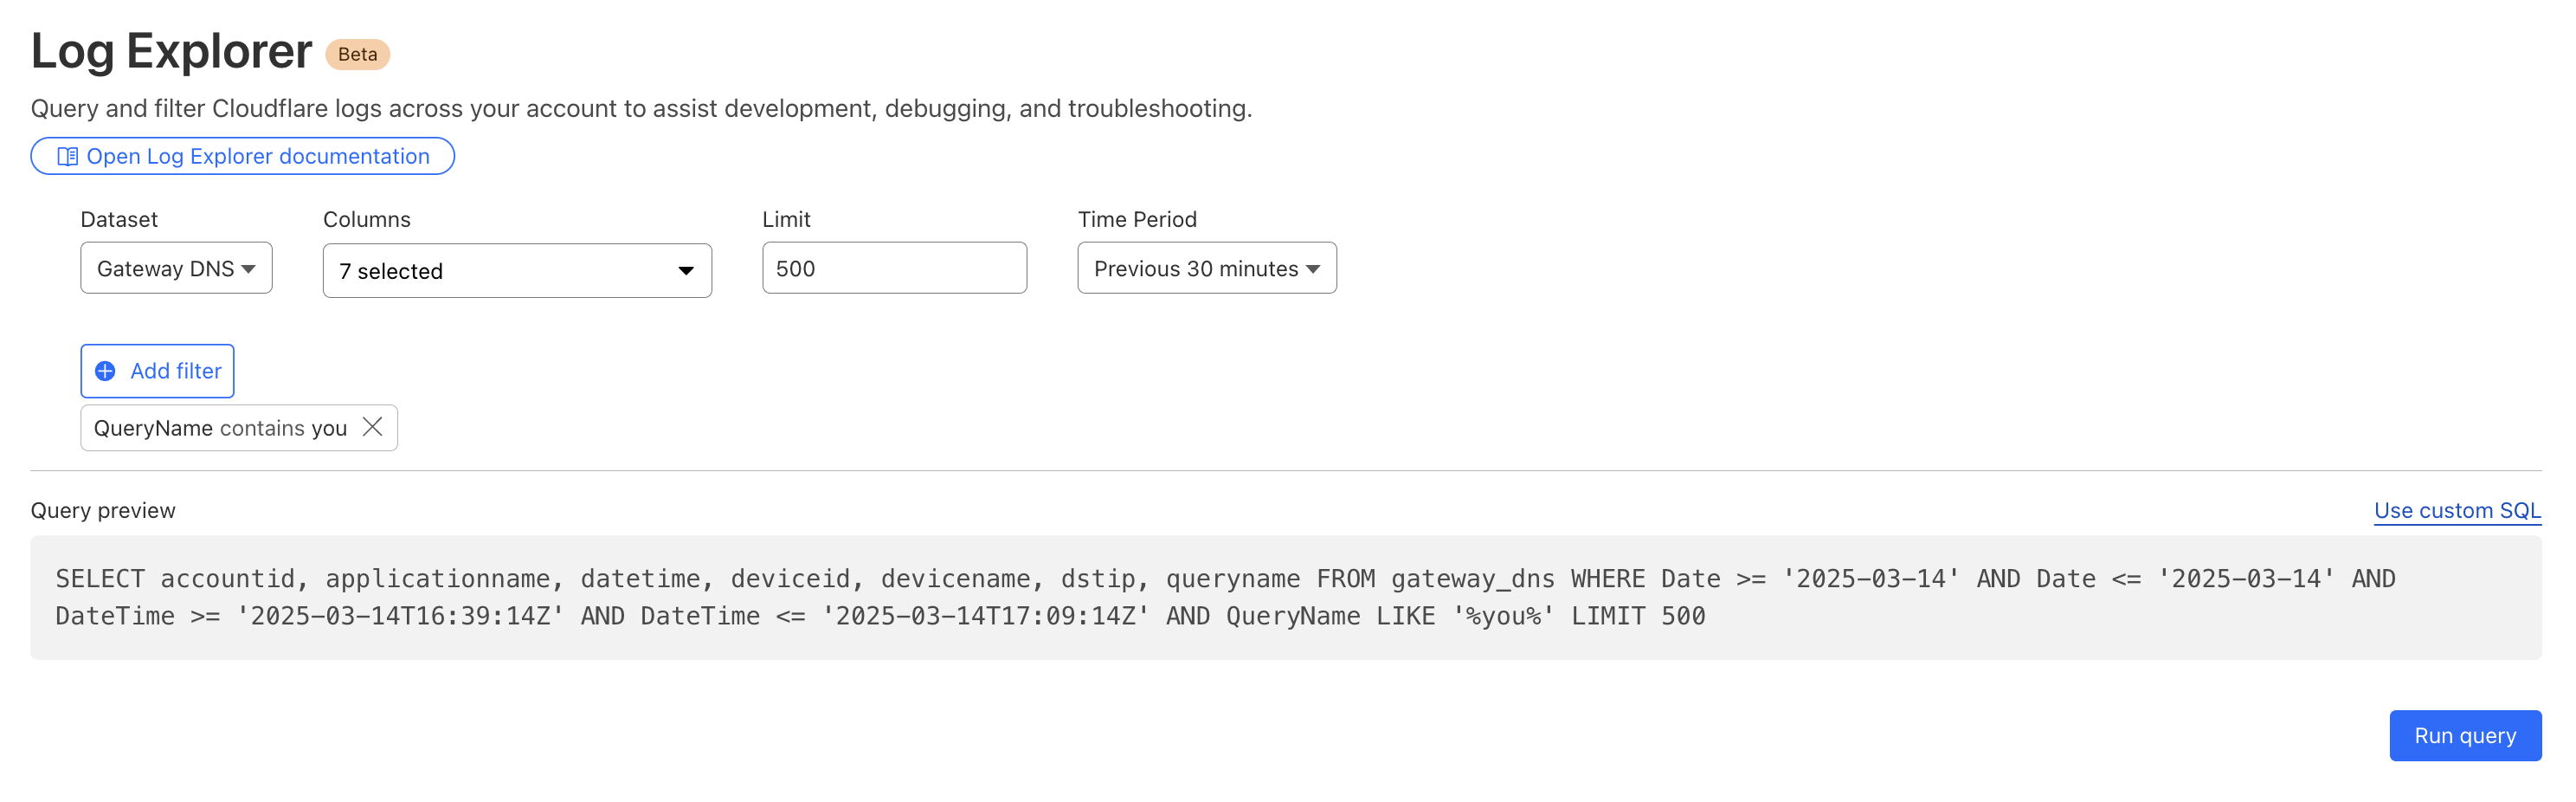
Detecting malware
Cloudflare’s Web Gateway can track which websites users are accessing, allowing administrators to identify and block access to malicious or inappropriate sites. These logs can be used to detect if a user’s machine or account is compromised by malware attacks. When reviewing logs, this may become apparent when we look for records that show a rapid succession of attempts to browse known malicious sites, such as hostnames that have long strings of seemingly random characters that hide their true destination. In this example, we can query logs looking for requests to a spoofed YouTube URL.
Monitoring what matters using custom dashboards
Security monitoring is not one size fits all. For instance, companies in the retail or financial industries worry about fraud, while every company is concerned about data exfiltration, of information like trade secrets. And any form of personally identifiable information (PII) is a target for data breaches or ransomware attacks.
While log exploration helps you react to threats, our new custom dashboards allow you to define the specific metrics you need in order to monitor threats you are concerned about.
Getting started is easy, with the ability to create a chart using natural language. A natural language interface is integrated into the chart create/edit experience, enabling you to describe in your own words the chart you want to create. Similar to the AI Assistant we announced during Security Week 2024, the prompt translates your language to the appropriate chart configuration, which can then be added to a new or existing custom dashboard.
Use a prompt: Enter a query like “Compare status code ranges over time”. The AI model decides the most appropriate visualization and constructs your chart configuration.
Customize your chart: Select the chart elements manually, including the chart type, title, dataset to query, metrics, and filters. This option gives you full control over your chart’s structure.
Video shows entering a natural language description of desired metric “compare status code ranges over time”, preview chart shown is a time series grouped by error code ranges, selects “add chart” to save to dashboard.
For more help getting started, we have some pre-built templates that you can use for monitoring specific uses. Available templates currently include:
Bot monitoring: Identify automated traffic accessing your website
API Security: Monitor the data transfer and exceptions of API endpoints within your application
API Performance: See timing data for API endpoints in your application, along with error rates
Account Takeover: View login attempts, usage of leaked credentials, and identify account takeover attacks
Performance Monitoring: Identify slow hosts and paths on your origin server, and view time to first byte (TTFB) metrics over time
Templates provide a good starting point, and once you create your dashboard, you can add or remove individual charts using the same natural language chart creator.
Video shows editing chart from an existing dashboard and moving individual charts via drag and drop.
Example use cases
Custom dashboards can be used to monitor for suspicious activity, or to keep an eye on performance and errors for your domains. Let’s explore some examples of suspicious activity that we can monitor using custom dashboards.
Take, for example, our use case from above: investigating unauthorized access. With custom dashboards, you can create a dashboard using the Account takeover template to monitor for suspicious login activity related to your domain.
As another example, spikes in requests or errors are common indicators that something is wrong, and they can sometimes be signals of suspicious activity. With the Performance Monitoring template, you can view origin response time and time to first byte metrics as well as monitor for common errors. For example, in this chart, the spikes in 404 errors could be an indication of an unauthorized scan of your endpoints.
Seamlessly integrated into the Cloudflare platform
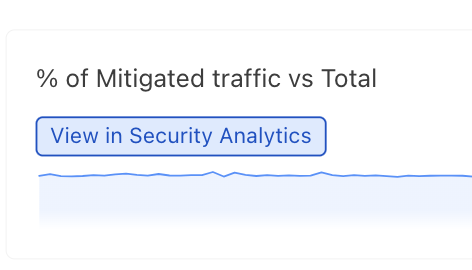
When using custom dashboards, if you observe a traffic pattern or spike in errors that you would like to further investigate, you can click the button to “View in Security Analytics” in order to drill down further into the data and craft custom WAF rules to mitigate the threat.
These tools, seamlessly integrated into the Cloudflare platform, will enable users to discover, investigate, and mitigate threats all in one place, reducing time to resolution and overall cost of ownership by eliminating the need to forward logs to third party security analysis tools. And because it is a native part of Cloudflare, you can immediately use the data from your investigation to craft targeted rules that will block these threats.
What’s next
Stay tuned as we continue to develop more capabilities in the areas of observability and forensics, with additional features including:
Custom alerts: create alerts based on specific metrics or anomalies
Scheduled query detections: craft log queries and run them on a schedule to detect malicious activity
More integration: further streamlining the journey between detect, investigate, and mitigate across the full Cloudflare platform.
How to get it
Current Log Explorer beta users get immediate access to the new custom dashboards feature. Pricing will be made available to everyone during Q2 2025. Between now and then, these features continue to be available at no cost.
Let us know if you are interested in joining our Beta program by completing this form, and a member of our team will contact you.
With Cloudflare Waiting Room, you can safeguard your site from traffic surges by placing visitors in a customizable, virtual queue. Previously, many site visitors waited in the queue alongside bots, only to find themselves competing for inventory once in the application. This competition is inherently unfair, as bots are much faster and more efficient than humans. As a result, humans inevitably lose out in these high-demand situations, unable to secure inventory before bots sweep it all up. This creates a frustrating experience for real customers, who feel powerless against the speed and automation of bots, leading to a diminished experience overall. Those days are over! Today, we are thrilled to announce the launch of two Waiting Room solutions that significantly improve the visitor experience.
Now, all Waiting Room customers can add an invisible Turnstile challenge to their queueing page, robustly challenging traffic and gathering analytics on bot activity within their queue. With Advanced Waiting Rooms, you can select between an invisible, managed, or non-interactive widget mode. But, we won’t just block these bots! Instead, traffic with definite bot signals that have failed the Turnstile challenge can be sent to an Infinite Queue, a completely customizable page that mimics a real user experience. This prolongs the time it takes bots to realize they have not actually joined the queue, wasting their resources without impacting real users. This feature not only protects your site against bots, but also reduces wait times and protects inventory by ensuring the queue only consists of genuine users. To offset the environmental impact of wasting bot resources, we’re contributing to a tree planting initiative, helping to reduce the carbon footprint of inefficient bots.
The second solution we have launched to improve the visitor experience is Session Revocation, which allows you to end a user’s session based on an action, dynamically opening up spots and admitting users from the queue. This new capability allows you to integrate Waiting Room more seamlessly with your customer journey, resulting in increased throughput, decreased wait times, and increased fairness by giving more users the opportunity to make it through the queue during high demand events.
This feature has proven to be extremely impactful for our customers, including a large online retailer that frequently has high-demand limited edition product drops. A common challenge in this space is maximizing the number of customers who can make a purchase during a limited-time event, all while maintaining a fair and efficient system for everyone involved. Previously, this customer had to limit their users to only one item in the cart and force them to wait for a period of time after each checkout before allowing them to rejoin the queue. This led to an awkward experience for end users, longer wait times, and reduced site throughput. With session revocation, this online retailer can now end the user’s session immediately after a purchase is complete, placing the user back in the queue if applicable, without being forced to wait for a preset timeout period. This significantly improves the end user experience by reducing unnecessary wait times and streamlining the purchase process.
Let’s deep dive into these two capabilities and how they improve the overall user experience.
How bots impact the Waiting Room user experience
Waiting Room is often used to protect sites from being overwhelmed by traffic surges during high demand online events. These high demand events, such as ticket or e-commerce product sales, attract both a deluge of genuine users, and sophisticated bots, such as scalper bots. This type of bot traffic is unique, as they can complete the checkout process or user journey much quicker than normal human traffic. Bots in the queue negatively affect the user experience by increasing wait times, as they often occupy multiple spots. Additionally, their behavior can exacerbate the issue — if they don’t handle cookies properly, they fail to take their spot in the application when their turn comes, further preventing the queue from progressing smoothly. Once past the queue, bots can also contribute to inventory hoarding, as they often reserve or consume large quantities of stock without genuine intent to purchase. An example of this is the PlayStation 5’s launch in November 2020. Due to high demand and production limitations during the COVID-19 pandemic, scalper bots bought up stock quickly, making it difficult for average consumers to purchase the console at retail prices. This led to extreme frustration for retailers and consumers as these bots drove the prices up significantly.
Quantifying bot traffic to Waiting Room with an invisible Turnstile challenge
Waiting Room customers have long been curious about the nature of large traffic spikes. Historically, bot scores and managed challenges have been the primary methods of collecting this data and acting on it. While these can provide some insight into the distribution of traffic, the Turnstile invisible challenge gives us the ability to actively interrogate the browser, providing the most complete set of data on whether that browser is being operated by a human or a bot.
To start quantifying bot traffic to waiting rooms, we have added an invisible Turnstile challenge to all basic rooms. With the purchase of an Advanced Waiting Room, customers can select between invisible, managed, or non-interactive widget modes. This Turnstile team blog post has more details on the different widget modes.
Waiting Room’s integration with Turnstile aims to protect your site with minimal impact to the user experience by placing a Turnstile challenge on your waiting room’s queuing page. Unlike a standard WAF challenge, the Waiting Room Turnstile challenge is presented only when the waiting room is queuing. This way, users won’t face any interruptions once they are past the queue and into the application.
With an advanced waiting room, you can configure the type of Turnstile challenge from the Cloudflare dashboard and API.
From the analytics we’ve gathered with the invisible Turnstile challenge on all basic waiting rooms, we’ve been able to determine that many large traffic spikes come from user agents that don’t even attempt to run the challenge, leaving it unsolved. In other words, we send the challenge widget in the HTML for the queuing page, but sometimes those challenges never get completed. By subtracting the number of times we see solved challenges from the total number of times we send challenges, we can get a count of requests that are likely from unsophisticated bots. These requests are reported to Waiting Room Analytics as “Likely Bots.” We’ve seen small businesses with low baseline traffic hit with tens of thousands of such requests (or more) in a short period of time. When a large influx of non-human traffic like this comes in, every visitor to the website ends up queued in a waiting room, not just the bots.
These bots could be any software that simply sends out HTTP requests. This data can help determine whether a traffic spike and subsequent queueing is coming from real human users, or a bunch of simple bots that don’t even bother to run JavaScript.
With the Turnstile integration, we are also catching sophisticated bots. While many of the bots we see don’t attempt to run the challenge, there are a few that do. Detecting these bots is more difficult than detecting simple bots that don’t run JavaScript. The Turnstile widget runs a series of checks against the browser to find evidence that a browser isn’t being operated by a human, and is instead being driven by something like Selenium. If Turnstile isn’t able to determine that the browser is being operated by a human, we count that as a failed challenge and report those users to Waiting Room Analytics as “Bots,” since we are quite confident that these users are not human.
About 1 in 20 “users” that run the challenge end up not passing. Just like the previously mentioned unsophisticated bots, these more sophisticated bots inflate the size of the queue, making it more difficult for real humans to make it through to your website.
The remaining 19 in 20 “users” that successfully pass the challenge are counted in Waiting Room Analytics as “Likely Humans.”
These new metrics related to Turnstile challenge outcomes are available in your Waiting Room Analytics dashboard and the analytics GraphQL API, so you can see the distribution of bot to human traffic in your waiting room. Once you know what your traffic looks like, the real question is: what can you do about it?
View the distribution of traffic and challenges issued in Waiting Room Analytics
New Infinite Queue feature
Beyond logging your Turnstile challenge outcomes, Advanced Waiting Room customers have the option to select the Infinite Queue feature. With this feature, all traffic that fails the Turnstile challenge, such as a bot, will be sent to an Infinite Queue page. The Infinite Queue matches the normal queuing experience, prolonging the time it takes the bot to recognize they are being blocked and effectively consuming their resources. While the Infinite Queue will have the same look and feel as the Waiting Room page, the bot is not actually a part of the real queue.
With the infinite Queue enabled, all traffic will have to pass the challenge to enter the real queue. By blocking bots from joining the queue, we will reduce wait times for humans and prevent bots from using up server resources during a traffic spike.
Enable the Infinite Queue option through the Cloudflare dashboard or API.
Bots will be none the wiser, wasting their time and resources waiting in an infinite queue that will never get them to where they’re trying to go.
We keep track of the traffic hitting the infinite queue, counting the number of times they refresh their queuing page in Waiting Room Analytics. This appears as the “infinite queue refreshes” count in the analytics dash and GraphQL API. This metric gives you a good idea of the amount of time these bots have wasted trying to reach your website.
How Waiting Room integrates with Turnstile
Turnstile is a powerful and versatile product that anyone, Cloudflare and others alike, can use to build systems to thwart bot traffic. Waiting Room integrates Turnstile the same as any other Turnstile user.
<!DOCTYPE html>
<html>
	<head>
		<title>Waiting Room</title>
	</head>
	<body>
		<h1>You are currently in the queue.</h1>
		{{#waitTimeKnown}}
			<h2>Your estimated wait time is {{waitTimeFormatted}}.</h2>
		{{/waitTimeKnown}}
		{{^waitTimeKnown}}
			<h2>Your estimated wait time is unknown.</h2>
		{{/waitTimeKnown}}
		{{#turnstile}}
			<!-- for a managed (and potentially interactive) challenge, you may want to instruct the user to complete the challenge -->
			<p>Please complete this challenge so we know you're a human:</p>
			{{{turnstile}}} <!-- include the turnstile widget -->
		{{/turnstile}}
	</body>
</html>
The Turnstile widget can be embedded in custom queuing page templates by including the {{{turnstile}}} variable.
<!DOCTYPE html>
<html>
	<head>
		<title>Waiting Room</title>
	</head>
	<body>
		{{#turnstile}}
			<h1>This website is currently using a waiting room.</h1>
			<p>We use a Turnstile challenge to ensure you aren't waiting in line behind bots. Complete this challenge to enter the queue.</p>
			{{{turnstile}}} <!-- include the turnstile widget -->
		{{/turnstile}}
		{{^turnstile}}
			<h1>You are currently in the queue.</h1>
			{{#waitTimeKnown}}
				<h2>Your estimated wait time is {{waitTimeFormatted}}.</h2>
			{{/waitTimeKnown}}
			{{^waitTimeKnown}}
				<h2>Your estimated wait time is unknown.</h2>
			{{/waitTimeKnown}}
		{{/turnstile}}
	</body>
</html>
When using Infinite Queue (especially with managed challenges which may be interactive), you may want to tell users they will not be in the queue until they complete the challenge.
We embed a plain Turnstile challenge in the queuing page by passing the HTML to the queuing page template in a turnstile variable. The default queuing page template and any newly created custom templates include this variable already. If you have an existing custom HTML template and wish to enable the Turnstile integration, you will need to add {{{turnstile}}} somewhere in the template to tell Waiting Room where the widget should be placed. Waiting Room uses Mustache templates, so including raw HTML within your template without escaping requires three curly braces instead of two.
A managed Turnstile challenge on the default Waiting Room queuing page template
Once the challenge completes, fails, or times out, the page refreshes and passes the Turnstile token to Waiting Room’s worker. Next, we check in with Turnstile’s siteverify endpoint to make sure the challenge was successful. From there, we report the outcome to the Waiting Room’s analytics and optionally send failed traffic (bots) to an infinite queue.
The infinite queue itself is designed to be as close to normal queuing as possible. When a bot is sent to the infinite queue, we issue it a cookie which looks like a normal waiting room cookie. Inside the cookie’s encryption though, we have a boolean flag that tells our worker to send the bot’s requests to the infinite queue. When we see that flag, we skip all the normal queuing logic and just render a queuing page.
That queuing page shows a fake estimated time remaining. It’s based on an asymptotic curve which appears to decrease linearly from the start. As time goes on, the curve gets flatter (and progress through the “queue” gets slower), so the estimated time remaining never quite reaches 0.
This graph is an approximation of the time remaining (y-axis, minutes) that bots will see, compared to the amount of time they’ve waited in the infinite queue (x-axis, minutes).
We reuse much of the same code for rendering the queuing page for the infinite queue and the normal queue. We do this to reduce the amount of signal bots may have that they are in the infinite queue rather than the normal queue.
let cookie
if (query['cf_wr_turnstile']) {
    const turnstileToken = query['cf_wr_turnstile']
    const tokenOk = await siteverify(turnstileToken)
    if (tokenOk) {
        analytics.turnstileSuccesses++
        cookie = newCookie()
    } else {
        analytics.turnstileFailures++
        cookie = { infiniteQueuing: true }
    }
    response.headers['Set-Cookie'] = encryptCookie(cookie)
}
if (!cookie) {
    cookie = decryptCookie(headers['Cookie'])
}
if (!cookie) {
    analytics.turnstileChallenges++
    return await queuingPage(await estimateTimeRemaining(), { turnstileChallenge: true })
} else if (cookie.infiniteQueuing) {
    analytics.infiniteQueueRequests++
    return await queuingPage(fakeTimeRemaining())
} else if (cookie.accepted) {
    return await sendToOrigin()
} else {
    // run Waiting Room's distributed queuing logic to check whether
    // this user has made it to the front of the queue, but only after
    // the user has completed a Turnstile challenge and isn't in the
    // fake infinite queue
    const { letThrough, timeRemaining } = calculateQueuing(cookie)
    if (letThrough) {
        cookie.accepted = true
        response.headers['Set-Cookie'] = encryptCookie(cookie)
        return await sendToOrigin()
    } else {
        return await queuingPage(timeRemaining)
    }
}
Approximate psuedocode for how we handle incoming requests when infinite queue is enabled in the Waiting Room worker
Thanks to the versatility of Turnstile, we only needed to rely on public Turnstile APIs to build this integration.
Adding Turnstile to Waiting Room is a proactive step in managing traffic that directly contributes to a smoother, faster experience for end users. Building on that efficiency, let’s dive into how you can add an additional layer of control to increase throughput and minimize wait times for your customers.
Further improve wait times using session revocation
We have talked extensively in a previous blog post about how we queue users with respect to the current active users on the application and the defined limits, and, in the same blog post, what state and calculations we use to determine the amount of total active users. Here is a quick summary for those who have not read that post:
When a user navigates to a page behind a waiting room, they receive a cookie and are associated with a time period called a bucket. We use these buckets to track the number of users either waiting in the queue or accessing the application for that specific time period. Whenever a user makes a request, we move their session from their previous bucket to the latest bucket. Once a bucket is older than the configured session duration, we know that those user sessions are no longer valid (expired) and we can clean up those values. Thus, that user session expires, and new slots are opened for the next users to enter the application.
These buckets are aggregated at Cloudflare data centers and then globally via the internal state of the waiting room, which is structured as multiple CRDT counters and registers. This allows us to merge the distributed state of the waiting room stored in multiple data centers as a single global state without conflicts.
To calculate the total active users on an application, we first merge the state from all data centers. Then, we sum the active users for all the buckets where a session can still be active.
Because the Waiting Room runs per user request, we do not explicitly know when a user has stopped accessing the application, and instead we only stop receiving requests from them. So, we must consider their session active and as a contributor to the total active users count until it is older than the session duration limit. For waiting rooms that have a high session duration value configured, a user might navigate to the site for a small duration of time but contribute to the total active users count for up to the configured session duration even after they have stopped accessing the application. This can cause decreased throughput and longer wait times for users in the queue.
Introducing Session Revocation
With the Session Revocation feature, we now allow origins to return a command to the waiting room via an HTTP header (Cf-Waiting-Room-Command) to notify the Waiting Room to revoke the user session associated with the current response. This command removes the current user’s session and decreases the number of total active users for the bucket the session was last tracked in. This allows origins to terminate a user’s session early without needing to wait for the session to expire naturally.
This can improve the throughput of waiting rooms in front of applications which have a dynamic user flow where the session duration is set very high to account for users who send infrequent requests to the application.
To set up session revocation in your waiting room, in the user session settings section in the configuration, check the “Allow session termination via origin commands” box. You must also configure your origin to return a session revocation HTTP header (Cf-Waiting-Room-Command: revoke) on the response when you want the session associated with that response to be revoked. For more information on how to do this, refer to our developer documentation.
Enable session revocation in the user session settings configuration
In Waiting Room Analytics, you can view the number of sessions revoked per minute. The sessionsRevokedfield is the count of how many sessions were revoked in that minute in the analytics GraphQL API.
In summary, Waiting Room Turnstile Integration and Session Revocation work together to enhance both security and user experience. The addition of a Turnstile challenge in the Waiting Room helps identify and block bots, ensuring that legitimate users don’t face unnecessary delays. Meanwhile, the Session Revocation feature optimizes resource usage by allowing you to end user sessions after key actions, like completing a purchase, freeing up space for other users.
Together, these features successfully increase throughput and reduce wait times, providing a faster, more efficient experience for your customers. For more information on these features, check out our developer documentation.
At Cloudflare, we are constantly innovating and launching new features and capabilities across our product portfolio. Today’s roundup blog post shares two exciting updates across our platform: our cross-platform 1.1.1.1 & WARP applications (consumer) and device agents (Zero Trust) now use MASQUE, a cutting-edge HTTP/3-based protocol, to secure your Internet connection. Additionally, DEX is now available for general availability.
Faster and more stable: our 1.1.1.1 & WARP apps now use MASQUE by default
We’re excited to announce that as of today, our cross-platform 1.1.1.1 & WARP apps now use MASQUE, a cutting-edge HTTP/3-based protocol, to secure your Internet connection.
As a reminder, our 1.1.1.1 & WARP apps have two main functions: send all DNS queries through 1.1.1.1, our privacy-preserving DNS resolver, and protect your device’s network traffic via WARP by creating a private and encrypted tunnel to the resources you’re accessing, preventing unwanted third parties or public Wi-Fi networks from snooping on your traffic.
There are many ways to encrypt and proxy Internet traffic — you may have heard of a few, such as IPSec, WireGuard, or OpenVPN. There are many tradeoffs we considered when choosing a protocol, but we believe MASQUE is the future of fast, secure, and stable Internet proxying, it aligns with our belief in building on top of open Internet standards, and we’ve deployed it successfully at scale for customers like iCloud Private Relay and Microsoft Edge Secure Network.
Why MASQUE?
MASQUE is a modern framework for proxying traffic that allows a variety of application protocols, including HTTP/3, to utilize QUIC as their transport mechanism. That’s a lot of acronyms, so let’s make sure those are clear.
QUIC is a general-purpose transport protocol and Internet standard that operates on top of UDP (instead of TCP), is encrypted by default, and solves several performance issues that plagued its predecessors. HTTP/3is the latest version of the HTTP protocol, defining the application-layer protocol that runs on top of QUIC as its transport mechanism. MASQUE is a set of mechanisms for tunneling traffic over HTTP. It extends the existing HTTP CONNECT model, to allow tunneling UDP and IP traffic. This is especially efficient when combined with the QUIC’s unreliable datagram extension.
For example, we can use MASQUE’s CONNECT-IP method to establish a tunnel that can send multiple concurrent requests over a single QUIC connection:
The benefit these protocols have for the quality and security of everyone’s Internet browsing experience is real. Earlier transport protocols were built before the advent of smartphones and mobile networks, so QUIC was designed to support a mobile world, maintaining connections even in poorly connected networks, and minimizing disruptions as people switch rapidly between networks as they move through their day. Leveraging HTTP/3 as the application layer means that MASQUE is more like “normal” HTTP traffic on the Internet, meaning that it is easier to support, is compatible with existing firewall and security rules, and that it supports cryptographic agility (i.e. support for post-quantum crypto), making this traffic more secure and resilient in the long term.
Get started now
All new installations of our 1.1.1.1 & WARP apps support MASQUE, including iOS, Android, macOS, Windows, and Linux, and we’ve started to roll it out as the preferred protocol over WireGuard. On mobile, to check if your connection is already secured over MASQUE, or change your device’s default option, you can toggle this setting via Advanced > Connection options > Tunnel protocol:
Protocol connection options shown here on the iOS app
We offer the following options:
Auto: this allows the app to choose the protocol.
MASQUE: always use MASQUE to secure your connection.
WireGuard: always use WireGuard to secure your connection.
On desktop versions, you can switch the protocol by using the WARP command-line interface. For example:
warp-cli tunnel protocol set WireGuard
warp-cli tunnel protocol set MASQUE
With this rollout, we’re excited to see MASQUE deliver increased performance and stability to millions of users. Download one of the WARP apps today!
DEX now Generally Available: Announcing detailed device visibility with DEX Remote Captures
Following the successful beta launch of Digital Experience Monitoring (DEX), we are thrilled to announce the general availability of DEX, along with new Remote Captures functionality.
Imagine this: an end user is frustrated with a slow application, and your IT team is struggling to pinpoint the root cause. Traditionally, troubleshooting such issues involved contacting the end user and asking them to manually collect and share network traffic data. This process is time-consuming, prone to errors, and often disruptive to the end user’s workflow.
Building upon the capabilities of DEX, we are excited to introduce Remote Captures, a powerful new feature that empowers IT admins to gain unprecedented visibility into end-user devices and network performance. DEX now introduces Remote Captures, a powerful new feature that empowers IT admins to remotely initiate network packet captures (PCAP) and WARP Diag logs directly from your end users’ devices and capture diagnostic information automatically from our device client. This streamlined approach accelerates troubleshooting, reduces the burden on end users, and provides valuable insights into network performance and security.
Why Remote Captures?
Remote Captures offer several key advantages. By analyzing detailed network traffic, IT teams can quickly pinpoint the root cause of network issues. Furthermore, granular network data empowers security teams to proactively detect and investigate potential threats. Finally, by identifying bottlenecks and latency issues, Remote Captures enable organizations to optimize network performance for a smoother user experience.
How Remote Captures work
Initiating a Remote Capture is straightforward. First, select the specific device you wish to troubleshoot. Then, with a few simple clicks, start capturing network traffic and/or WARP Diag data. Once the capture is complete, download the captured data and utilize your preferred tools for in-depth analysis.
Get started today
DEX Remote Captures are now available for Cloudflare One customers. They can be configured by going to Cloudflare Dashboard > Zero Trust > DEX > Remote Captures, and then selecting the device you wish to collect from. For more information, refer to Remote captures. This new capability highlights just one of the many ways our unified SASE platform helps organizations find and fix security issues across SaaS applications. Try it out now using our free tier to get started.
Never miss an update
We hope you enjoy reading our roundup blog posts as we continue to build and innovate. Stay tuned to the Cloudflare Blog for the latest news and updates.
In October 2024, we started publishing roundup blog posts to share the latest features and updates from our teams. Today, we are announcing general availability for Account Owned Tokens, which allow organizations to improve access control for their Cloudflare services. Additionally, we are launching Zaraz Automated Actions, which is a new feature designed to streamline event tracking and tool integration when setting up third-party tools. By automating common actions like pageviews, custom events, and e-commerce tracking, it removes the need for manual configurations.
Improving access control for Cloudflare services with Account Owned Tokens
Cloudflare is critical infrastructure for the Internet, and we understand that many of the organizations that build on Cloudflare rely on apps and integrations outside the platform to make their lives easier. In order to allow access to Cloudflare resources, these apps and integrations interact with Cloudflare via our API, enabled by access tokens and API keys. Today, the API Access Tokens and API keys on the Cloudflare platform are owned by individual users, which can lead to some difficulty representing services, and adds an additional dependency on managing users alongside token permissions.
What’s new about Account Owned Tokens
First, a little explanation because the terms can be a little confusing. On Cloudflare, we have both Users and Accounts, and they mean different things, but sometimes look similar. Users are people, and they sign in with an email address. Accounts are not people, they’re the top-level bucket we use to organize all the resources you use on Cloudflare. Accounts can have many users, and that’s how we enable collaboration. If you use Cloudflare for your personal projects, both your User and Account might have your email address as the name, but if you use Cloudflare as a company, the difference is more apparent because your user is “[email protected]” and the account might be “Example Company”.
Account Owned Tokens are not confined by the permissions of the creating user (e.g. a user can never make a token that can edit a field that they otherwise couldn’t edit themselves) and are scoped to the account they are owned by. This means that instead of creating a token belonging to the user “[email protected]”, you can now create a token belonging to the account “Example Company”.
The ability to make these tokens, owned by the account instead of the user, allows for more flexibility to represent what the access should be used for.
Prior to Account Owned Tokens, customers would have to have a user ([email protected]) create a token to pull a list of Cloudflare zones for their account and ensure their security settings are set correctly as part of a compliance workflow, for example. All of the actions this compliance workflow does are now attributed to joe.smith, and if joe.smith leaves the company and his permissions are revoked, the compliance workflow fails.
With this new release, an Account Owned Token could be created, named “compliance workflow”, with permissions to do this operation independently of [email protected]. All actions this token does are attributable to “compliance workflow”. This token is visible and manageable by all the superadmins on your Cloudflare account. If joe.smith leaves the company, the access remains independent of that user, and all super administrators on the account moving forward can still see, edit, roll, and delete the token as needed.
Any long-running services or programs can be represented by these types of tokens, be made visible (and manageable) by all super administrators in your Cloudflare account, and truly represent the service, instead of the users managing the service. Audit logs moving forward will log that a given token was used, and user access can be kept to a minimum.
Getting started
Account Owned Tokens can be found on the new “API Tokens” tab under the “Manage Account” section of your Cloudflare dashboard, and any Super Administrators on your account have the capability to create, edit, roll, and delete these tokens. The API is the same, but at a new /account/<accountId>/tokens endpoint.
Why/where should I use Account Owned Tokens?
There are a few places we would recommend replacing your User Owned Tokens with Account Owned Tokens:
1. Long-running services that are managed by multiple people: When multiple users all need to manage the same service, Account Owned Tokens can remove the bottleneck of requiring a single person to be responsible for all the edits, rotations, and deletions of the tokens. In addition, this guards against any user lifecycle events affecting the service. If the employee that owns the token for your service leaves the company, the service’s token will no longer be based on their permissions.
2. Cloudflare accounts running any services that need attestable access records beyond user membership: By restricting all of your users from being able to access the API, and consolidating all usable tokens to a single list at the account level, you can ensure that a complete list of all API access can be found in a single place on the dashboard, under “Account API Tokens”.
3. Anywhere you’ve created “Service Users”: “Service Users”, or any identity that is meant to allow multiple people to access Cloudflare, are an active threat surface. They are generally highly privileged, and require additional controls (vaulting, password rotation, monitoring) to ensure non-repudiation and appropriate use. If these operations solely require API access, consolidating that access into an Account Owned Token is safe.
Why/where should I use User Owned Tokens?
There are a few scenarios/situations where you should continue to use User Owned Tokens:
Where programmatic access is done by a single person at an external interface: If a single user has an external interface using their own access privileges at Cloudflare, it still makes sense to use a personal token, so that information access can be traced back to them. (e.g. using a personal token in a data visualization tool that pulls logs from Cloudflare)
User level operations: Any operations that operate on your own user (e.g. email changes, password changes, user preferences) still require a user level token.
Where you want to control resources over multiple accounts with the same credential: As of November 2024, Account Owned Tokens are scoped to a single account. In 2025, we want to ensure that we can create cross-account credentials, anywhere that multiple accounts have to be called in the same set of operations should still rely on API Tokens owned by a user.
Where we currently do not support a given endpoint: We are currently in the process of working through a list of our services to ensure that they all support Account Owned Tokens. When interacting with any of these services that are not supported programmatically, please continue to use User Owned Tokens.
Where you need to do token management programmatically: If you are in an organization that needs to create and delete large numbers of tokens programmatically, please continue to use User Owned Tokens. In late 2024, watch for the “Create Additional Tokens” template on the Account Owned Tokens Page. This template and associated created token will allow for the management of additional tokens.
What does this mean for my existing tokens and programmatic access moving forward?
We do not plan to decommission User Owned Tokens, as they still have a place in our overall access model and are handy for ensuring user-centric workflows can be implemented.
As of November 2024, we’re still working to ensure that ALL of our endpoints work with Account Owned Tokens, and we expect to deliver additional token management improvements continuously, with an expected end date of Q3 2025 to cover all endpoints.
A list of services that support, and do not support, Account Owned Tokens can be found in our documentation.
What’s next?
If Account Owned Tokens could provide value to your or your organization, documentation is available here, and you can give them a try today from the “API Tokens” menu in your dashboard.
Zaraz Automated Actions makes adding tools to your website a breeze
Cloudflare Zaraz is a tool designed to manage and optimize third-party tools like analytics, marketing tags, or social media scripts on websites. By loading these third-party services through Cloudflare’s network, Zaraz improves website performance, security, and privacy. It ensures that these external scripts don’t slow down page loading times or expose sensitive user data, as it handles them efficiently through Cloudflare’s global network, reducing latency and improving the user experience.
Automated Actions are a new product feature that allow users to easily setup page views, custom events, and e-commerce tracking without going through the tedious process of manually setting up triggers and actions.
Why we built Automated Actions
An action in Zaraz is a way to tell a third party tool that a user interaction or event has occurred when certain conditions, defined by triggers, are met. You create actions from within the tools page, associating them with specific tools and triggers.
Setting up a tool in Zaraz has always involved a few steps: configuring a trigger, linking it to a tool action and finally calling zaraz.track(). This process allowed advanced configurations with complex rules, and while it was powerful, it occasionally left users confused — why isn’t calling zaraz.track() enough? We heard your feedback, and we’re excited to introduce Zaraz Automated Actions, a feature designed to make Zaraz easier to use by reducing the amount of work needed to configure a tool.
With Zaraz Automated Actions, you can now automate sending data to your third-party tools without the need to create a manual configuration. Inspired by the simplicity of zaraz.ecommerce(), we’ve extended this ease to all Zaraz events, removing the need for manual trigger and action setup. For example, calling zaraz.track(‘myEvent’) will send your event to the tool without the need to configure any triggers or actions.
Getting started with Automated Actions
When adding a new tool in Zaraz, you’ll now see an additional step where you can choose one of three Automated Actions: pageviews, all other events, or ecommerce. These options allow you to specify what kind of events you want to automate for that tool.
Pageviews: Automatically sends data to the tool whenever someone visits a page on your site, without any manual configuration.
All other events: Sends all custom events triggered using zaraz.track() to the selected tool, making it easy to automate tracking of user interactions.
Ecommerce: Automatically sends all e-commerce events triggered via zaraz.ecommerce() to the tool, streamlining your sales and transaction tracking.
These Automated Actions are also available for all your existing tools, which can be toggled on or off from the tool detail page in your Zaraz dashboard. This flexibility allows you to fine-tune which actions are automated based on your needs.
Custom actions for tools without Automated Action support
Some tools do not support automated actions because the tool itself does not support page view, custom, or e-commerce events. For such tools you can still create your own custom actions, just like before. Custom actions allow you to configure specific events to send data to your tools based on unique triggers. The process remains the same, and you can follow the detailed steps outlined in ourCreate Actions guide. Remember to set up your trigger first, or choose an existing one, before configuring the action.
Automatically enrich your payload
When creating a custom action, it is now easier to send Event Properties using the Include Event Properties field. When this is toggled on, you can automatically send client-specific data with each action, such as user behavior or interaction details. For example, to send an userID property when sending a click event you can do something like this: zaraz.track(‘click’, { userID: “foo” }).
Additionally, you can enable the Include System Properties option to send system-level information, such as browser, operating system, and more. In your action settings click on “Add Field”, pick the “Include System Properties”, click on confirm and then toggle the field on.
For a full list of system properties, visit ourSystem Properties reference guide. These options give you greater flexibility and control over the data you send with custom actions.
These two fields replace the now deprecated “Enrich Payload” dropdown field.
Zaraz Automated Actions marks a significant step forward in simplifying how you manage events across your tools. By automating common actions like page views, e-commerce events, and custom tracking, you can save time and reduce the complexity of manual configurations. Whether you’re leveraging Automated Actions for speed or creating custom actions for more tailored use cases, Zaraz offers the flexibility to fit your workflow.
We’re excited to see how you use this feature. Please don’t hesitate to reach out to us on Cloudflare Zaraz’s Discord Channel — we’re always there fixing issues, listening to feedback, and announcing exciting product updates.
Never miss an update
We’ll continue to share roundup blog posts as we continue to build and innovate. Be sure to follow along on the Cloudflare Blog for the latest news and updates.
Cloudflare Queues let a developer decouple their Workers into event-driven services. Producer Workers write events to a Queue, and consumer Workers are invoked to take actions on the events. For example, you can use a Queue to decouple an e-commerce website from a service which sends purchase confirmation emails to users. During 2024’s Birthday Week, we announced that Cloudflare Queues is now Generally Available, with significant performance improvements that enable larger workloads. To accomplish this, we switched to a new architecture for Queues that enabled the following improvements:
Median latency for sending messages has dropped from ~200ms to ~60ms
Maximum throughput for each Queue has increased over 10x, from 400 to 5000 messages per second
Maximum Consumer concurrency for each Queue has increased from 20 to 250 concurrent invocations
Median latency drops from ~200ms to ~60ms as Queues are migrated to the new architecture
In this blog post, we’ll share details about how we built Queues using Durable Objects and the Cloudflare Developer Platform, and how we migrated from an initial Beta architecture to a geographically-distributed, horizontally-scalable architecture for General Availability.
v1 Beta architecture
When initially designing Cloudflare Queues, we decided to build something simple that we could get into users’ hands quickly. First, we considered leveraging an off-the-shelf messaging system such as Kafka or Pulsar. However, we decided that it would be too challenging to operate these systems at scale with the large number of isolated tenants that we wanted to support.
Instead of investing in new infrastructure, we decided to build on top of one of Cloudflare’s existing developer platform building blocks: Durable Objects.Durable Objects are a simple, yet powerful building block for coordination and storage in a distributed system. In our initial v1 architecture, each Queue was implemented using a single Durable Object. As shown below, clients would send messages to a Worker running in their region, which would be forwarded to the single Durable Object hosted in the WNAM (Western North America) region. We used a single Durable Object for simplicity, and hosted it in WNAM for proximity to our centralized configuration API service.
One of a Queue’s main responsibilities is to accept and store incoming messages. Sending a message to a v1 Queue used the following flow:
A client sends a POST request containing the message body to the Queues API at /accounts/:accountID/queues/:queueID/messages
The request is handled by an instance of the Queue Broker Worker in a Cloudflare data center running near the client.
The Worker performs authentication, and then uses Durable Objects idFromName API to route the request to the Queue Durable Object for the given queueID
The Queue Durable Object persists the message to storage before returning a success back to the client.
Durable Objects handled most of the heavy-lifting here: we did not need to set up any new servers, storage, or service discovery infrastructure. To route requests, we simply provided a queueID and the platform handled the rest. To store messages, we used the Durable Object storage API to put each message, and the platform handled reliably storing the data redundantly.
Consuming messages
The other main responsibility of a Queue is to deliver messages to a Consumer. Delivering messages in a v1 Queue used the following process:
Each Queue Durable Object maintained an alarm that was always set when there were undelivered messages in storage. The alarm guaranteed that the Durable Object would reliably wake up to deliver any messages in storage, even in the presence of failures. The alarm time was configured to fire after the user’s selected max wait time, if only a partial batch of messages was available. Whenever one or more full batches were available in storage, the alarm was scheduled to fire immediately.
The alarm would wake the Durable Object, which continually looked for batches of messages in storage to deliver.
Each batch of messages was sent to a “Dispatcher Worker” that used Workers for Platformsdynamic dispatch to pass the messages to the queue() function defined in a user’s Consumer Worker
This v1 architecture let us flesh out the initial version of the Queues Beta product and onboard users quickly. Using Durable Objects allowed us to focus on building application logic, instead of complex low-level systems challenges such as global routing and guaranteed durability for storage. Using a separate Durable Object for each Queue allowed us to host an essentially unlimited number of Queues, and provided isolation between them.
However, using only one Durable Object per queue had some significant limitations:
Latency: we created all of our v1 Queue Durable Objects in Western North America. Messages sent from distant regions incurred significant latency when traversing the globe.
Throughput: A single Durable Object is not scalable: it is single-threaded and has a fixed capacity for how many requests per second it can process. This is where the previous 400 messages per second limit came from.
Consumer Concurrency: Due to concurrent subrequest limits, a single Durable Object was limited in how many concurrent subrequests it could make to our Dispatcher Worker. This limited the number of queue() handler invocations that it could run simultaneously.
To solve these issues, we created a new v2 architecture that horizontally scales across multiple Durable Objects to implement each single high-performance Queue.
v2 Architecture
In the new v2 architecture for Queues, each Queue is implemented using multiple Durable Objects, instead of just one. Instead of a single region, we place Storage Shard Durable Objects in all available regions to enable lower latency. Within each region, we create multiple Storage Shards and load balance incoming requests amongst them. Just like that, we’ve multiplied message throughput.
Sending a message to a v2 Queue uses the following flow:
A client sends a POST request containing the message body to the Queues API at /accounts/:accountID/queues/:queueID/messages
The request is handled by an instance of the Queue Broker Worker running in a Cloudflare data center near the client.
The Worker:
Performs authentication
Reads from Workers KV to obtain a Shard Map that lists available storage shards for the given region and queueID
Picks one of the region’s Storage Shards at random, and uses Durable Objects idFromName API to route the request to the chosen shard
The Storage Shard persists the message to storage before returning a success back to the client.
In this v2 architecture, messages are stored in the closest available Durable Object storage cluster near the user, greatly reducing latency since messages don’t need to be shipped all the way to WNAM. Using multiple shards within each region removes the bottleneck of a single Durable Object, and allows us to scale each Queue horizontally to accept even more messages per second. Workers KV acts as a fast metadata store: our Worker can quickly look up the shard map to perform load balancing across shards.
To improve the Consumer side of v2 Queues, we used a similar “scale out” approach. A single Durable Object can only perform a limited number of concurrent subrequests. In v1 Queues, this limited the number of concurrent subrequests we could make to our Dispatcher Worker. To work around this, we created a new Consumer Shard Durable Object class that we can scale horizontally, enabling us to execute many more concurrent instances of our users’ queue() handlers.
Consumer Durable Objects in v2 Queues use the following approach:
Each Consumer maintains an alarm that guarantees it will wake up to process any pending messages. v2 Consumers are notified by the Queue’s Coordinator (introduced below) when there are messages ready for consumption. Upon notification, the Consumer sets an alarm to go off immediately.
The Consumer looks at the shard map, which contains information about the storage shards that exist for the Queue, including the number of available messages on each shard.
The Consumer picks a random storage shard with available messages, and asks for a batch.
The Consumer sends the batch to the Dispatcher Worker, just like for v1 Queues.
After processing the messages, the Consumer sends another request to the Storage Shard to either “acknowledge” or “retry” the messages.
This scale-out approach enabled us to work around the subrequest limits of a single Durable Object, and increase the maximum supported concurrency level of a Queue from 20 to 250.
The Coordinator and “Control Plane”
So far, we have primarily discussed the “Data Plane” of a v2 Queue: how messages are load balanced amongst Storage Shards, and how Consumer Shards read and deliver messages. The other main piece of a v2 Queue is the “Control Plane”, which handles creating and managing all the individual Durable Objects in the system. In our v2 architecture, each Queue has a single Coordinator Durable Object that acts as the brain of the Queue. Requests to create a Queue, or change its settings, are sent to the Queue’s Coordinator.
The Coordinator maintains a Shard Map for the Queue, which includes metadata about all the Durable Objects in the Queue (including their region, number of available messages, current estimated load, etc.). The Coordinator periodically writes a fresh copy of the Shard Map into Workers KV, as pictured in step 1 of the diagram. Placing the shard map into Workers KV ensures that it is globally cached and available for our Worker to read quickly, so that it can pick a shard to accept the message.
Every shard in the system periodically sends a heartbeat to the Coordinator as shown in steps 2 and 3 of the diagram. Both Storage Shards and Consumer Shards send heartbeats, including information like the number of messages stored locally, and the current load (requests per second) that the shard is handling. The Coordinator uses this information to perform autoscaling. When it detects that the shards in a particular region are overloaded, it creates additional shards in the region, and adds them to the shard map in Workers KV. Our Worker sees the updated shard map and naturally load balances messages across the freshly added shards. Similarly, the Coordinator looks at the backlog of available messages in the Queue, and decides to add more Consumer shards to increase Consumer throughput when the backlog is growing. Consumer Shards pull messages from Storage Shards for processing as shown in step 4 of the diagram.
Switching to a new scalable architecture allowed us to meet our performance goals and take Queues to GA. As a recap, this new architecture delivered these significant improvements:
P50 latency for writing to a Queue has dropped from ~200ms to ~60ms.
Maximum throughput for a Queue has increased from 400 to 5000 messages per second.
Maximum consumer concurrency has increased from 20 to 250 invocations.
What’s next for Queues
We plan on leveraging the performance improvements in the new beta version of Durable Objects which use SQLite to continue to improve throughput/latency in Queues.
We will soon be adding message management features to Queues so that you can take actions to purge messages in a queue, pause consumption of messages, or “redrive”/move messages from one queue to another (for example messages that have been sent to a Dead Letter Queue could be “redriven” or moved back to the original queue).
Work to make Queues the “event hub” for the Cloudflare Developer Platform:
Create a low-friction way for events emitted from other Cloudflare services with event schemas to be sent to Queues.
Build multi-Consumer support for Queues so that Queues are no longer limited to one Consumer per queue.
To start using Queues, head over to our Getting Started guide.
Do distributed systems like Cloudflare Queues and Durable Objects interest you? Would you like to help build them at Cloudflare? We’re Hiring!
We’re excited to announce that Kivera, a cloud security, data protection, and compliance company, has joined Cloudflare. This acquisition extends our SASE portfolio to incorporate inline cloud app controls, empowering Cloudflare One customers with preventative security controls for all their cloud services.
In today’s digital landscape, cloud services and SaaS (software as a service) apps have become indispensable for the daily operation of organizations. At the same time, the amount of data flowing between organizations and their cloud providers has ballooned, increasing the chances of data leakage, compliance issues, and worse, opportunities for attackers. Additionally, many companies — especially at enterprise scale — are working directly with multiple cloud providers for flexibility based on the strengths, resiliency against outages or errors, and cost efficiencies of different clouds.
Security teams that rely on Cloud Security Posture Management (CSPM) or similar tools for monitoring cloud configurations and permissions and Infrastructure as code (IaC) scanning are falling short due to detecting issues only after misconfigurations occur with an overwhelming volume of alerts. The combination of Kivera and Cloudflare One puts preventive controls directly into the deployment process, or ‘inline’, blocking errors before they happen. This offers a proactive approach essential to protecting cloud infrastructure from evolving cyber threats, maintaining data security, and accelerating compliance.
An early warning system for cloud security risks
In a significant leap forward in cloud security, the combination of Kivera’s technology and Cloudflare One adds preventive, inline controls to enforce secure configurations for cloud resources. By inspecting cloud API traffic, these new capabilities equip organizations with enhanced visibility and granular controls, allowing for a proactive approach in mitigating risks, managing cloud security posture, and embracing a streamlined DevOps process when deploying cloud infrastructure.
Kivera will add the following capabilities to Cloudflare’s SASE platform:
One-click security: Customers benefit from immediate prevention of the most common cloud breaches caused by misconfigurations, such as accidentally allowing public access or policy inconsistencies.
Enforced cloud tenant control: Companies can easily draw boundaries around their cloud resources and tenants to ensure that sensitive data stays within their organization.
Prevent data exfiltration: Easily set rules to prevent data being sent to unauthorized locations.
Reduce ‘shadow’ cloud infrastructure: Ensure that every interaction between a customer and their cloud provider is in line with preset standards.
Streamline cloud security compliance: Customers can automatically assess and enforce compliance against the most common regulatory frameworks.
Flexible DevOps model: Enforce bespoke controls independent of public cloud setup and deployment tools, minimizing the layers of lock-in between an organization and a cloud provider.
Complementing other cloud security tools: Create a first line of defense for cloud deployment errors, reducing the volume of alerts for customers also using CSPM tools or Cloud Native Application Protection Platforms (CNAPPs).
An intelligent proxy that uses a policy-based approach to
enforce secure configuration of cloud resources.
Better together with Cloudflare One
As a SASE platform, Cloudflare One ensures safe access and provides data controls for cloud and SaaS apps. This integration broadens the scope of Cloudflare’s SASE platform beyond user-facing applications to incorporate increased cloud security through proactive configuration management of infrastructure services, beyond what CSPM and CASB solutions provide. With the addition of Kivera to Cloudflare One, customers now have a unified platform for all their inline protections, including cloud control, access management, and threat and data protection. All of these features are available with single-pass inspection, which is 50% faster than Secure Web Gateway (SWG) alternatives.
With the earlier acquisition of BastionZero, a Zero Trust infrastructure access company, Cloudflare One expanded the scope of its VPN replacement solution to cover infrastructure resources as easily as it does apps and networks. Together Kivera and BastionZero enable centralized security management across hybrid IT environments, and provide a modern DevOps-friendly way to help enterprises connect and protect their hybrid infrastructure with Zero Trust best practices.
Beyond its SASE capabilities, Cloudflare One is integral to Cloudflare’s connectivity cloud, enabling organizations to consolidate IT security tools on a single platform. This simplifies secure access to resources, from developer privileged access to technical infrastructure and expanding cloud services. As Forrester echoes, “Cloudflare is a good choice for enterprise prospects seeking a high-performance, low-maintenance, DevOps-oriented solution.”
The growing threat of cloud misconfigurations
The cloud has become a prime target for cyberattacks. According to the 2023 Cloud Risk Report, CrowdStrike observed a 95% increase in cloud exploitation from 2021 to 2022, with a staggering 288% jump in cases involving threat actors directly targeting the cloud.
Misconfigurations in cloud infrastructure settings, such as improperly set security parameters and default access controls, provide adversaries with an easy path to infiltrate the cloud. According to the 2023 Thales Global Cloud Security Study, which surveyed nearly 3,000 IT and security professionals from 18 countries, 44% of respondents reported experiencing a data breach, with misconfigurations and human error identified as the leading cause, accounting for 31% of the incidents.
Further, according to GartnerⓇ, “Through 2027, 99% of records compromised in cloud environments will be the result of user misconfigurations and account compromise, not the result of an issue with the cloud provider.”1
Several factors contribute to the rise of cloud misconfigurations:
Rapid adoption of cloud services: Leaders are often driven by the scalability, cost-efficiency, and ability to support remote work and real-time collaboration that cloud services offer. These factors enable rapid adoption of cloud services which can lead to unintentional misconfigurations as IT teams struggle to keep up with the pace and complexity of these services.
Complexity of cloud environments: Cloud infrastructure can be highly complex with multiple services and configurations to manage. For example, AWS alone offers 373 services with 15,617 actions and 140,000+ parameters, making it challenging for IT teams to manage settings accurately.
Decentralized management: In large organizations, cloud infrastructure resources are often managed by multiple teams or departments. Without centralized oversight, inconsistent security policies and configurations can arise, increasing the risk of misconfigurations.
Continuous Integration and Continuous Deployment (CI/CD): CI/CD pipelines promote the ability to rapidly deploy, change and frequently update infrastructure. With this velocity comes the increased risk of misconfigurations when changes are not properly managed and reviewed.
Insufficient training and awareness: Employees may lack the cross-functional skills needed for cloud security, such as understanding networks, identity, and service configurations. This knowledge gap can lead to mistakes and increases the risk of misconfigurations that compromise security.
Common exploitation methods
Threat actors exploit cloud services through various means, including targeting misconfigurations, abusing privileges, and bypassing encryption. Misconfigurations such as exposed storage buckets or improperly secured APIs offer attackers easy access to sensitive data and resources. Privilege abuse occurs when attackers gain unauthorized access through compromised credentials or poorly managed identity and access management (IAM) policies, allowing them to escalate their access and move laterally within the cloud environment. Additionally, unencrypted data enables attackers to intercept and decrypt data in transit or at rest, further compromising the integrity and confidentiality of sensitive information.
Here are some other vulnerabilities that organizations should address:
Unrestricted access to cloud tenants: Allowing unrestricted access exposes cloud platforms to data exfiltration by malicious actors. Limiting access to approved tenants with specific IP addresses and service destinations helps prevent unauthorized access.
Exposed access keys: Exposed access keys can be exploited by unauthorized parties to steal or delete data. Requiring encryption for the access keys and restricting their usage can mitigate this risk.
Excessive account permissions: Granting excessive privileges to cloud accounts increases the potential impact of security breaches. Limiting permissions to necessary operations helps prevent lateral movement and privilege escalation by threat actors.
Inadequate network segmentation: Poorly managed network security groups and insufficient segmentation practices can allow attackers to move freely within cloud environments. Drawing boundaries around your cloud resources and tenants ensures that data stays within your organization.
Improper public access configuration: Incorrectly exposing critical services or storage resources to the internet increases the likelihood of unauthorized access and data compromise. Preventing public access drastically reduces risk.
Shadow cloud infrastructure: Abandoned or neglected cloud instances are often left vulnerable to exploitation, providing attackers with opportunities to access sensitive data left behind. Preventing untagged or unapproved cloud resources to be created can reduce the risk of exposure.
Limitations of existing tools
Many organizations turn to CSPM tools to give them more visibility into cloud misconfigurations. These tools often alert teams after an issue occurs, putting security teams in a reactive mode. Remediation efforts require collaboration between security teams and developers to implement changes, which can be time-consuming and resource-intensive. This approach not only delays issue resolution but also exposes companies to compliance and legal risks, while failing to train employees on secure cloud practices. On average, it takes 207 days to identify these breaches and an additional 70 days to contain them.
Addressing the growing threat of cloud misconfigurations requires proactive security measures and continuous monitoring. Organizations must adopt proactive security solutions that not only detect and alert but also prevent misconfigurations from occuring in the first place and enforce best practices. Creating a first line of defense for cloud deployment errors reduces the volume of alerts for customers, especially those also using CSPM tools or CNAPPs.
By implementing these proactive strategies, organizations can safeguard their cloud environments against the evolving landscape of cyber threats, ensuring robust security and compliance while minimizing risks and operational disruptions.
What’s next for Kivera
The Kivera product will not be a point solution add-on. We’re making it a core part of our Cloudflare One offering because integrating features from products like our Secure Web Gateway give customers a comprehensive solution that works better together.
We’re excited to welcome Kivera to the Cloudflare team. Through the end of 2024 and into early 2025, Kivera’s team will focus on integrating their preventive inline cloud app controls directly into Cloudflare One. We are looking for early access testers and teams to provide feedback about what they would like to see. If you’d like early access, please join the waitlist.
[1] Source: Outcome-Driven Metrics You Can Use to Evaluate Cloud Security Controls, Gartner, Charlie Winckless, Paul Proctor, Manuel Acosta, 09/28/2023
GARTNER is a registered trademark and service mark of Gartner, Inc. and/or its affiliates in the U.S. and internationally and is used herein with permission. All rights reserved.
The continued growth of AI has fundamentally changed the Internet over the past 24 months. AI is increasingly ubiquitous, and Cloudflare is leaning into the new opportunities and challenges it presents in a big way. This year for Cloudflare’s birthday, we’ve extended our AI Assistant capabilities to help you build new WAF rules, added AI bot traffic insights on Cloudflare Radar, and given customers new AI bot blocking capabilities.
AI Assistant for WAF Rule Builder
At Cloudflare, we’re always listening to your feedback and striving to make our products as user-friendly and powerful as possible. One area where we’ve heard your feedback loud and clear is in the complexity of creating custom and rate-limiting rules for our Web Application Firewall (WAF). With this in mind, we’re excited to introduce a new feature that will make rule creation easier and more intuitive: the AI Assistant for WAF Rule Builder.
By simply entering a natural language prompt, you can generate a custom or rate-limiting rule tailored to your needs. For example, instead of manually configuring a complex rule matching criteria, you can now type something like, “Match requests with low bot score,” and the assistant will generate the rule for you. It’s not about creating the perfect rule in one step, but giving you a strong foundation that you can build on.
The assistant will be available in the Custom and Rate Limit Rule Builder for all WAF users. We’re launching this feature in Beta for all customers, and we encourage you to give it a try. We’re looking forward to hearing your feedback (via the UI itself) as we continue to refine and enhance this tool to meet your needs.
AI bot traffic insights on Cloudflare Radar
AI platform providers use bots to crawl and scrape websites, vacuuming up data to use for model training. This is frequently done without the permission of, or a business relationship with, the content owners and providers. In July, Cloudflare urged content owners and providers to “declare their AIndependence”, providing them with a way to block AI bots, scrapers, and crawlers with a single click. In addition to this so-called “easy button” approach, sites can provide more specific guidance to these bots about what they are and are not allowed to access through directives in a robots.txt file. Regardless of whether a customer chooses to block or allow requests from AI-related bots, Cloudflare has insight into request activity from these bots, and associated traffic trends over time.
Tracking traffic trends for AI bots can help us better understand their activity over time — which are the most aggressive and have the highest volume of requests, which launch crawls on a regular basis, etc. The new AI bot & crawler traffic graph on Radar’s Traffic page provides insight into these traffic trends gathered over the selected time period for the top known AI bots. The associated list of bots tracked here is based on the ai.robots.txt list, and will be updated with new bots as they are identified. Time series and summary data is available from the Radar API as well. (Traffic trends for the full set of AI bots & crawlers can be viewed in the new Data Explorer.)
Blocking more AI bots
For Cloudflare’s birthday, we’re following up on our previous blog post, Declaring Your AIndependence, with an update on the new detections we’ve added to stop AI bots. Customers who haven’t already done so can simply click the button to block AI bots to gain more protection for their website.
Enabling dynamic updates for the AI bot rule
The old button allowed customers to block verified AI crawlers, those that respect robots.txt and crawl rate, and don’t try to hide their behavior. We’ve added new crawlers to that list, but we’ve also expanded the previous rule to include 27 signatures (and counting) of AI bots that don’t follow the rules. We want to take time to say “thank you” to everyone who took the time to use our “tip line” to point us towards new AI bots. These tips have been extremely helpful in finding some bots that would not have been on our radar so quickly.
For each bot we’ve added, we’re also adding them to our “Definitely automated” definition as well. So, if you’re a self-service plan customer using Super Bot Fight Mode, you’re already protected. Enterprise Bot Management customers will see more requests shift from the “Likely Bot” range to the “Definitely automated” range, which we’ll discuss more below.
Under the hood, we’ve converted this rule logic to a Cloudflare managed rule (the same framework that powers our WAF). This enables our security analysts and engineers to safely push updates to the rule in real-time, similar to how new WAF rule changes are rapidly delivered to ensure our customers are protected against the latest CVEs. If you haven’t logged back into the Bots dashboard since the previous version of our AI bot protection was announced, click the button again to update to the latest protection.
The impact of new fingerprints on the model
One hidden beneficiary of fingerprinting new AI bots is our ML model. As we’ve discussed before, our global ML model uses supervised machine learning and greatly benefits from more sources of labeled bot data. Below, you can see how well our ML model recognized these requests as automated, before and after we updated the button, adding new rules. To keep things simple, we have shown only the top 5 bots by the volume of requests on the chart. With the introduction of our new managed rule, we have observed an improvement in our detection capabilities for the majority of these AI bots. Button v1 represents the old option that let customers block only verified AI crawlers, while Button v2 is the newly introduced feature that includes managed rule detections.
So how did we make our detections more robust? As we have mentioned before, sometimes a single attribute can give a bot away. We developed a sophisticated set of heuristics tailored to these AI bots, enabling us to effortlessly and accurately classify them as such. Although our ML model was already detecting the vast majority of these requests, the integration of additional heuristics has resulted in a noticeable increase in detection rates for each bot, and ensuring we score every request correctly 100% of the time. Transitioning from a purely machine learning approach to incorporating heuristics offers several advantages, including faster detection times and greater certainty in classification. While deploying a machine learning model is complex and time-consuming, new heuristics can be created in minutes.
The initial launch of the AI bots block button was well-received and is now used by over 133,000 websites, with significant adoption even among our Free tier customers. The newly updated button, launched on August 20, 2024, is rapidly gaining traction. Over 90,000 zones have already adopted the new rule, with approximately 240 new sites integrating it every hour. Overall, we are now helping to protect the intellectual property of more than 146,000 sites from AI bots, and we are currently blocking 66 million requests daily with this new rule. Additionally, we’re excited to announce that support for configuring AI bots protection via Terraform will be available by the end of this year, providing even more flexibility and control for managing your bot protection settings.
Bot behavior
With the enhancements to our detection capabilities, it is essential to assess the impact of these changes to bot activity on the Internet. Since the launch of the updated AI bots block button, we have been closely monitoring for any shifts in bot activity and adaptation strategies. The most basic fingerprinting technique we use to identify AI bot looking for simple user-agent matches. User-agent matches are important to monitor because they indicate the bot is transparently announcing who they are when they’re crawling a website.
The graph below shows a volume of traffic we label as AI bot over the past two months. The blue line indicates the daily request count, while the red line represents the monthly average number of requests. In the past two months, we have seen an average reduction of nearly 30 million requests, with a decrease of 40 million in the most recent month.This decline coincides with the release of Button v1 and Button v2. Our hypothesis is that with the new AI bots blocking feature, Cloudflare is blocking a majority of these bots, which is discouraging them from crawling.
This hypothesis is supported by the observed decline in requests from several top AI crawlers. Specifically, the Bytespider bot reduced its daily requests from approximately 100 million to just 50 million between the end of June and the end of August (see graph below). This reduction could be attributed to several factors, including our new AI bots block button and changes in the crawler’s strategy.
We have also observed an increase in the accountability of some AI crawlers. The most basic fingerprinting technique we use to identify AI bot looking for simple user-agent matches. User-agent matches are important to monitor because they indicate the bot is transparently announcing who they are when they’re crawling a website. These crawlers are now more frequently using their agents, reflecting a shift towards more transparent and responsible behavior. Notably, there has been a dramatic surge in the number of requests from the Perplexity user agent. This increase might be linked to previous accusationsthat Perplexity did not properly present its user agent, which could have prompted a shift in their approach to ensure better identification and compliance.
These trends suggest that our updates are likely affecting how AI crawlers interact with content. We will continue to monitor AI bot activity to help users control who accesses their content and how. By keeping a close watch on emerging patterns, we aim to provide users with the tools and insights needed to make informed decisions about managing their traffic.
Wrap up
We’re excited to continue to explore the AI landscape, whether we’re finding more ways to make the Cloudflare dashboard usable or new threats to guard against. Our AI insights on Radar update in near real-time, so please join us in watching as new trends emerge and discussing them in the Cloudflare Community.
During Birthday Week 2023, we launched Workers AI. Since then, we have been listening to your feedback, and one thing we’ve heard consistently is that our customers want Workers AI to be faster. In particular, we hear that large language model (LLM) generation needs to be faster. Users want their interactive chat and agents to go faster, developers want faster help, and users do not want to wait for applications and generated website content to load. Today, we’re announcing three upgrades we’ve made to Workers AI to bring faster and more efficient inference to our customers: upgraded hardware, KV cache compression, and speculative decoding.
Thanks to Cloudflare’s 12th generation compute servers, our network now supports a newer generation of GPUs capable of supporting larger models and faster inference. Customers can now use Meta Llama 3.2 11B, Meta’s newly released multi-modal model with vision support, as well as Meta Llama 3.1 70B on Workers AI. Depending on load and time of day, customers can expect to see two to three times the throughput for Llama 3.1 and 3.2 compared to our previous generation Workers AI hardware. More performance information for these models can be found in today’s post: Cloudflare’s Bigger, Better, Faster AI platform.
New KV cache compression methods, now open source
In our effort to deliver low-cost low-latency inference to the world, Workers AI has been developing novel methods to boost efficiency of LLM inference. Today, we’re excited to announce a technique for KV cache compression that can help increase throughput of an inference platform. And we’ve made it open source too, so that everyone can benefit from our research.
It’s all about memory
One of the main bottlenecks when running LLM inference is the amount of vRAM (memory) available. Every word that an LLM processes generates a set of vectors that encode the meaning of that word in the context of any earlier words in the input that are used to generate new tokens in the future. These vectors are stored in the KV cache, causing the memory required for inference to scale linearly with the total number of tokens of all sequences being processed. This makes memory a bottleneck for a lot of transformer-based models. Because of this, the amount of memory an instance has available limits the number of sequences it can generate concurrently, as well as the maximum token length of sequences it can generate.
So what is the KV cache anyway?
LLMs are made up of layers, with an attention operation occurring in each layer. Within each layer’s attention operation, information is collected from the representations of all previous tokens that are stored in cache. This means that vectors in the KV cache are organized into layers, so that the active layer’s attention operation can only query vectors from the corresponding layer of KV cache. Furthermore, since attention within each layer is parallelized across multiple attention “heads”, the KV cache vectors of a specific layer are further subdivided into groups corresponding to each attention head of that layer.
The diagram below shows the structure of an LLM’s KV cache for a single sequence being generated. Each cell represents a KV and the model’s representation for a token consists of all KV vectors for that token across all attention heads and layers. As you can see, the KV cache for a single layer is allocated as an M x N matrix of KV vectors where M is the number of attention heads and N is the sequence length. This will be important later!
Now that we know what the KV cache looks like, let’s dive into how we can shrink it!
The most common approach to compressing the KV cache involves identifying vectors within it that are unlikely to be queried by future attention operations and can therefore be removed without impacting the model’s outputs. This is commonly done by looking at the past attention weights for each pair of key and value vectors (a measure of the degree with which that KV’s representation has been queried during past attention operations) and selecting the KVs that have received the lowest total attention for eviction. This approach is conceptually similar to a LFU (least frequently used) cache management policy: the less a particular vector is queried, the more likely it is to be evicted in the future.
Different attention heads need different compression rates
As we saw earlier, the KV cache for each sequence in a particular layer is allocated on the GPU as a # attention heads X sequence length tensor. This means that the total memory allocation scales with the maximum sequence length for all attention heads of the KV cache. Usually this is not a problem, since each sequence generates the same number of KVs per attention head.
When we consider the problem of eviction-based KV cache compression, however, this forces us to remove an equal number of KVs from each attention head when doing the compression. If we remove more KVs from one attention head alone, those removed KVs won’t actually contribute to lowering the memory footprint of the KV cache on GPU, but will just add more empty “padding” to the corresponding rows of the tensor. You can see this in the diagram below (note the empty cells in the second row below):
The extra compression along the second head frees slots for two KVs, but the cache’s shape (and memory footprint) remains the same.
This forces us to use a fixed compression rate for all attention heads of KV cache, which is very limiting on the compression rates we can achieve before compromising performance.
Enter PagedAttention
The solution to this problem is to change how our KV cache is represented in physical memory. PagedAttention can represent N x M tensors with padding efficiently by using an N x M block table to index into a series of “blocks”.
This lets us retrieve the ith element of a row by taking the ith block number from that row in the block table and using the block number to lookup the corresponding block, so we avoid allocating space to padding elements in our physical memory representation. In our case, the elements in physical memory are the KV cache vectors, and the M and N that define the shape of our block table are the number of attention heads and sequence length, respectively. Since the block table is only storing integer indices (rather than high-dimensional KV vectors), its memory footprint is negligible in most cases.
Results
Using paged attention lets us apply different rates of compression to different heads in our KV cache, giving our compression strategy more flexibility than other methods. We tested our compression algorithm on LongBench (a collection of long-context LLM benchmarks) with Llama-3.1-8B and found that for most tasks we can retain over 95% task performance while reducing cache size by up to 8x (left figure below). Over 90% task performance can be retained while further compressing up to 64x. That means you have room in memory for 64 times as many tokens!
This lets us increase the number of requests we can process in parallel, increasing the total throughput (total tokens generated per second) by 3.44x and 5.18x for compression rates of 8x and 64x, respectively (right figure above).
Try it yourself!
If you’re interested in taking a deeper dive check out our vLLM fork and get compressing!!
Speculative decoding for faster throughput
A new inference strategy that we implemented is speculative decoding, which is a very popular way to get faster throughput (measured in tokens per second). LLMs work by predicting the next expected token (a token can be a word, word fragment or single character) in the sequence with each call to the model, based on everything that the model has seen before. For the first token generated, this means just the initial prompt, but after that each subsequent token is generated based on the prompt plus all other tokens that have been generated. Typically, this happens one token at a time, generating a single word, or even a single letter, depending on what comes next.
But what about this prompt:
Knock, knock!
If you are familiar with knock-knock jokes, you could very accurately predict more than one token ahead. For an English language speaker, what comes next is a very specific sequence that is four to five tokens long: “Who’s there?” or “Who is there?” Human language is full of these types of phrases where the next word has only one, or a few, high probability choices. Idioms, common expressions, and even basic grammar are all examples of this. So for each prediction the model makes, we can take it a step further with speculative decoding to predict the next n tokens. This allows us to speed up inference, as we’re not limited to predicting one token at a time.
There are several different implementations of speculative decoding, but each in some way uses a smaller, faster-to-run model to generate more than one token at a time. For Workers AI, we have applied prompt-lookup decoding to some of the LLMs we offer. This simple method matches the last n tokens of generated text against text in the prompt/output and predicts candidate tokens that continue these identified patterns as candidates for continuing the output. In the case of knock-knock jokes, it can predict all the tokens for “Who’s there” at once after seeing “Knock, knock!”, as long as this setup occurs somewhere in the prompt or previous dialogue already. Once these candidate tokens have been predicted, the model can verify them all with a single forward-pass and choose to either accept or reject them. This increases the generation speed of llama-3.1-8b-instruct by up to 40% and the 70B model by up to 70%.
Speculative decoding has tradeoffs, however. Typically, the results of a model using speculative decoding have a lower quality, both when measured using benchmarks like MMLU as well as when compared by humans. More aggressive speculation can speed up sequence generation, but generally comes with a greater impact to the quality of the result. Prompt lookup decoding offers one of the smallest overall quality impacts while still providing performance improvements, and we will be adding it to some language models on Workers AI including @cf/meta/llama-3.1-8b-instruct.
And, by the way, here is one of our favorite knock-knock jokes, can you guess the punchline?
Knock, knock!
Who’s there?
Figs!
Figs who?
Figs the doorbell, it’s broken!
Keep accelerating
As the AI industry continues to evolve, there will be new hardware and software that allows customers to get faster inference responses. Workers AI is committed to researching, implementing, and making upgrades to our services to help you get fast inference. As an Inference-as-a-Service platform, you’ll be able to benefit from all the optimizations we apply, without having to hire your own team of ML researchers and SREs to manage inference software and hardware deployments.
We’re excited for you to try out some of these new releases we have and let us know what you think! Check out our full-suite of AI announcements here and check out the developer docs to get started.
Traditional cloud storage is inherently slow, because it is normally accessed over a network and must carefully synchronize across many clients that could be accessing the same data. But what if we could instead put your application code deep into the storage layer, such that your code runs directly on the machine where the data is stored, and the database itself executes as a local library embedded inside your application?
Durable Objects (DO) are a novel approach to cloud computing which accomplishes just that: Your application code runs exactly where the data is stored. Not just on the same machine: your storage lives in the same thread as the application, requiring not even a context switch to access. With proper use of caching, storage latency is essentially zero, while nevertheless being durable and consistent.
Until today, DOs only offered key/value oriented storage. But now, they support a full SQL query interface with tables and indexes, through the power of SQLite.
SQLite is the most-used SQL database implementation in the world, with billions of installations. It’s on practically every phone and desktop computer, and many embedded devices use it as well. It’s known to be blazingly fast and rock solid. But it’s been less common on the server. This is because traditional cloud architecture favors large distributed databases that live separately from application servers, while SQLite is designed to run as an embedded library. In this post, we’ll show you how Durable Objects turn this architecture on its head and unlock the full power of SQLite in the cloud.
Refresher: what are Durable Objects?
Durable Objects (DOs) are a part of the Cloudflare Workers serverless platform. A DO is essentially a small server that can be addressed by a unique name and can keep state both in-memory and on-disk. Workers running anywhere on Cloudflare’s network can send messages to a DO by its name, and all messages addressed to the same name — from anywhere in the world — will find their way to the same DO instance.
DOs are intended to be small and numerous. A single application can create billions of DOs distributed across our global network. Cloudflare automatically decides where a DO should live based on where it is accessed, automatically starts it up as needed when requests arrive, and shuts it down when idle. A DO has in-memory state while running and can also optionally store long-lived durable state. Since there is exactly one DO for each name, a DO can be used to coordinate between operations on the same logical object.
For example, imagine a real-time collaborative document editor application. Many users may be editing the same document at the same time. Each user’s changes must be broadcast to other users in real time, and conflicts must be resolved. An application built on DOs would typically create one DO for each document. The DO would receive edits from users, resolve conflicts, broadcast the changes back out to other users, and keep the document content updated in its local storage.
DOs are especially good at real-time collaboration, but are by no means limited to this use case. They are general-purpose servers that can implement any logic you desire to serve requests. Even more generally, DOs are a basic building block for distributed systems.
When using Durable Objects, it’s important to remember that they are intended to scale out, not up. A single object is inherently limited in throughput since it runs on a single thread of a single machine. To handle more traffic, you create more objects. This is easiest when different objects can handle different logical units of state (like different documents, different users, or different “shards” of a database), where each unit of state has low enough traffic to be handled by a single object. But sometimes, a lot of traffic needs to modify the same state: consider a vote counter with a million users all trying to cast votes at once. To handle such cases with Durable Objects, you would need to create a set of objects that each handle a subset of traffic and then replicate state to each other. Perhaps they use CRDTs in a gossip network, or perhaps they implement a fan-in/fan-out approach to a single primary object. Whatever approach you take, Durable Objects make it fast and easy to create more stateful nodes as needed.
Why is SQLite-in-DO so fast?
In traditional cloud architecture, stateless application servers run business logic and communicate over the network to a database. Even if the network is local, database requests still incur latency, typically measured in milliseconds.
When a Durable Object uses SQLite, SQLite is invoked as a library. This means the database code runs not just on the same machine as the DO, not just in the same process, but in the very same thread. Latency is effectively zero, because there is no communication barrier between the application and SQLite. A query can complete in microseconds.
Reads and writes are synchronous
The SQL query API in DOs does not require you to await results — they are returned synchronously:
// No awaits!
let cursor = sql.exec("SELECT name, email FROM users");
for (let user of cursor) {
  console.log(user.name, user.email);
}
This may come as a surprise to some. Querying a database is I/O, right? I/O should always be asynchronous, right? Isn’t this a violation of the natural order of JavaScript?
It’s OK! The database content is probably cached in memory already, and SQLite is being called as a library in the same thread as the application, so the query often actually won’t spend any time at all waiting for I/O. Even if it does have to go to disk, it’s a local SSD. You might as well consider the local disk as just another layer in the memory cache hierarchy: L5 cache, if you will. In any case, it will respond quickly.
Meanwhile, synchronous queries provide some big benefits. First, the logistics of asynchronous event loops have a cost, so in the common case where the data is already in memory, a synchronous query will actually complete faster than an async one.
More importantly, though, synchronous queries help you avoid subtle bugs. Any time your application awaits a promise, it’s possible that some other code executes while you wait. The state of the world may have changed by the time your await completes. Maybe even other SQL queries were executed. This can lead to subtle bugs that are hard to reproduce because they require events to happen at just the wrong time. With a synchronous API, though, none of that can happen. Your code always executes in the order you wrote it, uninterrupted.
Fast writes with Output Gates
Database experts might have a deeper objection to synchronous queries: Yes, caching may mean we can perform reads and writes very fast. However, in the case of a write, just writing to cache isn’t good enough. Before we return success to our client, we must confirm that the write is actually durable, that is, it has actually made it onto disk or network storage such that it cannot be lost if the power suddenly goes out.
Normally, a database would confirm all writes before returning to the application. So if the query is successful, it is confirmed. But confirming writes can be slow, because it requires waiting for the underlying storage medium to respond. Normally, this is OK because the write is performed asynchronously, so the program can go on and work on other things while it waits for the write to finish. It looks kind of like this:
But I just told you that in Durable Objects, writes are synchronous. While a synchronous call is running, no other code in the program can run (because JavaScript does not have threads). This is convenient, as mentioned above, because it means you don’t need to worry that the state of the world may have changed while you were waiting. However, if write queries have to wait a while, and the whole program must pause and wait for them, then throughput will suffer.
Luckily, in Durable Objects, writes do not have to wait, due to a little trick we call “Output Gates”.
In DOs, when the application issues a write, it continues executing without waiting for confirmation. However, when the DO then responds to the client, the response is blocked by the “Output Gate”. This system holds the response until all storage writes relevant to the response have been confirmed, then sends the response on its way. In the rare case that the write fails, the response will be replaced with an error and the Durable Object itself will restart. So, even though the application constructed a “success” response, nobody can ever see that this happened, and thus nobody can be misled into believing that the data was stored.
Let’s see what this looks like with multiple requests:
If you compare this against the first diagram above, you should notice a few things:
The timing of requests and confirmations are the same.
But, all responses were sent to the client sooner than in the first diagram. Latency was reduced! This is because the application is able to work on constructing the response in parallel with the storage layer confirming the write.
Request handling is no longer interleaved between the three requests. Instead, each request runs to completion before the next begins. The application does not need to worry, during the handling of one request, that its state might change unexpectedly due to a concurrent request.
With Output Gates, we get the ease-of-use of synchronous writes, while also getting lower latency and no loss of throughput.
N+1 selects? No problem.
Zero-latency queries aren’t just faster, they allow you to structure your code differently, often making it simpler. A classic example is the “N+1 selects” or “N+1 queries” problem. Let’s illustrate this problem with an example:
// N+1 SELECTs example

// Get the 100 most-recently-modified docs.
let docs = sql.exec(`
  SELECT title, authorId FROM documents
  ORDER BY lastModified DESC
  LIMIT 100
`).toArray();

// For each returned document, get the author name from the users table.
for (let doc of docs) {
  doc.authorName = sql.exec(
      "SELECT name FROM users WHERE id = ?", doc.authorId).one().name;
}
If you are an experienced SQL user, you are probably cringing at this code, and for good reason: this code does 101 queries! If the application is talking to the database across a network with 5ms latency, this will take 505ms to run, which is slow enough for humans to notice.
// Do it all in one query with a join?
let docs = sql.exec(`
  SELECT documents.title, users.name
  FROM documents JOIN users ON documents.authorId = users.id
  ORDER BY documents.lastModified DESC
  LIMIT 100
`).toArray();
Here we’ve used SQL features to turn our 101 queries into one query. Great! Except, what does it mean? We used an inner join, which is not to be confused with a left, right, or cross join. What’s the difference? Honestly, I have no idea! I had to look up joins just to write this example and I’m already confused.
Well, good news: You don’t need to figure it out. Because when using SQLite as a library, the first example above works just fine. It’ll perform about the same as the second fancy version.
More generally, when using SQLite as a library, you don’t have to learn how to do fancy things in SQL syntax. Your logic can be in regular old application code in your programming language of choice, orchestrating the most basic SQL queries that are easy to learn. It’s fine. The creators of SQLite have made this point themselves.
Point-in-Time Recovery
While not necessarily related to speed, SQLite-backed Durable Objects offer another feature: any object can be reverted to the state it had at any point in time in the last 30 days. So if you accidentally execute a buggy query that corrupts all your data, don’t worry: you can recover. There’s no need to opt into this feature in advance; it’s on by default for all SQLite-backed DOs. See the docs for details.
How do I use it?
Let’s say we’re an airline, and we are implementing a way for users to choose their seats on a flight. We will create a new Durable Object for each flight. Within that DO, we will use a SQL table to track the assignments of seats to passengers. The code might look something like this:
import {DurableObject} from "cloudflare:workers";

// Manages seat assignment for a flight.
//
// This is an RPC interface. The methods can be called remotely by other Workers
// running anywhere in the world. All Workers that specify same object ID
// (probably based on the flight number and date) will reach the same instance of
// FlightSeating.
export class FlightSeating extends DurableObject {
  sql = this.ctx.storage.sql;

  // Application calls this when the flight is first created to set up the seat map.
  initializeFlight(seatList) {
    this.sql.exec(`
      CREATE TABLE seats (
        seatId TEXT PRIMARY KEY,  -- e.g. "3B"
        occupant TEXT             -- null if available
      )
    `);

    for (let seat of seatList) {
      this.sql.exec(`INSERT INTO seats VALUES (?, null)`, seat);
    }
  }

  // Get a list of available seats.
  getAvailable() {
    let results = [];

    // Query returns a cursor.
    let cursor = this.sql.exec(`SELECT seatId FROM seats WHERE occupant IS NULL`);

    // Cursors are iterable.
    for (let row of cursor) {
      // Each row is an object with a property for each column.
      results.push(row.seatId);
    }

    return results;
  }

  // Assign passenger to a seat.
  assignSeat(seatId, occupant) {
    // Check that seat isn't occupied.
    let cursor = this.sql.exec(`SELECT occupant FROM seats WHERE seatId = ?`, seatId);
    let result = [...cursor][0];  // Get the first result from the cursor.
    if (!result) {
      throw new Error("No such seat: " + seatId);
    }
    if (result.occupant !== null) {
      throw new Error("Seat is occupied: " + seatId);
    }

    // If the occupant is already in a different seat, remove them.
    this.sql.exec(`UPDATE seats SET occupant = null WHERE occupant = ?`, occupant);

    // Assign the seat. Note: We don't have to worry that a concurrent request may
    // have grabbed the seat between the two queries, because the code is synchronous
    // (no `await`s) and the database is private to this Durable Object. Nothing else
    // could have changed since we checked that the seat was available earlier!
    this.sql.exec(`UPDATE seats SET occupant = ? WHERE seatId = ?`, occupant, seatId);
  }
}
(With just a little more code, we could extend this example to allow clients to subscribe to seat changes with WebSockets, so that if multiple people are choosing their seats at the same time, they can see in real time as seats become unavailable. But, that’s outside the scope of this blog post, which is just about SQL storage.)
Then in wrangler.toml, define a migration setting up your DO class like usual, but instead of using new_classes, use new_sqlite_classes:
[[migrations]]
tag = "v1"
new_sqlite_classes = ["FlightSeating"]
SQLite-backed objects also support the existing key/value-based storage API: KV data is stored into a hidden table in the SQLite database. So, existing applications built on DOs will work when deployed using SQLite-backed objects.
However, because SQLite-backed objects are based on an all-new storage backend, it is currently not possible to switch an existing deployed DO class to use SQLite. You must ask for SQLite when initially deploying the new DO class; you cannot change it later. We plan to begin migrating existing DOs to the new storage backend in 2025.
Pricing
We’ve kept pricing for SQLite-in-DO similar to D1, Cloudflare’s serverless SQL database, by billing for SQL queries (based on rows) and SQL storage. SQL storage per object is limited to 1 GB during the beta period, and will be increased to 10 GB on general availability. DO requests and duration billing are unchanged and apply to all DOs regardless of storage backend.
During the initial beta, billing is not enabled for SQL queries (rows read and rows written) and SQL storage. SQLite-backed objects will incur charges for requests and duration. We plan to enable SQL billing in the first half of 2025 with advance notice.
Workers Paid
Rows read
First 25 billion / month included + $0.001 / million rows
Rows written
First 50 million / month included + $1.00 / million rows
SQL storage
5 GB-month + $0.20/ GB-month
For more on how to use SQLite-in-Durable Objects, check out the documentation.
What about D1?
Cloudflare Workers already offers another SQLite-backed database product: D1. In fact, D1 is itself built on SQLite-in-DO. So, what’s the difference? Why use one or the other?
In short, you should think of D1 as a more “managed” database product, while SQLite-in-DO is more of a lower-level “compute with storage” building block.
D1 fits into a more traditional cloud architecture, where stateless application servers talk to a separate database over the network. Those application servers are typically Workers, but could also be clients running outside of Cloudflare. D1 also comes with a pre-built HTTP API and managed observability features like query insights. With D1, where your application code and SQL database queries are not colocated like in SQLite-in-DO, Workers has Smart Placement to dynamically run your Worker in the best location to reduce total request latency, considering everything your Worker talks to, including D1. By the end of 2024, D1 will support automatic read replication for scalability and low-latency access around the world. If this managed model appeals to you, use D1.
Durable Objects require a bit more effort, but in return, give you more power. With DO, you have two pieces of code that run in different places: a front-end Worker which routes incoming requests from the Internet to the correct DO, and the DO itself, which runs on the same machine as the SQLite database. You may need to think carefully about which code to run where, and you may need to build some of your own tooling that exists out-of-the-box with D1. But because you are in full control, you can tailor the solution to your application’s needs and potentially achieve more.
Under the hood: Storage Relay Service
When Durable Objects first launched in 2020, it offered only a simple key/value-based interface for durable storage. Under the hood, these keys and values were stored in a well-known off-the-shelf database, with regional instances of this database deployed to locations in our data centers around the world. Durable Objects in each region would store their data to the regional database.
For SQLite-backed Durable Objects, we have completely replaced the persistence layer with a new system built from scratch, called Storage Relay Service, or SRS. SRS has already been powering D1 for over a year, and can now be used more directly by applications through Durable Objects.
SRS is based on a simple idea:
Local disk is fast and randomly-accessible, but expensive and prone to disk failures. Object storage (like R2) is cheap and durable, but much slower than local disk and not designed for database-like access patterns. Can we get the best of both worlds by using a local disk as a cache on top of object storage?
So, how does it work?
The mismatch in functionality between local disk and object storage
A SQLite database on disk tends to undergo many small changes in rapid succession. Any row of the database might be updated by any particular query, but the database is designed to avoid rewriting parts that didn’t change. Read queries may randomly access any part of the database. Assuming the right indexes exist to support the query, they should not require reading parts of the database that aren’t relevant to the results, and should complete in microseconds.
Object storage, on the other hand, is designed for an entirely different usage model: you upload an entire “object” (blob of bytes) at a time, and download an entire blob at a time. Each blob has a different name. For maximum efficiency, blobs should be fairly large, from hundreds of kilobytes to gigabytes in size. Latency is relatively high, measured in tens or hundreds of milliseconds.
So how do we back up our SQLite database to object storage? An obviously naive strategy would be to simply make a copy of the database files from time to time and upload it as a new “object”. But, uploading the database on every change — and making the application wait for the upload to complete — would obviously be way too slow. We could choose to upload the database only occasionally — say, every 10 minutes — but this means in the case of a disk failure, we could lose up to 10 minutes of changes. Data loss is, uh, bad! And even then, for most databases, it’s likely that most of the data doesn’t change every 10 minutes, so we’d be uploading the same data over and over again.
Trick one: Upload a log of changes
Instead of uploading the entire database, SRS records a log of changes, and uploads those.
Conveniently, SQLite itself already has a concept of a change log: the Write-Ahead Log, or WAL. SRS always configures SQLite to use WAL mode. In this mode, any changes made to the database are first written to a separate log file. From time to time, the database is “checkpointed”, merging the changes back into the main database file. The WAL format is well-documented and easy to understand: it’s just a sequence of “frames”, where each frame is an instruction to write some bytes to a particular offset in the database file.
SRS monitors changes to the WAL file (by hooking SQLite’s VFS to intercept file writes) to discover the changes being made to the database, and uploads those to object storage.
Unfortunately, SRS cannot simply upload every single change as a separate “object”, as this would result in too many objects, each of which would be inefficiently small. Instead, SRS batches changes over a period of up to 10 seconds, or up to 16 MB worth, whichever happens first, then uploads the whole batch as a single object.
When reconstructing a database from object storage, we must download the series of change batches and replay them in order. Of course, if the database has undergone many changes over a long period of time, this can get expensive. In order to limit how far back it needs to look, SRS also occasionally uploads a snapshot of the entire content of the database. SRS will decide to upload a snapshot any time that the total size of logs since the last snapshot exceeds the size of the database itself. This heuristic implies that the total amount of data that SRS must download to reconstruct a database is limited to no more than twice the size of the database. Since we can delete data from object storage that is older than the latest snapshot, this also means that our total stored data is capped to 2x the database size.
Credit where credit is due: This idea — uploading WAL batches and snapshots to object storage — was inspired by Litestream, although our implementation is different.
Trick two: Relay through other servers in our global network
Batches are only uploaded to object storage every 10 seconds. But obviously, we cannot make the application wait for 10 whole seconds just to confirm a write. So what happens if the application writes some data, returns a success message to the user, and then the machine fails 9 seconds later, losing the data?
To solve this problem, we take advantage of our global network. Every time SQLite commits a transaction, SRS will immediately forward the change log to five “follower” machines across our network. Once at least three of these followers respond that they have received the change, SRS informs the application that the write is confirmed. (As discussed earlier, the write confirmation opens the Durable Object’s “output gate”, unblocking network communications to the rest of the world.)
When a follower receives a change, it temporarily stores it in a buffer on local disk, and then awaits further instructions. Later on, once SRS has successfully uploaded the change to object storage as part of a batch, it informs each follower that the change has been persisted. At that point, the follower can simply delete the change from its buffer.
However, if the follower never receives the persisted notification, then, after some timeout, the follower itself will upload the change to object storage. Thus, if the machine running the database suddenly fails, as long as at least one follower is still running, it will ensure that all confirmed writes are safely persisted.
Each of a database’s five followers is located in a different physical data center. Cloudflare’s network consists of hundreds of data centers around the world, which means it is always easy for us to find four other data centers nearby any Durable Object (in addition to the one it is running in). In order for a confirmed write to be lost, then, at least four different machines in at least three different physical buildings would have to fail simultaneously (three of the five followers, plus the Durable Object’s host machine). Of course, anything can happen, but this is exceedingly unlikely.
Followers also come in handy when a Durable Object’s host machine is unresponsive. We may not know for sure if the machine has died completely, or if it is still running and responding to some clients but not others. We cannot start up a new instance of the DO until we know for sure that the previous instance is dead – or, at least, that it can no longer confirm writes, since the old and new instances could then confirm contradictory writes. To deal with this situation, if we can’t reach the DO’s host, we can instead try to contact its followers. If we can contact at least three of the five followers, and tell them to stop confirming writes for the unreachable DO instance, then we know that instance is unable to confirm any more writes going forward. We can then safely start up a new instance to replace the unreachable one.
Bonus feature: Point-in-Time Recovery
I mentioned earlier that SQLite-backed Durable Objects can be asked to revert their state to any time in the last 30 days. How does this work?
This was actually an accidental feature that fell out of SRS’s design. Since SRS stores a complete log of changes made to the database, we can restore to any point in time by replaying the change log from the last snapshot. The only thing we have to do is make sure we don’t delete those logs too soon.
Normally, whenever a snapshot is uploaded, all previous logs and snapshots can then be deleted. But instead of deleting them immediately, SRS merely marks them for deletion 30 days later. In the meantime, if a point-in-time recovery is requested, the data is still there to work from.
For a database with a high volume of writes, this may mean we store a lot of data for a lot longer than needed. As it turns out, though, once data has been written at all, keeping it around for an extra month is pretty cheap — typically cheaper, even, than writing it in the first place. It’s a small price to pay for always-on disaster recovery.
Get started with SQLite-in-DO
SQLite-backed DOs are available in beta starting today. You can start building with SQLite-in-DO by visiting developer documentation and provide beta feedback via the #durable-objects channel on our Developer Discord.
Do distributed systems like SRS excite you? Would you like to be part of building them at Cloudflare? We’re hiring!
Each time a user visits your web page, they are initiating a race to receive content as quickly as possible. Performance is a critical factor that influences how visitors interact with your site. Some might think that moving content across the globe introduces significant latency, but for a while, network transmission speeds have approached their theoretical limits. To put this into perspective, data on Cloudflare can traverse the 11,000 kilometer round trip between New York and London in about 76 milliseconds – faster than the blink of an eye.
However, delays in loading web pages persist due to the complexities of processing requests, responses, and configurations. In addition to pushing advancements in connection establishment, compression, hardware, and software, we have built a new way to reduce page load latency by anticipating how visitors will interact with a given web page.
Today we are very excited to share the latest leap forward in speed: Speed Brain. It relies on the Speculation Rules API to prefetch the content of the user’s likely next navigations. The main goal of Speed Brain is to download a web page to the browser cache before a user navigates to it, allowing pages to load almost instantly when the actual navigation takes place.
Our initial approach uses a conservative model that prefetches static content for the next page when a user starts a touch or click event. Through the fourth quarter of 2024 and into 2025, we will offer more aggressive speculation models, such as speculatively prerendering (not just fetching the page before the navigation happens but rendering it completely) for an even faster experience. Eventually, Speed Brain will learn how to eliminate latency for your static website, without any configuration, and work with browsers to make sure that it loads as fast as possible.
To illustrate, imagine an ecommerce website selling clothing. Using the insights from our global request logs, we can predict with high accuracy that a typical visitor is likely to click on ‘Shirts’ when viewing the parent page ‘Mens > Clothes’. Based on this, we can start delivering static content, like images, before the shopper even clicks the ‘Shirts’ link. As a result, when they inevitably click, the page loads instantly. Recent lab testing of our aggressive loading model implementation has shown up to a 75% reduction in Largest Contentful Paint (LCP), the time it takes for the largest visible element (like an image, video, or text block) to load and render in the browser.
The best part? We are making Speed Brain available to all plan types immediately and at no cost. Simply toggle on the Speed Brain feature for your website from the dashboard or the API. It’ll feel like magic, but behind the scenes it’s a lot of clever engineering.
We have already enabled Speed Brain by default on all free domains and are seeing a reduction in LCP of 45% on successful prefetches. Pro, Business, and Enterprise domains need to enable Speed Brain manually. If you have not done so already, we strongly recommend also enabling Real User Measurements (RUM) via your dashboard so you can see your new and improved web page performance. As a bonus, enabling RUM for your domain will help us provide improved and customized prefetching and prerendering rules for your website in the near future!
How browsers work at a glance
Before discussing how Speed Brain can help load content exceptionally fast, we need to take a step back to review the complexity of loading content on browsers. Every time a user navigates to your web page, a series of request and response cycles must be completed.
After the browser establishes a secure connection with a server, it sends an HTTP request to retrieve the base document of the web page. The server processes the request, constructs the necessary HTML document and sends it back to the browser in the response.
When the browser receives an HTML document, it immediately begins parsing the content. During this process, it may encounter references to external resources such as CSS files, JavaScript, images, and fonts. These subresources are essential for rendering the page correctly, so the browser issues additional HTTP requests to fetch them. However, if these resources are available in the browser’s cache, the browser can retrieve them locally, significantly reducing network latency and improving page load times.
As the browser processes HTML, CSS, and JavaScript, the rendering engine begins to display content on the screen. Once the page’s visual elements are displayed, user interactions — like clicking a link — prompt the browser to restart much of this process to fetch new content for the next page. This workflow is typical of every browsing session: as users navigate, the browser continually fetches and renders new or uncached resources, introducing a delay before the new page fully loads.
Take the example of a user navigating the shopping site described above. As the shopper moves from the homepage to the ‘men’s’ section of the site to the ‘clothing’ section to the ‘shirts’ section, the time spent on retrieving each of those subsequent pages can add up and contribute to the shopper leaving the site before they complete the transaction.
Ideally, having prefetched and prerendered pages present in the browser at the time each of those links are clicked would eliminate much of the network latency impact, allowing the browser to load content instantly and providing a smoother user experience.
Wait, I’ve heard this story before (how did we get to Speed Brain?)
We know what you’re thinking. We’ve had prefetching for years. There have even been several speculative prefetching efforts in the past. You’ve heard this all before. How is this different now?
You’re right, of course. Over the years, there has been a constant effort by developers and browser vendors to optimize page load times and enhance user experience across the web. Numerous techniques have been developed, spanning various layers of the Internet stack — from optimizing network layer connectivity to preloading application content closer to the client.
Early prefetching: lack of data and flexibility
Web prefetching has been one such technique that has existed for more than a decade. It is based on the assumption that certain subresources are likely to be needed in the near future, so why not fetch them proactively? This could include anything from HTML pages to images, stylesheets, or scripts that the user might need as they navigate through a website. In fact, the core concept of speculative execution is not new, as it’s a general technique that’s been employed in various areas of computer science for years, with branch prediction in CPUs as a prime example.
In the early days of the web, several custom prefetching solutions emerged to enhance performance. For example, in 2005, Google introduced the Google Web Accelerator, a client-side application aimed at speeding up browsing for broadband users. Though innovative, the project was short-lived due to privacy and compatibility issues (we will describe how Speed Brain is different below). Predictive prefetching at that time lacked the data insights and API support for capturing user behavior, especially those handling sensitive actions like deletions or purchases.
Static lists and manual effort
Traditionally, prefetching has been accomplished through the use of the <link rel="prefetch"> attribute as one of the Resource Hints. Developers had to manually specify the attribute on each page for each resource they wanted the browser to preemptively fetch and cache in memory. This manual effort has not only been laborious but developers often lacked insight into what resources should be prefetched, which reduced the quality of their specified hints.
In a similar vein, Cloudflare has offered a URL prefetching feature since 2015. Instead of prefetching in browser cache, Cloudflare allows customers to prefetch a static list of resources into the CDN cache. The feature allows prefetching resources in advance of when they are actually needed, usually during idle time or when network conditions are favorable. However, similar concerns apply for CDN prefetching, since customers have to manually decide on what resources are good candidates for prefetching for each page they own. If misconfigured, static link prefetching can be a footgun, causing the web page load time to actually slow down.
Server Push and its struggles
HTTP/2’s “server push” was another attempt to improve web performance by pushing resources to the client before they were requested. In theory, this would reduce latency by eliminating the need for additional round trips for future assets. However, the server-centric dictatorial nature of “pushing” resources to the client raised significant challenges, primarily due to lack of context about what was already cached in the browser. This not only wasted bandwidth but had the potential to slow down the delivery of critical resources, like base HTML and CSS, due to race conditions on browser fetches when rendering the page. The proposed solution of cache digests, which would have informed servers about client cache contents, never gained widespread implementation, leaving servers to push resources blindly. In October 2022, Google Chrome removed Server Push support, and in September 2024, Firefox followed suit.
A step forward with Early Hints
As a successor, Early Hints was specified in 2017 but not widely adopted until 2022, when we partnered with browsers and key customers to deploy it. It offers a more efficient alternative by “hinting” to clients which resources to load, allowing better prioritization based on what the browser needs. Specifically, the server sends a 103 Early Hints HTTP status code with a list of key page assets that the browser should start loading while the main response is still being prepared. This gives the browser a head start in fetching essential resources and avoids redundant preloading if assets are already cached. Although Early Hints doesn’t adapt to user behaviors or dynamic page conditions (yet), its use is primarily limited to preloading specific assets rather than full web pages — in particular, cases where there is a long server “think time” to produce HTML.
As the web evolves, tools that can handle complex, dynamic user interactions will become increasingly important to balance the performance gains of speculative execution with its potential drawbacks for end-users. For years Cloudflare has offered performance-based solutions that adapt to user behavior and work to balance the speed and correctness decisions across the Internet like Argo Smart Routing, Smart Tiered Cache, and Smart Placement. Today we take another step forward toward an adaptable framework for serving content lightning-fast.
Enter Speed Brain: what makes it different?
Speed Brain offers a robust approach for implementing predictive prefetching strategies directly within the browser based on the ruleset returned by our servers. By building on lessons from previous attempts, it shifts the responsibility for resource prediction to the client, enabling more dynamic and personalized optimizations based on user interaction – like hovering over a link, for example – and their device capabilities. Instead of the browser sitting idly waiting for the next web page to be requested by the user, it takes cues from how a user is interacting with a page and begins asking for the next web page before the user finishes clicking on a link.
Behind the scenes, all of this magic is made possible by the Speculation Rules API, which is an emerging standard in the web performance space from Google. When Cloudflare’s Speed Brain feature is enabled, an HTTP header called Speculation-Rules is added to web page responses. The value for this header is a URL that hosts an opinionated Rules configuration. This configuration instructs the browser to initiate prefetch requests for future navigations. Speed Brain does not improve page load time for the first page that is visited on a website, but it can improve it for subsequent web pages that are visited on the same site.
The idea seems simple enough, but prefetching comes with challenges, as some prefetched content may never end up being used. With the initial release of Speed Brain, we have designed a solution with guardrails that addresses two important but distinct issues that limited previous speculation efforts — stale prefetch configuration and incorrect prefetching. The Speculation Rules API configuration we have chosen for this initial release has been carefully designed to balance safety of prefetching while still maintaining broad applicability of rules for the entire site.
Stale prefetch configuration
As websites inevitably change over time, static prefetch configurations often become outdated, leading to inefficient or ineffective prefetching. This has been especially true for techniques like the rel=prefetch attribute or static CDN prefetching URL sets, which have required developers to manually maintain relevant prefetchable URL lists for each page of their website. Most static prefetch lists are based on developer intuition rather than real user navigation data, potentially missing important prefetch opportunities or wasting resources on unnecessary prefetches.
Incorrect prefetching
Since prefetch requests are just like normal requests except with a `sec-purpose` HTTP request header, they incur the same overhead on the client, network, and server. However, the crucial difference is that prefetch requests anticipate user behavior and the response might not end up being used, so all that overhead might be wasted. This makes prefetch accuracy extremely important — that is, maximizing the percentage of prefetched pages that end up being viewed by the user. Incorrect prefetching can lead to inefficiencies and unneeded costs, such as caching resources that aren’t requested, or wasting bandwidth and network resources, which is especially critical on metered mobile networks or in low-bandwidth environments.
Guardrails
With the initial release of Speed Brain, we have designed a solution with important side effect prevention guardrails that completely removes the chance of stale prefetch configuration, and minimizes the risk of incorrect prefetching. This opinionated configuration is achieved by leveraging the document rules and eagerness settings from the Speculation Rules API. Our chosen configuration looks like the following:
Document Rules, indicated by “source”: “document” and the “where” key in the configuration, allows prefetching to be applied dynamically over the entire web page. This eliminates the need for a predefined static URL list for prefetching. Hence, we remove the problem of stale prefetch configuration as prefetch candidate links are determined based on the active page structure.
Our use of “relative_to”: “document” in the where clause instructs the browser to limit prefetching to same-site links. This has the added bonus of allowing our implementation to avoid cross-origin prefetches to avoid any privacy implications for users, as it doesn’t follow them around the web.
Eagerness
Eagerness controls how aggressively the browser prefetches content. There are four possible settings:
immediate: Used as soon as possible on page load — generally as soon as the rule value is seen by the browser, it starts prefetching the next page.
eager: Identical to immediate setting above, but the prefetch trigger additionally relies on slight user interaction events, such as moving the cursor towards the link (coming soon).
moderate: Prefetches if you hold the pointer over a link for more than 200 milliseconds (or on the pointerdown event if that is sooner, and on mobile where there is no hover event).
conservative: Prefetches on pointer or touch down on the link.
Our initial release of Speed Brain makes use of the conservative eagerness value to minimize the risk of incorrect prefetching, which can lead to unintended resource waste while making your websites noticeably faster. While we lose out on the potential performance improvements that the more aggressive eagerness settings offer, we chose this cautious approach to prioritize safety for our users. Looking ahead, we plan to explore more dynamic eagerness settings for sites that could benefit from a more liberal setting, and we’ll also expand our rules to include prerendering.
Another important safeguard we implement is to only accept prefetch requests for static content that is already stored in our CDN cache. If the content isn’t in the cache, we reject the prefetch request. Retrieving content directly from our CDN cache for prefetching requests lets us bypass concerns about their cache eligibility. The rationale for this is straightforward: if a page is not eligible for caching, we don’t want it to be prefetched in the browser cache, as it could lead to unintended consequences and increased origin load. For instance, prefetching a logout page might log the user out prematurely before the user actually finishes their action. Stateful prefetching or prerendering requests can have unpredictable effects, potentially altering the server’s state for actions the client has not confirmed. By only allowing prefetching for pages already in our CDN cache, we have confidence those pages will not negatively impact the user experience.
These guardrails were implemented to work in performance-sensitive environments. We measured the impact of our baseline conservative deployment model on all pages across Cloudflare’s developer documentation in early July 2024. We found that we were able to prefetch the correct content, content that would in fact be navigated to by the users, 94% of the time. We did this while improving the performance of the navigation by reducing LCP at p75 quantile by 40% without inducing any unintended side effects. The results were amazing!
Explaining Cloudflare’s implementation
Our global network spans over 330 cities and operates within 50 milliseconds of 95% of the Internet-connected population. This extensive reach allows us to significantly improve the performance of cacheable assets for our customers. By leveraging this network for smart prefetching with Speed Brain, Cloudflare can serve prefetched content directly from the CDN cache, reducing network latency to practically instant.
Our unique position on the network provides us the leverage to automatically enable Speed Brain without requiring any changes from our customers to their origin server configurations. It’s as simple as flipping a switch! Our first version of Speed Brain is now live.
Upon receiving a request for a web page with Speed Brain enabled, the Cloudflare server returns an additional “Speculation-Rules” HTTP response header. The value for this header is a URL that hosts an opinionated Rules configuration (as mentioned above).
When the browser begins parsing the response header, it fetches our Speculation-Rules configuration, and loads it as part of the web page.
The configuration guides the browser on when to prefetch the next likely page from Cloudflare that the visitor may navigate to, based on how the visitor is engaging with the page.
When a user action (such as mouse down event on the next page link) triggers the Rules application, the browser sends a prefetch request for that page with the “sec-purpose: prefetch” HTTP request header.
Our server parses the request header to identify the prefetch request. If the requested content is present in our cache, we return it; otherwise, we return a 503 HTTP status code and deny the prefetch request. This removes the risk of unsafe side-effects of sending requests to origins or Cloudflare Workers that are unaware of prefetching. Only content present exclusively in the cache is returned.
On a success response, the browser successfully prefetches the content in memory, and when the visitor navigates to that page, the browser directly loads the web page from the browser cache for immediate rendering.
Common troubleshooting patterns
Support for Speed Brain relies on the Speculation Rules API, an emerging web standard. As of September 2024, support for this emerging standard is limited to Chromium-based browsers (version 121 or later), such as Google Chrome and Microsoft Edge. As the web community reaches consensus on API standardization, we hope to see wider adoption across other browser vendors.
Prefetching by nature does not apply to dynamic content, as the state of such content can change, potentially leading to stale or outdated data being delivered to the end user as well as increased origin load. Therefore, Speed Brain will only work for non-dynamic pages of your website that are cached on our network. It has no impact on the loading of dynamic pages. To get the most benefit out of Speed Brain, we suggest making use of cache rules to ensure that all static content (especially HTML content) on your site is eligible for caching.
When the browser receives a 503 HTTP status code in response to a speculative prefetch request (marked by the sec-purpose: prefetch header), it cancels the prefetch attempt. Although a 503 error appearing in the browser’s console may seem alarming, it is completely harmless for prefetch request cancellation. In our early tests, the 503 response code has caused some site owners concern. We are working with our partners to iterate on this to improve the client experience, but for now follow the specification guidance, which suggests a 503 response for the browser to safely discard the speculative request. We’re in active discussions with Chrome, based on feedback from early beta testers, and believe a new non-error dedicated response code would be more appropriate, and cause less confusion. In the meantime, 503 response logs for prefetch requests related to Speed Brain are harmless. If your tooling makes ignoring these requests difficult, you can temporarily disable Speed Brain until we work out something better with the Chrome Team.
Additionally, when a website uses both its own custom Speculation Rules and Cloudflare’s Speed Brain feature, both rule sets can operate simultaneously. Cloudflare’s guardrails will limit speculation rules to cacheable pages, which may be an unexpected limitation for those with existing implementations. If you observe such behavior, consider disabling one of the implementations for your site to ensure consistency in behavior. Note that if your origin server responses include the Speculation-Rules header, it will not be overridden. Therefore, the potential for ruleset conflicts primarily applies to predefined in-line speculation rules.
How can I see the impact of Speed Brain?
In general, we suggest that you use Speed Brain and most other Cloudflare performance features with our RUM performance measurement tool enabled. Our RUM feature helps developers and website operators understand how their end users are experiencing the performance of their application, providing visibility into:
Loading: How long did it take for content to become available?
Interactivity: How responsive is the website when users interact with it?
Visual stability: How much does the page move around while loading?
With RUM enabled, you can navigate to the Web Analytics section in the dashboard to see important information about how Speed Brain is helping reduce latency in your core web vitals metrics like Largest Contentful Paint (LCP) and load time.
Example RUM dashboard for a website with a high amount of prefetchable content that enabled Speed Brain around September 16.
What have we seen in our rollout so far?
We have enabled this feature by default on all free plans and have observed the following:
Domains
Cloudflare currently has tens of millions of domains using Speed Brain. We have measured the LCP at the 75th quantile (p75) for these sites and found an improvement for these sites between 40% and 50% (average around 45%).
We found this improvement by comparing navigational prefetches to normal (non-prefetched) page loads for the same set of domains.
Requests
Before Speed Brain is enabled, the p75 of free websites on Cloudflare experience an LCP around 2.2 seconds. With Speed Brain enabled, these sites see significant latency savings on LCP. In aggregate, Speed Brain saves about 0.88 seconds on the low end and up to 1.1 seconds on each successful prefetch!
Applicable browsers
Currently, the Speculation Rules API is only available in Chromium browsers. From Cloudflare Radar, we can see that approximately 70% of requests from visitors are from Chromium (Chrome, Edge, etc) browsers.
Across the network
Cloudflare sees hundreds of billions of requests for HTML content each day. Of these requests, about half are cached (make sure your HTML is cacheable!). Around 1% of those requests are for navigational prefetching made by the visitors. This represents significant savings every day for visitors to websites with Speed Brain enabled. Every 24 hours, Speed Brain can save more than 82 years worth of latency!
What’s next?
What we’re offering today for Speed Brain is only the beginning. Heading into 2025, we have a number of exciting additions to explore and ship.
Leveraging Machine Learning
Our unique position on the Internet provides us valuable insights into web browsing patterns, which we can leverage for improving web performance while maintaining individual user privacy. By employing a generalized data-driven machine learning approach, we can define more accurate and site-specific prefetch predictors for users’ pages.
We are in the process of developing an adaptive speculative model that significantly improves upon our current conservative offering. This model uses a privacy-preserving method to generate a user traversal graph for each site based on same-site Referrer headers. For any two pages connected by a navigational hop, our model predicts the likelihood of a typical user moving between them, using insights extracted from our aggregated traffic data.
This model enables us to tailor rule sets with custom eagerness values to each relevant next page link on your site. For pages where the model predicts high confidence in user navigation, the system will aggressively prefetch or prerender them. If the model does not provide a rule for a page, it defaults to our existing conservative approach, maintaining the benefits of baseline Speed Brain model. These signals guide browsers in prefetching and prerendering the appropriate pages, which helps speed up navigation for users, while maintaining our current safety guardrails.
In lab tests, our ML model improved LCP latency by 75% and predicted visitor navigation with ~98% accuracy, ensuring the correct pages were being prefetched to prevent resource waste for users. As we move toward scaling this solution, we are focused on periodic training of the model to adapt to varying user behaviors and evolving websites. Using an online machine learning approach will drastically reduce the need for any manual update, and content drifts, while maintaining high accuracy — the Speed Brain load solution that gets smarter over time!
Finer observability via RUM
As we’ve mentioned, we believe that our RUM tools offer the best insights for how Speed Brain is helping the performance of your website. In the future, we plan on offering the ability to filter RUM tooling by navigation type so that you can compare the browser rendering of prefetched content versus non-prefetched content.
Prerendering
We are currently offering the ability for prefetching on cacheable content. Prefetching downloads the main document resource of the page before the user’s navigation, but it does not instruct the browser to prerender the page or download any additional subresources.
In the future, Cloudflare’s Speed Brain offering will prefetch content into our CDN cache and then work with browsers to know what are the best prospects for prerendering. This will help get static content even closer to instant rendering.
Argo Smart Browsing: Speed Brain & Smart Routing
Speed Brain, in its initial implementation, provides an incredible performance boost whilst still remaining conservative in its implementation; both from an eagerness, and a resource consumption perspective.
As was outlined earlier in the post, lab testing of a more aggressive model, powered by machine-learning and a higher eagerness, yielded a 75% reduction in LCP. We are investigating bundling this more aggressive, additional implementation of Speed Brain with Argo Smart Routing into a product called “Argo Smart Browsing”.
Cloudflare customers will be free to continue using Speed Brain, however those who want even more performance improvement will be able to enable Argo Smart Browsing with a single button click. With Argo Smart Browsing, not only will cacheable static content load up to 75% faster in the browser, thanks to the more aggressive models, however in times when content can’t be cached, and the request must go forward to an origin server, it will be sent over the most performant network path resulting in an average 33% performance increase. Performance optimizations are being applied to almost every segment of the request lifecycle regardless if the content is static or dynamic, cached or not.
Conclusion
To get started with Speed Brain, navigate to Speed > Optimization > Content Optimization > Speed Brain in the Cloudflare Dashboard and enable it. That’s all! The feature can also be enabled via API. Free plan domains have had Speed Brain enabled by default.
We strongly recommend that customers also enable RUM, found in the same section of the dashboard, to give visibility into the performance improvements provided by Speed Brain and other Cloudflare features and products.
We’re excited to continue to build products and features that make web performance reliably fast. If you’re an engineer interested in improving the performance of the web for all, come join us!
In the early days of the Internet, a single IP address was a reliable indicator of a single user. However, today’s Internet is more complex. Shared IP addresses are now common, with users connecting via mobile IP address pools, VPNs, or behind CGNAT (Carrier Grade Network Address Translation). This makes relying on IP addresses alone a weak method to combat modern threats like automated attacks and fraudulent activity. Additionally, many Internet users have no option but to use an IP address which they don’t have sole control over, and as such, should not be penalized for that.
At Cloudflare, we are solving this complexity with Turnstile, our CAPTCHA alternative. And now, we’re taking the next step in advancing security with Ephemeral IDs, a new feature that generates a unique short-lived ID, without relying on any network-level information.
When a website visitor interacts with Turnstile, we now calculate an Ephemeral ID that can link behavior to a specific client instead of an IP address. This means that even when attackers rotate through large pools of IP addresses, we can still identify and block malicious actions. For example, in attacks like credential stuffing or account signups, where fraudsters attempt to disguise themselves using different IP addresses, Ephemeral IDs allow us to detect abuse patterns more accurately beyond just determining whether the visitor is a human or a bot. Multiple fraudulent actions from the same client are grouped together, improving our detection rate while reducing false positives.
How Ephemeral IDs work
Turnstile detects bots by analyzing browser attributes and signals. Using these aggregated client-side signals, we generate a short-lived Ephemeral ID without setting any cookies or using similar client-side storage. These IDs are intentionally not 100% unique and have a brief lifespan, making them highly effective in identifying patterns of fraud and abuse, without compromising user privacy.
When the same visitor interacts with Turnstile widgets from different Cloudflare customers, they receive different Ephemeral IDs for each one. Additionally, because these IDs change frequently, they cannot be used to track a single visitor over multiple days.
Blue: A single IP address | Green: A single Ephemeral ID The bigger the node, the more frequently seen that ID or IP address was in our dataset.
The graphic above illustrates the complex reality of the modern Internet, where the relationship between clients and IP addresses is far from a simple one-to-one mapping. While some straightforward mappings still exist, they are no longer the norm.
During a period where a site or service is under attack, we observe a “nest” of highly correlated Ephemeral IDs. In the example below, the correlation is based on both Ephemeral ID and IP address.
Nest in the center of the diagram visualizes thousands of IP addresses (blue) which are correlated by the commonly identified Ephemeral IDs (green). The bigger the node, the more frequently seen that ID or IP address was in our dataset.
This is real-world data showing fraudulent activity on one of Cloudflare’s public-facing forms. Even with access to a broad range of IP addresses, attackers struggle to completely disguise their requests because Ephemeral IDs are generated based on patterns beyond IP addresses. This means that even if they rotate addresses, the underlying client characteristics are still detected, making it harder for them to evade our security measures. This makes it easier for us to group these requests and apply appropriate business logic, whether that means discarding the requests, requiring further validation, enforcing multi-factor authentication (MFA), or other actions.
This new client identification technology seamlessly integrates into the broader advancements we’ve made to Turnstile over the past year. Whether you’re protecting login forms, signup pages, or high value transactions, you’ll immediately benefit from this extra layer of abuse detection without needing to change a single line of code. We’ll take care of all the heavy lifting and analysis behind the scenes, and our system will continue to improve its accuracy and effectiveness over time.
What does this mean for you? Starting today, Turnstile will go beyond just identifying bots. Allwebsites protected by Turnstile will automatically benefit from the integration of Ephemeral IDs into our detection logic. This means we can more effectively identify and penalize offending clients without impacting other users on the same network, or IP address, improving security and user experience for everyone.
Ephemeral IDs in action
Everyone benefits from the addition of Ephemeral IDs to the Challenge Platform, but for those who want to use it beyond that, the Ephemeral ID is available through the Turnstile siteverify response. A practical use case for Ephemeral IDs is preventing fraudulent account signups. Imagine a bad actor, a real person using a real device, creating hundreds of fake accounts while rotating IP addresses to avoid detection. By ingesting Ephemeral IDs and logging them alongside your account creation logs, you can set up alerts based on account creation thresholds in real-time or retroactively investigate suspicious activity. Even though Ephemeral IDs are short-lived and may have changed by the time an investigation begins, they still provide valuable insights through aggregate analysis, and provide an extra dimension to identify fraud and abuse.
For our Turnstile Enterprise and Bot Management Enterprise customers, you now have the option to access Ephemeral IDs directly through the Turnstile siteverify response. Get in touch with your Account Executive to enable it on your account.
Below is an example of siteverify response for those who have enabled Ephemeral IDs.
We launched Turnstile with a bold mission: to redefine CAPTCHAs with a frictionless, privacy-first solution that eliminates the annoyance of picking puzzles, selecting stoplights, and clicking crosswalks to prove our humanity. It’s incredible to think that Turnstile has been generally available for a whole year now! During this time, it has blocked over one trillion bots, and is actively protecting more than 350,000 domains worldwide.
As we celebrate Turnstile’s second birthday, we’re proud of the progress we’ve made and thrilled to introduce our latest innovations. While Ephemeral IDs represent the newest evolution of Turnstile, they’re part of our ongoing commitment to continuous improvement. Over the past year, we’ve also introduced a Cloudflare Pages Plugin and partnered with Google Firebase, ensuring that developers have easy access to Turnstile.
Earlier this year, we also launched Pre-Clearance for Turnstile, integrating it with Cloudflare WAF’s Challenge action, making it easier for customers to use Cloudflare’s Application Security products together. If you want to learn more about how to use Turnstile with Cloudflare’s Bot Management and WAF in more detail, check it out here!
We’re incredibly excited about what’s ahead. The introduction of Ephemeral IDs is just one of many innovations on the horizon. We’re committed to making the Internet a safer, more private place for everyone, eliminating the need for frustrating CAPTCHA puzzles while keeping security our top priority. And with our free tier remaining open and unlimited for all, there’s no barrier to getting started with Turnstile today.
Join us in revolutionizing online security –get started with Turnstilenow or dive straight into ourhow-to guides. Let’s help make the Internet a better place, together!
Cloudflare Stream is an end-to-end solution for video encoding, storage, delivery, and playback. Our focus has always been on simplifying all aspects of video for developers. This goal continues to motivate us as we introduce first-class portrait (vertical) video support today. Newly uploaded or ingested portrait videos will now automatically be processed in full HD quality.
Why portrait video
In the past few years, the popularity of portrait video has exploded, motivated by short-form video content applications such as TikTok or YouTube Shorts. However, Cloudflare customers have been confused as to why their portrait videos appear to be lower quality when viewed on portrait-first devices such as smartphones. This is because our video encoding pipeline previously did not support high-quality portrait videos, leading them to be grainy and lower quality. This pain point has now been addressed with the introduction of high-definition portrait video.
The current stream pipeline
When you upload a video to Stream, it is first encoded into several different “renditions” (sizes or resolutions) before delivery. This is done in order to enable playback in a wide variety of network conditions, as well as to standardize the way a video is experienced. By using these adaptive bitrate renditions, we are able to offer viewers the highest quality streaming experience which fits their network bandwidth, meaning someone watching a video with a slow mobile connection would be served a 240p video (a resolution of 320×240 pixels) and receive the 1080p (a resolution of 1920×1080 pixels) version when they are watching at home on their fiber Internet connection. This encoding pipeline follows one of two different paths:
The first path is our video on-demand (VOD) encoding pipeline, which generates and stores a set of encoded video segments at each of our standard video resolutions. The other path is our on-the-fly encoding (OTFE) pipeline, which uses the same process as Stream Live to generate resolutions upon user request. Both pipelines work with the set of standard resolutions, which are identified through a constrained target (output) height. This means that we encode every rendition to heights of 240 pixels, 360 pixels, etc. up to 1080 pixels.
When originally conceived, this encoding pipeline was not designed with portrait video in mind because portrait video was less common. As a result, portrait videos were encoded with lower quality dimensions that were consistent with landscape video encoding. For example, a portrait HD video would have the dimensions 1920×1080 — scaling that down to the height of a landscape HD video would result in the much smaller output of 1080×606. However, current smartphones all have HD displays, making the discrepancy clear when a portrait video is viewed in portrait mode on a phone. With this new change to our encoding pipeline, all newly uploaded portrait videos will now be automatically encoded with constrained target width, using a new set of standard resolutions for portrait video. These resolutions are the same as the current set of landscape resolutions, but with the dimensions reversed: 240×426 up to 1080×1920.
Technical details
As the Stream intern this summer, I was tasked with this project, as well as the expectation of shipping a long-requested change, by the end of my internship. The first step in implementing this change was to familiarize myself with the complex architecture of Stream’s internal systems. After this, I began brainstorming a few different implementation decisions, like how to consistently track orientation through various stages of the pipeline. Following a group discussion to decide which choices would be the most scalable, least complex, and best for users, it was time to write the technical specification.
Due to the implementation method we chose, making this change involved tracing the life of a video from upload to delivery through both of our encoding pipelines and applying different logic for portrait videos. Previously, all video renditions were identified by their height at each stage of the pipeline, making certain parts of the pipeline completely agnostic to the orientation of a video. With the proposed changes, we would now be using the constraining dimension and orientation to identify a video rendition. Therefore, much of the work involved modifying the different portions of the pipeline to use these new parameters.
The first area of the pipeline to be modified was the Stream API service, which is the process which handles all Stream API calls. The API service enqueues the rendition encoding jobs for a video after it is uploaded, so it was necessary to introduce a new set of renditions designed for portrait videos, and enqueue the corresponding encoding jobs. The queuing system is handled by our in-house queue management system, which handles jobs generically and therefore did not require any changes.
Following this, I tackled the on-the-fly encoding pipeline. The area of interest here was the delivery portion of our pipeline, which generated the set of encoding resolutions to pass on to our on-the-fly encoder. Here I also introduced a new set of portrait renditions and the corresponding logic to encode them for portrait videos. This part of the backend is written and hosted on Cloudflare Workers, which made it very easy and quick to deploy and test changes.
Finally, we wanted to change how we presented these quality levels to users in the Stream built-in player and thought that using the new constrained dimension rather than always showing the height would feel more familiar. For portrait videos, we now display the size of the constraining dimension, which also means quality selection for portrait videos encoded under our old system now more accurately reflects their quality, too. As an example, a 9:16 portrait video would have been encoded to a maximum size of 608×1080 by the previous pipeline. Now, such a rendition will be marked as 608p rather than the full-quality 1080p, which would be a 1080×1920 rendition.
Stream as a whole is built on many of our own Developer Platform products, such as Workers for handling delivery, R2 for rendition storage, Workers AI for automatic captioning, and Durable Objects for bitrate observation, all of which enhance our ability to deploy and ship new updates quickly. Throughout my work on this project, I was able to see all of these pieces in action, as well as gain a new understanding of the powerful tools Cloudflare offers for developers.
Results and findings
After the change, portrait videos are now encoded to higher resolutions and visibly appear to be higher quality. To confirm these differences, I analyzed the effect of the pipeline change on four different sample videos using the peak-signal-to-noise ratio (PSNR, a mathematical representation of image quality). Since the old pipeline produced lower resolution videos, the comparison here is between an upscaled version of the old pipeline rendition and the current pipeline rendition. In the graph below, higher values reflect higher quality relative to the unencoded original video.
According to this metric, we see an increase in quality from the pipeline changes as high as 8%. However, the quality increase is most noticeable to the human eye in videos that feature fine details or a high amount of movement, which is not always captured in the PSNR. For example, compare a side-by-side of a frame from the book sample video encoded both ways:
The difference between the old and new encodings is most clear when zoomed in:
Maximize the Stream player and look at the quality selector (in the gear menu) to see the new quality level labels – select the highest option to compare. Note the improved sharpness of the text in the book sample as well as the improved detail in the hair and eye shadow of the hair and makeup sample.
Implementation challenges
Due to the complex nature of our encoding pipelines, there were several technical challenges to making a large change like this. Aside from simply uploading videos, many of the features we offer, like downloads or clipping, require tweaking to produce the correct video renditions. This involved modifying many parts of the encoding pipeline to ensure that portrait video logic was handled.
There were also some edge cases which were not caught until after release. One release of this feature contained a bug in the on-the-fly encoding logic which caused a subset of new portrait livestream renditions to have negative bitrates, making them unusable. This was due to an internal representation of video renditions’ constraining dimensions being mistakenly used for bitrate observation. We remedied this by increasing the scope of our end-to-end testing to include more portrait video tests and live recording interaction tests.
Another small bug caused downloading very small videos to sometimes fail. This was because for videos under 240p, our smallest encoding resolution, the non-constraining dimension was not being properly scaled to match the aspect ratio of the video, causing some specific combinations of dimensions to be interpreted as portrait when they should have been landscape, and vice versa. This bug was fixed quickly, but was not initially caught after the release since it required a very specific set of conditions to activate. After this experience, I added a few more unit tests involving small videos.
That’s a wrap
As my internship comes to a close, reflecting on the experience makes me grateful for all the team members who have helped me throughout this time. I am very glad to have shipped this project which addresses a long-standing concern and will have real-world customer impact. Support for high-definition portrait video is now available, and we will continue to make improvements to our video solutions suite. You can see the difference yourself by uploading a portrait video to Stream! Or, perhaps you’d like to help build a better Internet, too — our internship and early talent programs are a great way to jumpstart your own journey.
Sample video acknowledgements: The sample video of the book was created by the Stream Product Manager and shows the opening page of The Strange Wonder of Roots by Evan Griffith (HarperCollins). The hair and makeup fashion video was sourced from Mixkit, a great source of free media for video projects.
As part of Cloudflare’s mission to help build a better Internet, we’re continuously integrating with other networks and service providers, ensuring ease of use for anyone, anywhere, anytime.
Today, we’re excited to announce Cloud Connector – a brand-new way to put Cloudflare in front of popular public cloud services, protecting your assets, accelerating applications, and routing your traffic between multiple cloud providers seamlessly.
Cloud Connector is a natural extension of Cloudflare’s Connectivity Cloud, which aims to simplify and secure the complex web of connections across today’s enterprises. Imagine Origin Rules, but managed by Cloudflare, available for all plans, created with just a few clicks, and working out of the box without the need for additional rules. It allows you to route traffic to different public clouds without complicated workarounds. This means you can now direct specific requests to AWS S3, Google Cloud Storage, Azure Blob Storage, or our own R2, even if these services are not set as the DNS target for your hostname.
Whether you’re an e-commerce site looking to route image traffic to the best-performing cloud storage for faster load times, a media company distributing video content efficiently across various cloud providers, or a developer wanting to simplify backend configurations, Cloud Connector is designed for you. It’s available for all Cloudflare plans, with a particular focus on Free, Pro, and Business customers.
The Host header challenge
Before Cloud Connector, many of our Free, Pro, and Business customers faced a significant challenge: it was not straightforward to route traffic for the same hostname to one or more cloud providers on the backend. Something as simple as directing example.com/images to AWS S3 while keeping the rest of your site served by your origin web servers required multiple non-trivial steps to accomplish. Some users changed their setups, leveraging either Workers, chaining hostnames, or explored putting other service providers in front of their cloud destinations. While functional, this approach added complexity and increased effort, leading to frustration.
Enterprise customers had Host Header and Resolve Override features to manage this, but the security and abuse risks associated with Host Header modification kept these features out of reach for everyone else.
Simplifying multi-cloud routing
Today, we’re excited to unveil Cloud Connector, designed to address these challenges head-on.
Imagine you’re managing a website where images are stored on AWS S3, videos on Google Cloud Storage, and static assets on Azure Blob Storage. Traditionally, routing traffic to these different providers would involve a series of complex steps and configurations. With Cloud Connector, this process is streamlined. You can seamlessly direct traffic for your hostname to multiple origins with just a few clicks. The setup is straightforward and doesn’t require any advanced configurations or additional rules.
For instance, you can now direct example.com/images to a specific R2 bucket in your Cloudflare account effortlessly. This feature, previously exclusive to Enterprise customers, is now available to all users, ensuring that everyone can benefit from simplified cloud routing.
How to configure
Getting started with Cloud Connector is easy. Navigate to the Rules > Cloud Connector tab in your zone dashboard. From there, select your cloud provider:
You’ll be presented with an interface where you can configure the destination hostname of your object storage bucket. Ensure that your bucket URL matches the expected schema for your cloud provider, such as .amazonaws.com for AWS S3 or storage.googleapis.com for Google Cloud Storage. In case of R2, your bucket needs to be public and associated with a custom domain:
Once you’ve configured your bucket, the next step is to determine which traffic is routed by Cloud Connector. Using the familiar rule builder interface that powers all our Rules products, you can filter requests based on hostname, URI path, headers, cookies, source IP, AS number, and more.
After configuring, deploy your rule, and it will be immediately effective:
Cloud Connector is intentionally placed at the end of the Ruleset Engine phase sequence to ensure it works out of the box, even if there are active origin or configuration rules with matching criteria.
Cloud Connector simplifies your setup, allowing you to focus on what matters most: delivering a seamless experience for your users. By leveraging Cloudflare’s built-in security, your assets are automatically protected, and direct traffic routing optimizes application performance, accelerating load times and reducing your cloud bandwidth costs.
Behind the scenes: how Cloud Connector works
To build Cloud Connector, we leveraged our powerful, high performance Ruleset Engine and integrated it with various cloud providers, ensuring compatibility and optimal performance. Throughout this process, we were focused on making the setup as intuitive as possible, reducing the need for additional configurations and making it accessible to users of all technical backgrounds.
At its core, Cloud Connector builds on Cloudflare’s existing Ruleset Engine, the same technology that powers Origin Rules. Origin Rules typically operate during the http_request_originphase, where they manage how requests are routed to different origins. A phase, in Cloudflare’s system, represents a specific stage in the life of a request where rulesets can be executed. Each phase has a dedicated purpose, with rules defined at the account and zone levels to control different aspects of a request’s journey through our network.
Phases are essential because they allow us to apply actions at precise points in the request flow. For example, the http_request_origin phase focuses on routing, ensuring that traffic is directed to the correct origin based on the rules you set. By defining specific phases, we can optimize performance and enforce security measures at the right time without overlap or conflicts between different actions.
Rather than creating an entirely new system, we extended the existing “route” action within Ruleset Engine to handle a specific set of pre-approved cloud provider endpoints, such as AWS S3, Google Cloud Storage, Azure Blob Storage, and Cloudflare R2.
To maintain the modularity of our system and avoid introducing product-specific abstractions into our core Ruleset Engine control plane, we developed a thin API translator layer on Workers. This layer acts as an intermediary between the user-facing Cloud Connector API and the underlying Ruleset Engine API.
When a user creates a Cloud Connector rule, it’s translated on the backend into a series of existing Ruleset Engine-based actions. For instance, if a user sets up a rule to route traffic to an AWS S3 bucket, our system translates this into actions that adjust the host header and origin settings to point to the S3 endpoint. This allows a single Cloud Connector rule to be decomposed into multiple rules within a zone’s entry point ruleset.
These rules are processed in reverse order, adhering to a “last rule wins” approach. This ensures that the final matching rule determines the traffic’s routing, preserving the behavior users expect. For example, if traffic is routed to an AWS S3 bucket, the system will first match the traffic based on the URI, then disable SSL if necessary, and finally route to the S3 origin. Once the appropriate rule is matched, a “skip” action is invoked to prevent any further rules from altering the traffic, which prevents unintended behavior like disabling SSL for traffic routed to a different cloud provider.
When users retrieve their Cloud Connector rules, the system reverses this process, reconstructing the original actions from the decomposed rules. This ensures that users see their configurations as they originally defined them, without needing to understand the underlying complexities.
To support Cloud Connector’s unique requirements, we introduced a new request phase, http_request_cloud_connector. As the final request phase, this ensures that Cloud Connector rules have the last say in traffic routing decisions. This priority prevents conflicts with other routing rules, ensuring that traffic is securely and accurately routed according to the user’s intent.
Cloudflare is committed to building Cloudflare products on Cloudflare, leveraging existing technologies while innovating to meet new challenges. By building on Origin Rules and Workers, introducing the http_request_cloud_connector phase, and creating a thin API translation layer, we’ve developed a solution that simplifies multi-cloud routing without compromising on performance or security.
What’s next for Cloud Connector?
The current version of Cloud Connector is just the beginning. Our vision extends far beyond supporting object storage. In the future, we aim to support all kinds of HTTP cloud services, including load balancers, compute services, and more. We want Cloud Connector to be the primary way for Cloudflare users to discover and manage the cloud services they use across multiple providers.
Imagine being able to configure secure traffic routing to any cloud service without having to worry about DNS settings, Host headers, or SSL implementation. Our goal is to make Cloud Connector a comprehensive tool that simplifies the entire process, ensuring that you can focus on what matters most: building and scaling your web applications.
Get started
Cloud Connector is available in beta to all plans and is completely free. The rollout has started this month (August) and will be gradually released to all users throughout 2024. Once rolled out, users will start seeing this new product under the Rules > Cloud Connector tab of their zone dashboard. No beta access registration is required.
Learn more
Learn more about setting up and using Cloud Connector in developer documentation. Share your feedback in community forums – your opinion is invaluable and directly influences our product and design decisions, helping us to make Rules products even better.
At Cloudflare, we’re big supporters of the open-source community – and that extends to our approach for Workers AI models as well. Our strategy for our Cloudflare AI products is to provide a top-notch developer experience and toolkit that can help people build applications with open-source models.
We’re excited to be one of Meta’s launch partners to make their newest Llama 3.1 8B model available to all Workers AI users on Day 1. You can run their latest model by simply swapping out your model ID to @cf/meta/llama-3.1-8b-instruct or test out the model on our Workers AI Playground. Llama 3.1 8B is free to use on Workers AI until the model graduates out of beta.
Meta’s Llama collection of models have consistently shown high-quality performance in areas like general knowledge, steerability, math, tool use, and multilingual translation. Workers AI is excited to continue to distribute and serve the Llama collection of models on our serverless inference platform, powered by our globally distributed GPUs.
The Llama 3.1 model is particularly exciting, as it is released in a higher precision (bfloat16), incorporates function calling, and adds support across 8 languages. Having multilingual support built-in means that you can use Llama 3.1 to write prompts and receive responses directly in languages like English, French, German, Hindi, Italian, Portuguese, Spanish, and Thai. Expanding model understanding to more languages means that your applications have a bigger reach across the world, and it’s all possible with just one model.
Llama 3.1 also introduces native function calling (also known as tool calls) which allows LLMs to generate structured JSON outputs which can then be fed into different APIs. This means that function calling is supported out-of-the-box, without the need for a fine-tuned variant of Llama that specializes in tool use. Having this capability built-in means that you can use one model across various tasks.
Workers AI recently announced embedded function calling, which is now usable with Meta Llama 3.1 as well. Our embedded function calling gives developers a way to run their inference tasks far more efficiently than traditional architectures, leveraging Cloudflare Workers to reduce the number of requests that need to be made manually. It also makes use of our open-source ai-utils package, which helps you orchestrate the back-and-forth requests for function calling along with other helper methods that can automatically generate tool schemas. Below is an example function call to Llama 3.1 with embedded function calling that then stores key-values in Workers KV.
const response = await runWithTools(env.AI, "@cf/meta/llama-3.1-8b-instruct", {
    messages: [{ role: "user", content: "Greet the user and ask them a question" }],
    tools: [{
        name: "Store in memory",
        description: "Store everything that the user talks about in memory as a key-value pair.",
        parameters: {
            type: "object",
            properties: {
                key: {
                        type: "string",
                        description: "The key to store the value under.",
				},
                value: {
                        type: "string",
                        description: "The value to store.",
				},
            },
			required: ["key", "value"],
		},
        function: async ({ key, value }) => {
                await env.KV.put(key, value);

                return JSON.stringify({
                    success: true,
			});
		}
	}]
})
We’re excited to see what you build with these new capabilities. As always, use of the new model should be conducted with Meta’s Acceptable Use Policy and License in mind. Take a look at our developer documentation to get started!
The collective thoughts of the interwebz
Manage Consent
To provide the best experiences, we use technologies like cookies to store and/or access device information. Consenting to these technologies will allow us to process data such as browsing behavior or unique IDs on this site. Not consenting or withdrawing consent, may adversely affect certain features and functions.
Functional
Always active
The technical storage or access is strictly necessary for the legitimate purpose of enabling the use of a specific service explicitly requested by the subscriber or user, or for the sole purpose of carrying out the transmission of a communication over an electronic communications network.
Preferences
The technical storage or access is necessary for the legitimate purpose of storing preferences that are not requested by the subscriber or user.
Statistics
The technical storage or access that is used exclusively for statistical purposes.The technical storage or access that is used exclusively for anonymous statistical purposes. Without a subpoena, voluntary compliance on the part of your Internet Service Provider, or additional records from a third party, information stored or retrieved for this purpose alone cannot usually be used to identify you.
Marketing
The technical storage or access is required to create user profiles to send advertising, or to track the user on a website or across several websites for similar marketing purposes.