Post Syndicated from Sheng Chen original https://aws.amazon.com/blogs/architecture/secure-amazon-elastic-vmware-service-amazon-evs-with-aws-network-firewall/
Amazon Elastic VMware Service (Amazon EVS) helps organizations migrate, run, and scale VMware workloads natively on AWS. It delivers a VMware Cloud Foundation (VCF) environment that operates directly within your Amazon Virtual Private Cloud (Amazon VPC) on Amazon EC2 bare-metal instances. The solution helps customers accelerate cloud migrations and data center exits without needing to refactor existing applications.
For customers considering a hybrid cloud architecture, a unified network security solution is required to protect application traffic across Amazon EVS environments, Amazon VPCs, on-premises data centers and the internet. It also needs to provide a single point of control for firewall policy management, centralized logging, and monitoring to streamline network security operations.
AWS Network Firewall is a managed firewall and intrusion detection and prevention service (IDS/IPS) that can help address these requirements. Built on AWS managed infrastructure, it automatically scales with traffic demands while maintaining high availability and consistent performance. The service provides centralized policy management and traffic inspection across multiple VPCs and AWS accounts. Additionally, it provides comprehensive visibility and reporting through firewall log collections to Amazon Simple Storage Service (Amazon S3), Amazon CloudWatch Logs, or Amazon Data Firehose.
In this post, we demonstrate how to utilize AWS Network Firewall to secure an Amazon EVS environment, using a centralized inspection architecture across an EVS cluster, VPCs, on-premises data centers and the internet. We walk through the implementation steps to deploy this architecture using AWS Network Firewall and AWS Transit Gateway.
Architecture overview
AWS Network Firewall operates as a “bump-in-the-wire” solution, which transparently inspects and filters network traffic across Amazon VPCs. It is inserted directly into the traffic path by updating VPC or Transit Gateway route tables, allowing it to examine all packets without requiring any changes to the existing application flow patterns.
The following diagram depicts the architecture overview of our centralized inspection model using AWS Network Firewall.
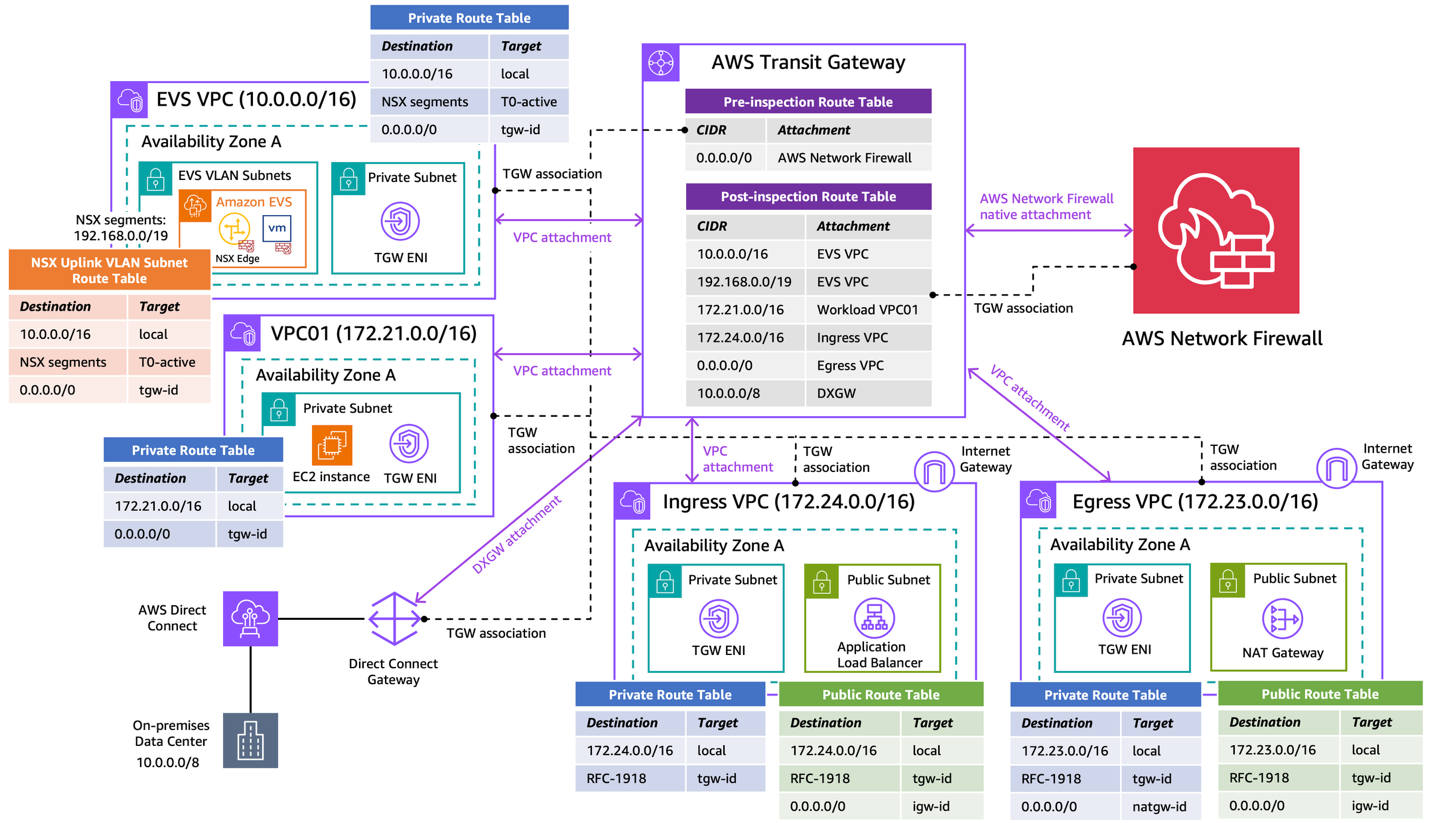
Figure 1: Secure Amazon EVS with AWS Network Firewall using centralized inspection architecture
The Amazon EVS environment is deployed directly within a customer VPC (i.e. EVS VPC), which consists of EVS VLAN subnets that form the underlay networks for VCF deployment. This infrastructure provides connectivity for NSX overlay networks, host management, vMotion, and vSAN. Amazon VPC Route Server enables dynamic routing between the underlay networks and overlay networks. For more information, see Concepts and components of Amazon EVS.
The architecture also includes a standard workload VPC (i.e. VPC01), and a Direct Connect Gateway connects to the on-premises data center via an AWS Direct Connect connection. We use a dedicated egress VPC with NAT gateways for centralized internet egress, and a separate ingress VPC with Application Load Balancers to terminate ingress web traffic and steer flows back to the target services.
With this architecture, the following traffic flow patterns can be inspected:
East-West Traffic:
- Between EVS VPCs and Workload VPCs
- Between Workload VPCs
North-South Traffic:
- Between EVS/Workload VPCs and on-premises
- Between EVS/Workload VPCs and internet
- Between on-premises and internet
The centralized inspection architecture provides several benefits:
- Single point of control for network security inspection across multiple VPCs
- Enhanced rule enforcement across AWS infrastructure, on-premises resources, and the internet
- Centralized logging and monitoring
For this demo we use the AWS Network Firewall native integration with AWS Transit Gateway capability to streamline firewall deployment and management. With a native firewall attachment, AWS automatically provisions and manages all the necessary VPC resources, reducing the operational overhead of managing subnets, route tables, and firewall endpoints within the inspection VPC.
Prerequisites
This post assumes familiarity with: AWS Command Line Interface (AWS CLI), Amazon VPC, Amazon EC2, NAT gateway, Application Load Balancer, Internet gateway, AWS Direct Connect, AWS Transit Gateway and the VMware VCF platform.
The following prerequisites are necessary to complete this solution.
- An EVS VPC includes:
- An Amazon EVS cluster (minimum 4x i4i nodes)
- VPC CIDR: 10.0.0.0/16
- NSX Segments CIDR: 192.168.0.0/19 (summarized)
- A VPC Route Server deployed in the EVS VPC to receive NSX segment routes via BGP dynamic routing. Refer to the EVS User Guide for more details.
- A Workload VPC (VPC01):
- CIDR: 172.21.0.0/16
- An Egress VPC:
- CIDR: 172.23.0.0/16
- 1x Internet Gateway
- 1x NAT Gateway
- An Ingress VPC:
- CIDR: 172.24.0.0/16
- 1x Internet Gateway
- 1x Application Load Balancer
- Optional: a Direct Connect Gateway:
- connecting to the on-premises environment (10.0.0.0/8)
Note: The CIDR blocks used in this example are for demo purposes only; change the address spaces to match your own networking environment. The design can also be scaled to include additional EVS environments and/or other VPCs based on workload needs.
Walkthrough
In this section, we walk through the implementation steps to deploy the centralized inspection architecture with AWS Network Firewall and AWS Transit Gateway. We focus on the overall network integration of the architecture without diving into the detailed configurations of AWS Network Firewall or Transit Gateway.
1. Create an AWS Transit Gateway
In the VPC console, create a Transit Gateway. Make sure to deselect the following options:
- Default route table association
- Default route table propagation
Create two empty transit gateway route tables and associate them with the Transit Gateway.
- Pre-inspection route table: steers traffic into the AWS Network Firewall for centralized inspection
- Post-inspection route table: returns traffic back to its original destination after inspection and is permitted by the AWS Network Firewall
2. Attach VPCs to the Transit Gateway
Attach all four VPCs (EVS, VPC01, Ingress, Egress) to the same Transit Gateway. The Direct Connect Gateway can also be attached to the Transit Gateway if AWS Network Firewall is needed to inspect traffic between the on-premises environment and AWS or the internet.
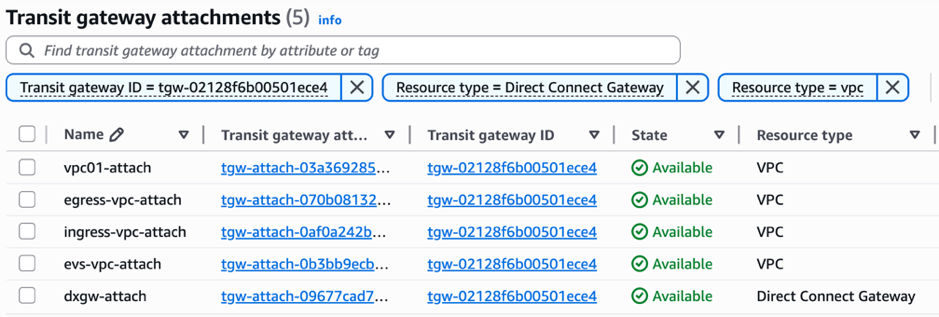
Figure 2: Attach VPCs to the Transit Gateway
Associate all attachments to the pre-inspection Transit Gateway route table.
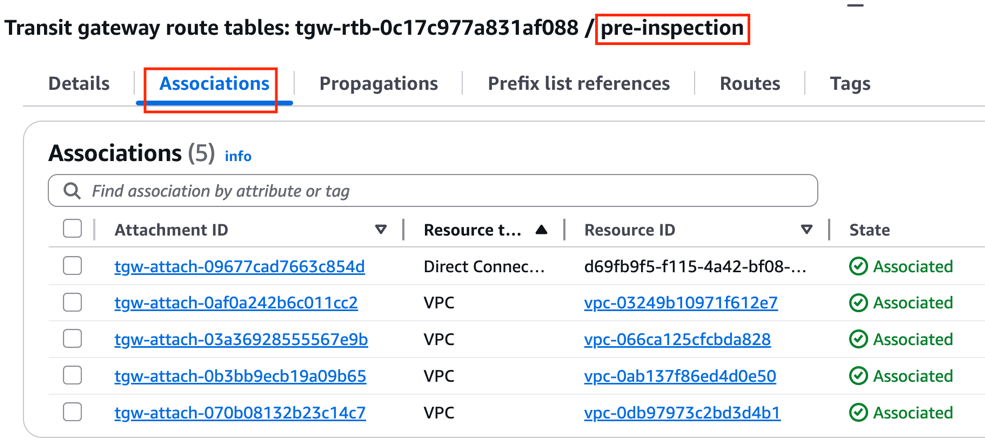
Figure 3: Associate VPC attachments to the pre-inspection route table
3. Create an AWS Network Firewall with Transit Gateway native integration
In the Network Firewall section of the VPC console, choose Create firewall.
At the Attachment type section, select Transit Gateway to enable native integration with the existing Transit Gateway.
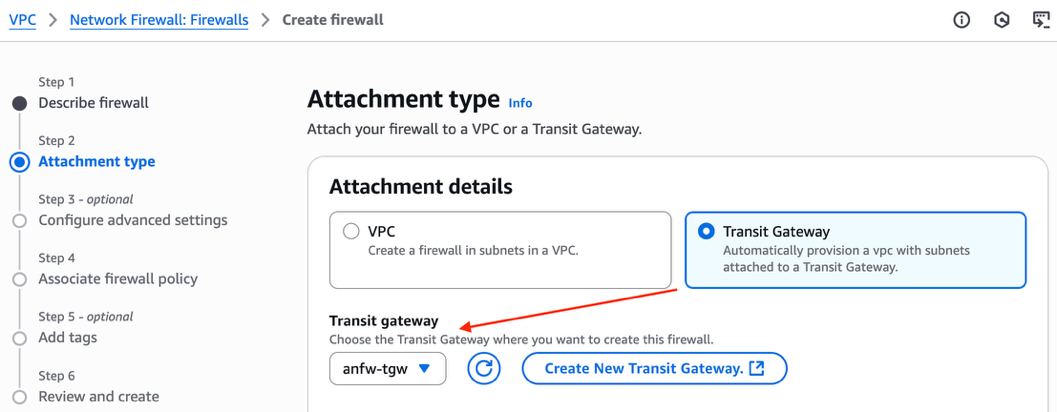
Figure 4: Enable AWS Network Firewall native integration with Transit Gateway
At the Logging configuration, enable the following log types with CloudWatch log group as the log destination. Create a log group for each log type in the CloudWatch Console.
- Alert:
/anfw-centralized/anfw01/alert - Flow:
/anfw-centralized/anfw01/flow
Create and associate an empty firewall policy to deploy the AWS Network Firewall instance. The firewall policy contains a list of rule groups that define how the firewall inspects and manages traffic. This empty firewall policy can be configured later.
With the Transit Gateway native integration enabled, a Transit Gateway attachment is automatically created for the AWS Network Firewall, with the resource type shown as Network Function. In addition, the Appliance Mode is automatically enabled for the firewall attachment to make sure the Transit Gateway continues to use the same Availability Zone (AZ) for the attachment over the lifetime of a flow.
Associate the firewall attachment to the post-inspection Transit Gateway route table.
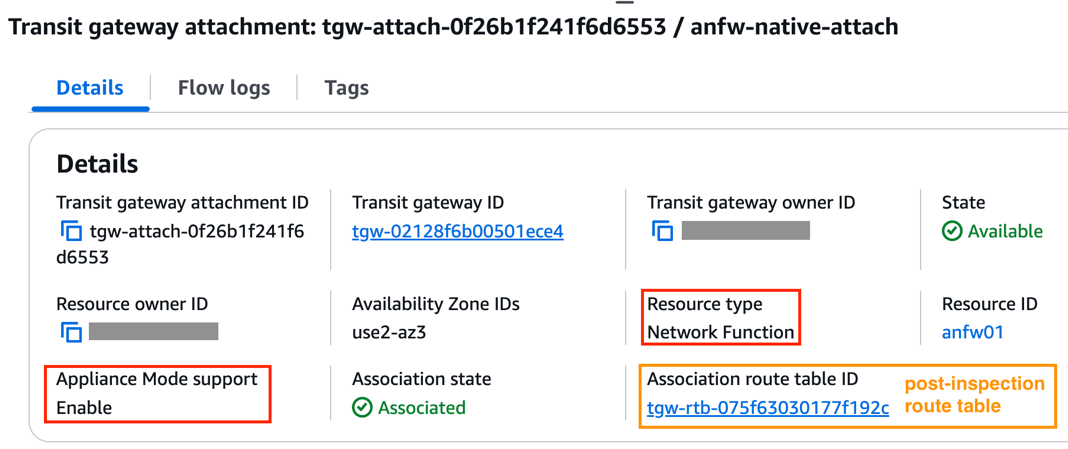
Figure 5: AWS Network Firewall native attachment
4. Update Transit Gateway route tables
Update the pre-inspection Transit Gateway route table with a default route that points to the AWS Network Firewall attachment. This makes sure traffic that arrives to the Transit Gateway from all VPC attachments and the Direct Connect Gateway attachment is sent to the firewall for centralized inspection.
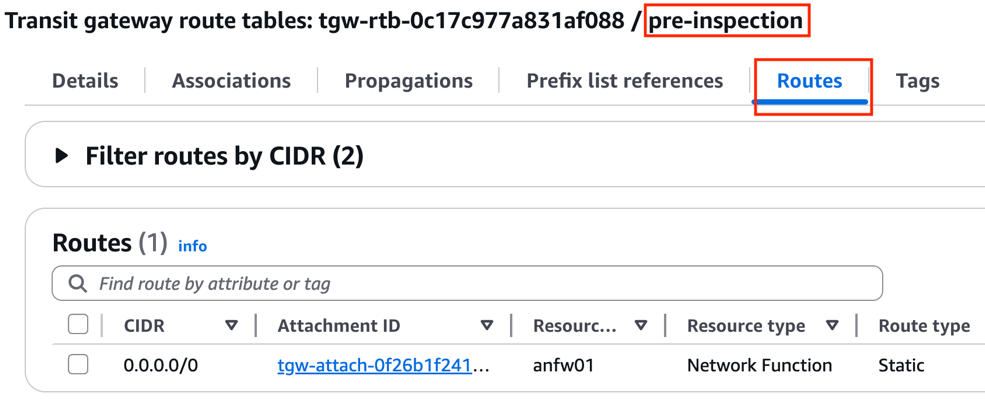
Figure 6: Transit Gateway pre-inspection route table
Add the following static routes to the post-inspection route table to direct return traffic back to each VPC and the Direct Connect Gateway accordingly.
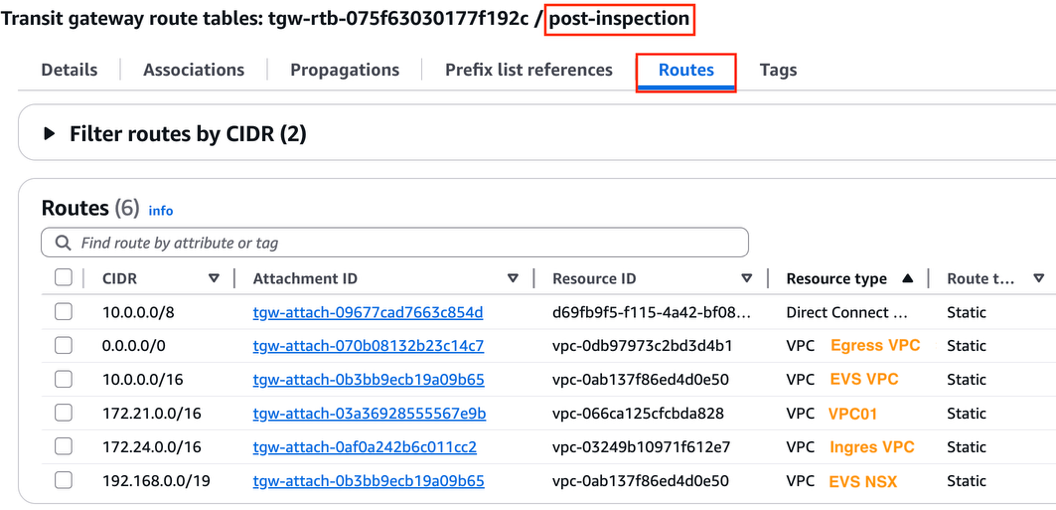
Figure 7: Transit Gateway post-inspection route table
5. Update VPC route tables
Finally, update route tables at each VPC as per the following table.
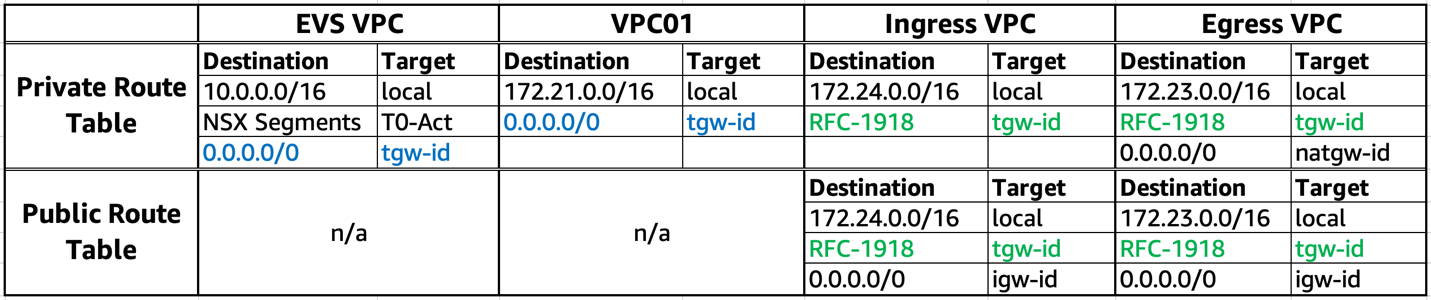
Make sure to add the following routes at the relevant VPC route tables:
- EVS VPC and VPC01 have a default route (marked in blue) to steer all egress flows into AWS Network Firewall for centralized inspection.
- Ingress VPC and Egress VPC have RFC-1918 routes (marked in green) to direct return traffic to the Transit Gateway.
Within the EVS VPC, notice the NSX segment routes are automatically propagated to the NSX uplink subnet route table and the private subnet route table via the VPC Route Server.
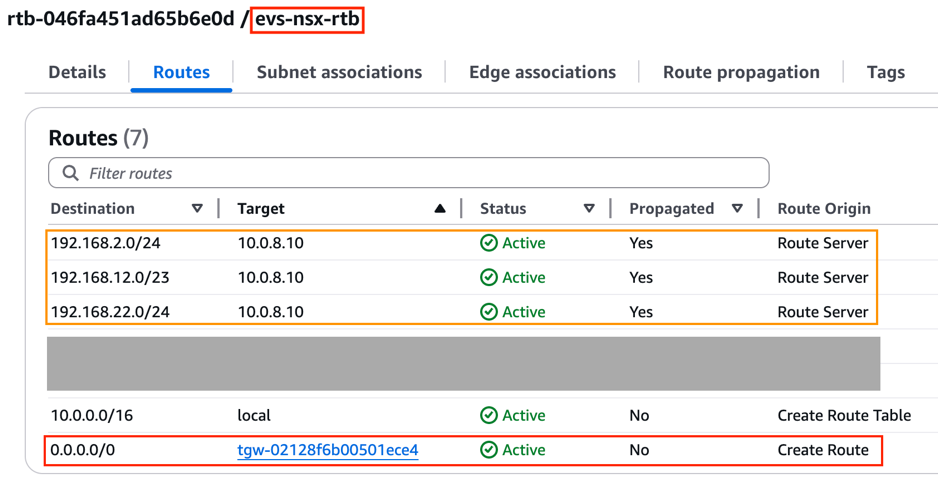
Figure 8: NSX uplink subnet route table within EVS VPC
A centralized security inspection architecture has now been deployed for the EVS environment, using AWS Network Firewall with Transit Gateway native integration.
6. Testing
Egress inspection (FQDN filtering)
To test egress inspection from EVS VPC or VPC01 to the internet, create a stateful rule group for the firewall instance using FQDN filtering:
- Rule group format: Domain list
- Domain names: .google.com
- Source IPs: 192.168.0.0/19, 172.21.0.0/16
- Protocols: HTTP & HTTPS
- Action: Allow
As expected, testing web access from a virtual machine (192.168.12.10) within the EVS environment to the allowed domain (i.e. google.com) is permitted by the AWS Network Firewall. However, access to unauthorized domain (i.e. facebook.com) is blocked at the firewall with an alert trigged, which can be verified at the CloudWatch log group at /aws/network-firewall/alert/.
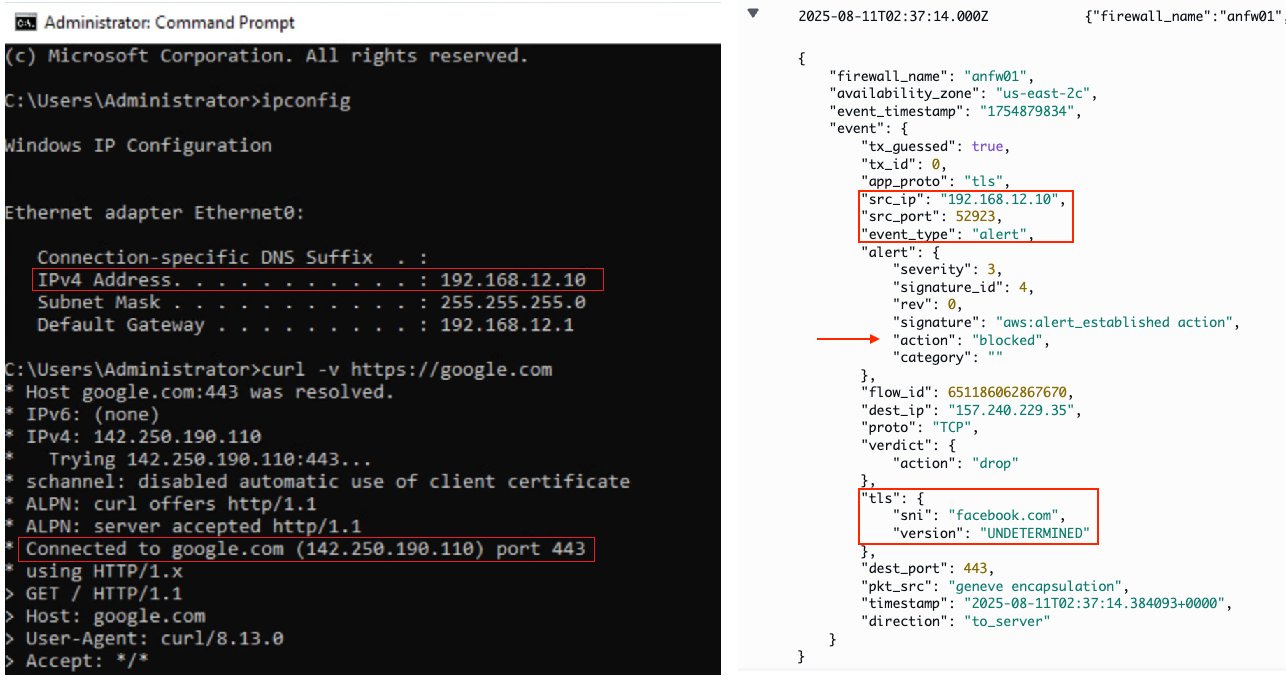
Figure 9: Egress inspection from EVS to internet with FQDN filtering
Ingress inspection
Create another stateful rule group to allow Application Load Balancers deployed within the Ingress VPC to access a web server running in the EVS environment via HTTP protocol:
- Rule group format: Standard stateful rule
- Geographic IP Filtering: Disable Geographic IP filtering
- Protocol: HTTP
- Source: 172.24.0.0/16
- Source Port: ANY
- Destination: 192.168.12.10/32
- Destination Port ANY
- Traffic direction: Forward
- Action: Alert
The CloudWatch firewall logs show an Application Load Balancer (172.24.6.45) from the Ingress VPC can establish HTTP connection to the EVS web server (192.168.12.10). Additionally, the Application Load Balancer has successfully registered the EVS web server as a remote IP target.
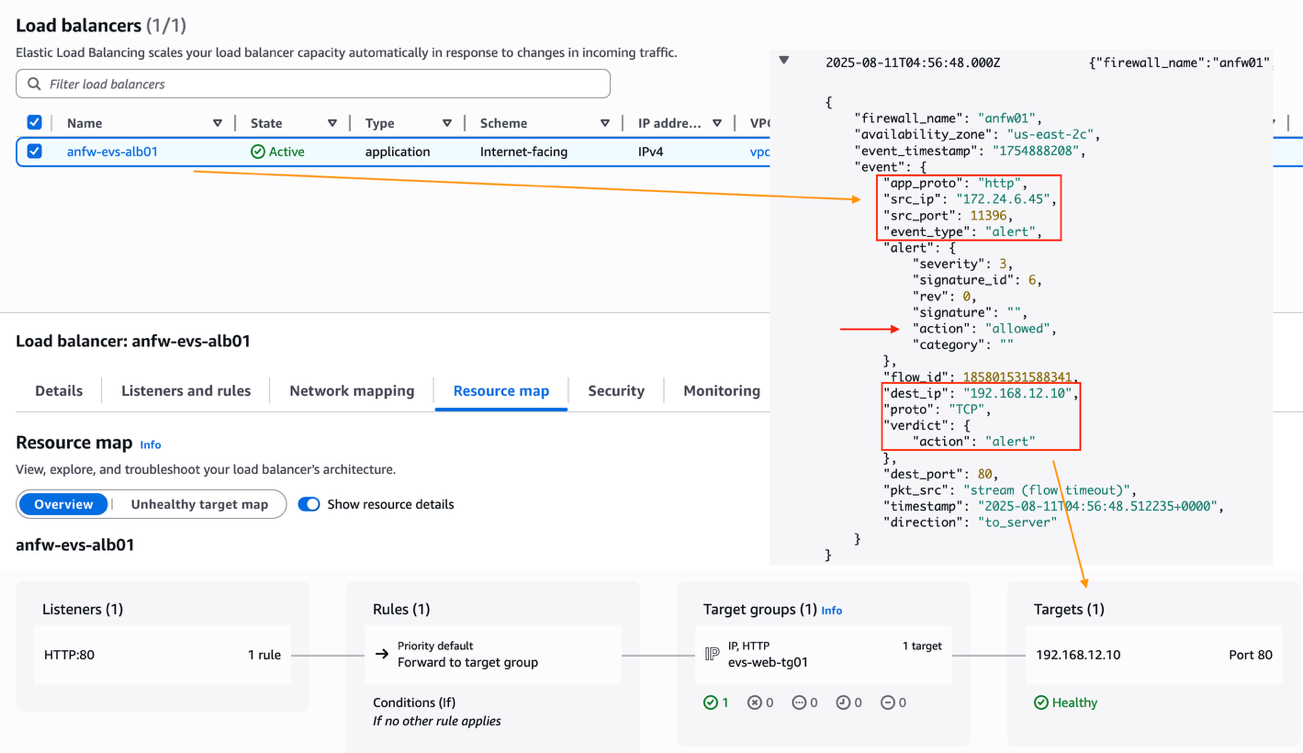
Figure 10: Ingress inspection from Ingress VPC to EVS
East-West inspection
For East-West inspection testing, update the previous stateful rule group to add a new rule to block ICMP traffic from VPC01 to the EVS VPC.
- Rule group format: Standard stateful rule
- Geographic IP Filtering: Disable Geographic IP filtering
- Protocol: ICMP
- Source: 172.21.0.0/16
- Source Port: ANY
- Destination: 192.168.0.0/19
- Destination Port: ANY
- Action: Drop
As a result, pings from an EC2 instance (172.21.128.4) from VPC01 to the EVS web server (192.168.12.10) are being dropped.
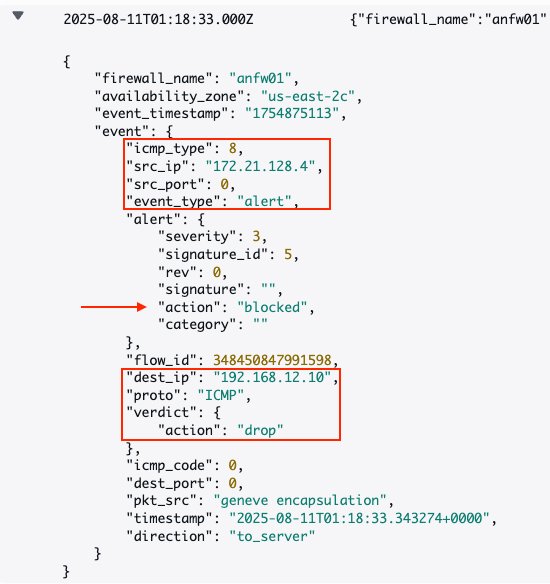
Figure 11: East-West Inspection from VPC01 to EVS
Conclusion
In this post, we demonstrated how to utilize AWS Network Firewall to secure Amazon EVS workloads and to provide centralized traffic inspection between Amazon EVS environments, Amazon VPCs, on-premises data centers, and the internet. We walked through the implementation steps for deploying the centralized inspection architecture using AWS Network Firewall and AWS Transit Gateway.
To learn more, review these resources:
- Amazon Elastic VMware Service (Amazon EVS) User Guide
- AWS Blog: Introducing Amazon Elastic VMware Service for running VMware Cloud Foundation on AWS
- AWS Blog: Deployment models for AWS Network Firewall


 Smita Singh is a Senior Solutions Architect at AWS. She focuses on defining technical strategic vision and works on architecture, design, and implementation of modern, scalable platforms for large-scale global enterprises and SaaS providers. She is a data, analytics, and generative AI enthusiast and is passionate about building innovative, highly scalable, resilient, fault-tolerant, self-healing, multi-tenant platform solutions and accelerators.
 Dipayan Sarkar is a Specialist Solutions Architect for Analytics at AWS, where he helps customers modernize their data platform using AWS analytics services. He works with customers to design and build analytics solutions, enabling businesses to make data-driven decisions.

 Saeed Barghi is a Sr. Specialist Solutions Architect at Amazon Web Services (AWS) specializing in architecting enterprise data platforms and AI solutions. Based in Melbourne, Australia, Saeed works with public sector customers in Australia and New Zealand and helps his customers build fit-for-purpose and future-proof data platforms and AI solutions.
 Miroslaw (Mick) Mioduszewski is the Director of Analytics at Revenue NSW Department of Customer service in NSW. He held multiple C-level roles in private and public companies as well as government, e.g. COO and CIO, as well as serving as company director. Mick holds computer science and business degrees, is a fellow of the Australian Institute of Company Directors and an industry fellow at the University of technology, Sydney.
 Moha Alsouli is a Public Sector Solutions Architect at Amazon Web Services (AWS) in Sydney. He is dedicated to supporting state and local government customers deliver citizen services, through solution design, reviews, optimisation, and architecture guidance. Moha is also specialising in generative artificial intelligence (AI) on AWS.


 Amit Maindola is a Senior Data Architect focused on data engineering, analytics, and AI/ML at Amazon Web Services. He helps customers in their digital transformation journey and enables them to build highly scalable, robust, and secure cloud-based analytical solutions on AWS to gain timely insights and make critical business decisions.
 Srinivas Kandi is a Senior Architect at Stifel focusing on delivering the next generation of cloud data platform on AWS. Prior to joining Stifel, Srini was a delivery specialist in cloud data analytics at AWS helping several customers in their transformational journey into AWS cloud. In his free time, Srini likes to explore cooking, travel and learn new trends and innovations in AI and cloud computing.
 Hossein Johari is a seasoned data and analytics leader with over 25 years of experience architecting enterprise-scale platforms. As Lead and Senior Architect at Stifel Financial Corp. in St. Louis, Missouri, he spearheads initiatives in Data Platforms and Strategic Solutions, driving the design and implementation of innovative frameworks that support enterprise-wide analytics, strategic decision-making, and digital transformation. Known for aligning technical vision with business objectives, he works closely with cross-functional teams to deliver scalable, forward-looking solutions that advance organizational agility and performance.
 Ahmad Rawashdeh is a Senior Architect at Stifel Financial. He supports Stifel and its clients in designing, implementing, and building scalable and reliable data architectures on Amazon Web Services (AWS), with a strong focus on data lake strategies, database services, and efficient data ingestion and transformation pipelines.
 Lei Meng is a data architect at Stifel. His focus is working in designing and implementing scalable and secure data solutions on the AWS and helping Stifel’s cloud migration from on-premises systems.


 Pratik Patel is Sr. Technical Account Manager and streaming analytics specialist. He works with AWS customers and provides ongoing support and technical guidance to help plan and build solutions using best practices and proactively keep customers’ AWS environments operationally healthy.
 Amar is a seasoned Data Analytics specialist at AWS UK, who helps AWS customers to deliver large-scale data solutions. With deep expertise in AWS analytics and machine learning services, he enables organizations to drive data-driven transformation and innovation. He is passionate about building high-impact solutions and actively engages with the tech community to share knowledge and best practices in data analytics.
 Priyanka Chaudhary is a Senior Solutions Architect and data analytics specialist. She works with AWS customers as their trusted advisor, providing technical guidance and support in building Well-Architected, innovative industry solutions.