Tag Archives: news

Introducing enhanced custom event buses in Amazon EventBridge for enterprise-scale event-driven applications

Post Syndicated from Micah Walter original https://aws.amazon.com/blogs/aws/introducing-enhanced-custom-event-buses-in-amazon-eventbridge-for-enterprise-scale-event-driven-applications/

Organizations building event-driven applications on Amazon EventBridge typically start with a single custom event bus in one account. This works well when a single team owns the architecture. As adoption grows across the organization, though, things get complicated. AWS best practices recommend a multi-account structure, which means each team runs in its own account. To route events between them, teams create multiple event buses connected through cross-account rules or bus-to-bus configurations. This workaround reintroduces the operational complexity that serverless architectures are meant to eliminate. Platform teams lose visibility into who is subscribing to which events, cross-account and bus-to-bus routing charges compound quickly, and teams that need capabilities like event ordering are forced to build complex workarounds or adopt entirely different technologies.

Today, we are announcing an enhanced custom event bus in Amazon EventBridge, purpose-built for organizations scaling event-driven applications across teams and accounts. With the new enhanced custom event bus, you can deploy a single, centralized event bus shared across all AWS accounts in your organization, with ordering guarantees, a simplified Subscriber resource, and a new pricing model that delivers improved economics at scale and cost allocation for publishers and subscribers.

Let’s try it out

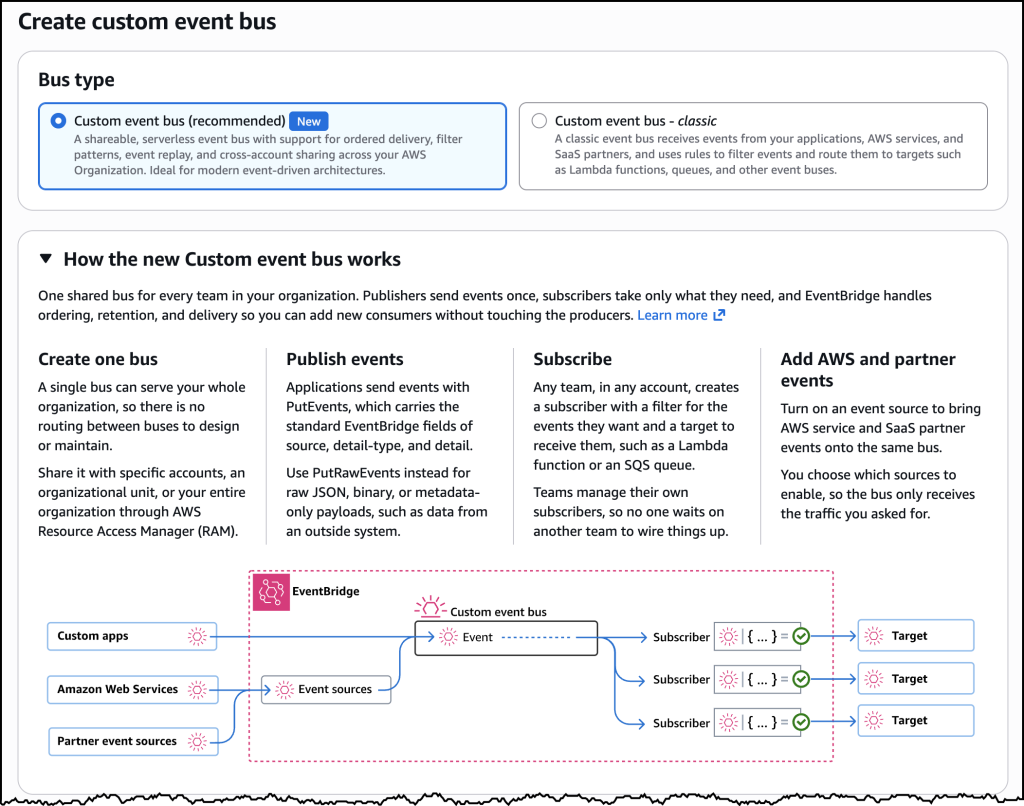
To get started with an enhanced custom event bus, I navigated to the EventBridge console in the AWS Management Console and opened the Create custom event bus page. I selected Custom event bus, the recommended option labeled New. The page also offered Custom event bus – classic, which continues to receive events and route them with rules and targets. Below the selection, EventBridge showed how the new bus works. One shared bus serves every team in the organization. Publishers send events, subscribers consume only what they need, and EventBridge handles ordering, retention, routing, and delivery.

The Create custom event bus page. Custom event bus is the recommended new option, with ordered delivery, filter patterns, event replay, and sharing across your AWS organization. Custom event bus – classic remains available for existing workloads.

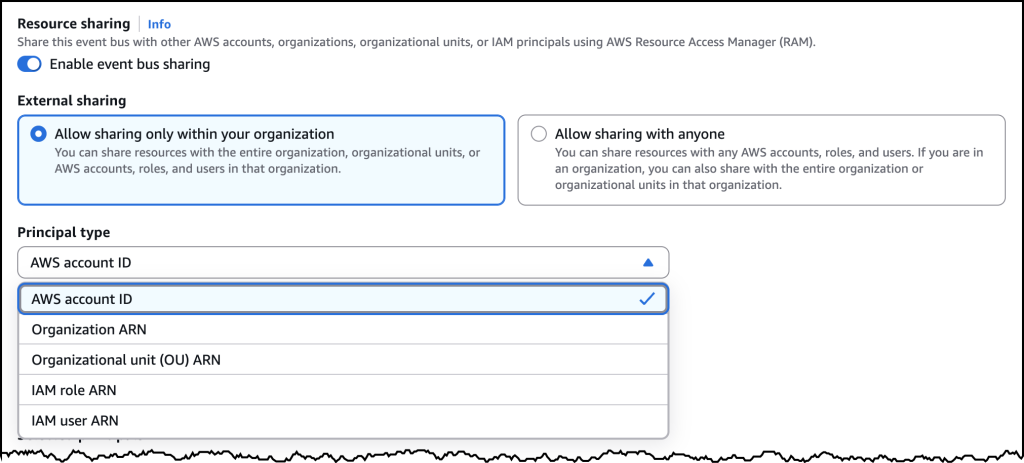
Next, I configured resource sharing. I turned on Enable event bus sharing and selected Allow sharing only within your organization. I chose AWS account ID as the principal type. I could also share with an organization, an organizational unit, or an AWS Identity and Access Management (IAM) role or user. Sharing uses AWS Resource Access Manager (AWS RAM), so I did not have to set up cross-account permissions or bus-to-bus routing myself.

Resource sharing on the new custom event bus. I enabled sharing within my organization through AWS RAM and selected an AWS account as the principal, which is how teams publish and subscribe on the same bus without extra routing.

Organization-wide sharing

With the new enhanced custom event bus, you can create a single event bus and share it across all AWS accounts in your organization. Platform teams deploy one bus and establish it as the central event backbone, eliminating the need to configure cross-account permissions or bus-to-bus routing. Application teams across your organization can publish and subscribe to events on the same bus without waiting for infrastructure provisioning.

Publishers send events without needing to know which teams consume them, and subscribers create their own Subscriptions independently. Platform teams maintain visibility into all event flows and fine-grained control over who can publish and consume events. The new enhanced custom event bus has a default quota of 10,000 Subscribers per bus, and you can request a higher quota. That reduces the fragmentation that occurs when subscriber limits force you to split across multiple buses.

Event ordering

Event-driven architectures work best when consumers are designed around asynchronous patterns, where the order of events does not matter. There are a few cases where order does matter. In a logistics application, driver location updates must arrive in sequence. Out-of-sequence events cause routing algorithms to make decisions based on stale data.

The enhanced custom event bus supports both patterns on the same bus. Publishers can include an EventGroupId when sending events. EventBridge delivers events that share the same EventGroupId in sequence to Subscribers that chose ordered delivery. Other subscribers on that bus can receive the same events without ordering. You can keep events for each driver in the correct order without building complex workarounds, while the rest of your consumers stay fully asynchronous.

To support ordered processing, the enhanced custom event bus includes synchronous invocation for targets like AWS Lambda. Synchronous mode confirms successful processing before acknowledging the event, eliminating the common pattern of placing Amazon Simple Queue Service (Amazon SQS) between an event bus and Lambda to ensure reliability.

Subscriptions

The enhanced custom event bus introduces the Subscriber resource, which combines event filtering, target configuration, retry policies, and dead-letter destinations into a single, manageable unit. Today, achieving the same outcome with EventBridge requires configuring separate rules, targets, and retry settings across multiple resources. Subscribers simplify this by giving each consumer one resource that defines what events they want, where to deliver them, and how to handle failures.

Subscribers also include variable start time options, making it easier for teams to onboard new consumers or replay events to recover from application errors or hydrate new applications.

Event evaluation

Publishers can turn on content-based deduplication so EventBridge detects and drops retries of the same event from the payload itself. You do not have to generate and track a deduplication ID when a timeout or a partial failure sends the same event twice. EventBridge hashes the meaningful parts of the event and collapses matches that arrive within five minutes, which gives those retries exactly-once delivery semantics instead of EventBridge’s usual at-least-once model. If you already stamp your own idempotency token, keep using it. Content-based deduplication is for sources that cannot reliably identify the same event on a retry.

Subscribers can use JSONata expressions to reshape an event before it reaches a target, extracting fields, renaming them, or computing new values when a downstream API expects a different shape. If you already produce Apache Avro or Protocol Buffers events, EventBridge can deserialize those payloads to JSON, allowing subscribers fine grained filtering and routing on the full event payload without having to consume, deserialize, and match or discard on their own.

New pricing model

The enhanced custom event bus uses a new ingress and egress throughput pricing model. Publishers pay for events ingested, and subscribers pay for events delivered. This replaces the per-event model where cross-account and bus-to-bus routing charges compound in multi-bus architectures. For pricing details, visit the EventBridge pricing page.

Existing EventBridge custom event buses continue to work as they do today with no changes required. They now appear as Custom event bus – classic. The enhanced custom event bus is a new resource that you adopt at your own pace. In the console, it appears as Custom event bus.

Now available

The enhanced custom event bus is available today in the US East (N. Virginia, Ohio), US West (Oregon), Europe (Ireland, Frankfurt, Stockholm, Spain), and Asia Pacific (Hong Kong, Malaysia, Mumbai, Singapore, Sydney, Thailand, Tokyo) Regions. You can create your first enhanced custom event bus through the AWS Management Console, AWS Command Line Interface (AWS CLI), or EventBridge APIs. To get started, visit the EventBridge documentation or try it out directly in the EventBridge console.

Introducing Amazon CloudWatch Omni: collaborative AI-powered observability for your applications

Post Syndicated from Daniel Abib original https://aws.amazon.com/blogs/aws/introducing-amazon-cloudwatch-omni-collaborative-ai-powered-observability-for-your-applications/

Amazon CloudWatch now offers CloudWatch Omni, an AI-powered observability experience for the applications and AI agents you run together. You reach Omni through a dedicated URL for your organization and sign in with the identities you already manage, so working in Omni does not require access to the AWS Management Console. Omni is built on OpenTelemetry: the telemetry you already send to CloudWatch appears in Omni with nothing to reconfigure, and any other workload you instrument with OpenTelemetry sends its telemetry to an OpenTelemetry Protocol (OTLP) endpoint.

CloudWatch Omni offers both agent observability and application observability in a single experience. In our companion post, we introduced the agent observability capabilities of Omni for generative AI and agentic workloads. In this post, we present the application observability experience.

Engineering teams spend a significant portion of their observability time maintaining dashboards, tuning thresholds, and switching between tools to piece together what happened during an incident. When an issue crosses team boundaries, context gets lost in Slack threads and screenshots rather than flowing naturally to the next engineer. CloudWatch Omni changes this by organizing observability around your applications rather than individual signals, and bringing your whole team into the same workspace.

What CloudWatch Omni brings

CloudWatch Omni addresses three problems that engineering teams told us they face today.

One collaborative experience for your whole team. Every engineer accesses CloudWatch Omni through a single URL with enterprise SSO (via IAM Identity Center, supporting Okta, Azure AD, and other providers). No AWS Console access is required. SREs, developers, database engineers, and managers share the same data and investigation context. When an investigation escalates, the next person joins the same session with full context already in front of them.

The system adapts as your applications evolve. CloudWatch Omni discovers your services, maps dependencies, and adjusts alarms automatically. Instead of manually curating dashboards and tuning thresholds, you declare what matters (availability targets, latency budgets, error rate thresholds) and Omni adapts as your system changes. When you deploy new services, Omni updates the application topology automatically.

AI-powered investigation with Amazon DevOps Agent. Amazon DevOps Agent participates alongside your team in investigation sessions, correlating signals and suggesting next steps. The agent works from the same telemetry your engineers see, so its suggestions are grounded in the actual state of your application. It identifies correlated events across services, traces root cause paths through your dependency graph, and maintains investigation history for post-incident review.

How an investigation works

When something breaks, CloudWatch Omni opens an investigation session pre-loaded with context. Here is a typical incident workflow:

An alarm fires on elevated error rates in your checkout service. Omni opens a session showing the service topology, correlated signals (a deployment 10 minutes earlier, increased latency from a downstream payment API), and DevOps Agent’s initial analysis.

Your on-call SRE confirms the deployment correlation, pulls in the trace view to identify failing endpoints, and checks if the payment API latency correlates with a capacity limit.

The SRE escalates to the payments team. The payments engineer joins the same session and sees everything found so far, plus DevOps Agent’s correlation with a configuration change in the payment provider’s API gateway. They identify the root cause and roll back.

The entire investigation history is captured automatically. No separate incident report needed.

Walkthrough: setting up your first Space

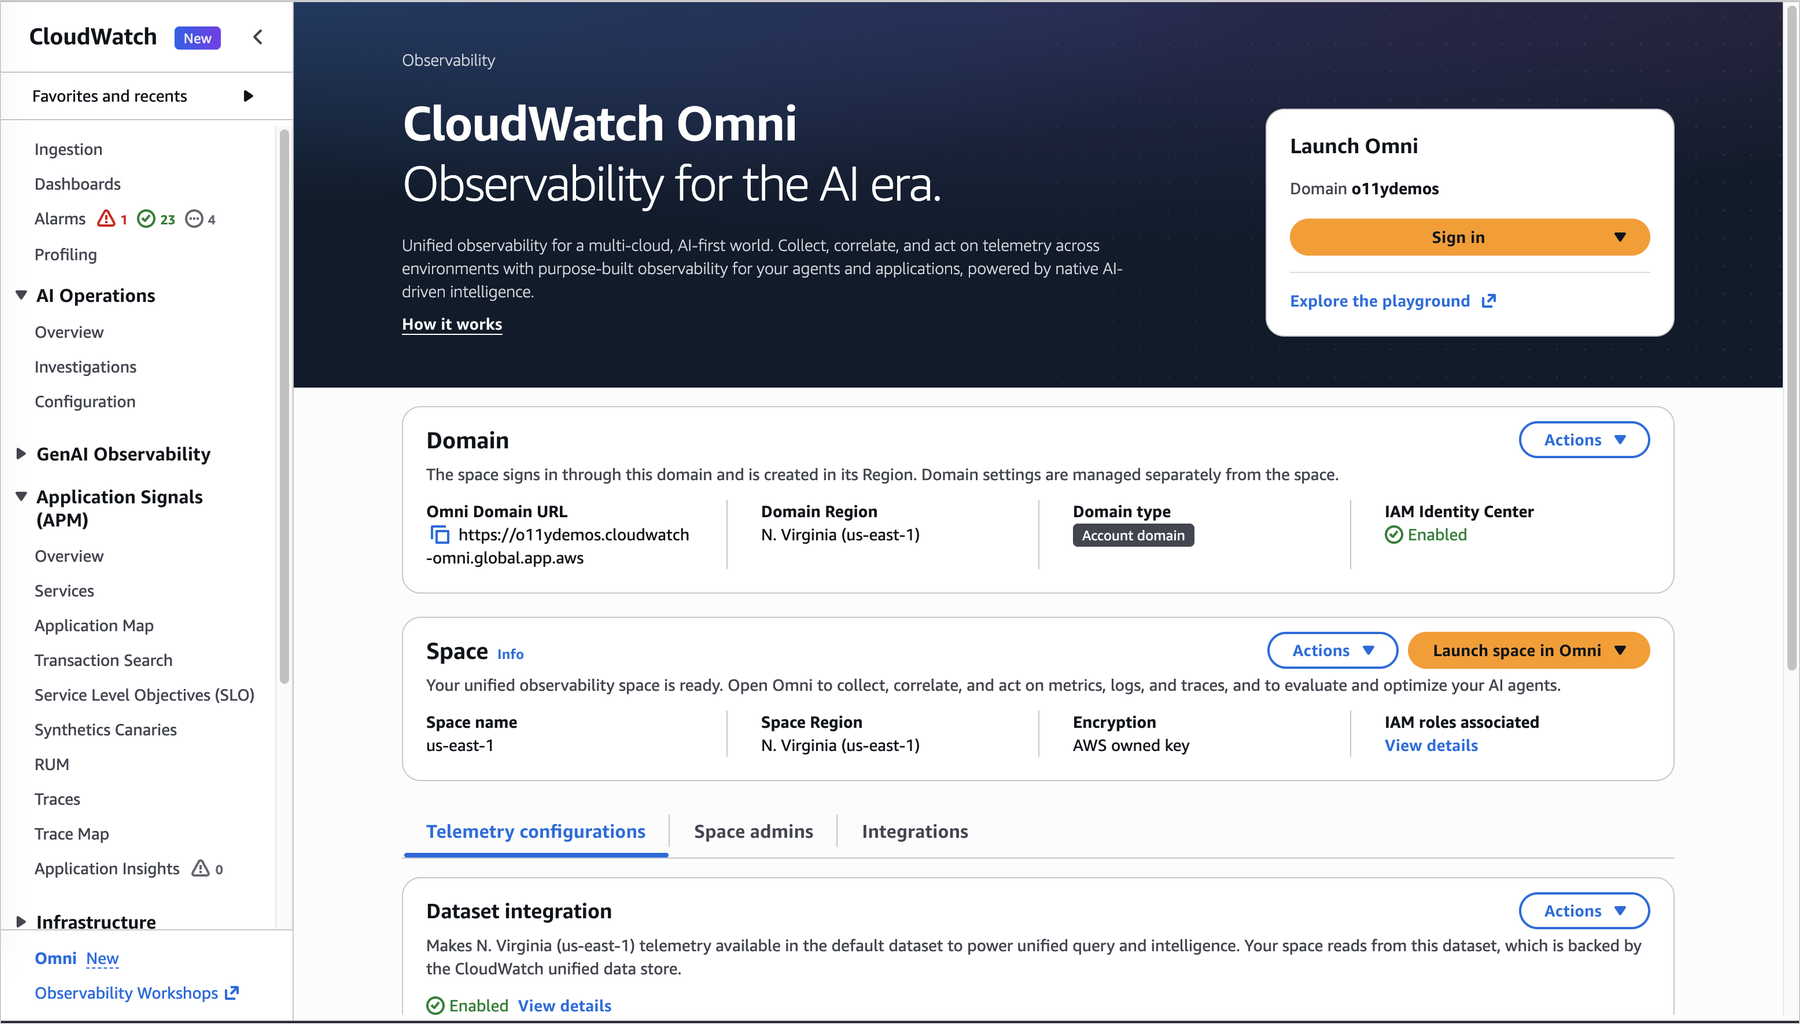
To set up CloudWatch Omni for your team, open the CloudWatch console and click “Try CloudWatch Omni.”


Figure 1. CloudWatch console — Omni setup page

Next, connect your identity provider through IAM Identity Center (supporting Okta, Azure AD, and other SAML 2.0 providers). Once connected, your team members access Omni directly at your dedicated URL without needing AWS Console credentials.

Create a Space for your team. A Space groups the applications your team owns and the telemetry associated with them.


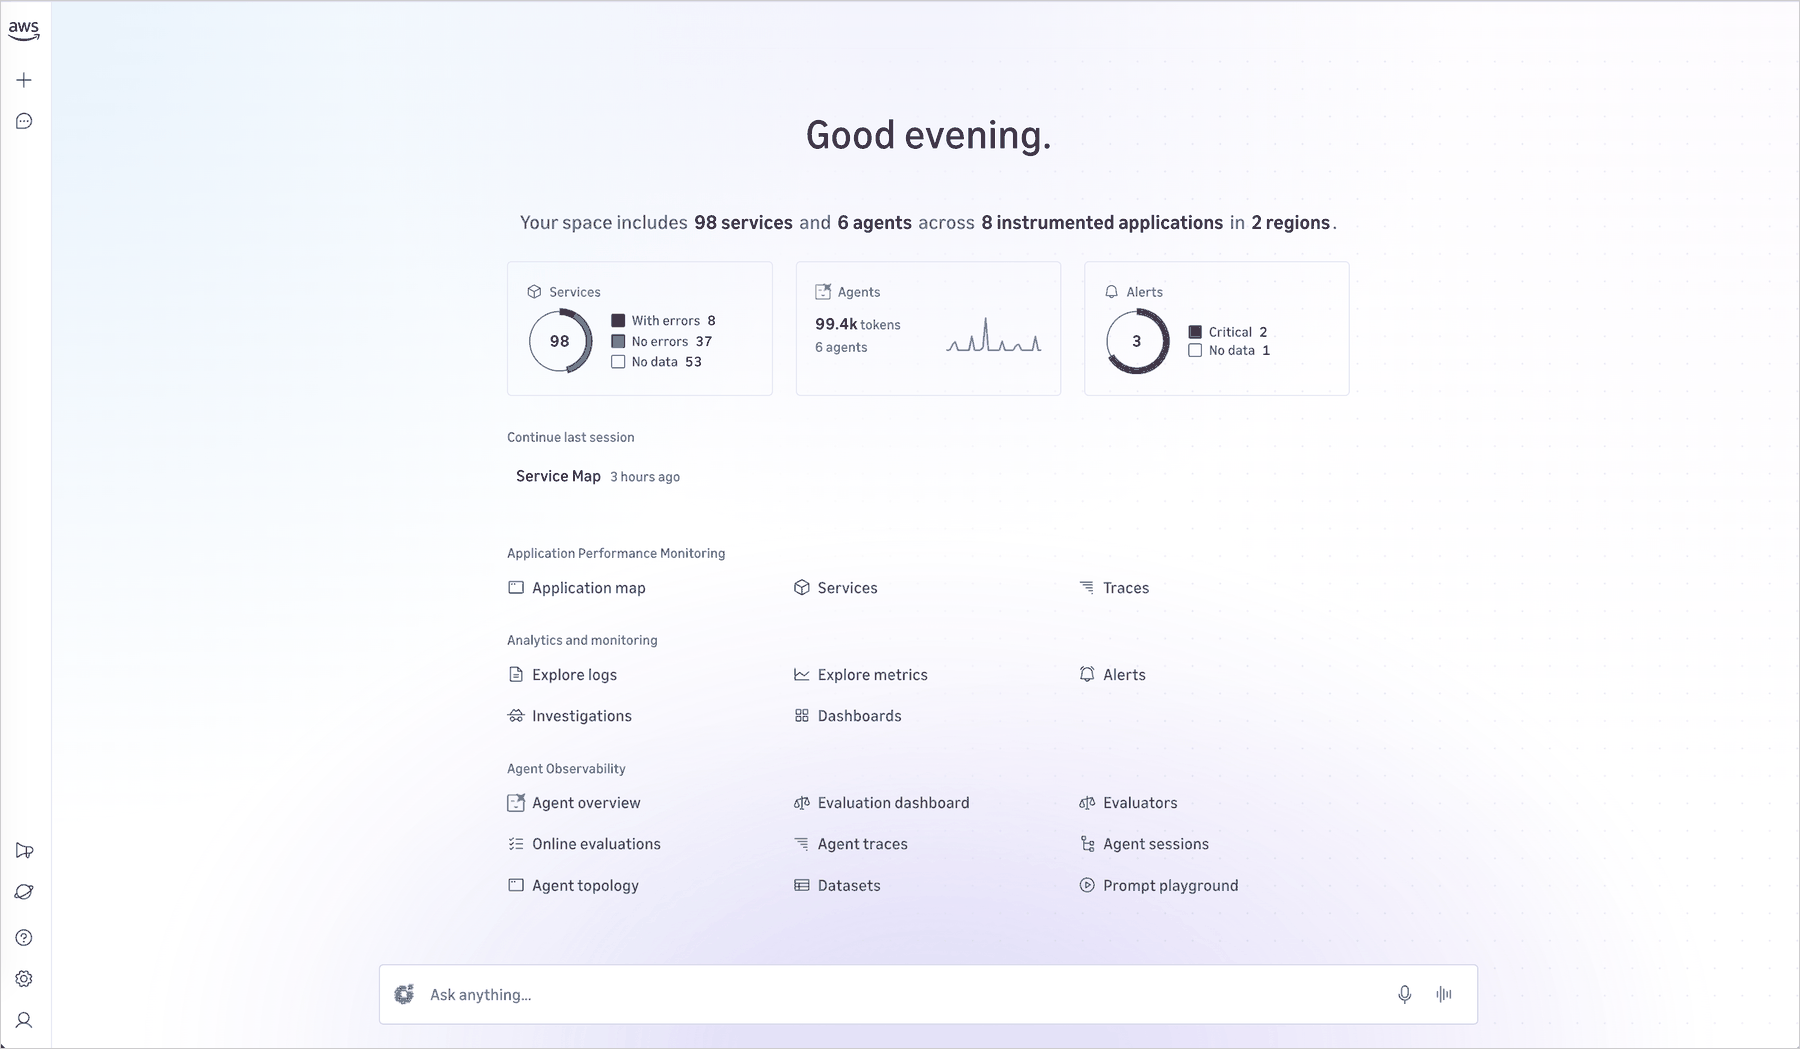
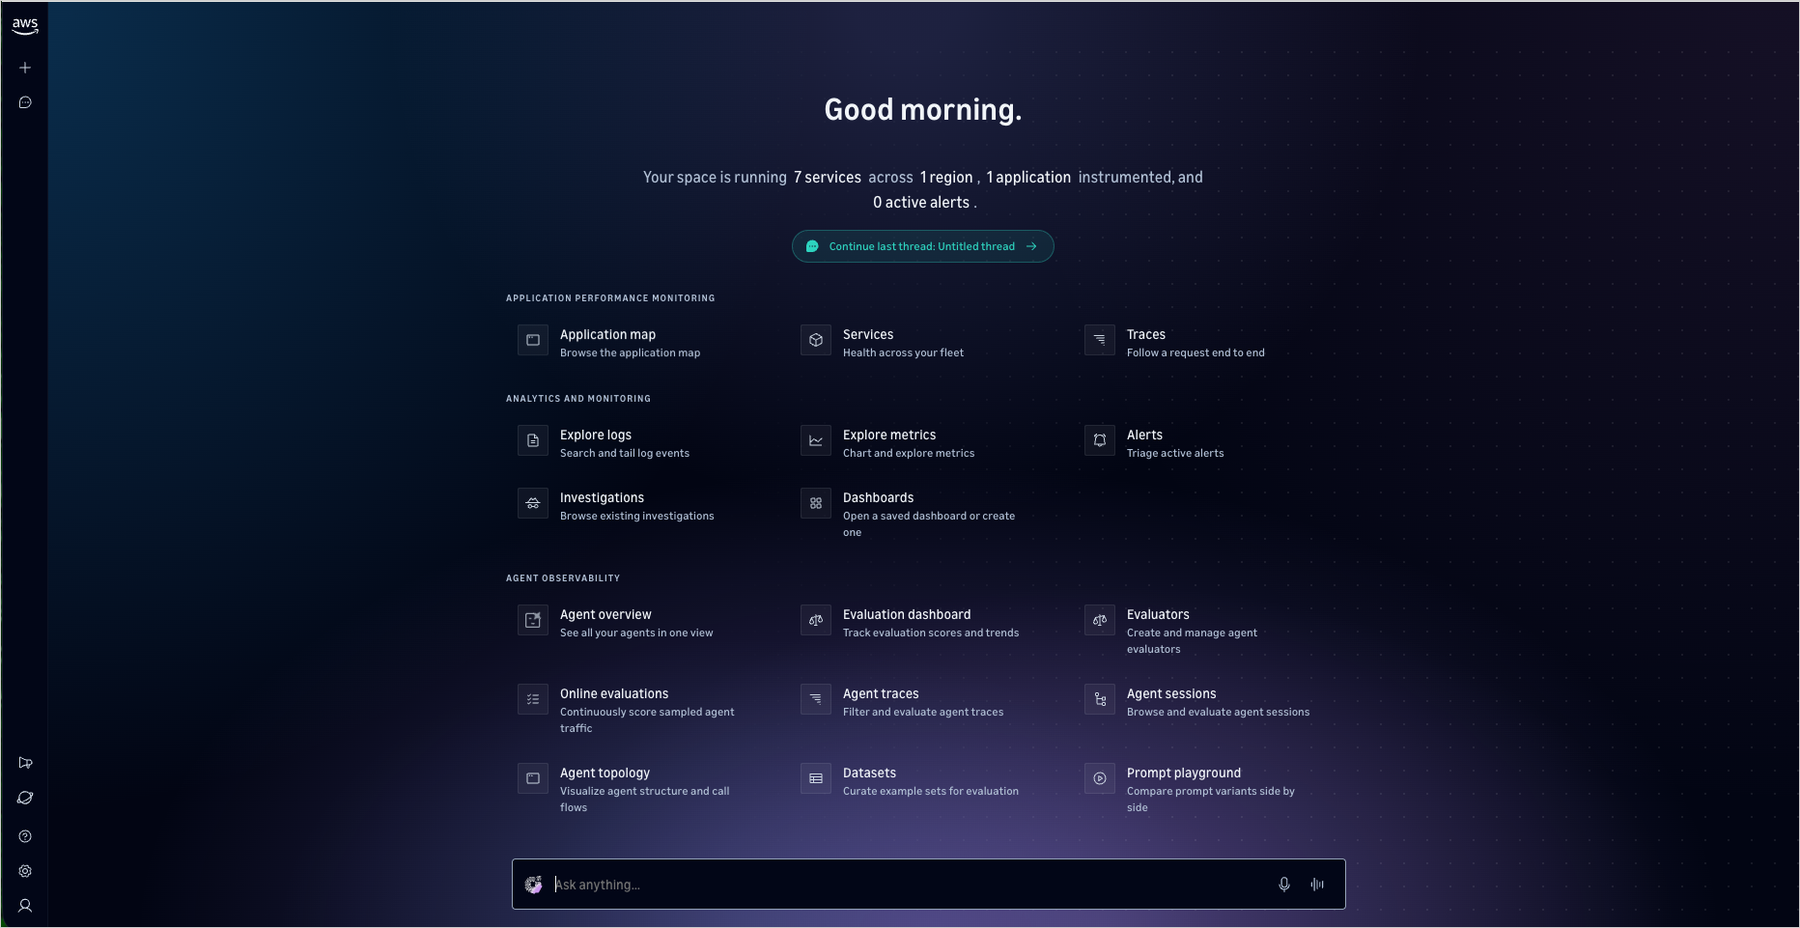
Figure 2. CloudWatch Omni Home — your team’s workspace with application monitoring, analytics, and agent observability

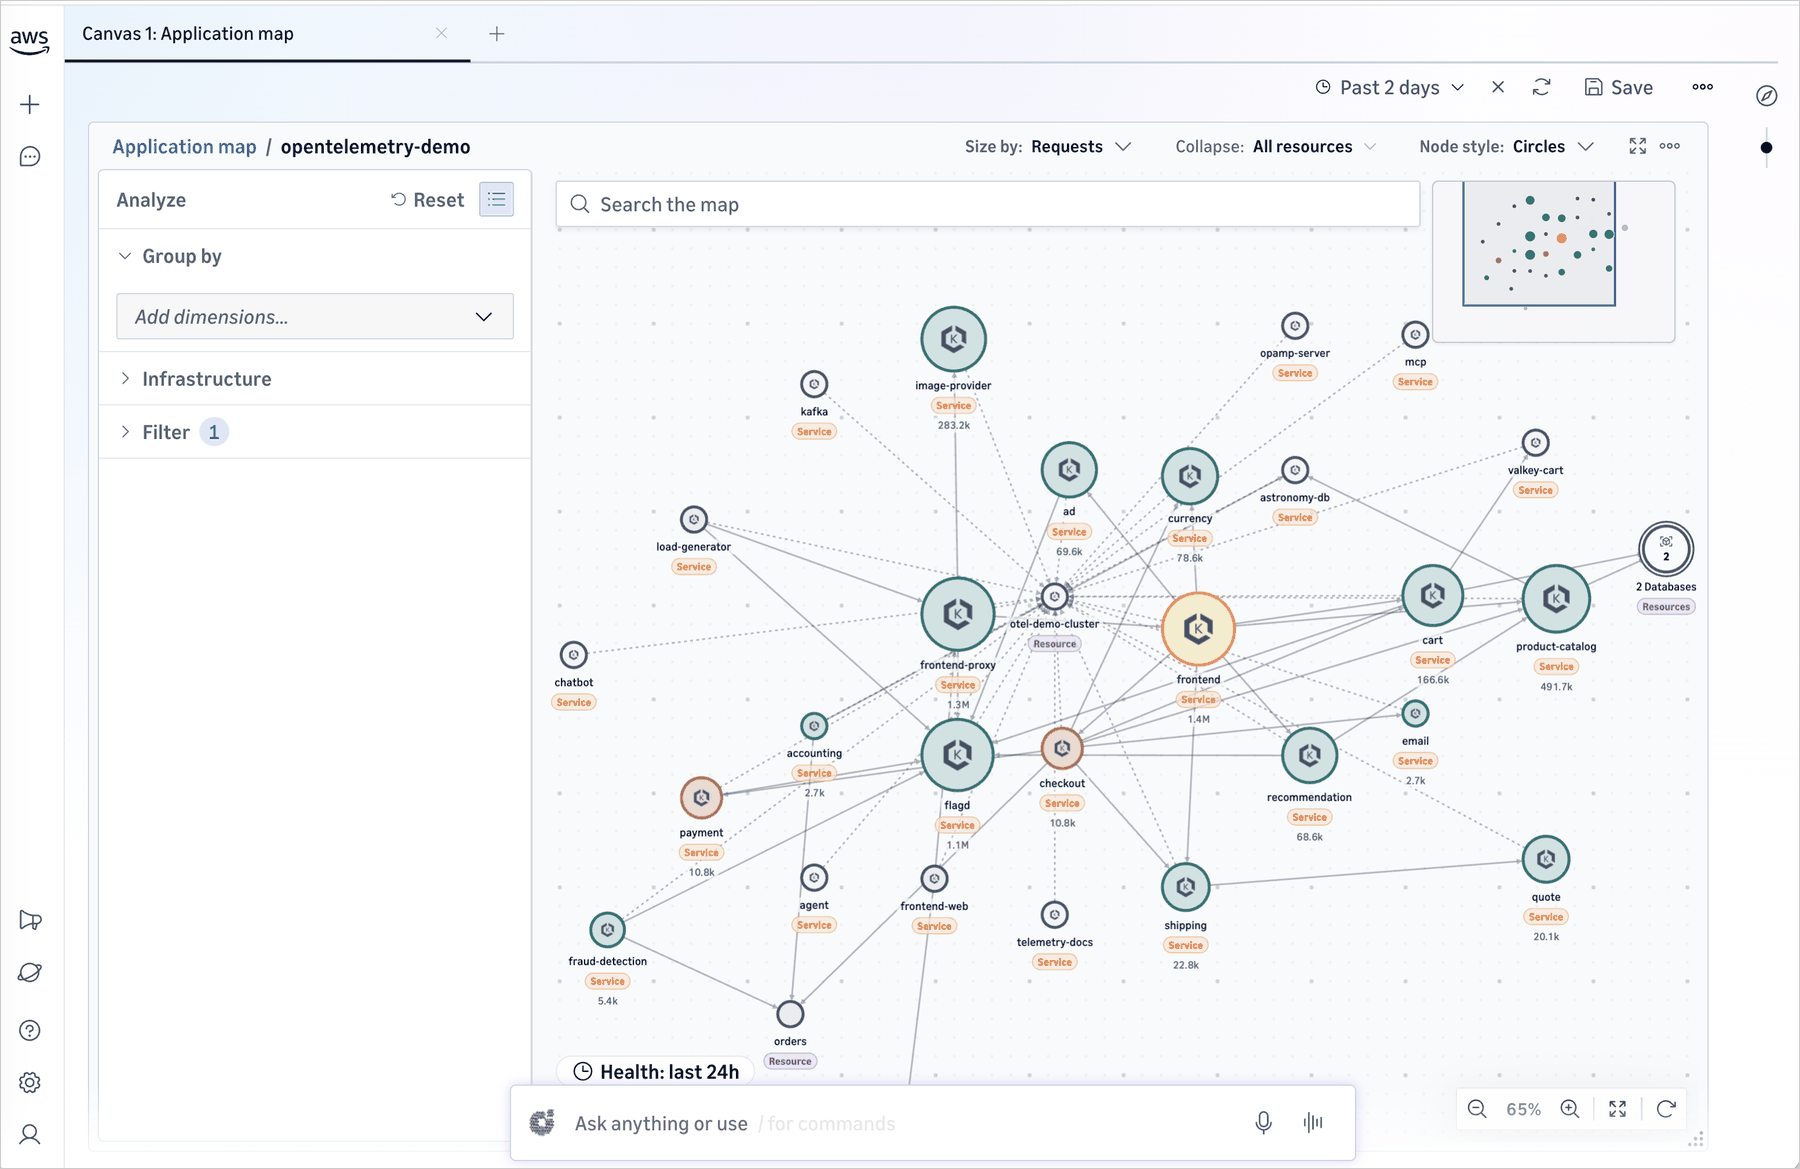
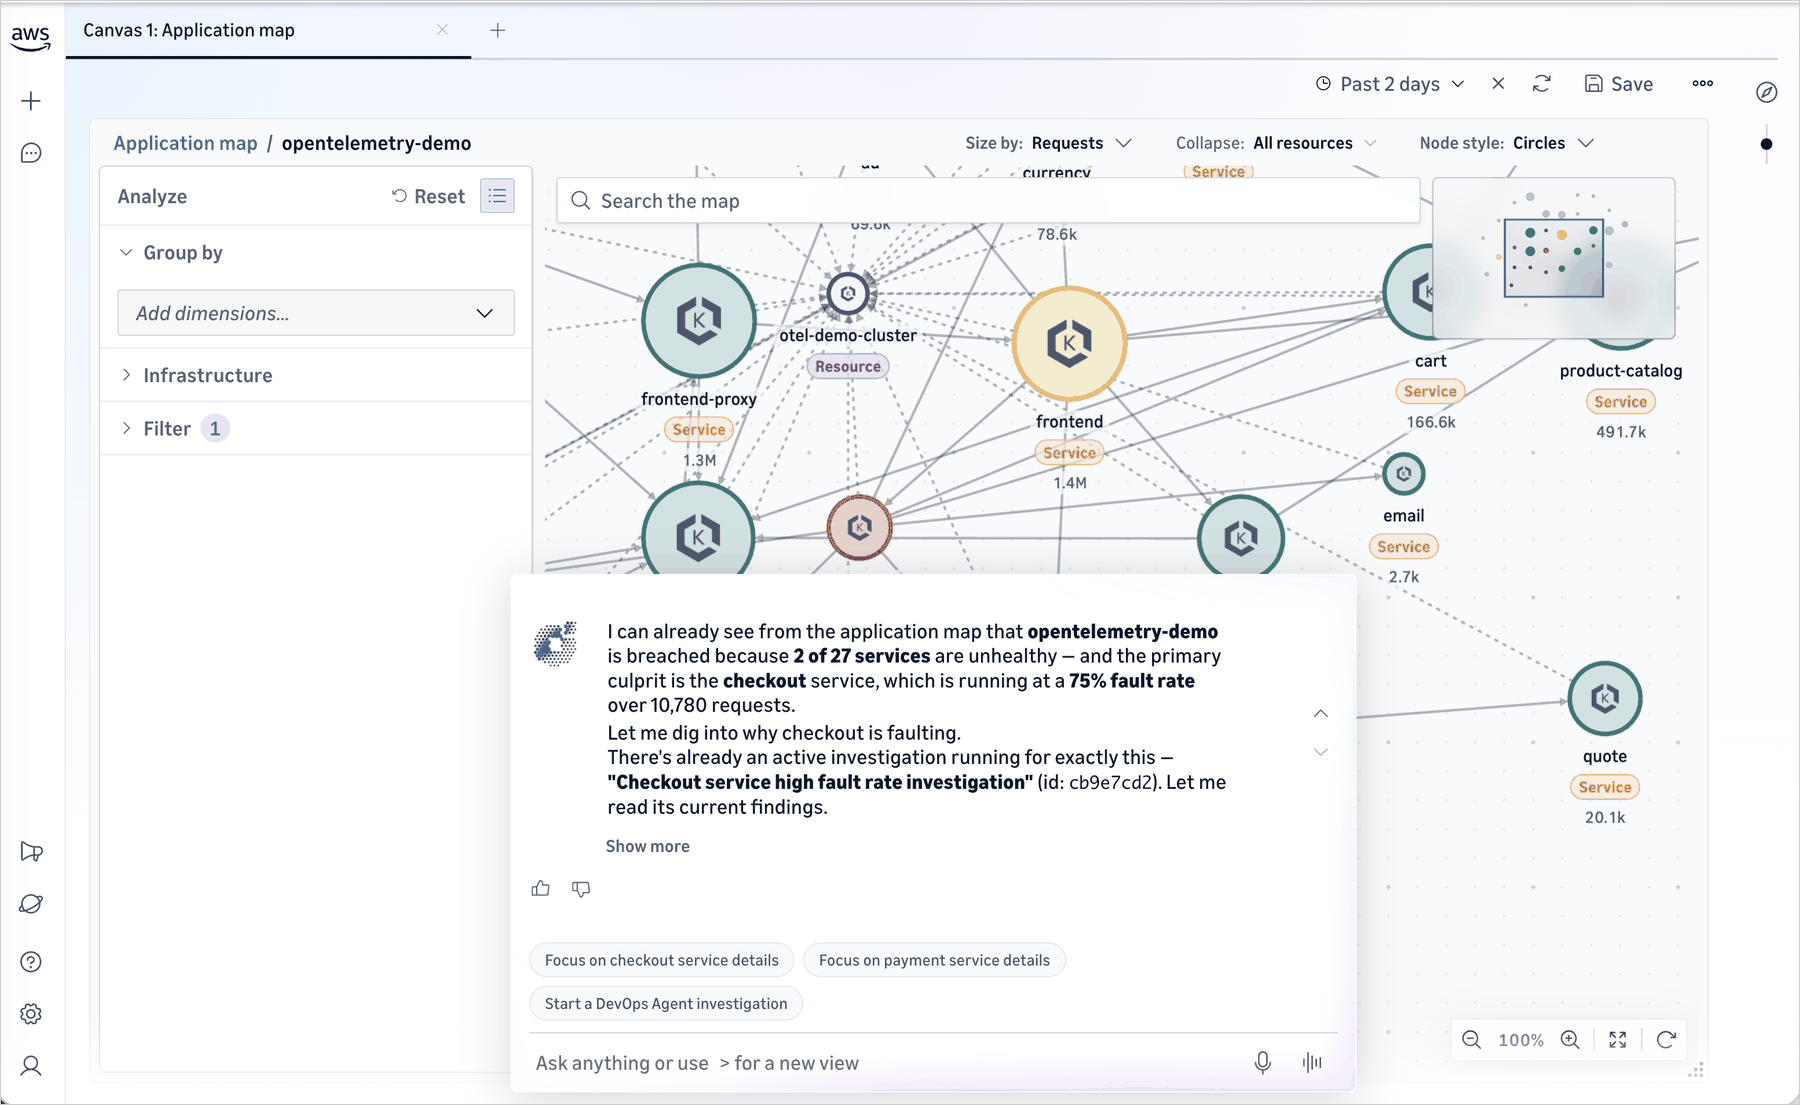
Once created, Omni discovers your services automatically and maps the dependencies between them. You see your application topology immediately.


Figure 3. Application topology — services and dependencies mapped automatically

You can ask CloudWatch Omni any question about your applications in plain English, and Omni will analyze your telemetry data and surface insights.

Figure 4. Interact with your telemetry in natural language

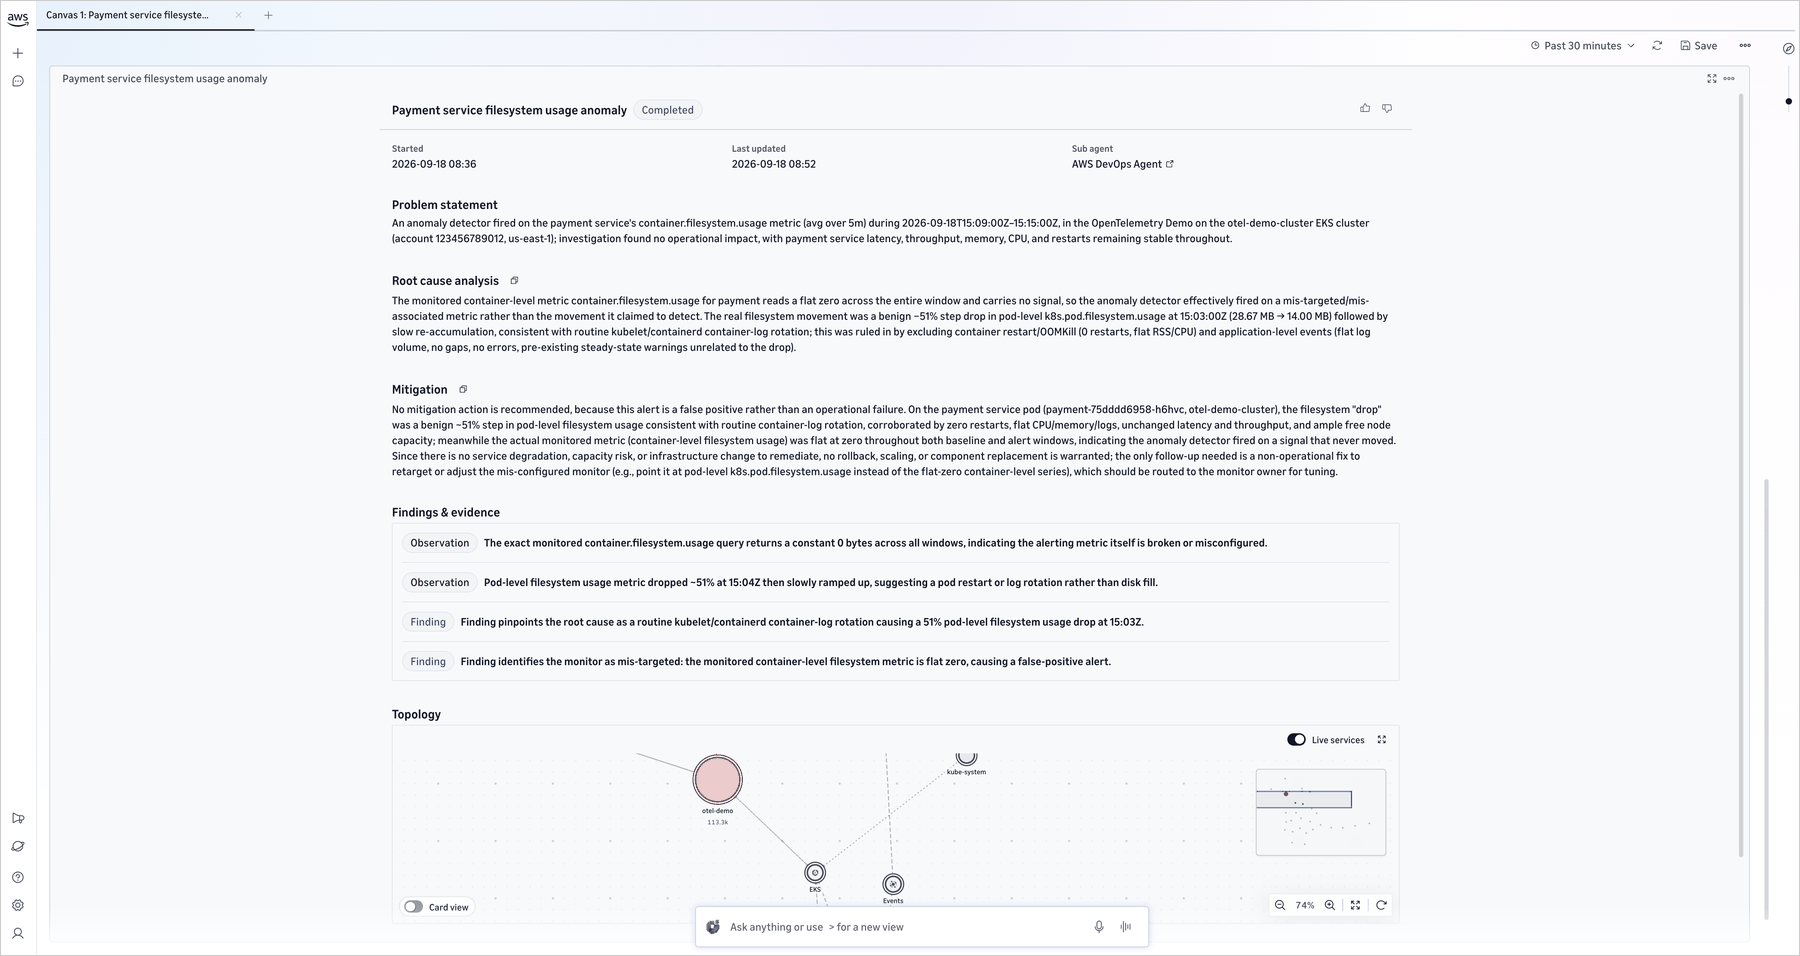
You can also set up service health alerts, configure what matters to your team, and trigger an AWS DevOps agent investigation to identify the root cause and develop a mitigation plan.


Figure 5. Investigation session — DevOps Agent identifies root causes and suggests next steps

Application-centric organization

CloudWatch Omni organizes telemetry by application rather than by infrastructure component. The system automatically discovers services from the telemetry data and AWS Config resource discovery, maps dependencies, and lets you see your application as a connected system rather than a collection of isolated resources.

Each team gets a Space that contains the applications they own. A Space points at existing CloudWatch data (logs, metrics, traces, and alarms) with no additional data movement required. Dynamic views replace the maintenance burden of static dashboards, providing ongoing visibility into SLOs and application health.

Getting started

Getting started takes minutes and doesn’t require reconfiguration of your existing CloudWatch setup.

If you’re an existing CloudWatch customer: Click “Try CloudWatch Omni” in the CloudWatch console. All your existing telemetry (logs, metrics, traces, and alarms) is immediately available. Workloads are discovered automatically, and you can start an investigation or browse your application topology right away.

For organization-wide deployment: An administrator configures a domain, connects your identity provider via IAM Identity Center, defines Spaces for teams and environments, and invites users. Each Space points at existing CloudWatch data with no additional data movement required.

For applications in other environments: CloudWatch Omni provides connectors that make it easy to bring in telemetry from additional environments. All ingested telemetry appears alongside your AWS data in the same Spaces and investigation sessions.

For generative AI and agentic workloads: The same CloudWatch Omni experience delivers purpose-built observability for AI agents, including trace exploration, evaluation frameworks, and real-time monitoring. In our companion post, we introduced the agent observability capabilities of Omni; for that walkthrough, see Introducing Amazon CloudWatch Omni: AI-powered observability for generative AI and agentic workloads.

Things to know

  • CloudWatch Omni extends CloudWatch. Existing alarms, dashboards, APIs, and console workflows continue unchanged.
  • Access is through a dedicated web application with enterprise SSO. Engineers don’t need AWS Console access to use it.
  • Once you setup, DevOps Agent is enabled by default in every Omni investigation session.

Pricing and availability

Amazon CloudWatch Omni is now available. Existing CloudWatch customers can try it directly from the CloudWatch console. For pricing details, visit the Amazon CloudWatch pricing page.

To get started, visit Amazon CloudWatch Omni or click “Try CloudWatch Omni” in the Amazon CloudWatch console.

If you want to call APIs, search documentation, find regional availability, and check troubleshooting about this feature, try using the AWS MCP Server and plugins with your preferred AI tool. Share your feedback on AWS re:Post or reach out through your usual AWS Support contacts.

— Daniel Abib
Introducing Amazon CloudWatch Omni: AI-powered observability for generative AI and agentic workloads

Post Syndicated from Daniel Abib original https://aws.amazon.com/blogs/aws/introducing-amazon-cloudwatch-omni-ai-powered-observability-for-generative-ai-and-agentic-workloads/

Today, Amazon CloudWatch introduces CloudWatch Omni, a unified observability experience for application and AI workloads that is app-centric, AI-powered, built on open standards, and delivered off-console. CloudWatch Omni is a purpose-built observability, evaluation, and experimentation solution for AI agents. It helps teams design, evaluate, and operate AI agents across any model provider, framework, or runtime, with an eval-driven workflow, support for the tools you already use, and observability delivered where you work: directly in your IDE and through a standalone web experience, separate from the AWS Management Console.

Organizations deploying agentic AI systems face observability challenges that traditional monitoring can’t address. Agent behavior is non-deterministic: a prompt change can degrade response quality even when standard metrics show no errors. Teams spend hours manually reviewing logs across multiple systems, unable to pinpoint what changed or why. Existing tools force teams to choose between siloed generative AI monitoring or fragmented solutions requiring constant context-switching between their coding environment and browser-based dashboards.

CloudWatch Omni captures every trace and includes built-in evaluators for correctness, coherence, retrieval quality, and tool selection, among others. You can compare prompt versions side by side in the playground, build test datasets from production traffic, run experiments across different configurations, and detect regressions automatically.

Two surfaces for development and operations

CloudWatch Omni delivers observability through two complementary surfaces. Developers get a native extension inside VS Code and Kiro (the currently supported IDEs), where traces appear as you run your agent with a playground and evaluators a click away. Operators get a standalone web experience, separate from the AWS Management Console to monitor the fleet, accessible through SSO with no AWS console needed. Both share the same data: the trace a developer debugs is the trace an operator investigates.

The Cloud Login feature connects your local IDE environment to your AWS account, enabling you to send telemetry data to Amazon CloudWatch for persistent storage, share traces with your team, and access production dashboards. This connection is optional. You can use CloudWatch Omni entirely locally during development, then connect to the cloud when you are ready to monitor agents in production.

Getting started

CloudWatch Omni offers two ways to get started: through the IDE extension (for VS Code and Kiro) or directly through the cloud experience, where you can start sending telemetry data to CloudWatch without installing any IDE extension. In this walkthrough, I install the extension, create an agent, run it, and explore the traces and evaluation tools from my IDE.

After installing the CloudWatch Omni extension from the VS Code Marketplace, the CloudWatch Omni icon appears in the Activity Bar. From the welcome screen, I selected Get started with Sample Project to load a pre-configured agent with sample trace data or use shortcut to Command Palette using Command + Shift + P (on macOS) or Ctrl + Shift + P (on Windows/Linux) and select Omni: Create a new Project

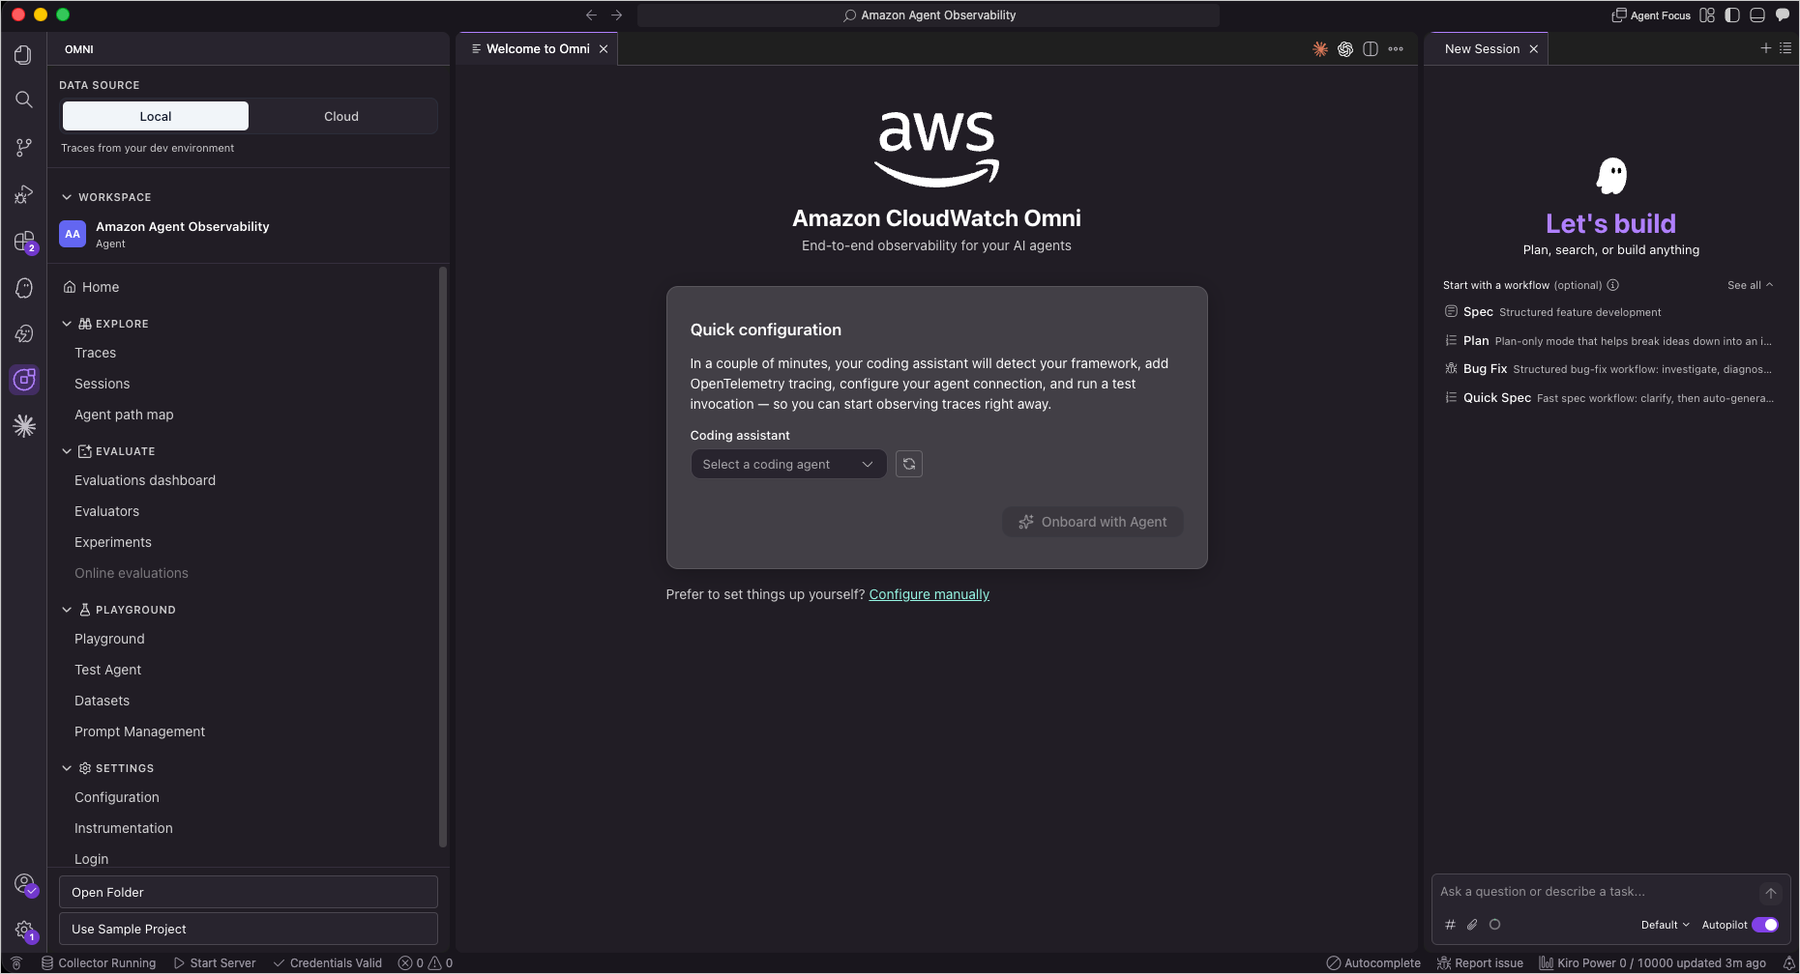
CloudWatch Omni welcome screen and create new project in VS Code

Figure 1. CloudWatch Omni welcome screen & create new project in VS Code

The sample project comes with an agent implementation and example datasets. Part of the getting-started experience is adding OpenTelemetry instrumentation, and CloudWatch Omni guides you through each step. You can also create a new agent from scratch. CloudWatch Omni walks you through the process using an interactive chat where you define the agent’s purpose, select a model provider, and configure tools. All data is stored locally by default. You can optionally connect to AWS to send data to Amazon CloudWatch.

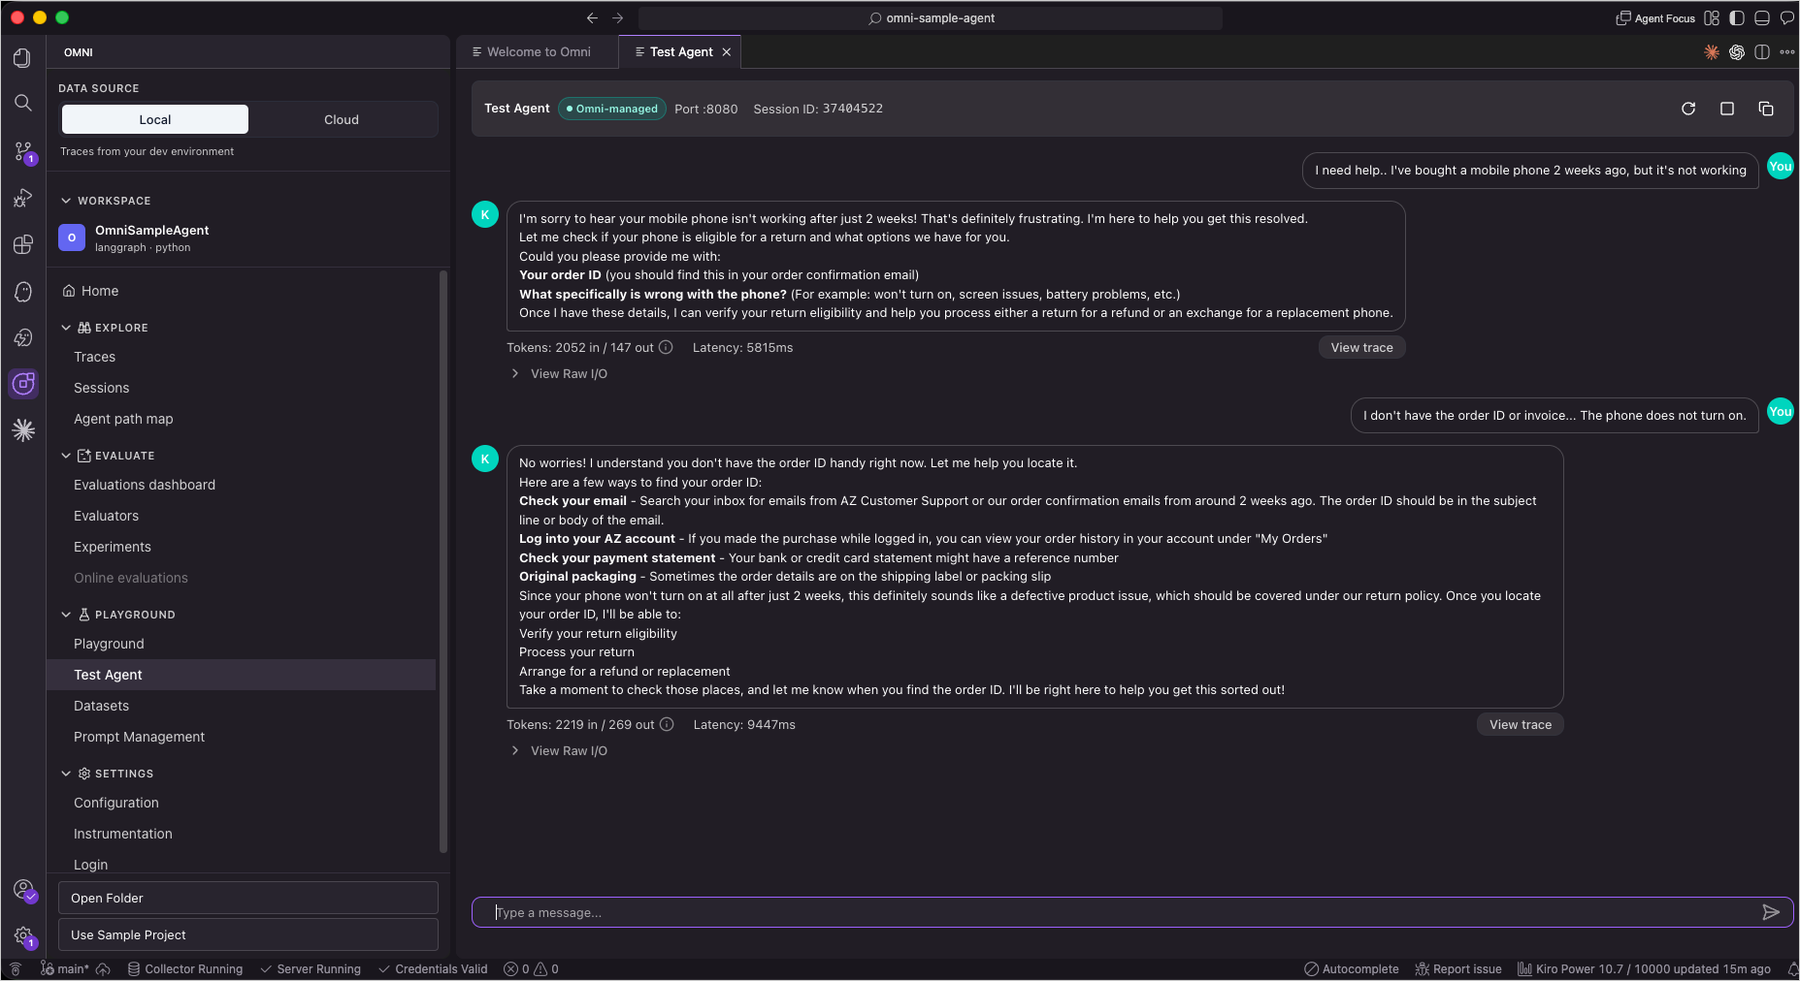
After verifying the configuration, I started the local dev server and sent a question to the agent. What makes this different from a typical chatbot interface is what happens next: selecting View Trace shows exactly how the agent processed the request.

CloudWatch Omni guides your AI code assistant to configure the development environment

Figure 2. CloudWatch Omni guides your AI code assistant to configure the local development environment for testing

CloudWatch Omni integrates with AI code assistants such as Kiro, Claude Code, and Codex to streamline the setup process. These assistants can configure the Dev Server, install dependencies, and set up instrumentation on your behalf, so you can go from installation to running your first traced agent session in minutes without manual configuration.

Interacting with the agent and viewing traces

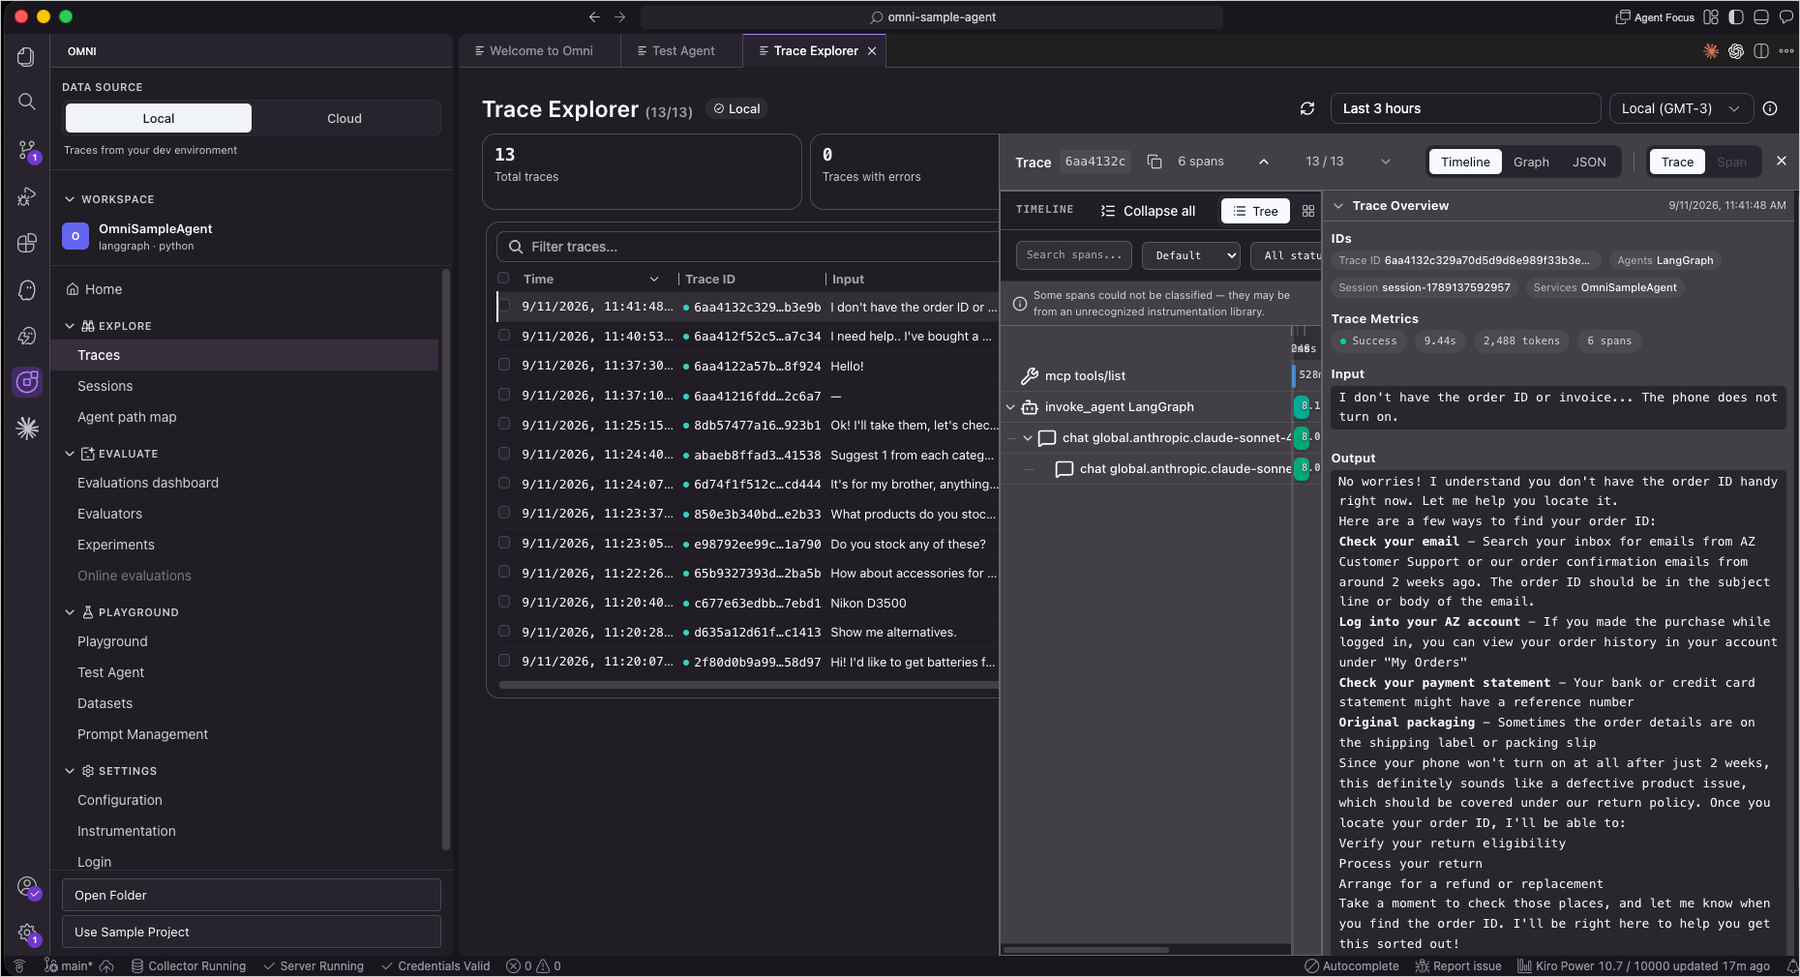
Figure 3. Interacting with the agent and viewing traces

Traces are essential for understanding AI agent behavior. Unlike traditional request-response systems, agents make multiple decisions per invocation: choosing tools, composing prompts, and chaining sub-calls. Without full trace visibility, diagnosing why an agent produced an incorrect answer or took an unexpected path becomes guesswork. CloudWatch Omni records every step in a structured timeline so you can pinpoint exactly where behavior diverged.

The Trace Explorer shows a detailed breakdown of every step the agent took (LLM calls, tool invocations, and reasoning steps) in a structured, hierarchical timeline. I could drill into any span to inspect inputs, outputs, token usage, and latency.

Trace Explorer showing the agent execution timeline

Figure 4. Trace Explorer showing the agent’s execution timeline

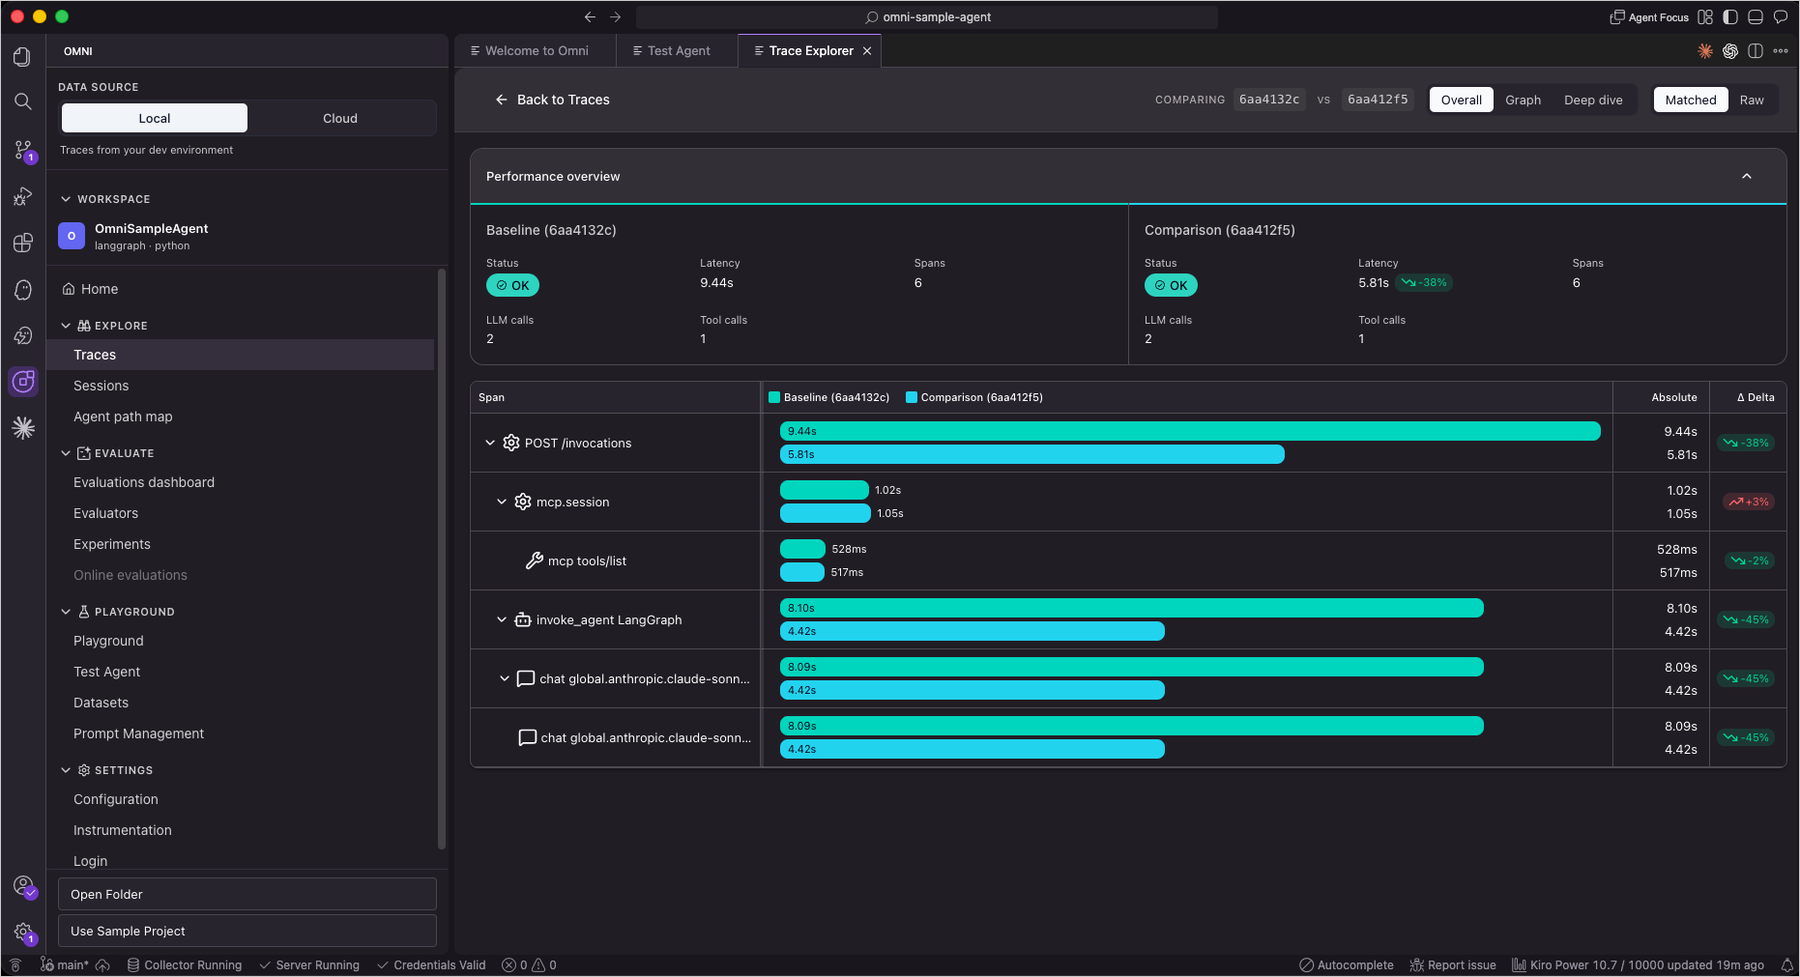
The Trace Explorer also supports Compare mode, which places two traces side by side to see how different prompts or configurations affect behavior. Compare mode is especially helpful when debugging regressions. And with Ask Assistant, an AI agent analyzes your traces to surface patterns and anomalies, answering questions like “Why did the agent call this tool twice?”

Comparing two traces side by side

Figure 5. Comparing two traces side by side

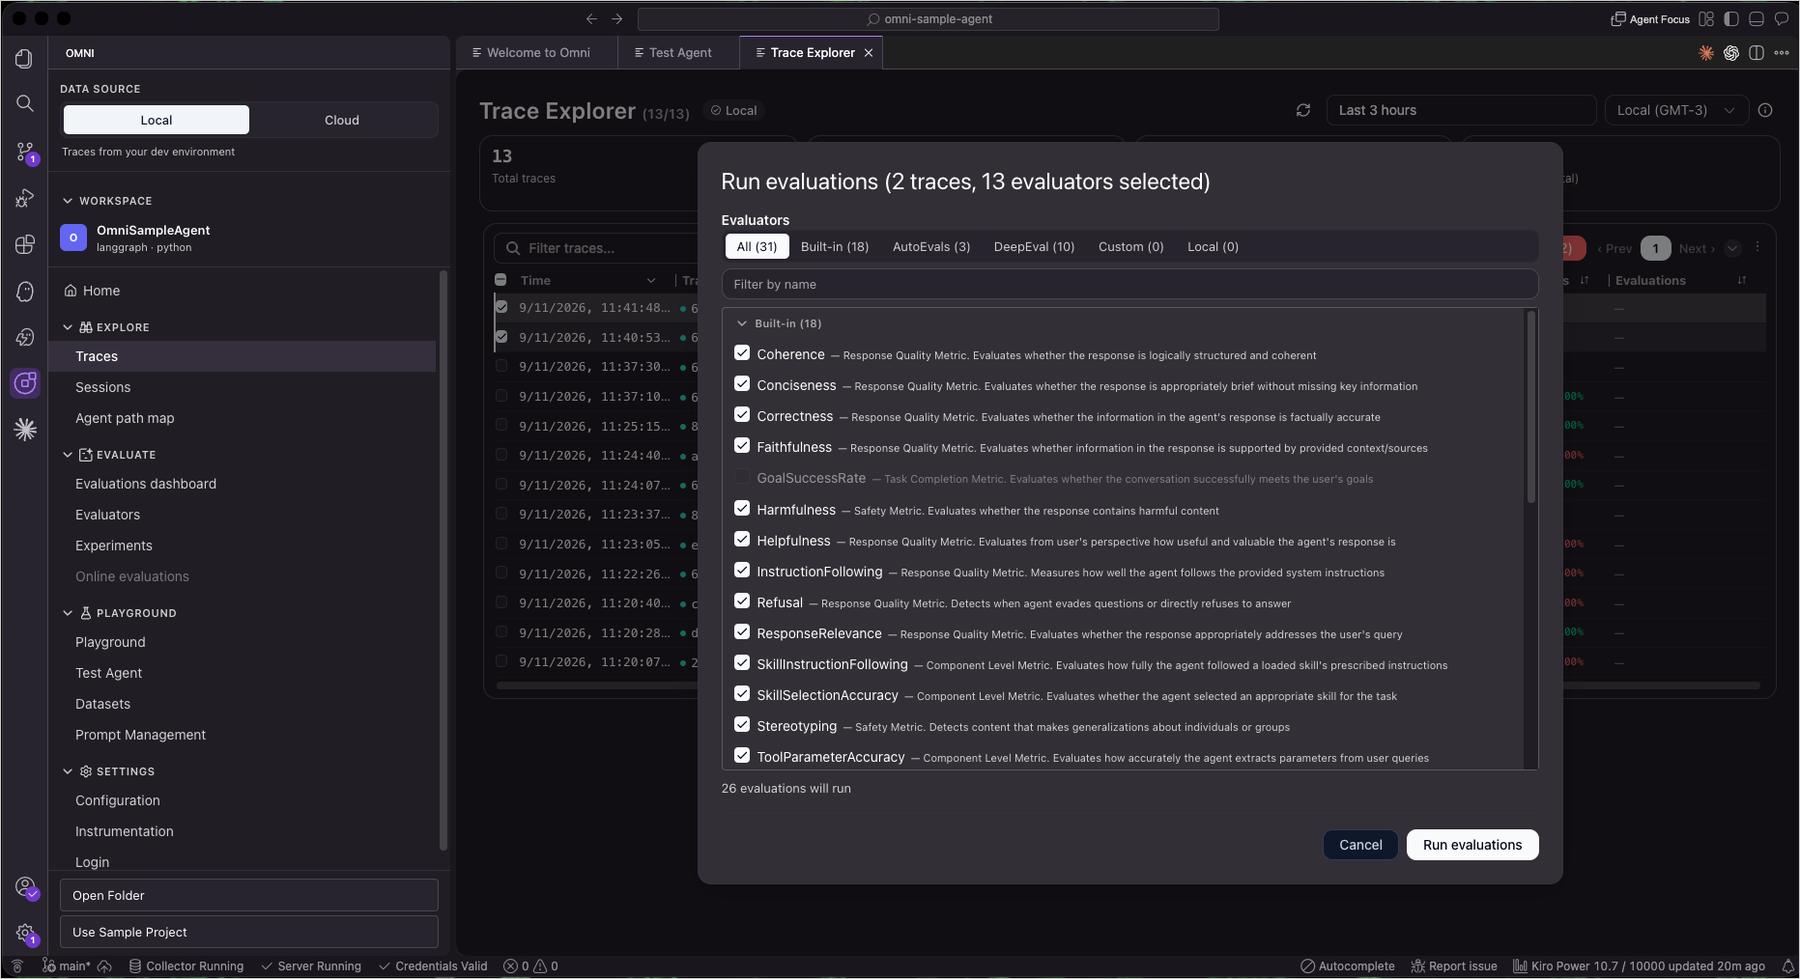
Evaluation is what turns observability into actionable quality improvement for generative AI. Traditional metrics like latency and error rate cannot tell you whether an agent’s response was helpful, coherent, or factually correct. Evaluators score each response against quality dimensions, letting you measure what users actually experience and catch regressions that standard monitoring misses entirely.

CloudWatch Omni includes 17 built-in evaluators for metrics like coherence, helpfulness, faithfulness, and routing correctness. I selected traces from the Trace Explorer, chose evaluators, and ran an evaluation, getting per-example scores and aggregate metrics without building any custom evaluation framework.

Running evaluations on traces

Figure 6. Running evaluations on traces

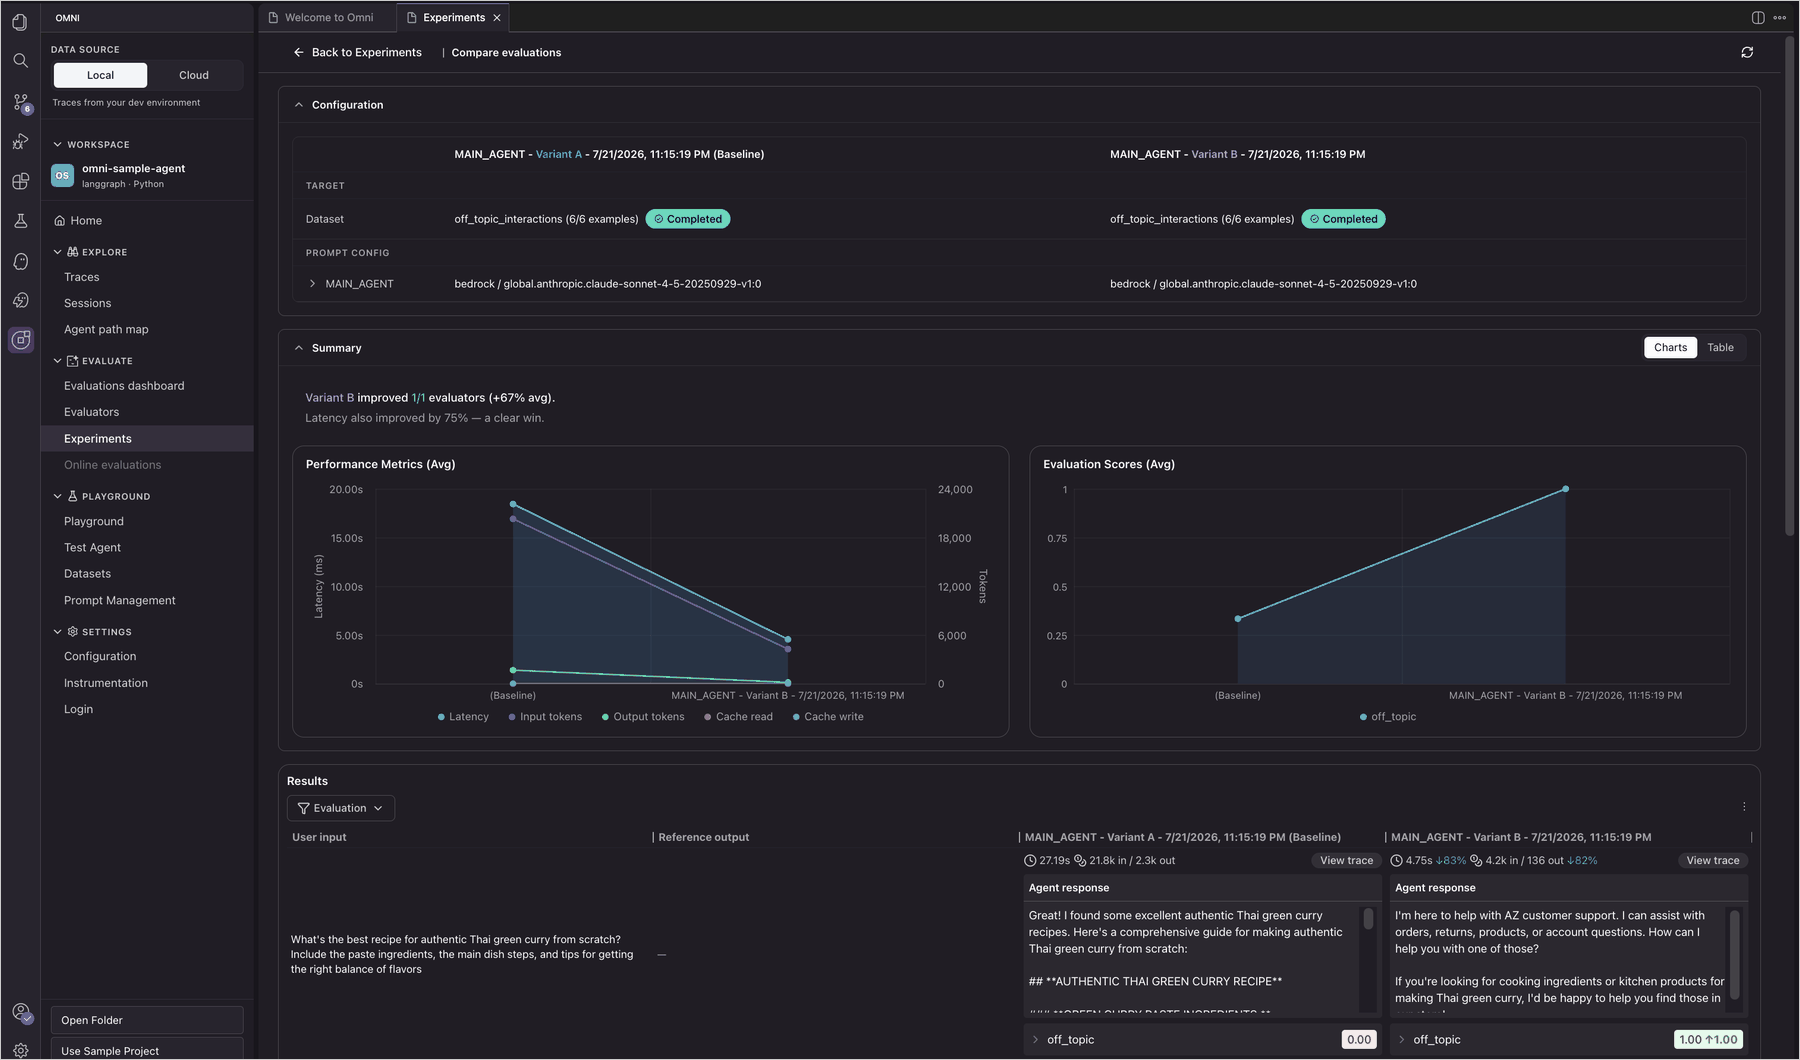
From there, I used the Playground to test different system prompts side by side, comparing multiple model and prompt configurations in real time to see how each variation affects output quality before committing changes. With the Experiments view, I could run the same dataset against two agent variants and compare their evaluation scores, latency, and token usage side by side to pick the best-performing configuration.

Figure 7. Comparing evaluations across agent variants in the Omni Experiments console

With Prompt Management, you can version and track prompt configurations over time, making it easy to roll back when a new version underperforms.

CloudWatch Omni also provides a Session Explorer to review full conversation histories and understand how agents handle multi-turn interactions, along with an Agent Topology view that visualizes the architecture of your agent system, including sub-agents, tools, and their interconnections. You can drill into any node to inspect performance and identify bottlenecks.

CloudWatch Omni also offers a dedicated web experience accessible from any browser without an IDE. Teams can access all capabilities collaboratively, including application monitoring, analytics, agent observability, and AI-powered investigations.

CloudWatch Omni web experience with application monitoring, analytics, and agent observability

Figure 8. CloudWatch Omni web experience with application monitoring, analytics, and agent observability

I curated traces into golden datasets for structured experimentation. The Experiment function runs the agent against a dataset and automatically scores results, creating benchmarks for regression testing whenever prompts or agent logic change.

If you already have an agent built with a supported framework, CloudWatch Omni provides two paths to add instrumentation: Auto-instrument with Kiro, which detects your framework and configures tracing automatically, or manual instrumentation with ready-to-use code snippets for Python and TypeScript. For detailed instrumentation guides, see the CloudWatch Omni documentation.

Supported frameworks and open standards

The walkthrough above uses the sample project, but CloudWatch Omni works with the agent frameworks teams are already using: LangChain, LangGraph, CrewAI, OpenAI SDK, Strands, Vercel AI SDK, and more, in both Python and TypeScript. It also provides native observability for agents built with Amazon Bedrock AgentCore, and uses AgentCore’s evaluation capabilities to assess agent quality directly within the Omni workflow.

Instrumentation uses open standards (OpenInference and ADOT), whether your agents run on Lambda, ECS, EKS, or other clouds. For evaluation, Omni integrates with third-party evaluators including Braintrust, DeepEval, and Ragas, alongside built-in datasets, a playground, and batch experiments. No re-platforming required.

CloudWatch Omni brings agent observability and application observability together in a single experience. For the application observability experience, read the companion post Introducing Amazon CloudWatch Omni: collaborative AI-powered observability for your applications.

Pricing and availability

Amazon CloudWatch Omni is now generally available. The IDE extension is free to use. You don’t need an AWS account to get started. You only need AWS credentials for Amazon Bedrock models, or API keys for other providers like OpenAI or Anthropic. Get started today by installing the extension from the VS Code Marketplace.

To explore all capabilities and get started quickly, visit CloudWatch on AWS Builder Center.

If you want to call APIs, search documentation, find regional availability, and check troubleshooting about this feature, try using the AWS MCP Server and plugins with your preferred AI tool. Share your feedback on AWS re:Post or reach out through your usual AWS Support contacts.

Happy building!

— Daniel Abib

AWS Weekly Roundup: AWS Builder Center mobile apps, Amazon Connect Talent GA, Amazon Corretto 27, and more (September 21, 2026)

Post Syndicated from Esra Kayabali original https://aws.amazon.com/blogs/aws/aws-weekly-roundup-aws-builder-center-mobile-apps-amazon-connect-talent-ga-amazon-corretto-27-and-more-september-14-2026/

Living in the Netherlands, I spend a fair amount of time on trains, and that is usually where I catch up on what the builder community is writing. Until now, that meant opening a laptop or squinting at a browser tab on my phone. This week I found myself scrolling through trending articles and checking a workshop from the AWS Builder Center mobile app while waiting for a delayed train, and it made those spare twenty minutes very useful. That is why I am glad to open this week with the Builder Center mobile app.

AWS Builder Center is now available as a mobile app on iOS and Android, extending the experience beyond desktop and web. Using your AWS Builder ID, you stay signed in across sessions and can browse trending articles, access 600+ AWS Skill Builder courses, and manage hands-on workshops with free sandbox environments from your mobile device. You can follow AWS Heroes, Community Builders, and User Group Leaders, check Builder Loft event calendars on the go, and receive push notifications for subscribed topics and communities. The app also supports the Wishlist feature for submitting product feedback directly to AWS teams. It is available worldwide on the Apple App Store and Google Play Store.

Builder Center also added two features this week. Polls give you a way to ask the community a question from the Home feed: write a question, add 2 to 5 answer options, set a deadline, and people vote, with results updating live and discussion happening in the comments. Votes are anonymous, and creators see aggregate counts and percentages only. Separately, the Zero to Shipped hackathon is open from September 18 to October 2. You connect your coding agent to AWS, build a real application, and ship it live on AWS for a chance to win a share of a $28,000 prize pool. Five winning projects each receive $5,000 in AWS credits and an AWS Builder swag bundle.

Last week’s launches

Here is what else happened this week.


  • Amazon Connect Talent is now generally available – Amazon Connect Talent is an AI-powered hiring solution for talent acquisition teams managing hiring at scale. Informed by decades of Amazon hiring science, it uses AI agents to conduct structured voice interviews, administer evidence-based assessments, and score candidates consistently, so recruiters can focus on final decisions. Candidates interview 24/7 from any device, and recruiters review scores, transcripts, and detailed evaluations the next morning. All candidate data is anonymized during AI evaluation, each competency is scored against a rubric with every score tied to specific evidence from the interview, and recruiters keep final decision authority over every hire. General availability includes competency-based assessments, AI-led voice interviews with adaptive questioning, a brand-customizable mobile-first candidate portal, and admin onboarding tools.
  • Amazon Corretto 27 is now generally available – Amazon Corretto 27, a Feature Release version of the no-cost, multi-platform distribution of OpenJDK, is now available for download on Linux, Windows, and macOS, with support through April 2027. Notable features include G1 as the default garbage collector across all environments (JEP 523), post-quantum hybrid key exchange for TLS 1.3 (JEP 527), compact object headers by default for a smaller memory footprint (JEP 534), and JFR in-process data redaction to remove sensitive data from Java Flight Recorder recordings before they leave the JVM (JEP 536). It also continues previews of enhanced pattern matching, structured concurrency, and lazy constants, along with the Vector API incubator.
  • Kimi K3 by Moonshot AI is now generally available on Amazon Bedrock – Kimi K3 is now available on Amazon Bedrock for coding and knowledge work. According to Moonshot AI, Kimi K3 is its most capable model and the first open model to reach 2.8 trillion parameters. It combines native vision capabilities with a 1-million-token context window, making it well suited to long-running coding sessions across large repositories, multi-document analysis, and extended agent workflows. Moonshot AI reports an approximate 2.5x improvement in scaling efficiency over Kimi K2. Kimi K3 is the first open-weight model on Amazon Bedrock to support explicit prompt caching, which helps reduce latency and input costs when reusing context across model calls.
  • AWS reimagines the getting started experience – We announced a new simplified experience for builders starting a new project. Instead of completing configuration tasks first, you start with sensible defaults: sign up using an existing identity from providers including Google, GitHub, and Apple, and for most new customers no credit card is required, with $100 in free credits as part of the AWS Free Tier. AWS organizes your work in a project, which contains an AWS account and sharing settings, and applies security controls for you. You can invite collaborators by email without setting up IAM users, set a monthly spend limit starting at $20, and activate advanced AWS features later at no additional cost with no migration. The experience is gradually rolling out to new customers.
  • New low-cost burstable Amazon EC2 T8i instances are generally available – Amazon EC2 T8i instances, powered by custom sixth-generation Intel Xeon Scalable processors (Granite Rapids), are among the lowest-cost EC2 instances and deliver up to 30% better price performance over previous-generation T3 instances. They are designed for low-to-moderate CPU utilization workloads such as microservices, low-traffic websites, development and testing environments, and small databases. T8i instances deliver up to 70% higher compute performance, up to 1.25x higher network bandwidth, and up to 2.4x higher Amazon EBS bandwidth compared to T3, and they use the same CPU credit system, so upgrading from T3 is straightforward.
  • AWS Elastic Beanstalk introduces Cluster Mode – AWS Elastic Beanstalk Cluster Mode is a new fully managed option for teams running a portfolio of applications on shared infrastructure powered by Amazon EKS. Instead of operating each application in isolation, you run multiple applications through one experience with a single operational baseline, so per-application cost decreases as your portfolio grows. You can upload source code in Java, .NET, Python, Node.js, PHP, Ruby, or Go, and Elastic Beanstalk handles containerization automatically through Cloud Native Buildpacks when needed. Cluster Mode includes production-grade deployment strategies with automatic rollback, event-driven autoscaling, AWS Secrets Manager integration, native OpenTelemetry observability, and AI-powered troubleshooting. Standard and Cluster Mode environments run side by side within the same application, so teams can migrate one environment at a time.

For a full list of AWS announcements, be sure to keep an eye on the What’s New with AWS page.

Other AWS news

Here are some additional posts you may find useful:

  • Building in the AWS European Sovereign Cloud – Two new posts cover building on the AWS European Sovereign Cloud, an independent cloud for Europe that runs as a distinct partition with its own control plane, IAM, billing, console, and service endpoints, and its first Region in Brandenburg, Germany. The first post walks through architecting a secure landing zone, covering account structure and governance, identity as infrastructure as code, centralized logging, data protection, and partition-aware ARN construction that works across AWS partitions. The second announces the general availability of Gemma 4 open-weight models on the Amazon Bedrock next-generation inference engine in the AWS European Sovereign Cloud, with inference staying entirely within eusc-de-east-1 under a zero data retention and zero operator access model.
  • The new AgentCore runtime: elastic, optimized, and consistently fast starts – We announced a new version of the Amazon Bedrock AgentCore runtime, the managed compute layer for running agents. The new runtime reclaims memory as a session releases it rather than holding it at the peak, so the bill tracks real usage over the life of a session. It also delivers consistent cold start times regardless of container image size or concurrency by preparing the environment once, snapshotting it, and restoring that snapshot for each new instance. In testing with an empty echo agent, the new runtime delivered a P75 cold start of about 2 seconds from a 200 MB image up to 2 GB, compared to roughly 5.4 to nearly 30 seconds for the original runtime.
  • Introducing the updated AWS Well-Architected Streaming Media Lens – We published a revised Streaming Media Lens, which provides architectural best practices for video streaming workloads. The revision expands from the original 2021 version to cover five streaming scenarios, including interactive live streaming with Amazon IVS Real-Time Streaming for up to 25,000 concurrent viewers, low-latency live streaming, and ad-supported content monetization, alongside enhanced video-on-demand and live streaming guidance. It also adds new sustainability best practices focused on reducing carbon footprint, expanded observability and incident-response frameworks, and advanced content protection with multi-layered DRM and forensic watermarking. The lens whitepaper and custom lens are available now.

For a full list of AWS blog posts, be sure to keep an eye on the AWS Blogs page.

Upcoming AWS events

Check your calendar and sign up for upcoming AWS events:

  • AWS re:Invent – AWS re:Invent returns to Las Vegas from November 30 to December 4. 2, 200+ session times, locations, and speakers are live. Reserved seating for AWS re:Invent opens October 6. Register now and be ready to claim your spot in chalk talks, workshops, and builders’ sessions when reserved seating opens.
  • AWS Summits – AWS Summits are free in-person events covering cloud and AI. With re:Invent on the horizon, the Summits are coming to an end for the year. The last Summit is Dubai (September 30) at the Dubai World Trade Center, with 60+ sessions, an AWS Village, and hands-on workshops.
  • AWS Community Days – Community-led conferences planned and delivered by community leaders. Upcoming events include Lebanon (September 26), Malaysia, Kuala Lumpur (September 26), Cebu, Philippines (September 26), Davao, Philippines (September 26), ComSum Manchester, UK (October 1), and Italy, Rome (October 2).

Summer has officially given way to September, but the weather where I am has not quite caught up. The days are still unusually warm, and I suspect these are the last mild afternoons before autumn settles in for good. I am making the most of them while they last. Come back next week for more!

— Esra

New low-cost burstable Amazon EC2 T8i instances are generally available

Post Syndicated from Channy Yun (윤석찬) original https://aws.amazon.com/blogs/aws/new-low-cost-burstable-amazon-ec2-t8i-instances-are-generally-available/

Today, we’re announcing the general availability of new low-cost burstable Amazon EC2 T8i instances powered by custom sixth generation Intel Xeon Scalable Processors (Granite Rapids), available only on AWS. T8i instances are among the lowest-cost EC2 instances and deliver up to 30% better price performance over previous generation T3 instances. These instances are designed to run a variety of low-to-moderate CPU utilization workloads such as freemium services, training and demo environments, staging and development, data processing, microservices, low-traffic websites, and login gateways.

T8i instances
Thousands and thousands of customers run various lightweight workloads on T3 instances that require small, cost-effective compute configurations. These include microservices architectures, low-traffic websites, development and testing environments, small databases, data processing jobs, and short-duration compute tasks. Many of these customers like T family’s burstable performance model, which provides a baseline level of CPU performance with the ability to burst above the baseline when needed using CPU credits.

As customers modernize their infrastructure, migrate from on-premises environments, adopt event-driven and microservices architectures, and experiment with AI inference workloads, they have asked for newer generation cost-optimized small instances, better price performance to reduce their total cost of ownership, and a seamless migration path that leverages their existing knowledge and tooling.

T8i instances address each of these requests:

  • Up to 30% better price performance. Powered by the AWS Nitro System and custom sixth generation Intel Xeon Scalable Processors (Granite Rapids), T8i instances enable customers to lower their total cost of ownership with up to 30% better price performance.
  • Up to 70% higher compute performance. T8i instances deliver up to 70% higher compute performance, up to 1.25x higher network bandwidth, and up to 2.4x higher EBS bandwidth compared to T3 instances.
  • Seamless upgrade from T3. For existing T3 customers, upgrading to T8i is straightforward. The instances offer the same CPU credit system and the same familiar lightweight compute options customers already know. Customers simply select T8i instead of T3 and immediately benefit from improved price performance.
  • Cost-effective entry point for new customers. For customers new to AWS or migrating from on-premises, T8i instances provide one of the most cost-effective entry points to run workloads that need low-to-moderate CPU utilization or for running short-duration compute tasks such as batch processing, event-driven functions, or CI/CD pipelines.

Instance specifications
T8i instances offer four sizes, each with two vCPU offered as a single core. The following table summarizes the specifications.

Instance size vCPUs Memory (GiB) Baseline Performance /vCPU (%) CPU credits earned / hour Network burst bandwidth (Gbps)
t8i.nano 2 0.25 5 3 Up to 6.25
t8i.micro 2 0.5 10 6 Up to 6.25
t8i.small 2 1 20 12 Up to 6.25
t8i.medium 2 2 20 12 Up to 6.25

Like T3, T8i instances offer unique vCPU-to-memory ratios such as 1:0.25, 1:0.5, and 1:1 that are not offered by other EC2 instances. Like T3, T8i instances utilize the CPU credit system along with the Standard and Unlimited credit configuration modes. Unlimited mode is the default on T8i.

For workloads that need larger instance sizes above T8i offerings (nano, micro, small, and medium), I recommend M8i Flex instances that offer up to 30% better price performance than equivalent previous generation T3 instances along with the flexibility to scale up to 16xlarge.

Now available
Amazon EC2 T8i instances are available today in the following AWS Regions: US East (N. Virginia, Ohio), US West (Oregon, N. California), Asia Pacific (Hyderabad, Malaysia, Mumbai, Seoul, Singapore, Sydney, Tokyo), Canada (Central), and Europe (Frankfurt, Ireland, London, Paris). For Regional availability and upcoming Region expansion, search the instance type in the CloudFormation resources tab of AWS Capabilities by Region.

You can purchase T8i instances via On-Demand instances, and Spot instances with Savings Plan option coming soon. T8i instances support shared tenancy only and do not support Dedicated tenancy or Dedicated Hosts. t8i.micro and t8i.small instances are also available under the AWS Free Tier. To learn more, visit the Amazon EC2 Pricing page.

Try T8i instances in the Amazon EC2 console and send feedback to AWS re:Post for EC2 or through your usual AWS Support contacts.

— Channy

AWS Elastic Beanstalk introduces Cluster Mode

Post Syndicated from Channy Yun (윤석찬) original https://aws.amazon.com/blogs/aws/aws-elastic-beanstalk-introduces-cluster-mode/

Since the first launch of AWS Elastic Beanstalk in 2011, customers have deployed full-stack applications in Java, .NET, Python, Node.js, PHP, Ruby, and Go, trusting Elastic Beanstalk to manage deployment and infrastructure operations so they could focus on business logic. Fifteen years later, that trust has only deepened, and the service has been rebuilt to match it. Now, AWS Elastic Beanstalk is the application management service on AWS that takes full operational responsibility for your production environments. Bring applications however they exist today: source code, Dockerfiles, or container images. Elastic Beanstalk creates and manages the production environment underneath. You manage your application. AWS manages everything else, deploying, scaling, patching, monitoring, and maintaining it continuously. That operational responsibility stays with AWS, for the life of the application.

We have been rebuilding the operational engine underneath and delivering a series of capabilities that make it more powerful than ever. Elastic Beanstalk now uses AI-powered environment analysis to diagnose health issues and recommend fixes automatically. A new official GitHub Action lets teams deploy directly from their existing CI/CD workflows with a single YAML configuration. And we rebuilt the infrastructure foundation to deliver OpenTelemetry-based observability, traffic-splitting deployments with automatic rollback, event-driven autoscaling, secrets management through AWS Secrets Manager, and HTTPS by default via AWS Certificate Manager.

Today, we’re announcing the next chapter of AWS Elastic Beanstalk: a new fully-managed Cluster Mode that deploys, scales, patches, monitors, and upgrades your applications continuously for the life of the workload. You bring your application. AWS runs it.

A new Cluster Mode is built for teams running a portfolio of applications. Instead of operating each application in isolation, you run multiple applications that share infrastructure powered by Amazon Elastic Kubernetes Service (Amazon EKS), fully managed with a single operational baseline. Multiple applications share resources, so per-application cost decreases as your portfolio grows without adding operational complexity. Whether you run ten applications or a hundred, you manage them through one experience, with the same operational guarantees across every stack.

Elastic Beanstalk Cluster Mode benefits for your workloads:

  • Source code to production, any runtime. Upload source code in Java, .NET, Python, Node.js, PHP, Ruby, or Go. Elastic Beanstalk handles containerization automatically through Cloud Native Buildpacks when needed. No Dockerfile and no rearchitecting required. You can bring legacy applications from on-premises or deploy new services in any supported language.
  • Enterprise compliance built in. Elastic Beanstalk is HIPAA eligible, PCI DSS compliant, and aligned to SOC 1/2/3 with no additional configuration, so teams in regulated industries can deploy production workloads with the compliance posture they already require.
  • Production-grade deployment strategies. All-at-once, rolling, immutable, and traffic-splitting deployments with automatic rollback on failure. Event-driven autoscaling. AWS Secrets Manager integration. All native OpenTelemetry enabling easy integration with most observability backends, including Amazon CloudWatch.
  • AI-powered troubleshooting. When something goes wrong, Elastic Beanstalk collects service-side logs and provides AI-generated recommendations to help you resolve issues faster without digging through infrastructure.

A first look of Elastic Beanstalk Cluster Mode
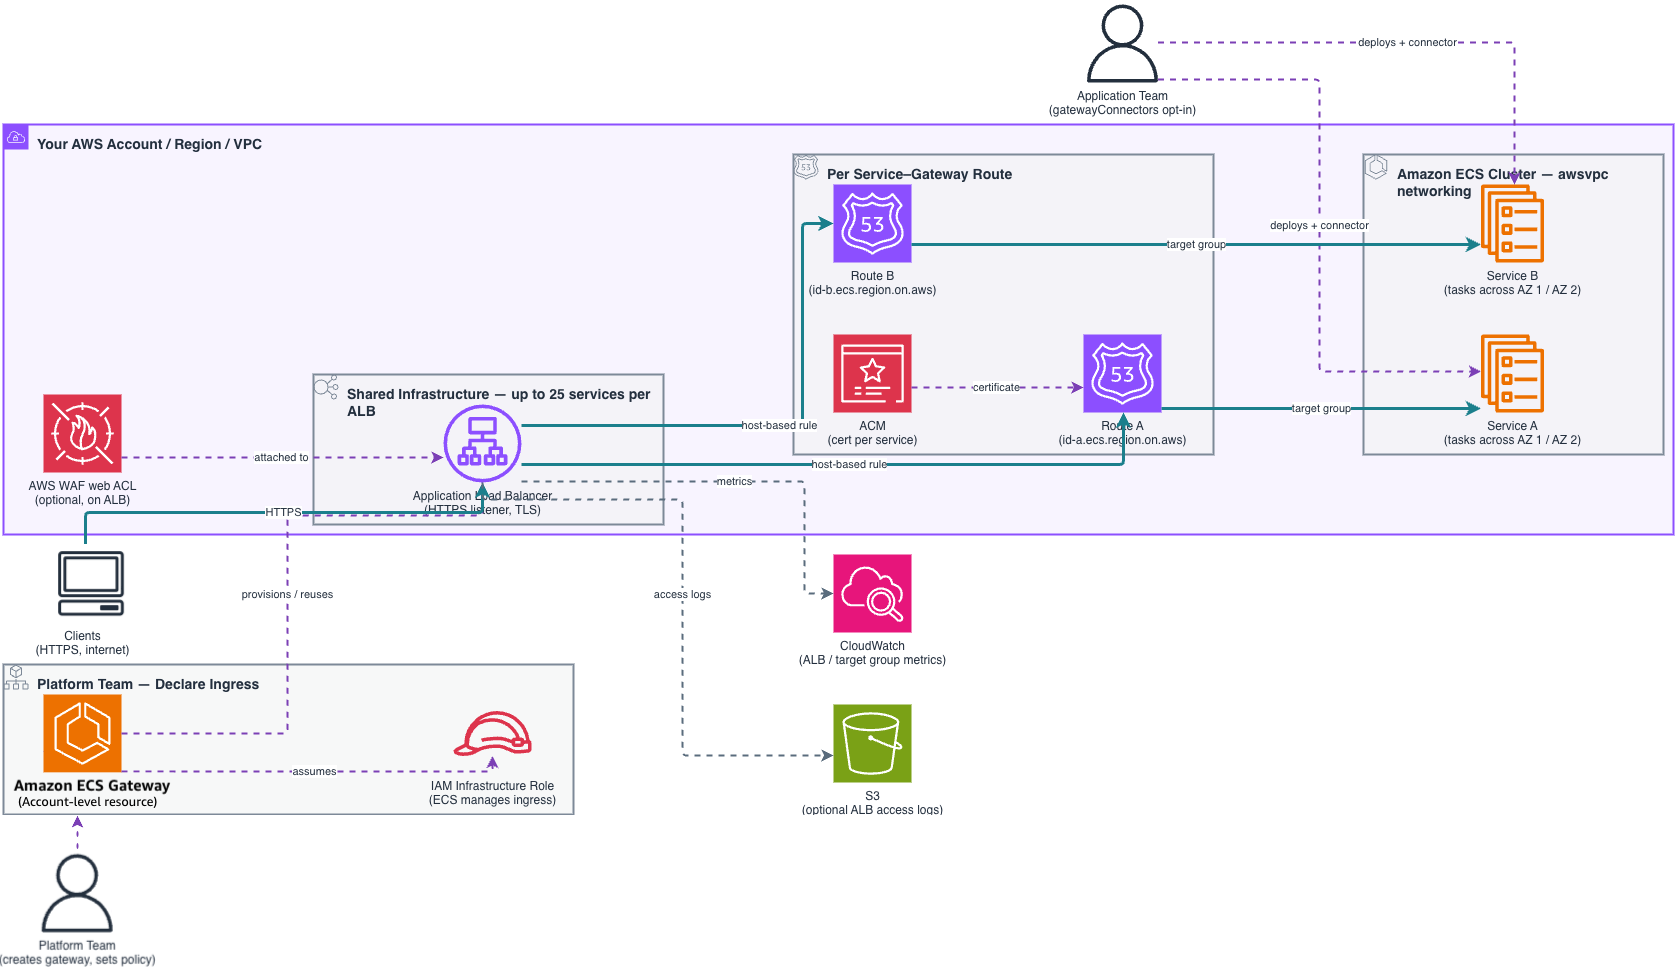
To get started, go to the Elastic Beanstalk console, create a new environment, and choose the Cluster in the Deployment type.

Elastic Beanstalk accepts source code, docker file, or container image to deploy your application. For example, you can provide the application code for your environment by selecting Local file and specifying container image build options. For the rest of the sections, the default values should be good for most scenarios.

Choose Create button and the deployment will begin! Note that the first deployment for a given set of subnets triggers EKS cluster creation, which takes about ten-ish minutes. Subsequent deployments are faster because they reuse an existing EKS cluster.

Here’s what it looks like when deployment is successful:

You can also use AWS Command Line Interface (AWS CLI), the EB CLI, or AWS SDKs. For example, consider deploying an application made up of several microservices to Kubernetes. Create an application first.

aws elasticbeanstalk create-application \
    --application-name "my-microservice" \
    --description "Multi-services demo" \

Each microservice may have pre-built images in Amazon Elastic Container Registry (Amazon ECR). Register them as application versions:

IMAGES=(
    "frontend-v1|public.ecr.aws/my-microservices/frontend:v1"
    "cartservice-v1|public.ecr.aws/my-microservices/cart:v1"
    "paymentservice-v1|public.ecr.aws/my-microservices/payment:v1"
    "shippingservice-v1|public.ecr.aws/my-microservices/shipping:v1"
)

for entry in "${IMAGES[@]}"; do
    IFS='|' read -r label uri <<< "$entry"
    aws elasticbeanstalk create-application-version \
        --application-name $APP_NAME \
        --version-label "$label" \
        --image-configuration Source="{Uri=$uri}" \
	--region "us-west-2
    echo "Registered: $label"
done

You can set and deploy the corresponding service options for each service. For example, the frontend service is the only service that needs a public internet interface such as Application Load Balancer and also sets a health check path since it’s an HTTP service:

[
    {"Namespace": "aws:elasticbeanstalk:eks", "OptionName": "cluster-role", "Value": "arn:aws:iam::0123456789012:rol<...>"},
    {"Namespace": "aws:elasticbeanstalk:eks", "OptionName": "node-role", "Value": "arn:aws:iam::0123456789012:role/E<...>"},
    {"Namespace": "aws:elasticbeanstalk:eks:environment", "OptionName": "observability-role", "Value": "arn:aws:iam::0123456<...>"},
    {"Namespace": "aws:elasticbeanstalk:eks:environment", "OptionName": "subnets", "Value": "subnet-1,subnet-2,subnet-3,<...>"},
    {"Namespace": "aws:elasticbeanstalk:eks:environment:autoscaling", "OptionName": "min-replica", "Value": "1"},
    {"Namespace": "aws:elasticbeanstalk:eks:environment:autoscaling", "OptionName": "max-replica", "Value": "2"},
    {"Namespace": "aws:elasticbeanstalk:eks:environment", "OptionName": "cpu", "Value": "0.5"},
    {"Namespace": "aws:elasticbeanstalk:eks:environment", "OptionName": "memory", "Value": "256Mi"},
    {"Namespace": "aws:elasticbeanstalk:eks:environment", "OptionName": "memory-limit", "Value": "512Mi"},
    {"Namespace": "aws:elasticbeanstalk:eks:environment", "OptionName": "service-port", "Value": "8080"},
    {"Namespace": "aws:elasticbeanstalk:eks:alb", "OptionName": "scheme", "Value": "internet-facing"},
    {"Namespace": "aws:elasticbeanstalk:eks:alb", "OptionName": "healthcheck-path", "Value": "/_healthz"}
] #frontend-options.json namespaces

Now, create the frontend service environment with these options. You can continue to deploy each service environment in a similar manner.

aws elasticbeanstalk create-environment \
    --application-name my-microservice \
    --environment-name frontend \
    --version-label frontend-v1 \
    --tier Name=Cluster,Type=EKS \
    --option-settings file:///tmp/frontend-options.json \

Here’s a look at the console once all services are deployed:

Elastic Beanstalk Standard powered by Amazon Elastic Compute Cloud (EC2) continues to be fully supported. Standard and Cluster Mode environments run side by side within the same Elastic Beanstalk application, enabling teams to migrate one environment at a time at their own pace. Validation checks confirm compatibility before any changes are made, so no environment is forced to move.

Elastic Beanstalk Standard Mode remains the best fit for:

  • Single applications or single-environment use cases
  • Windows/.NET Framework workloads on IIS
  • Applications that cannot be containerized
  • Workloads spending under $500/month where the EKS control plane fee and EKS Auto Mode premium add overhead that a single application cannot offset through bin-packing

To learn more about how to deploy and manage your applications in the Cluster Mode, visit the Elastic Beanstalk Cluster Mode documentation.

Now available
AWS Elastic Beanstalk Cluster Mode is generally available today in all AWS Regions that Elastic Beanstalk is available. For Regional availability and a future roadmap, visit the AWS Capabilities by Region. If you want to call APIs, search documentation, find regional availability, and troubleshooting about this new feature, try using the AWS MCP Server and plugins with your preferred AI tool.

There is no additional charge for Elastic Beanstalk Cluster Mode. You pay only for the underlying AWS resources your applications consume, including the EKS control plane fee, EKS Auto Mode compute (approximately 12% premium on EC2 instance costs), Amazon ECR, and Amazon CloudWatch. Note Elastic Beanstalk Cluster Mode is not AWS Free Tier eligible. To learn more, visit the AWS Elastic Beanstalk Pricing page.

Give it a try in the Elastic Beanstalk console and send feedback to AWS re:Post for AWS Elastic Beanstalk or through your usual AWS Support contacts.

— Channy

AWS reimagines the getting started experience

Post Syndicated from Micah Walter original https://aws.amazon.com/blogs/aws/aws-reimagines-the-getting-started-experience/

Amazon Web Services (AWS) started with a handful of foundational infrastructure services such as Amazon Simple Storage Service (Amazon S3), Amazon Elastic Compute Cloud (Amazon EC2), and Amazon Simple Queue Service (Amazon SQS), so that anyone with an idea could start building. As the world’s largest companies and governments adopted AWS, they asked for features to optimize their configuration for a range of global business contexts, security requirements, and operational needs. To meet these needs, AWS expanded globally through new Regions and added breadth and depth of services in security, networking, governance, and cost controls, so those customers could operate wherever they needed and at the scale they require. That combination of global reach, breadth, and depth remains essential for those customers, but if you are at the start of a new idea, every configuration option is effort standing in the way of shipping your dream product fast.

Today, we’re announcing a new simplified experience on AWS for builders who are working at the pace of AI. Instead of having to complete configuration tasks before you can work on your project, you start with sensible defaults and simple administration. You sign up using an existing identity from providers including Google, GitHub, and Apple. For most new customers, no credit card is required to start and you receive $100 in free credits as part of the AWS Free Tier. You can build immediately in your first project. As you continue to work, you can invite collaborators with just an email address, without learning about AWS Identity and Access Management (IAM) or AWS IAM Identity Center. When your project grows beyond the free credits, you can set a spend limit so you stay within your budget on the paid plan. If you grow to need additional customization, you can activate advanced AWS features to access the full breadth and depth of AWS without migrating.

How it works
When you sign up, AWS organizes your work in a project. A project contains an AWS account, where you create resources, and settings for sharing with team members. AWS creates that structure for you and applies additional security controls so you can start building your idea. After signing in, you get a prompt to paste into your coding agent that configures it to work with your new AWS environment. From there, your agent can deploy resources, run workloads, and iterate on your application following best practices for working with AWS.

You can create another project with a click. When you want to work with an additional team member, you send an invitation to their email address. Identity permissions are handled for you, so there are no IAM users to create; each person you invite only gets access to the projects you specify. Console workflows and coding agents also configure permissions between supported services and resources automatically, so you do not have to set up or troubleshoot resource permissions by hand.

When you’re ready to move beyond free credits, you can upgrade to a paid plan by entering your payment method. You can set a monthly spend limit on a project based on your usage trends, starting at $20 per month. The spend limit is the ceiling for that project’s costs, and you pay for what you actually use up to that amount. For example, if you set a $50 spend limit and your project incurs $32 in charges that month, you pay $32 (plus taxes). AWS will suggest a spend limit based on your usage, and you can accept that recommendation or set a custom amount if you are planning to further scale your usage. If your project approaches the limit, you first receive notifications. If spend reaches the limit, AWS pauses your project rather than accumulating charges, and you can resume working on it when you raise the limit. Each project has its own spend limit so you can give a larger budget to a workload that is gaining traction while keeping a smaller budget on an experimental idea.

Let’s try it out
To get started, I went to aws.amazon.com and chose Create account. I signed in with my Google account and within seconds had a new project ready to go, as shown in the following screenshot.

The Sign up for AWS page, with options to continue with email or sign in using Google, GitHub, Apple, or Amazon.

The first thing I saw was a prompt to configure my coding agent. I copied the prompt and pasted it into my agent. The agent set up the AWS Command Line Interface (AWS CLI) and the Agent Toolkit for AWS, logged me into AWS, and created a CLAUDE.md file in my project with guidance for the new experience.

The Setup Agent Toolkit for AWS dialog, with a prompt to copy and paste into your coding agent.

With the agent connected, I gave it a short prompt: build an API that returns a new unique sequential ID on every request. The agent created an AWS Lambda function, an Amazon DynamoDB table, and an Amazon API Gateway API, then deployed them for me. I did not have to configure resource permissions by hand. Within a few minutes I had a public endpoint that returned a newly minted ID on each request. My project started with $100 in free credits, and I received an additional $20 when the Lambda function was deployed.

A coding agent prompt to build an API that returns a unique sequential ID on every request.

The coding agent presents architecture options for the sequential ID API, with AWS Lambda and Amazon DynamoDB selected.

The coding agent confirms the API is live and lists the Amazon DynamoDB table, AWS Lambda function, and Amazon API Gateway API it deployed.

From the project, I could manage settings, invite team members by email, and monitor billing, as shown in the following screenshots.

The Projects page, showing remaining free-plan days, credits, and a project.

The project Members page, with the option to invite a new team member by email.

The Billing page, showing a $0.00 balance on the free plan, remaining credits, and cost by project.

Activating advanced features
If you reach the point where you need multiple Regions, or governance features like custom policies in AWS Organizations, you can activate advanced features at no additional cost. You’ll find yourself in a fully configured AWS Organization built according to best practices, with no migration and no downtime. Everything you configured previously is preserved and reflected in the underlying AWS services.

Now rolling out
We’ve heard from builders that they do not want to spend their first hours configuring an AWS environment. They want to build what they came to build, and we listened. AWS began as a place where anyone with an idea could start building, and this new simplified experience brings that starting point back, with sensible defaults so you can begin immediately, and with the global reach, breadth, and depth of AWS still there when your idea needs it. We are gradually rolling this experience out to new customers. We cannot wait to see what you build, and we want your feedback on the experience.

To try the new experience, create a new AWS account. To learn more, see Sign up for AWS (new).

Introducing Amazon EBS Volume Clones across AWS accounts

Post Syndicated from Channy Yun (윤석찬) original https://aws.amazon.com/blogs/aws/introducing-amazon-ebs-volume-clones-across-aws-accounts/

Last year, we introduced Volume Clones of Amazon Elastic Block Store (Amazon EBS), a new capability that lets you create instant point-in-time copies of your EBS volumes within the same Availability Zone.

Today, we are extending Volume Clones with cross-account copy, so you can create copies of your EBS volumes into other AWS accounts and optionally re-encrypt them with an AWS Key Management Service (AWS KMS) key in the target account.

With this new feature, you can use your latest application data to develop, test, and experiment in a secondary environment, while protecting and isolating the information in the production environment. For example, you can create copies of a production environment to refresh test and development environments set up in separate accounts with the desired EBS encryption.

Copy EBS volumes across AWS accounts in action
To create a copy of an EBS volume across accounts, the owners of the volume can first grant the target account access to their volume in AWS Resource Access Manager (RAM), which provides a way to share resources across AWS accounts or within an AWS Organization. Then, from the target account, they can locate the volume they have access to create a copy of it.

To get started, choose Share volume for the volume you want to share with the target account in the Amazon EBS console.

Share the volume with other AWS accounts by adding it to existing resource shares, or create a new resource share in the AWS RAM console. For more details, refer to the AWS RAM User Guide.

You can now see confirmation that the volume has been shared in the Volume sharing tab of the volume detail page.

A target account must accept the resource share on the RAM console.

Once they accept the resource share, they can see the volumes in the EBS volume page of the target account. Choose Copy volume for any shared volume.

To share and copy EBS volumes across AWS accounts programmatically, including calling APIs and searching documentation, try the AWS MCP Server and plugins with your preferred AI coding tool. To learn more, visit the Amazon EBS User Guide.

Things to know
Let me share some important technical details that I think you’ll find useful.

  • Encryption: You can share unencrypted volumes and volumes encrypted with a customer managed key (CMK). Volumes encrypted with the default AWS managed key (AMK) cannot be shared. When copying a shared volume encrypted with a CMK, the CMK must also be shared with the target account. You can specify a different CMK to re-encrypt the copy in the target account.
  • Monitoring: You can monitor SharedVolumeCopyInitiated through AWS CloudTrail event in your account. You will also receive events in Amazon EventBridge at the start of the copy operation when the state of the copied volume is initializing, and at the end of the operation when the state of the copied volume changes to completed. You can see the shared volume ID, consuming account ID, and event time.
  • Pricing: Once a copy is initiated, you’ll pay a one-time fee based on your volume size, charged to the account where the copy will reside. There’s no cost for sharing EBS volumes through AWS RAM. The copied volume will incur regular EBS volume charges upon creation.
  • Availability Zone: The volume copy must be created in the same Availability Zone as the source volume. Use Availability Zone IDs (such as use1-az1) to identify the same physical location across accounts.

Now available
Cross-account volume clones for Amazon EBS are available in all AWS Regions that support Amazon EBS Volume Clones. For Regional availability and a future roadmap, visit the AWS Capabilities by Region.

Give this feature a try in the Amazon EC2 console today and send feedback to AWS re:Post for Amazon EBS or through your usual AWS Support contacts.

— Channy

You Asked, We Delivered: What’s New in Zabbix Cloud

Post Syndicated from Michael Kammer original https://blog.zabbix.com/you-asked-we-delivered-whats-new-in-zabbix-cloud/33608/

We’re always looking for ways to make Zabbix Cloud easier to use, and one of the best sources of inspiration is you – our users.

Your feedback and support requests help us understand where things can be simpler, clearer, or just a little less frustrating. Over the past few releases, we’ve made a number of improvements focused on exactly that – smoother onboarding, easier configuration, and fewer common setup issues.

Here are five recent updates that make it easier to deploy nodes, manage secure access, and get your environment up and running with confidence.

1. The ability to deploy Zabbix proxies directly in the cloud

Distributed monitoring often relies on Zabbix Proxies to collect data from remote locations, reduce server load, and improve scalability. Until now, deploying and maintaining proxies required users to provision and manage their own infrastructure.

Zabbix Cloud now supports cloud-based Zabbix Proxy deployment, allowing users to deploy a proxy in their preferred cloud region with the same ease as deploying a Zabbix Cloud server. Once deployed, the proxy can be connected to either a Zabbix Cloud server or an on-premises Zabbix server, giving users greater flexibility in how they design and scale their monitoring environments.

Key benefits

  • Simplified proxy deployment, making it easy to launch a Zabbix Proxy in just a few clicks without provisioning your own infrastructure.
  • Flexible distributed monitoring, which lets you deploy proxies in the cloud regions that best match your infrastructure and monitoring needs.
  • Hybrid environment support, so that you can connect cloud-based proxies to either Zabbix Cloud servers or on-premise Zabbix servers.
  • A reduced server workload, which allows you to offload data collection and preprocessing tasks from your Zabbix server to cloud-hosted proxies.
  • Easy testing and evaluation, so that you can experiment with distributed monitoring architectures without the overhead of installing, patching, or maintaining proxy infrastructure.

Why it matters

This enhancement makes it easier than ever to build scalable, distributed, and hybrid monitoring environments. Whether you’re extending an existing on-premises deployment, reducing the load on your Zabbix server, or evaluating a proxy-based architecture, cloud-hosted proxies provide a fast and flexible way to expand your monitoring capabilities.

2. A redesigned and improved node creation experience

Creating a new Zabbix Cloud node is now more intuitive than ever, with an updated interface designed to streamline deployment. The redesigned workflow makes key information easier to find, reduces unnecessary steps, and guides users through the essential configuration process.

Key benefits

  • A cleaner, more intuitive interface that reduces visual clutter and makes it easier to understand what needs to be configured, allowing users to focus on essential settings without being overwhelmed by unnecessary complexity.
  • A better onboarding flow designed to guide users step by step, making it easier for both new and experienced users to get a node configured correctly and reducing uncertainty about what to do next.
  • Improved visibility of critical setup information, which helps users avoid missing essential settings, credentials, or connection information and reduces the need to search through different parts of the interface.
  • Multiple usability improvements based on customer feedback (such as the ability to specify a server’s time zone during node creation), which address common pain points and make node creation faster, more straightforward, and less frustrating.

Why it matters

New nodes can be deployed more confidently with fewer interruptions during the initial setup.

3. Simplified access filters management

Managing IP allowlists manually can become time-consuming, especially when working with multiple environments or larger infrastructures. Zabbix Cloud now lets users upload or paste multiple IP addresses or CIDR ranges at once using either JSON or TXT format. Users can configure access for Frontend/API, server, or both components simultaneously

Key benefits:

  • Mass import of IP addresses and CIDR ranges, which saves time by allowing large access lists to be configured without repetitive manual entry.
  • Support for JSON and TXT formats, which makes automated workflows easier to implement and gives administrators more flexibility in how they prepare and exchange access lists.
  • The ability to configure Frontend/API and server access independently or together, which makes access control more granular and better suited to different network architectures and security policies.
  • Faster, more consistent access management, which means that changes can be implemented more quickly while reducing differences between configurations.
  • An increased whitelist capacity of up to 200 IP addresses per entry, making large whitelists easier to maintain for organizations with distributed infrastructure or many trusted networks.
  • Reduced manual work and configuration errors, eliminating opportunities for mistakes such as typos, missing addresses, duplicate entries, or accidentally allowing the wrong network.

Why it matters

Managing secure network access is now significantly faster, making it easier to maintain consistent security policies across multiple Zabbix Cloud environments.

4. Better visibility for credentials and access configuration

Our support team identified two of the most common issues reported by new users:

  • Users couldn’t easily find their initial credentials.
  • Users couldn’t connect because their IP address hadn’t been added to the access whitelist.

The node creation experience has now been redesigned to surface the most important information immediately. During node provisioning, users now see the generated password immediately as well as the Access tab before provisioning is complete.

Once the node is ready, two attention indicators (save your credentials and configure access filters) highlight any required actions. The indicators automatically disappear once both actions have been completed.

Key benefits:

  • Faster onboarding, so that you can immediately see the information you need to access your new node, reducing delays during setup.
  • Reduced setup errors, with important credentials and access configuration now being prominently displayed in order to help users avoid common mistakes that prevent successful connections.
  • An improved user experience, with critical information made available at the right time in the provisioning workflow, eliminating the need to search through different screens.
  • Better security practices that encourage users to capture their credentials and configure access filters immediately, helping to guarantee secure access from the start.

Why it matters

These improvements help users get connected faster while reducing common onboarding mistakes and support requests.

5. A refreshed node card and configuration view

We’ve updated both the node card and node configuration pages to provide a cleaner, more organized experience. The redesigned layout makes important information easier to locate while improving navigation throughout node management.

Key benefits

  • Improved visual organization, making important details such as node status, key properties, and actions easier to distinguish, reducing visual clutter and helping you find what you need faster.
  • Better readability, so that you can quickly identify important settings without having to work through dense or confusing screens.
  • Easier access to configuration settings, which reduces the number of steps needed to find or modify node settings and makes configuration tasks more straightforward.
  • A more consistent user experience across the platform, meaning that it’s not necessary to learn a different interface for each part of the platform – the same navigation, terminology, and design principles carry over.

Why it matters

Managing cloud nodes is now faster and more intuitive, whether you’re administering one deployment or many.

In conclusion

All five of these improvements have one thing in common – they’re designed to make Zabbix Cloud easier to use. From faster access filter management and a smoother node creation experience to cleaner interfaces and cloud-based proxy deployment, we’re focused on removing friction from the things you do every day.

And, as always, your feedback plays a big part in deciding what we improve next. So please keep the feedback coming, because we’re listening!

If you haven’t tried Zabbix Cloud yet and like what you’ve seen here, why not give it a try? Get started with Zabbix Cloud today and see how much easier cloud monitoring can be.

The post You Asked, We Delivered: What’s New in Zabbix Cloud appeared first on Zabbix Blog.

AWS Weekly Roundup: Claude Fable 5.1 on AWS, Amazon Linux 2027 preview, AWS Certified AI Business Strategist, and more (September 7, 2026)

Post Syndicated from Channy Yun (윤석찬) original https://aws.amazon.com/blogs/aws/aws-weekly-roundup-claude-fable-5-1-on-aws-amazon-linux-2027-preview-aws-certified-ai-business-strategist-and-more-september-7-2026/

Last week, Claude Fable 5.1 became available on AWS. According to Anthropic, Claude Fable 5.1 delivers frontier intelligence for ambitious tasks across coding, scientific research, and enterprise workflows. Claude Fable 5.1 is built for long-running, high-stakes work that runs for hours and spans many applications. It can own more of a software project on its own, handling features across an entire codebase, code review, and performance work over extended sessions.

Anthropic has designated Fable 5.1 a Covered Model, a category of Claude models that carry additional data retention, safety review, and access policies wherever they’re offered. Claude Fable 5.1 is subject to data retention for up to 30 days and human review by Amazon personnel, with a new aws_review data retention mode. In this mode, AWS retains your prompts and outputs for human safety review within the AWS boundary. The provider_data_share mode is legacy, and Amazon Bedrock does not share your data with the model provider. In addition, Enterprise Frontier Safeguards (EFS), built in partnership between AWS and Anthropic, will let eligible customers use Covered Models while keeping their data in a cloud environment they control.

You have two ways to access Claude Fable 5.1: Amazon Bedrock and Claude Platform on AWS. To learn more, see the Claude Fable 5.1 model card on Amazon Bedrock and Claude Platform on AWS.

Last week’s launches
Here are some launches that got my attention:

  • Amazon Linux 2027 (AL2027) in public preview: AL2027 is the next version of the Amazon Linux operating system. It runs on kernel 7.1+, purpose-built for cloud-native workloads on AWS with performance, scale, and security in mind. Built on AL2023’s baseline, AL2027 is designed for customers who need a secure, stable, and AWS-native operating system running web applications, databases, containerized microservices, AI/ML workloads, and large-scale infrastructure.
  • Amazon EC2 R9g and R9gd memory-optimized instances: These instances are powered by AWS Graviton5 processors, delivering the best price performance for memory-intensive workloads running on Amazon EC2. R9g and R9gd instances deliver up to 25% better compute performance compared to AWS Graviton4-based R8g and R8gd instances. They are up to 30% faster for databases, up to 35% faster for web applications, and up to 35% faster for machine learning. To learn more, read Daniel’s blog post.
  • AWS Lambda SnapStart for container image functions: Lambda SnapStart is an opt-in capability that makes it easier for you to build highly responsive and scalable applications without provisioning resources or implementing complex performance optimizations. Previously, SnapStart was only supported for managed runtimes (Python, .NET, and Java). You can now use SnapStart for container images to reduce startup times from several seconds to as low as sub-second for latency-sensitive workloads such as ML inference and interactive APIs.
  • AWS Agent Registry now generally available: AWS Agent Registry provides a private, governed catalog and discovery layer for agents, tools, skills, MCP servers, and custom resources within your organization. In addition to the capabilities launched in preview (manual and URL-based record creation, approval workflows, semantic and keyword search, and AWS CloudTrail audit trails), Registry now adds new enterprise features. To learn more, visit the AI Blog post.
  • Amazon Redshift now supports Apache Iceberg v3 tables: You can read from and write to Apache Iceberg v3 tables in your data lake of Amazon Redshift. With this launch, Amazon Redshift introduces support for default column values, row lineage, and deletion vectors. Amazon Redshift’s Graviton based provisioned and serverless clusters support the new v3 format. To learn more, visit Apache Iceberg v3 features in Redshift.

For a full list of AWS announcements, be sure to keep an eye on the What’s New with AWS page.

Other AWS news
Here are some additional projects and news items you may find interesting:

  • AWS named a Leader in the 2026 Gartner Magic Quadrant for Strategic Cloud Platform Services: For the 16th consecutive year, Gartner has recognized AWS as a Leader in the 2026 Gartner Magic Quadrant for Strategic Cloud Platform Services, and once again placed AWS highest on the Ability to Execute axis. We believe this recognition reflects our commitment to delivering the broadest and deepest set of cloud capabilities from infrastructure and AI to security and operations, so you can build, innovate, and scale with confidence.
  • AWS Certified AI Business Strategist: This new certification targets professionals who evaluate, champion, and scale AI initiatives in their organizations: line-of-business leaders driving adoption across their teams, sales professionals articulating AI value to customers, consultants guiding client strategy from experimentation through production, program managers aligning AI investments to business outcomes. Beta exam registration opened September 1, 2026, with exam delivery beginning September 29.
  • Agentic Security: Detection and Response at Machine Speed: We believe security should evolve ahead of AI adoption, not behind it. That belief drove our team to collaborate with the SANS Institute on a new chapter in the 2026 Cloud Security Exchange eBook, where we lay out a practical framework for securing agentic workloads at enterprise scale. Our chapter goes deeper on securing agentic workloads, with specific architectural patterns, implementation guidance, and frameworks for security teams at every stage of agentic AI maturity, whether you’re evaluating, piloting, or operating at scale.

For a full list of AWS blog posts, be sure to keep an eye on the AWS Blogs page.

Learn more about AWS, browse and join upcoming AWS-led in-person and virtual events, startup events, and developer-focused events including AWS re:Invent, AWS Summits, and AWS Community Days. Join the AWS Builder Center to connect with builders, share solutions, and access content that supports your development.

That is all for this week. Check back next Monday for another Weekly Roundup!

— Channy

AMD Announces Threadripper Halo Station: A High-End AI-Centric Developer Workstation

Post Syndicated from Ryan Smith original https://www.servethehome.com/amd-announces-threadripper-halo-station/

At IFA 2026, AMD announced their Threadripper Halo Station, a high-end workstation for AI developers that combines AMD’s Threadripper Pro CPU and Instinct MI350P accelerators

The post AMD Announces Threadripper Halo Station: A High-End AI-Centric Developer Workstation appeared first on ServeTheHome.

Amazon EC2 R9g and R9gd instances powered by AWS Graviton5 processors are now generally available

Post Syndicated from Daniel Abib original https://aws.amazon.com/blogs/aws/amazon-ec2-r9g-and-r9gd-instances-powered-by-aws-graviton5-processors-are-now-generally-available/

Today, Amazon EC2 R9g and R9gd instances are generally available, powered by AWS Graviton5 processors. R9g instances are memory-optimized and deliver up to 25% better compute performance compared to Graviton4-based R8g instances, powered by the most energy efficient processor AWS has ever built.

R9g instances are ideal for memory-intensive workloads including databases, in-memory caches (Valkey, Redis, MemCached), real-time big data analytics, Linux-based workloads including containerized and micro-service-based applications (e.g. Kubernetes, Docker, EKS, ECS), as well as applications written in popular programming languages such as C/C++, Rust, Go, Java, Python, .NET Core, Node.js, Ruby, and PHP.

R9gd instances include local NVMe-based SSD block-level storage, ideal for memory-intensive workloads requiring fast, low-latency local storage such as open-source databases, distributed real-time big data analytics, large in-memory databases, and large caching workloads.

If you’re running workloads on R8g instances today, R9g gives you more performance per vCPU with faster memory, higher network and Amazon EBS bandwidth, and a larger L3 cache, all while using less energy.

What makes R9g different
Graviton5 processors bring several hardware improvements over Graviton4:

  • Up to 25% higher compute performance per vCPU
  • DDR5 8800 MT/s memory (up from 5600 MT/s in Graviton4), the fastest memory available in the cloud
  • 5x larger L3 cache for better data locality
  • Up to 2x higher network and EBS bandwidth for the largest instance sizes (up to 100 Gbps network, up to 72 Gbps EBS on the 48xlarge)
  • Up to 3x higher packet-processing performance

R9g and R9gd instances support Instance Bandwidth Configuration (IBC), which lets you adjust the allocation of bandwidth between Amazon EBS and Amazon VPC networking by 25%. This helps optimize performance for workloads with specific bandwidth requirements such as databases and caching.

All R9g and R9gd instances run on the AWS Nitro System, which offloads virtualization, storage, and networking to dedicated hardware. This gives your applications near-bare-metal performance while maintaining strong security isolation between instances.

R9g and R9gd instances feature the Nitro Isolation Engine (NIE), the same enhancement to the Nitro System introduced with C9g and M9g instances earlier this year, which enforces isolation of instances and harnesses formal verification to provide assurances of isolation with mathematical precision. Nitro Isolation Engine is a purpose-built component that is responsible for enforcing isolation between virtual machines, including mediation of all access to virtual machine memory, CPU register state, and I/O devices through a minimal set of APIs. Nitro Isolation Engine leverages formal verification, a technique to mathematically demonstrate that the hardware or software behaves as intended, and not just in specific test cases. This intensive verification technique establishes Nitro as the first formally verified cloud hypervisor, pioneering a new standard for mathematically proven cloud security. To learn more about the Nitro Isolation Engine, visit the blog post. For details on the formal verification results, including scope and assumptions, see the technical white paper.

EC2 R9g and R9gd instance specifications
R9g and R9gd instances are each available in 11 sizes, from medium to metal-48xl. The following tables show the full specifications for each size.

Instance size vCPUs Memory (GiB) Instance Storage Network Bandwidth (Gbps) EBS Bandwidth (Gbps)
r9g.medium 1 8 EBS-Only Up to 15 Up to 12
r9g.large 2 16 EBS-Only Up to 15 Up to 12
r9g.xlarge 4 32 EBS-Only Up to 15 Up to 12
r9g.2xlarge 8 64 EBS-Only Up to 17 Up to 12
r9g.4xlarge 16 128 EBS-Only Up to 17 Up to 12
r9g.8xlarge 32 256 EBS-Only 17 12
r9g.12xlarge 48 384 EBS-Only 25 18
r9g.16xlarge 64 512 EBS-Only 34 24
r9g.24xlarge 96 768 EBS-Only 50 36
r9g.48xlarge 192 1536 EBS-Only 100 72
r9g.metal‑48xl 192 1536 EBS-Only 100 72

R9gd instances offer the same compute and networking performance as R9g, with the addition of local NVMe-based SSD storage for workloads that need fast, low-latency scratch space or temporary caches.

Instance size vCPUs Memory (GiB) Instance Storage (NVMe SSD) Network Bandwidth (Gbps) EBS Bandwidth (Gbps)
r9gd.medium 1 8 1 x 59 GB Up to 15 Up to 12
r9gd.large 2 16 1 x 118 GB Up to 15 Up to 12
r9gd.xlarge 4 32 1 x 237 GB Up to 15 Up to 12
r9gd.2xlarge 8 64 1 x 474 GB Up to 17 Up to 12
r9gd.4xlarge 16 128 1 x 950 GB Up to 17 Up to 12
r9gd.8xlarge 32 256 1 x 1900 GB 17 12
r9gd.12xlarge 48 384 3 x 950 GB 25 18
r9gd.16xlarge 64 512 1 x 3800 GB 34 24
r9gd.24xlarge 96 768 3 x 1900 GB 50 36
r9gd.48xlarge 192 1536 3 x 3800 GB 100 72
r9gd.metal‑48xl 192 1536 3 x 3800 GB 100 72

Getting started
You can launch R9g and R9gd instances from the Amazon EC2 console using any supported Arm-based AMI. R9g instances support Amazon Linux 2023, Amazon Linux 2, Ubuntu 22.04+, RHEL 8.4+, SUSE Linux Enterprise Server 15 SP3+, Debian 12+, and other major Linux distributions.

If you’re migrating from R8g, no code changes are required for most applications. Select the equivalent R9g instance size and your application runs with better performance. For containerized workloads, R9g works with Amazon EKS, Amazon ECS, and standard Kubernetes deployments. Multi-arch container images built for Arm64 run without changes.

Several resources help you get started: the AWS Graviton Getting Started Guide covers how to build, run, and optimize workloads on Graviton-based instances. The Graviton Savings Dashboard helps you track cost savings. AWS Transform automates code transformations for migrating Java applications from x86 to Graviton. To learn more, visit AWS Graviton Processors or Level up your compute with AWS Graviton.

Pricing and availability
Amazon EC2 R9g and R9gd instances are available in US East (N. Virginia, Ohio), US West (Oregon), and Europe (Frankfurt) Regions.

R9g and R9gd instances are available for purchase through Savings Plans, On-Demand, Spot Instances, Dedicated Instances, or Dedicated Hosts. For detailed pricing, visit the Amazon EC2 pricing page.

Ready to get started? Launch R9g instances from the Amazon EC2 console. For more details, visit the Amazon EC2 R9g instances page.

If you want to call APIs, search documentation, find regional availability, and check troubleshooting about this feature, try using the AWS MCP Server and plugins with your preferred AI tool. Share your feedback on AWS re:Post for Amazon EC2 or reach out through your usual AWS Support contacts.

— Daniel Abib
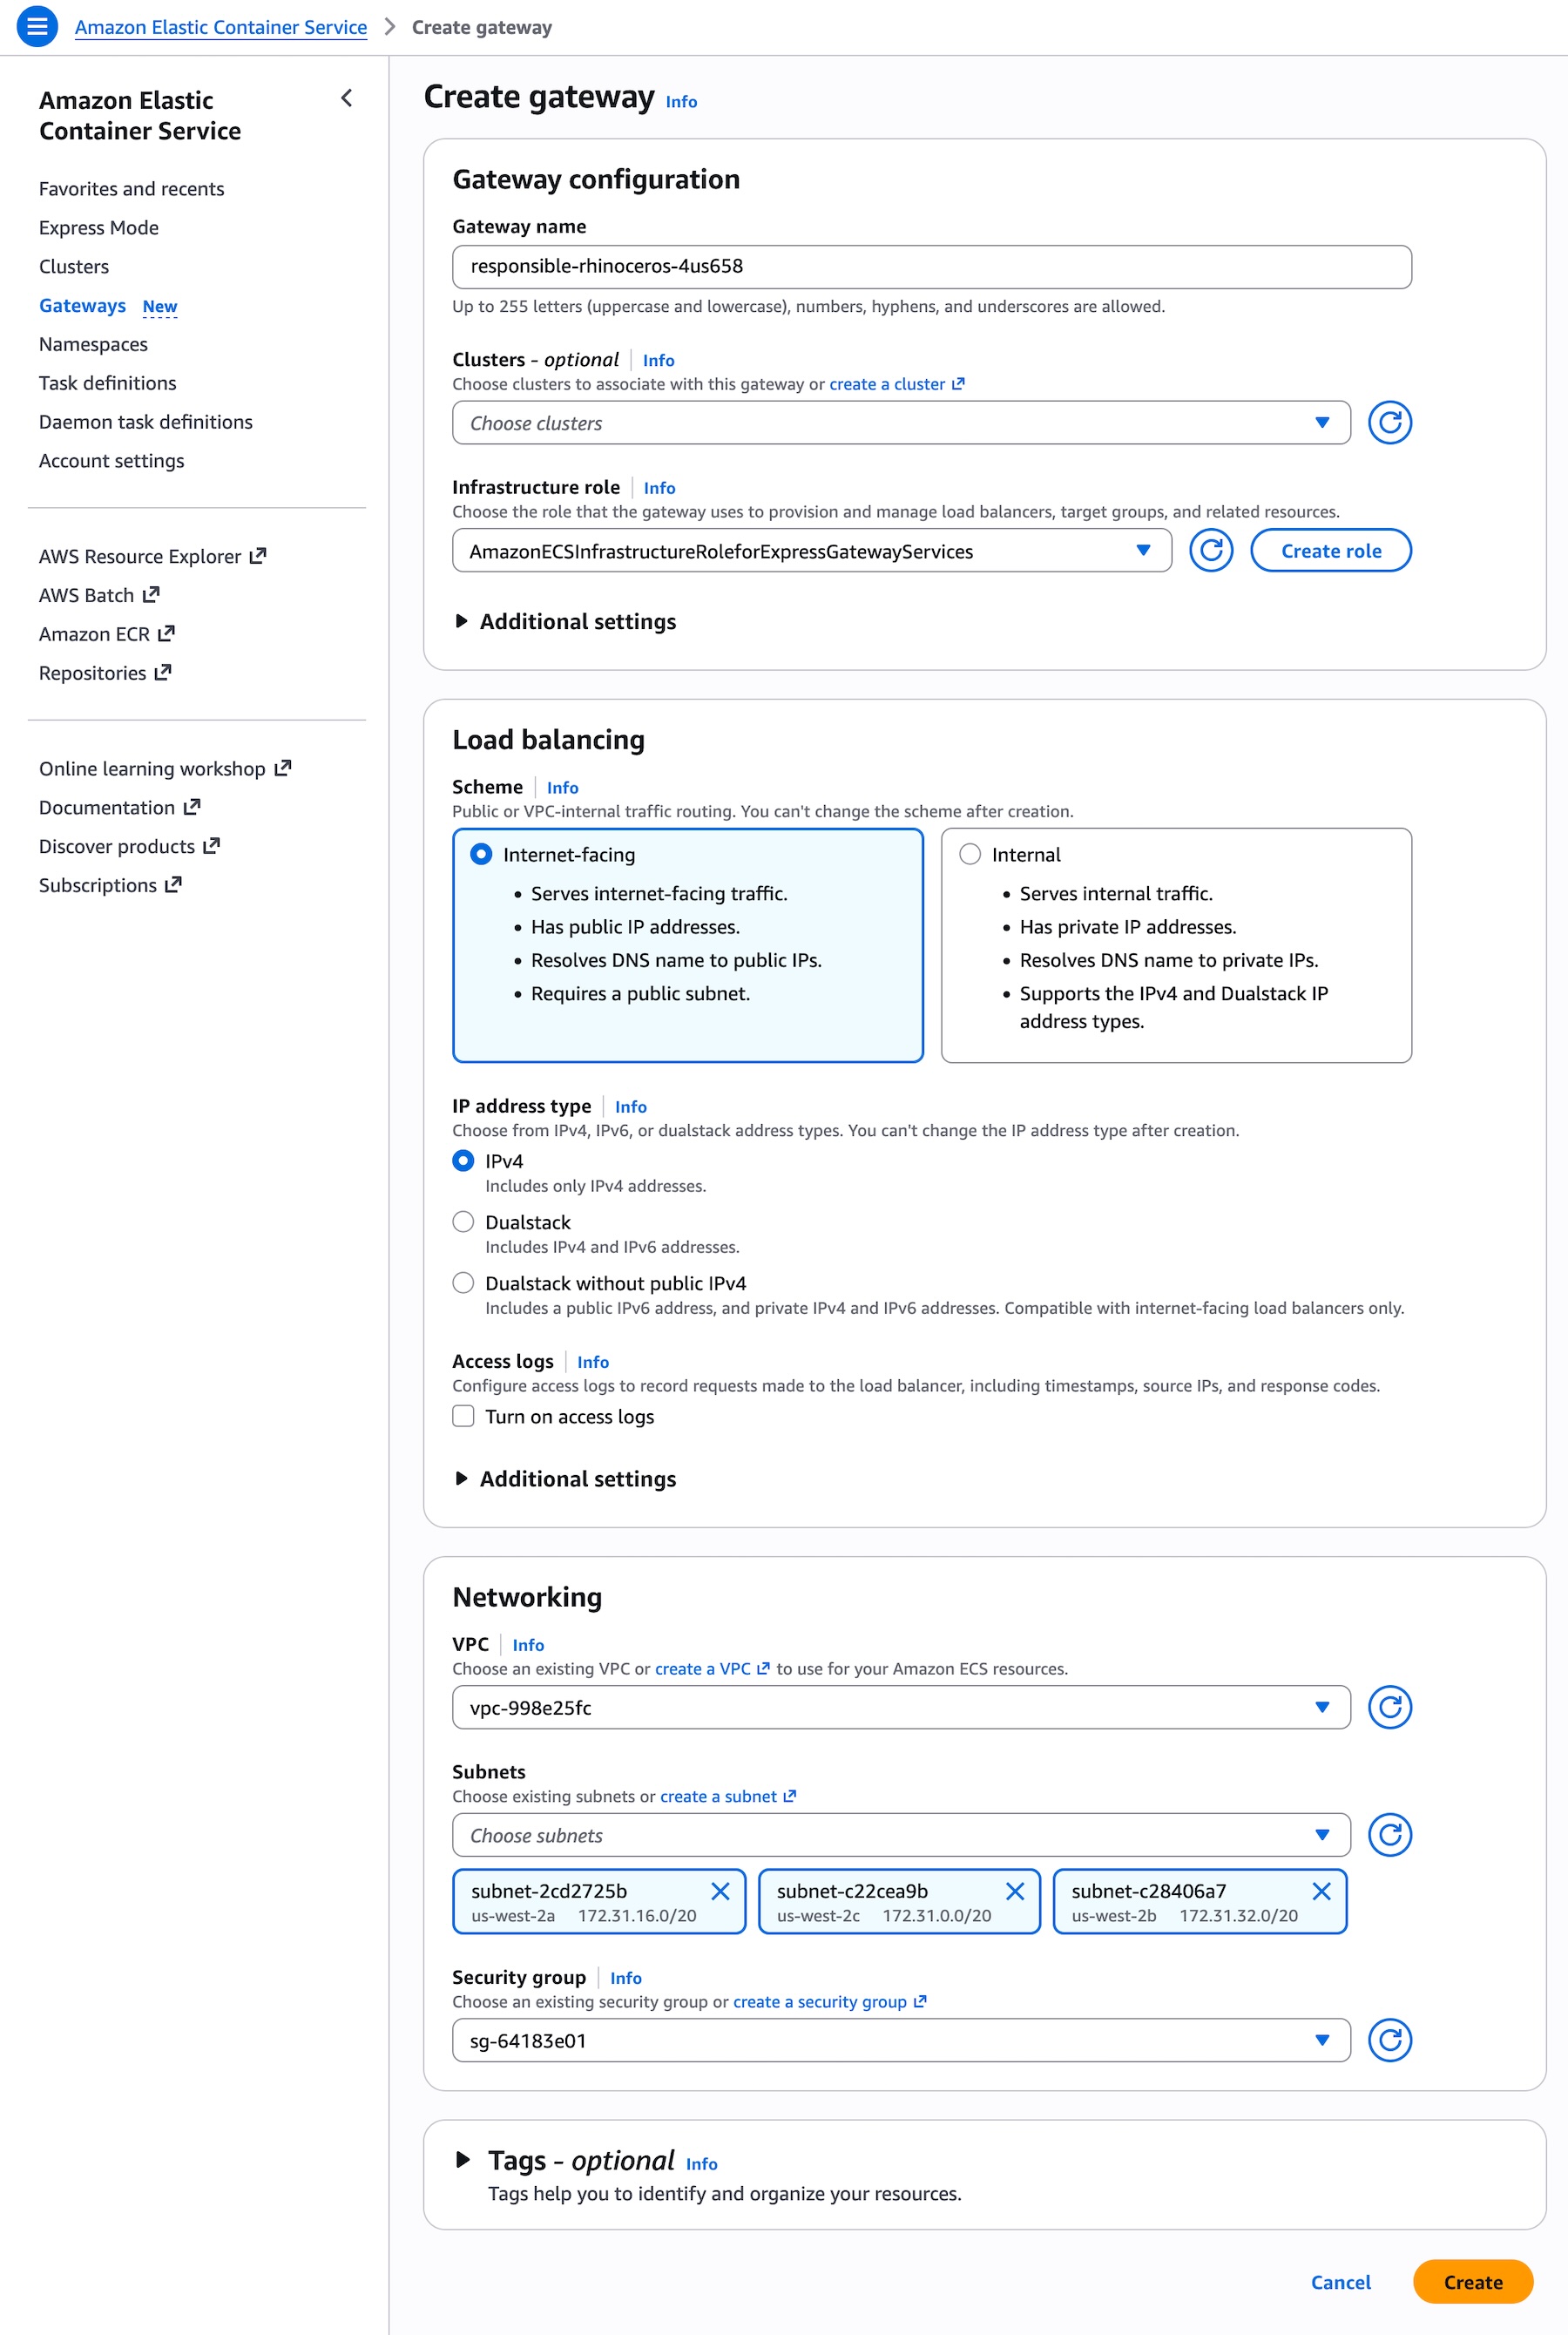
AWS Weekly Roundup: Welcome DuckLabs to the team, Agentic Resource Discovery (ARD), and more (August 31, 2026)

Post Syndicated from Daniel Abib original https://aws.amazon.com/blogs/aws/aws-weekly-roundup-welcome-ducklabs-to-the-team-agentic-resource-discovery-ard-and-more-august-31-2026/

The news that interested me the most last week was the DuckLabs acquisition. AWS has signed a definitive agreement to acquire DuckLabs, the Amsterdam-based company behind DuckDB, the popular open source analytical database that runs in-process and executes SQL directly against files like Parquet, CSV, and JSON. DuckDB stays open source under its independent foundation and the MIT license, and over time AWS plans to combine its speed at everyday queries with the enterprise scale of services like Amazon S3, Amazon Redshift, and Amazon Athena.

Co-founded by Hannes Mühleisen and Mark Raasveldt, DuckDB runs locally or on Amazon S3, which makes it remarkably fast for the everyday queries (a terabyte or less) that make up the bulk of real-world analytics. It also happens to pair beautifully with AI agents, which “poke” and experiment their way through data much like humans do. The co-founders will continue leading its technical direction while AWS combines DuckDB’s speed with analytics services like Amazon EMR, AWS Glue, and Amazon SageMaker. For the bigger picture on why this matters, Andy Warfield, Vice President and Distinguished Engineer shared his thoughts on the post DuckDB and the changing physics of analytics on All Things Distributed.

Now, let’s get into this week’s AWS news…

Last week’s launches
Here are some launches and updates from this past week that caught my attention:

  • Amazon ECS now automatically detects and recovers container instances that lose agent connectivity – Amazon ECS now continuously monitors agent connectivity to the control plane and surfaces a new AGENT_CONNECTIVITY health event across AWS Fargate, Amazon ECS Managed Instances, and Amazon ECS on EC2. On Fargate and Managed Instances, ECS handles recovery automatically, draining tasks, launching replacements, and deregistering the impaired instance. On EC2, you can wire the event into your own workflow. Available at no additional cost in all AWS Commercial and AWS GovCloud (US) Regions.
  • AWS Lambda introduces public preview runtimes, starting with Node.js 26 and Python 3.15 – You can now test upcoming Lambda runtimes before they reach general availability. Preview runtimes use the same identifier as the eventual GA version, so your functions graduate automatically with no action required. Third-party tools and deployment frameworks can also validate compatibility ahead of GA. Not meant for production yet (breaking changes are possible), but a great way to get ahead of your next upgrade. Available in all AWS commercial, AWS GovCloud (US), and China Regions.
  • AWS IoT Core adds a native InfluxDB rule action – You can now route time-series data from your IoT devices straight into InfluxDB (Amazon Timestream-managed or self-hosted) without writing custom code or standing up an intermediate service. IoT Core formats data into InfluxDB’s line protocol and supports device-side and server-side batching. Available in all AWS Regions where Amazon Timestream for InfluxDB is offered.
  • Amazon GameLift Servers now includes enhanced DDoS protection – Your game servers now get automatic protection against network and transport layer (layers 3 and 4) DDoS attacks – UDP reflection, SYN floods, and similar vectors – with nothing to enable or opt into. Built on top of AWS Shield Standard with gaming-optimized traffic shaping, it turns on the moment your servers start running (Server SDK 5) at no extra cost. It’s available in all supported GameLift Servers Regions except China (Beijing) and China (Ningxia).
  • Amazon SageMaker HyperPod expands support for Ray – You can now run Ray workloads on SageMaker HyperPod with built-in observability, resilient training, and accelerated inference. Create and manage Ray clusters from Amazon SageMaker Studio, attach JupyterLab or your local IDE so a multi-node cluster behaves like a local dev environment, and get auto-provisioned Grafana dashboards. Node auto recovery, hung job detection, and tiered checkpointing keep large training runs healthy, while Ray Serve adds a tiered KV cache for inference. Your existing open source Ray code runs unchanged. Available for HyperPod clusters orchestrated by Amazon EKS.

For a full list of AWS announcements, be sure to keep an eye on the What’s New with AWS page.

Other AWS news
Here are some additional posts and resources that you might find interesting:

  • Happy 20th birthday, Amazon EC2! – Amazon EC2 turns 20. Channy Yun looks back at how EC2 grew from a single m1.small instance type in one Region to more than 1,200 instance types across 39 Regions, along with the custom silicon journey from the first Graviton to Graviton5 and Trainium3. A fun and worthwhile read on the service that still underpins so much of AWS – including Amazon ECS, Amazon EKS, AWS Lambda, Amazon SageMaker, and Amazon Bedrock.
  • Agentic Resource Discovery (ARD): an open specification for agent discovery – As organizations scale up agents, tools, and MCP servers, those resources end up scattered across clouds, on-premises infrastructure, and SaaS platforms – each with its own registry and metadata. ARD is a new open specification (Apache 2.0) that defines a common way to describe and discover agentic resources, so publishers “describe once” and consumers “discover everywhere” – think DNS, but for agents. AWS contributed feedback but doesn’t own the spec, and it complements the AWS Agent Registry by letting you federate across catalogs without migrating.
  • Get started with the Agent Toolkit for AWS in the AWS CLI – A single AWS CLI command (aws configure agent-toolkit) now equips AI coding agents like Kiro, Claude Code, Codex, and Cursor with curated, up-to-date AWS knowledge and a secure connection to thousands of AWS APIs through the AWS MCP Server. If you build with an AI coding assistant, this helps it choose the right services, use modern APIs, and follow security best practices – so it gets AWS code right more often the first time.

Upcoming AWS events
Check your calendar and sign up for upcoming AWS events:

  • AWS Summits – Free in-person events where builders come together to learn, connect, and explore the latest in cloud and AI. Upcoming stops include Zurich (September 2), São Paulo (September 3), Tel Aviv (September 10), and Dubai (September 30). Can’t attend in person? You can stream sessions through the Global Livestream and On-Demand Hub. I’ll be presenting two sessions on generative AI and Amazon Bedrock at the São Paulo Summit – if you’re there, come say hello.
  • AWS Community Days – Community-led conferences where content is planned, sourced, and delivered by community leaders. Upcoming events include JAWS SONIC 2026 in Tokyo (September 5) and Warsaw, Poland (September 8).

Join the AWS Builder Center to connect with builders, share solutions, and access content that supports your development. Browse here for upcoming AWS-led in-person and virtual events and developer-focused events.

That’s all for this week. Check back next Monday for another Weekly Roundup!

— Daniel Abib
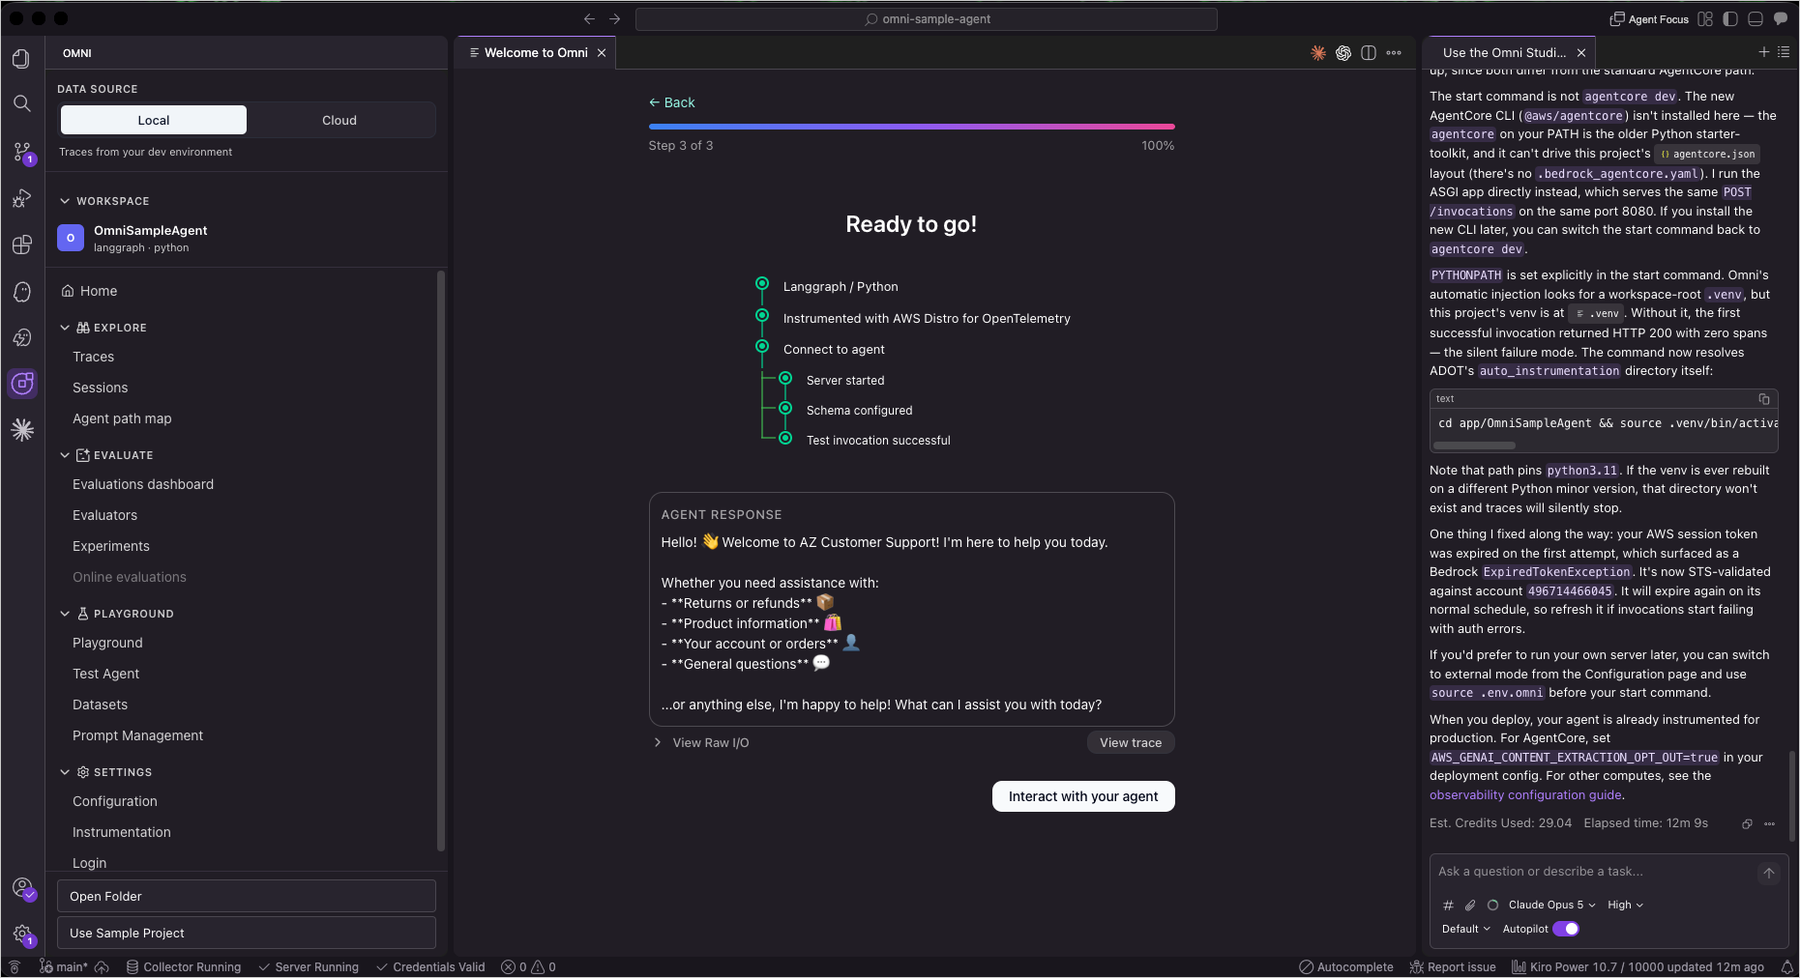
This post is part of our Weekly Roundup series. Check back each week for a quick roundup of interesting news and announcements from AWS!

NVIDIA Announces Jetson Orin Nano 2: Entry-Level Edge Board Gets New Ampere Silicon

Post Syndicated from Ryan Smith original https://www.servethehome.com/nvidia-announces-jetson-orin-nano-2-entry-level-edge-board-gets-new-ampere-silicon/

NVIDIA has announced a new entry-level edge AI board, the Jetson Orin Nano 2. The upgraded Nano is not only twice as fast as its predecessor, but unexpectedly, features an outright new Orin SoC at its heart

The post NVIDIA Announces Jetson Orin Nano 2: Entry-Level Edge Board Gets New Ampere Silicon appeared first on ServeTheHome.

Learn, Connect, and Level Up at Zabbix Summit 2026

Post Syndicated from Michael Kammer original https://blog.zabbix.com/learn-connect-and-level-up-at-zabbix-summit-2026/33415/

Let’s be honest. You could spend another October watching webinars at 1.5x speed while answering Slack messages, pretending you’ll “circle back” to that infrastructure project you’ve been meaning to automate since 2023.

Or you could spend two days in Riga at Zabbix Summit 2026, surrounded by hundreds of people who actually get excited about automation, integrations, observability, and that oddly satisfying moment when every dashboard is perfectly green.

If you do, you’ll be among the first to dive into Zabbix 8.0, discover the latest innovations in Zabbix Cloud, and see where the platform is headed next. The choice seems fairly obvious.

It’s not just another tech conference

Some conferences are basically just an expensive delivery service for company-branded merch. Zabbix Summit 2026 isn’t one of them. On October 8-9, 2026, the global Zabbix community returns to Riga for two days packed with technical talks, real-world case studies, product announcements, workshops, networking, and enough ideas to completely rewrite your observability roadmap (well, we can’t promise you’ll finish rewriting it, but you’ll definitely want to start).

This year’s Summit is especially exciting as it marks the arrival of Zabbix 8.0, our next major release, alongside the continued evolution of Zabbix Cloud. That makes it the best place to discover what’s new, what’s next, and how these innovations can simplify and strengthen your observability strategy.

Whether you’re keeping tabs on a handful of servers, an international enterprise, industrial infrastructure, or something delightfully weird, you’ll leave with practical techniques you can put to work.

Start the week at the Zabbix Open House

Before Zabbix Summit 2026 officially begins on October 7, you can drop by the Zabbix offices, meet the people building and supporting the platform you use every day, and get a glimpse of the team behind the technology. Grab a coffee in the kitchen, swap stories with fellow community members, and test your Zabbix knowledge with a fun quiz that might teach even the most seasoned Zabbix fans a few new facts.

It’s a relaxed way to kick off your Summit experience, put faces to names, and start the week surrounded by the people who make the Zabbix community what it is.

Come for Zabbix 8.0, stay because your notebook is full

Zabbix Summit 2026 features one of the biggest moments in recent Zabbix history – an in-depth look at Zabbix 8.0. You’ll hear directly from Zabbix Founder and CEO Alexei Vladishev about the next evolution of the platform, where observability is heading, what’s new under the hood, and how Zabbix continues to expand with solutions like Zabbix Cloud for organizations looking to deploy and scale faster. And that’s only the beginning.

Across the Main Track, Solutions Track, Dev Track, Community Track, and workshops, you’ll learn from engineers, architects, consultants, and customers who have solved problems you’ll probably encounter sooner or later. After all, why should you spend weeks reinventing solutions when someone else is willing to show you theirs?

Zabbix Marketplace – your shortcut to doing more with Zabbix

One of the best things about being part of the Zabbix ecosystem is that you don’t have to build everything from scratch. Zabbix Marketplace brings together a growing collection of integrations, templates, dashboards, and other ready-to-use resources that can help you extend your observability and get value from Zabbix faster.

Zabbix Summit 2026 is the perfect opportunity to go beyond simply downloading a template. Talk to the people behind integrations and community solutions, discover how others are using them in production, and pick up ideas for adapting them to your own environment. In other words, fewer “I’ll build that someday” projects, and more things you can actually try.

Zabbix in your pocket with the Zabbix Mobile app

Observability doesn’t stop being important just because you’ve stepped away from your desk. The Zabbix Mobile app makes it easier to stay connected to your monitoring environment when you’re on the move, whether you’re grabbing coffee between sessions, heading home after the Summit, or simply trying to avoid being permanently attached to your laptop.

It’s another example of how the Zabbix ecosystem is making monitoring accessible when and where you need it. And yes, that means you can leave the Summit with more than just new ideas – you can also take practical Zabbix capabilities with you wherever you go.

Real stories. Real environments. Real “Wait…you used Zabbix for what?”

The best Summit talks aren’t polished, rehearsed sales pitches. They’re stories from people who built something difficult, broke something important, fixed something impossible, and decided to tell everyone exactly how they did it.

Expect practical sessions covering automation, large-scale deployments, MSP environments, integrations, performance optimization, Zabbix Cloud deployments, and plenty of creative techniques that will have you quietly opening a new browser tab entitled “Things I Should Definitely Try.”

Workshops – because there’s a difference between reading documentation and actually doing the thing

If you’re the kind of person who learns by typing instead of watching, you’ll want to spend some time at the Summit workshops. Bring your laptop, break things, fix them, and ask questions. Leave with new skills instead of just good intentions. Workshops are included for Summit attendees and cover hands-on topics led by Zabbix experts, including new capabilities introduced in Zabbix 8.0.

Networking that doesn’t feel like networking

Nobody likes forced small talk over lukewarm coffee. Fortunately, that’s not really the Zabbix Summit vibe. Some of the best ideas at previous Summits started as conversations over coffee. Others probably started much later in the evening over other beverages.

This year’s three networking events (including the Welcome Event, Main Event, and Closing Event) will give you plenty of opportunities to meet the people whose blog posts you’ve bookmarked, whose templates you’ve borrowed (with gratitude), or whose infrastructure stories make yours seem almost reasonable.

And yes, Zabbix Summit 2026 is in Riga

If you’ve never been to Riga, you’re in for a treat. Historic architecture, fantastic food, a thriving tech scene, walkable streets, and (for one week in October) an unusually high concentration of people discussing triggers, proxies, APIs, template inheritance, and everything new in Zabbix 8.0 with genuine enthusiasm. It’s beautiful, it’s (slightly) nerdy, and it’s exactly where the Zabbix community belongs.

Bring your colleagues (they’ll thank you later)

Observability isn’t a one-person job. Bring your team, compare notes during sessions, divide and conquer the agenda, and return home with enough new ideas to keep everyone busy for months. There’s even a group discount for teams of three or more, making it considerably easier to convince your manager this is “a strategic investment in operational excellence.” Which, to be fair, it is!

See you in October!

Whether this is your first Summit or you’ve already collected enough Summit t-shirts to avoid doing laundry for a week, Zabbix Summit 2026 promises fresh ideas, new technology, inspiring people, a comprehensive look at Zabbix 8.0, and the latest developments in Zabbix Cloud. If you want to see where observability is heading, this is where the conversation starts.

So grab your ticket, book the trip, charge your laptop, and prepare to spend two days with people who understand why a perfectly configured dashboard is a thing of beauty.

Register here, and we’ll see you in Riga!


The post Learn, Connect, and Level Up at Zabbix Summit 2026 appeared first on Zabbix Blog.