Post Syndicated from Kevin Fallis original https://aws.amazon.com/blogs/big-data/introducing-the-next-generation-of-serverless-time-series-for-amazon-opensearch-service/
Today, we’re announcing support for time series collections on the next generation of Amazon OpenSearch Serverless. With time series collections, you can ingest, store, and analyze logs, metrics, traces, and event data without provisioning or managing clusters. Time series collections absorb ingest spikes automatically, keep recent data fast to query, and make months or years of history searchable at low cost, all in the same collection. Time series collections also bring alerting and anomaly detection to OpenSearch Serverless, so you can find and act on problems as they happen. With support for up to 100 TB of hot storage per collection, they’re built for high-scale observability workloads such as application monitoring, security analytics, and IoT telemetry.
Observability data is voluminous, and it surges sharply during events like bad deployments and outages, right when teams need answers fastest. An undersized cluster falls behind and delays the very logs engineers are waiting for, so teams size for the worst day and pay for that capacity every other day. Hot storage gets expensive as history grows, so teams cut retention or move older data to snapshots that someone must restore before running a query. Clusters also need constant tuning and capacity planning, which pulls engineers away from the investigations the data is meant to support. Every decision becomes a tradeoff between cost, retention, and how quickly you can answer questions about your systems.
Time series collections on OpenSearch Serverless remove that tradeoff. When an incident drives a surge in log volume, compute scales in seconds to keep up, so the logs engineers are waiting for arrive on time. When traffic settles, compute scales back down, all the way to zero, so you stop paying for worst-day capacity. Older data moves to a lower-cost warm tier and stays queryable, so you can keep years of history without cutting retention or restoring snapshots. There are no clusters to size or tune. You set compute limits and a few index settings, and the service handles the rest.
Pay less for the data you query less
Most queries against time series data target the last few hours or days, while older data is less frequently queried but still needs to be available. With the new index.warm.after setting, you decide how long data stays in the hot tier before it moves to the lower-cost warm tier. You can set it in days or hours, from a minimum of 1 day (24h or 1d) up to 10 years (3650d), and it can’t exceed the index’s retention period. If you don’t set it, data moves to warm after 1 day.
At ingest, each document is written to a low-latency hot tier and to Amazon Simple Storage Service (Amazon S3). As data reaches the age you set, oldest first, the hot copy is released and the data lives in the warm tier on Amazon S3. When a query needs warm data, the service loads that data back into the hot tier to serve it. The first query on that data takes longer, and later queries on the same data run at hot-tier latency. That suits investigations and reporting over older data, where the same time range is often queried repeatedly. When a query spans both tiers, results come back in a single response. You pay hot storage rates only for data in the hot tier.
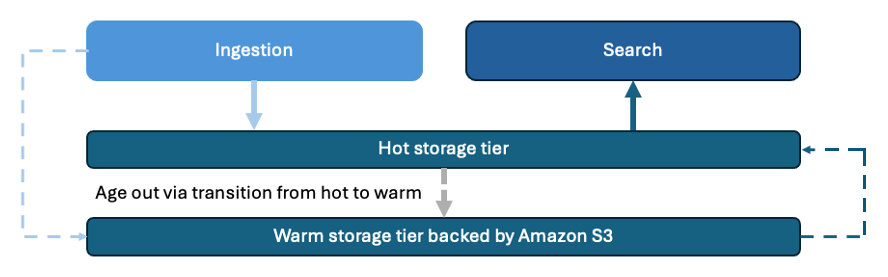
Figure 1: Data moves from the hot tier to the warm tier after 7 days, persisted to Amazon S3 throughout
Retain data for as long as your workload requires
Retention is set on the index itself, so there is no separate lifecycle policy to create or maintain. Set index.data.retention in an index template, and every index that matches the pattern inherits it. You can retain data for anywhere from 1 day to 3,650 days (10 years), specified as a whole number of days.
Tiering and retention are independent. Tiering controls query speed and cost, and retention controls when data is deleted. For example, you can keep application logs hot for 7 days and retain them for 30 days, or keep audit data in the warm tier for years to meet compliance requirements. When an audit comes up, you query that history in the same collection, and search compute scales up to handle the extra load. There is no snapshot restore and no forensic cluster to stand up.
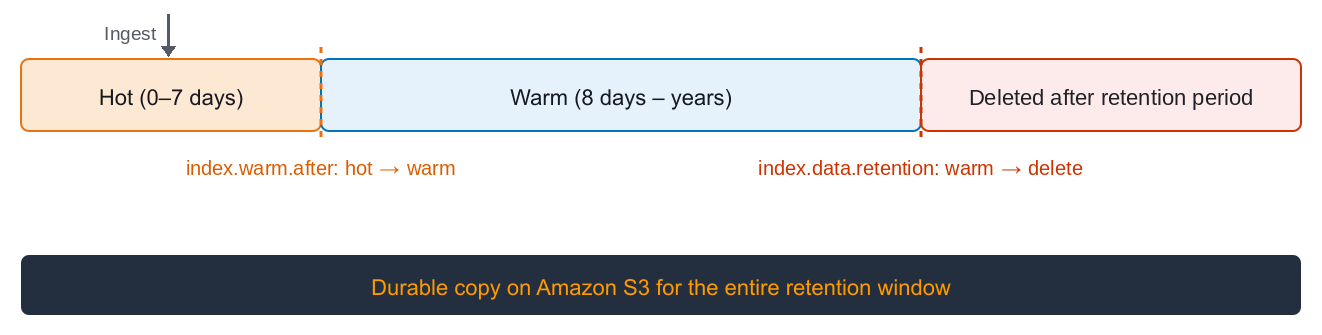
Figure 2: Data tiering and retention
Designate the event timestamp for each index
Every document in a time series collection must now include a timestamp field. Each index has one designated time field that the service uses to organize and sort your data, and documents with a missing, null, or invalid timestamp are rejected.
By default, the time field is @timestamp. If your events already carry a different field, such as event_time, set index.timestamp_field when you create the index or in an index template, so you don’t need to change your producers. The field must be a top-level date field, and a document’s timestamp can’t be changed after it is indexed.
Rejections apply to individual documents, not whole requests. In a _bulk request, the valid documents are indexed and the rejected ones are listed in the errors block of the response, so one bad record doesn’t fail the batch.
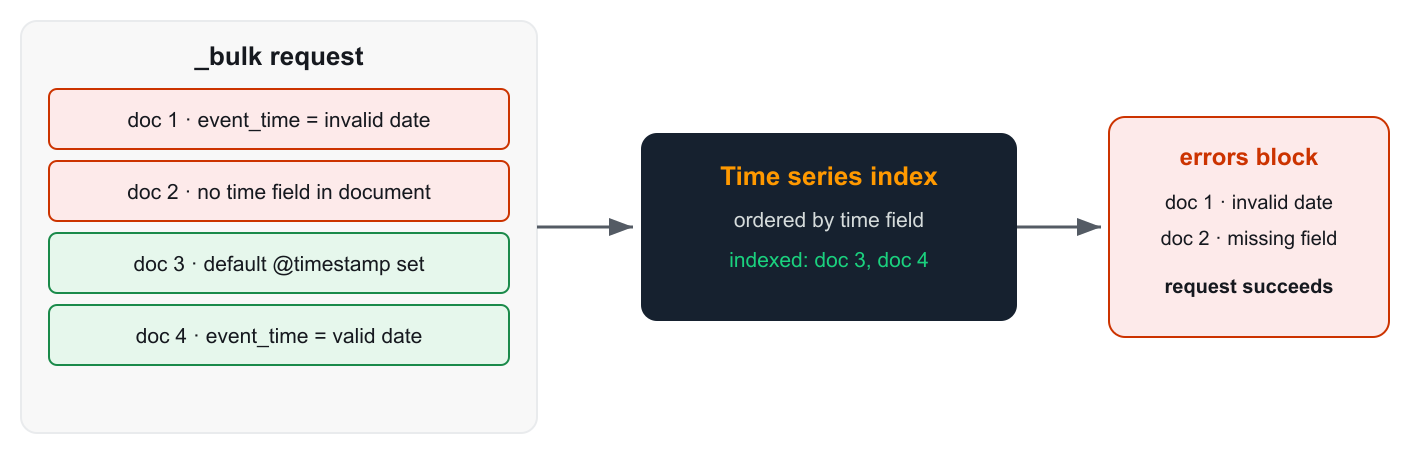
Figure 3: How the time field determines whether each document is indexed or rejected
Catch problems before they become outages
Time series collections now support alerting and anomaly detection, which Classic serverless collections didn’t offer. Instead of relying on a separate system to tell you when something breaks, you can monitor, detect, and notify from the collection that stores your data. Now, operations teams can get notified when error rates or latency spike, security teams can catch a burst of failed logins, and business teams can spot a sudden drop in orders.
Alerting monitors query your data on a schedule and notify you through the channel you choose when a condition is met. Per-query monitors alert on a single value, such as average latency crossing a threshold. Per-bucket monitors evaluate each group separately, such as every host whose error rate climbs too high. PPL monitors handle more complex logic in Piped Processing Language (PPL).
Anomaly detection uses the Random Cut Forest (RCF) machine learning algorithm to learn your data’s normal pattern and flag deviations in near real time, with no fixed thresholds to guess. Point a monitor at the detector’s results to get notified the moment an anomaly appears.
You manage monitors and detectors in OpenSearch UI workspaces, where access follows the workspace’s collaborator permissions. Read-only collaborators can view monitors and alerts, while read/write and admin collaborators can also create, update, and acknowledge them. The Observability workspace puts alerts alongside dashboards and PPL queries, so your team can go from an alert to the events behind it, across serverless collections and existing Amazon OpenSearch Service domains.
Getting started
For a single-click experience, use Express Create in the Amazon OpenSearch Service console. It sets up the collection group, encryption, network access, and data access for you. To control each step yourself, use the AWS Command Line Interface (AWS CLI) as shown in the following steps.
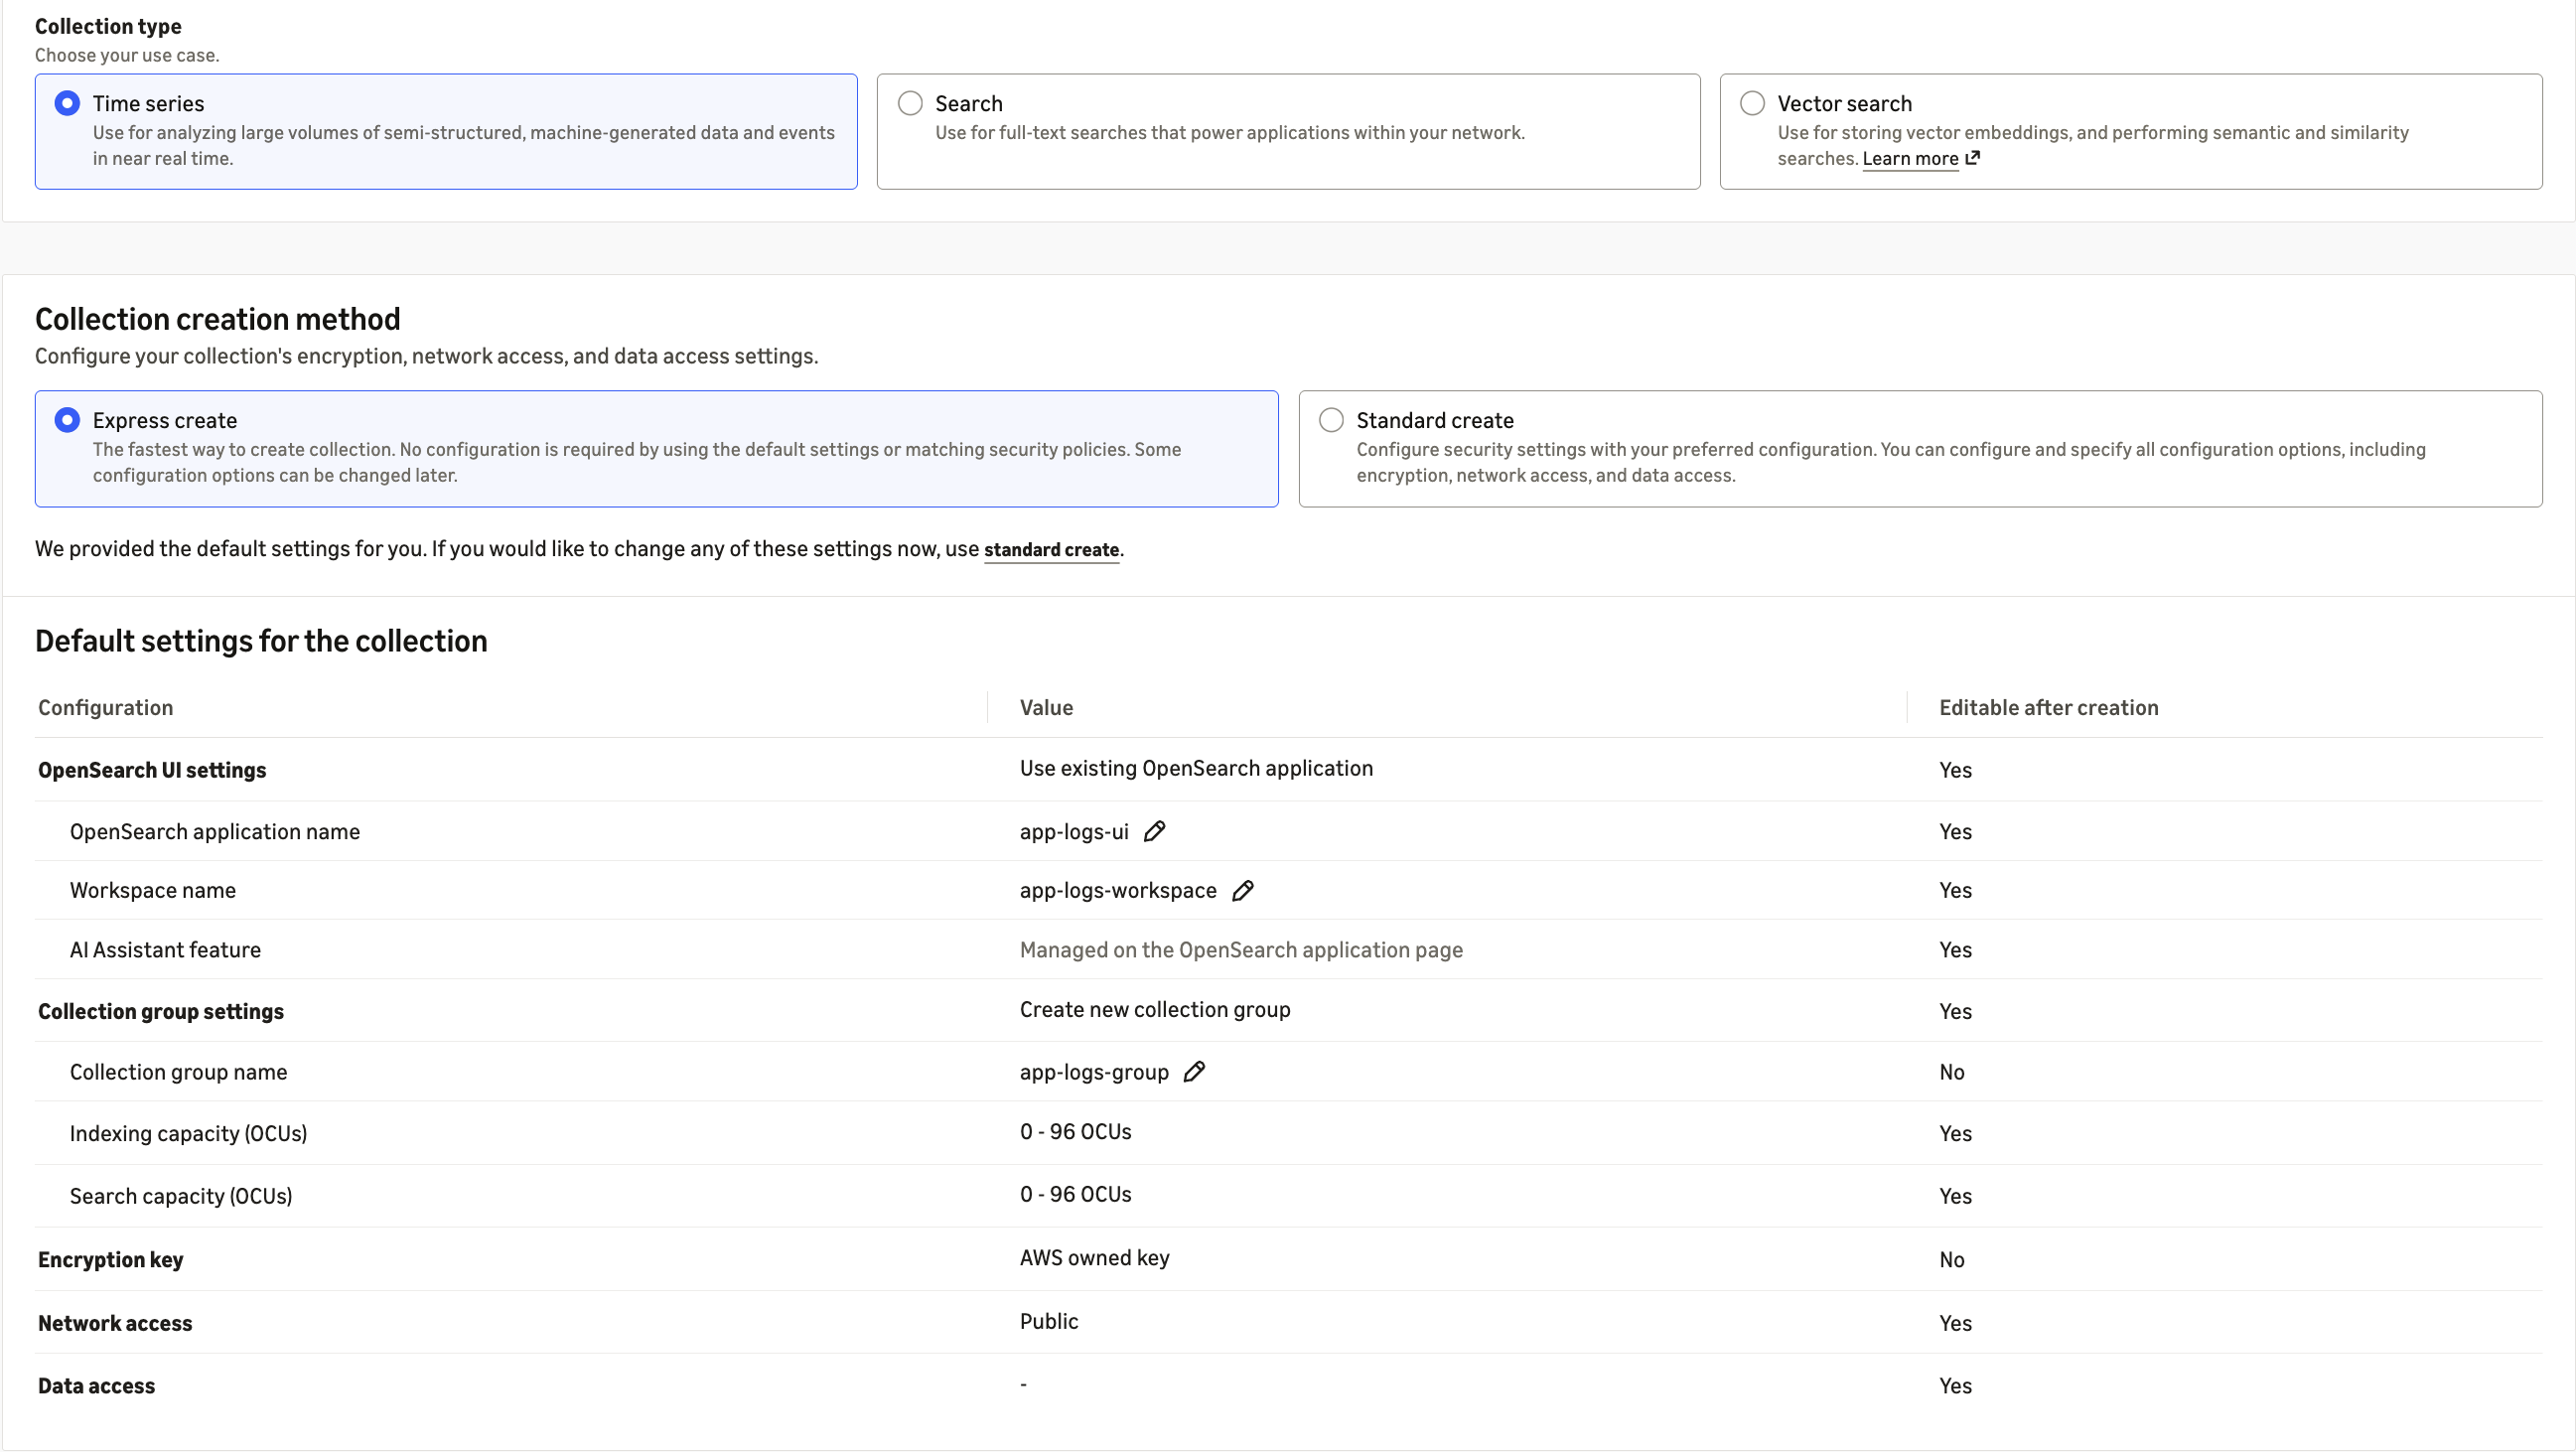
Figure 4: Express Create sets up the collection group, encryption, and network access with default settings
First, create a next-generation collection group. The collection group sets the compute limits that all of its collections share. A minimum of 0 OpenSearch Compute Units (OCUs) lets the group scale to zero when it’s idle, and the maximum caps your spend.
Next, create a network policy to control where the collection can be reached from, and a data access policy to control which AWS Identity and Access Management (IAM) principals can read and write data.
Then create the time series collection in the collection group:
After the collection is active, create an index template with the time field, tiering, and retention settings that fit your workload. Every index whose name matches the pattern picks up these settings automatically:
Finally, ingest your data into the collection, then open the Observability workspace in OpenSearch UI to build your first dashboards, monitors, and anomaly detectors.
Now available
Time series collections are available today in all AWS commercial Regions where the next generation of OpenSearch Serverless is available. You pay for the compute you use in OCUs, and for hot and warm storage in GB-month. For pricing details, visit the Amazon OpenSearch Service pricing page.
To learn more, visit the Amazon OpenSearch Serverless product page and the Amazon OpenSearch Serverless Developer Guide.
Give it a try in the Amazon OpenSearch Service console, and send feedback through AWS re:Post or your usual AWS Support contacts.