Post Syndicated from Akash Gupta original https://aws.amazon.com/blogs/big-data/detecting-fraud-patterns-across-snowflake-and-aws-using-sagemaker-data-agent/
Financial services organizations increasingly run analytical workloads across multiple systems. For example, customers typically store transaction records in Snowflake for its concurrency handling during peak volumes, while they store risk scores, customer profiles, and behavioral signals on AWS. To bridge that divide, practitioners have had to stitch together manual exports, custom extract, transform, and load (ETL) code, and external business intelligence (BI) tools to query both sources, cache expensive aggregations, and visualize results.
Amazon SageMaker Data Agent now closes these gaps with three new capabilities in Amazon SageMaker Unified Studio notebooks: SQL analytics on Snowflake data sources, materialized view management, and interactive charting. Practitioners can use them together to query Snowflake alongside AWS data, pre-compute and schedule repeated aggregations, and create interactive visualizations from natural language prompts in a single notebook, without writing boilerplate code or switching tools.
In this post, we describe the challenges these capabilities address, introduce each one, and walk through a fraud analytics scenario that demonstrates them working together in an end-to-end investigation workflow.
Challenges with fraud detection
Fraud analytics teams working in SageMaker Unified Studio notebooks encounter several recurring friction points that slow their path from alert to insight:
- Querying across AWS and third-party warehouses. Customers store transaction data in Snowflake and maintain risk scores and customer profiles on AWS. SageMaker Data Agent supported SQL generation for AWS-native engines: Amazon Athena, Amazon Redshift, Apache Spark, and DuckDB. However, it didn’t yet generate Snowflake-dialect SQL. This created a gap for customers working with data distributed across both AWS services and Snowflake. Analysts had to write Snowflake SQL manually and export results as CSV files to join with AWS data. The process consumed 1–2 hours before any actual investigation could begin.
- Rich visualization requires coding expertise. When analysts want to plot query results, they must write Python code using packages like matplotlib, seaborn, or plotly. They must choose the right chart type, format axes, handle data transformations, and debug rendering issues. For fraud teams whose expertise is in investigation rather than data visualization code, each chart becomes a detour: either learn the package interface, ask an engineer for help, or export to an external BI tool. This slows the exploratory cycle that fraud investigations depend on, where every new angle (time-of-day patterns, category breakdowns, geographic clusters) ideally takes seconds, not minutes of code iteration.
- Expensive repeated queries with no caching. Fraud signal queries flag transactions that exceed a customer’s historical average and compute risk-score distributions by merchant category. These queries re-scan entire tables on each execution. A team running the same aggregation every morning over millions of rows pays the full compute cost each time, with no mechanism to pre-compute results or schedule automatic refreshes. For fraud teams, this means investigations start with a 30-minute wait for queries that ran identically yesterday.
These three friction points (accessing data across platforms, visualizing it interactively, and operationalizing repeated analyses) are what the new Data Agent capabilities address together.
What’s new in Data Agent
Snowflake connectivity
SageMaker Data Agent can now connect to Snowflake data warehouses through connections registered in Amazon SageMaker Unified Studio. The agent discovers available Snowflake databases, browses schemas progressively (databases → schemas → tables → columns), and generates Snowflake-dialect SQL, including Snowflake-specific syntax like FLATTEN, VARIANT column access, and semi-structured data handling. Analysts query Snowflake tables alongside AWS data sources from a single notebook conversation, and the agent handles dialect differences automatically: Snowflake SQL for extraction, Spark SQL for Amazon Simple Storage Service (Amazon S3) Tables operations, with no manual translation required.
Materialized view management
Data Agent now creates and manages materialized views through natural language prompts. Analysts describe the aggregation they want, for example, “create a materialized view that flags transactions where risk_score is above 0.7, refreshed every 6 hours,” and the agent generates the Spark SQL DDL, including SCHEDULE REFRESH syntax. Materialized views store pre-computed results in Apache Iceberg format for fast repeated access, turning expensive full-table scans into sub-second queries. Supported operations include create, refresh, drop, describe, and scheduled refresh. When asked, Data Agent can also analyze notebook query patterns and recommend which queries would benefit from materialization.
Interactive charting
Instead of generating matplotlib code that produces static images, Data Agent now creates native interactive chart cells powered by Vega-Lite. Supported chart types include bar, line, scatter, pie, area, heatmap, and more. Charts render inline in the notebook with hover tooltips, zoom, and filtering. Analysts can reconfigure them through the sidebar or by typing inline instructions like “change this to a heatmap showing volume by hour and category.” This removes the cycle of modifying Python plotting code or exporting to an external BI tool every time the analysis needs a different view.
Detecting fraud patterns across Snowflake and AWS: a walkthrough
Solution overview
In this section, we walk through how these three capabilities work together in a realistic fraud investigation. A fraud analytics lead at a mid-size fintech processes a high volume of card transactions daily. Customers store transaction data in Snowflake and maintain customer risk profiles on AWS.
This morning, the real-time alerting system flagged an unusual spike in declined transactions from a cluster of new accounts, all purchasing high-value electronics. The analyst suspects a fraud ring using synthetic identities, fabricated customer profiles that pass initial verification but share telltale patterns like similar device fingerprints or overlapping IP ranges. The analyst has three goals:
- Confirm the fraud ring hypothesis. Determine whether the flagged accounts share device fingerprints, IP ranges, or behavioral patterns indicating coordinated fraud.
- Quantify the exposure. Calculate total fraudulent transaction volume and identify all affected accounts, not only the ones that triggered today’s alert.
- Set up ongoing monitoring. Create a reusable, auto-refreshing query so the team catches the next ring faster.
The analyst wants to do all of this without leaving the SageMaker notebook, without writing boilerplate data-engineering code, and within a single morning standup cycle so the investigations team can be briefed by noon.
How Data Agent approaches this analysis
Data Agent is context-aware. It discovers your actual table names, column schemas, and data source connections through Amazon SageMaker Unified Studio rather than requiring you to specify them manually. It generates SQL in the correct dialect for each source (Snowflake SQL for Snowflake, Spark SQL for S3 Tables) and operates within your existing AWS Identity and Access Management (IAM) permissions boundaries.
You interact with Data Agent in two modes: the Agent Panel for multi-step investigations like the example walkthrough that follows, where each prompt builds on previous context, and inline interactions for quick adjustments like “change this to a heatmap” directly on a chart cell.
Prerequisites
Before starting this walkthrough, verify that you have:
- An Amazon SageMaker Unified Studio domain with a project configured.
- A Snowflake account with a warehouse and
USAGEgrants on the database and schemas you want to query. - A Snowflake connection registered in your SageMaker Unified Studio project.
- An S3 Tables catalog in your project containing customer data (or equivalent AWS-hosted tables for joining with Snowflake data).
- A notebook open in SageMaker Unified Studio with Data Agent available in the chat panel.
Step 1: Explore Snowflake transaction data
What the analyst wants: Before investigating the fraud ring, the analyst must understand what data is available in Snowflake and verify recent transactions are accessible. The schema isn’t memorized (the payments team manages these tables), so Data Agent needs to discover the structure.
In the SageMaker notebook Agent Panel, the analyst types:
“Show me a preview of transactions over $500 for the last 24 hours. I’m looking for repeated high-value purchases that might indicate synthetic identity fraud.”
What Data Agent does for you: Data Agent discovers the Snowflake connection through SageMaker Unified Studio, browses the available databases, and locates PAYMENTS_DB → CARD_TRANSACTIONS schema → transactions table. It surfaces the column structure (transaction_id, customer_id, amount, merchant_category, transaction_timestamp, device_fingerprint, ip_address) so the analyst can confirm the right data is available without writing a single DESCRIBE TABLE statement.
Data Agent then generates a Snowflake-dialect SQL query to preview the last 24 hours of high-value transactions (amount > $500), returning hundreds of results. The preview immediately reveals what was suspected: alongside legitimate high-value purchases (mortgage payments, business supplies), there are clusters of electronics purchases at similar price points from different customer_id values but the same device_fingerprint, a classic synthetic identity pattern.
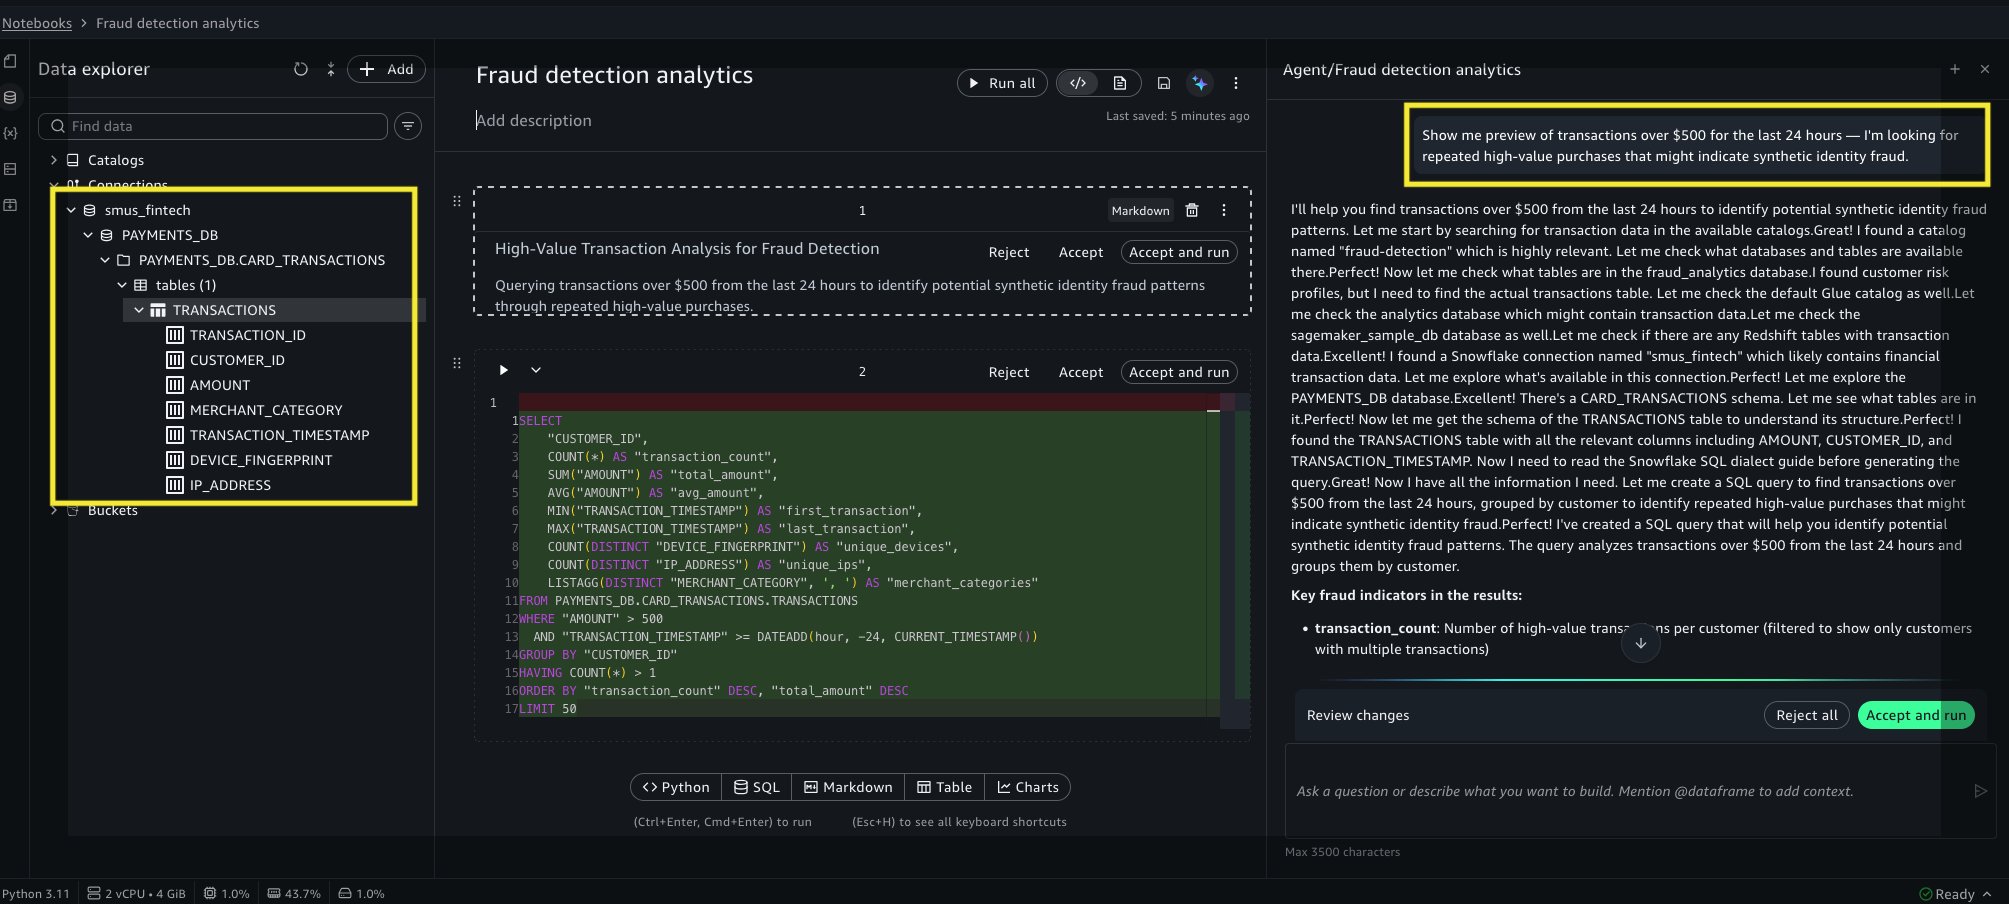
Figure 1: Data Agent querying Snowflake transaction data and generating equivalent code in the cell.
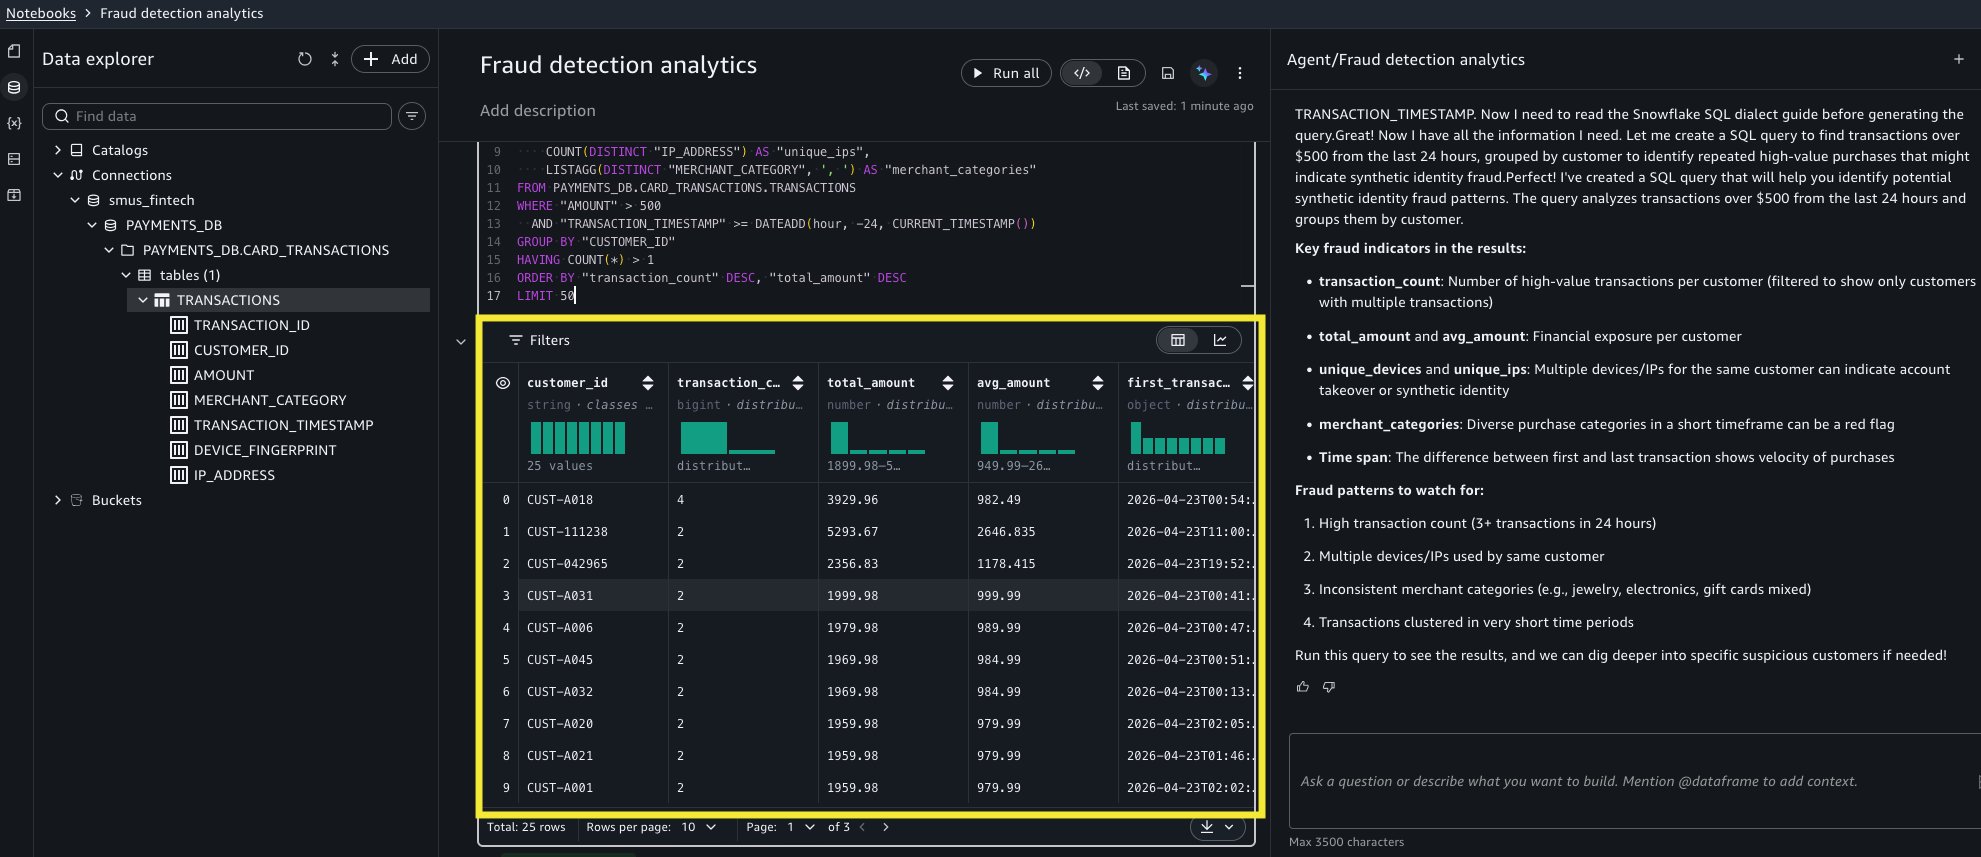
Figure 2: Displaying results when the notebook cell runs.
Step 2: Land Snowflake data into S3 Tables and join with risk profiles
What the analyst wants: Pulling historical high-value transactions into S3 Tables makes this data available for downstream analysis, including the materialized view that will cross-reference risk profiles automatically.
“Load the last 90 days of transactions where amount is greater than 500 into S3 Tables.”
What Data Agent does for you: Data Agent queries Snowflake to extract a large volume of high-value transactions from the last 90 days, converts the result to a PySpark DataFrame, creates an Apache Iceberg table at payments.fraud_analytics.high_value_transactions, and writes all the rows. Data Agent stores the transaction data (transaction_id, customer_id, amount, merchant_category, transaction_timestamp, device_fingerprint, ip_address) as Iceberg in S3 Tables, allowing you to query it entirely on AWS.
Data Agent handles the cross-source complexity: Snowflake-dialect SQL for extraction, automatic schema inference for the Iceberg table, and PySpark for the write. The analyst didn’t write a single line of ETL code.
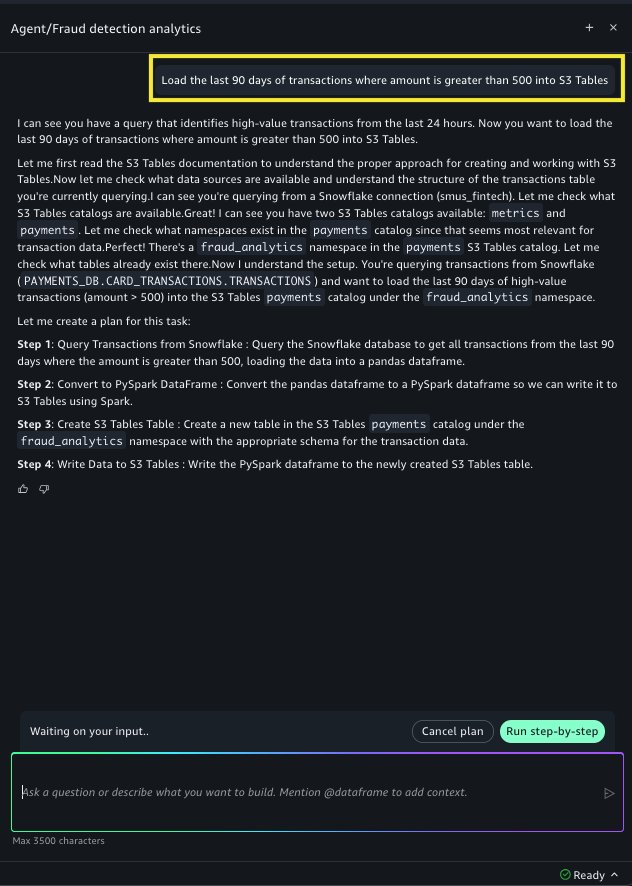
Figure 3: Sending a prompt to land Snowflake transactions into an S3 Tables catalog.
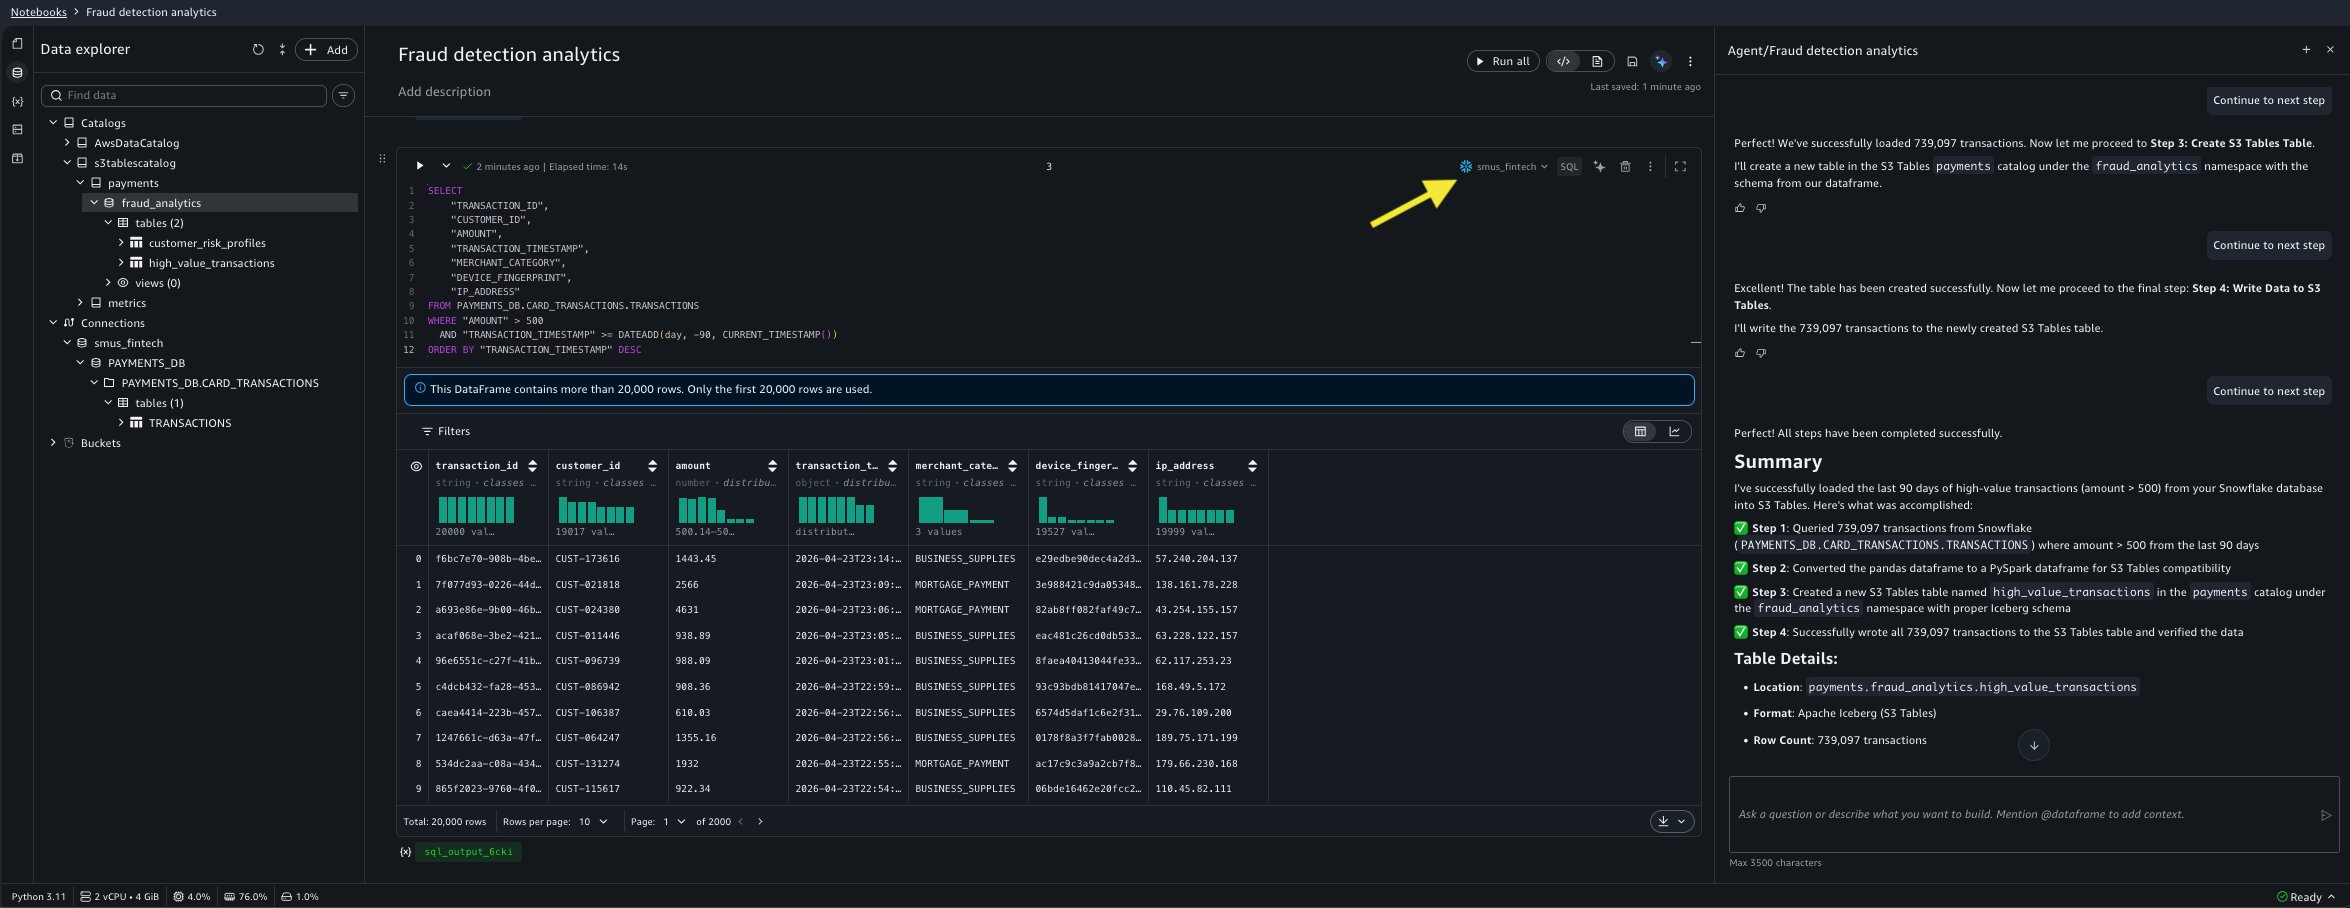
Figure 4: Reading data from Snowflake using code Data Agent generated.
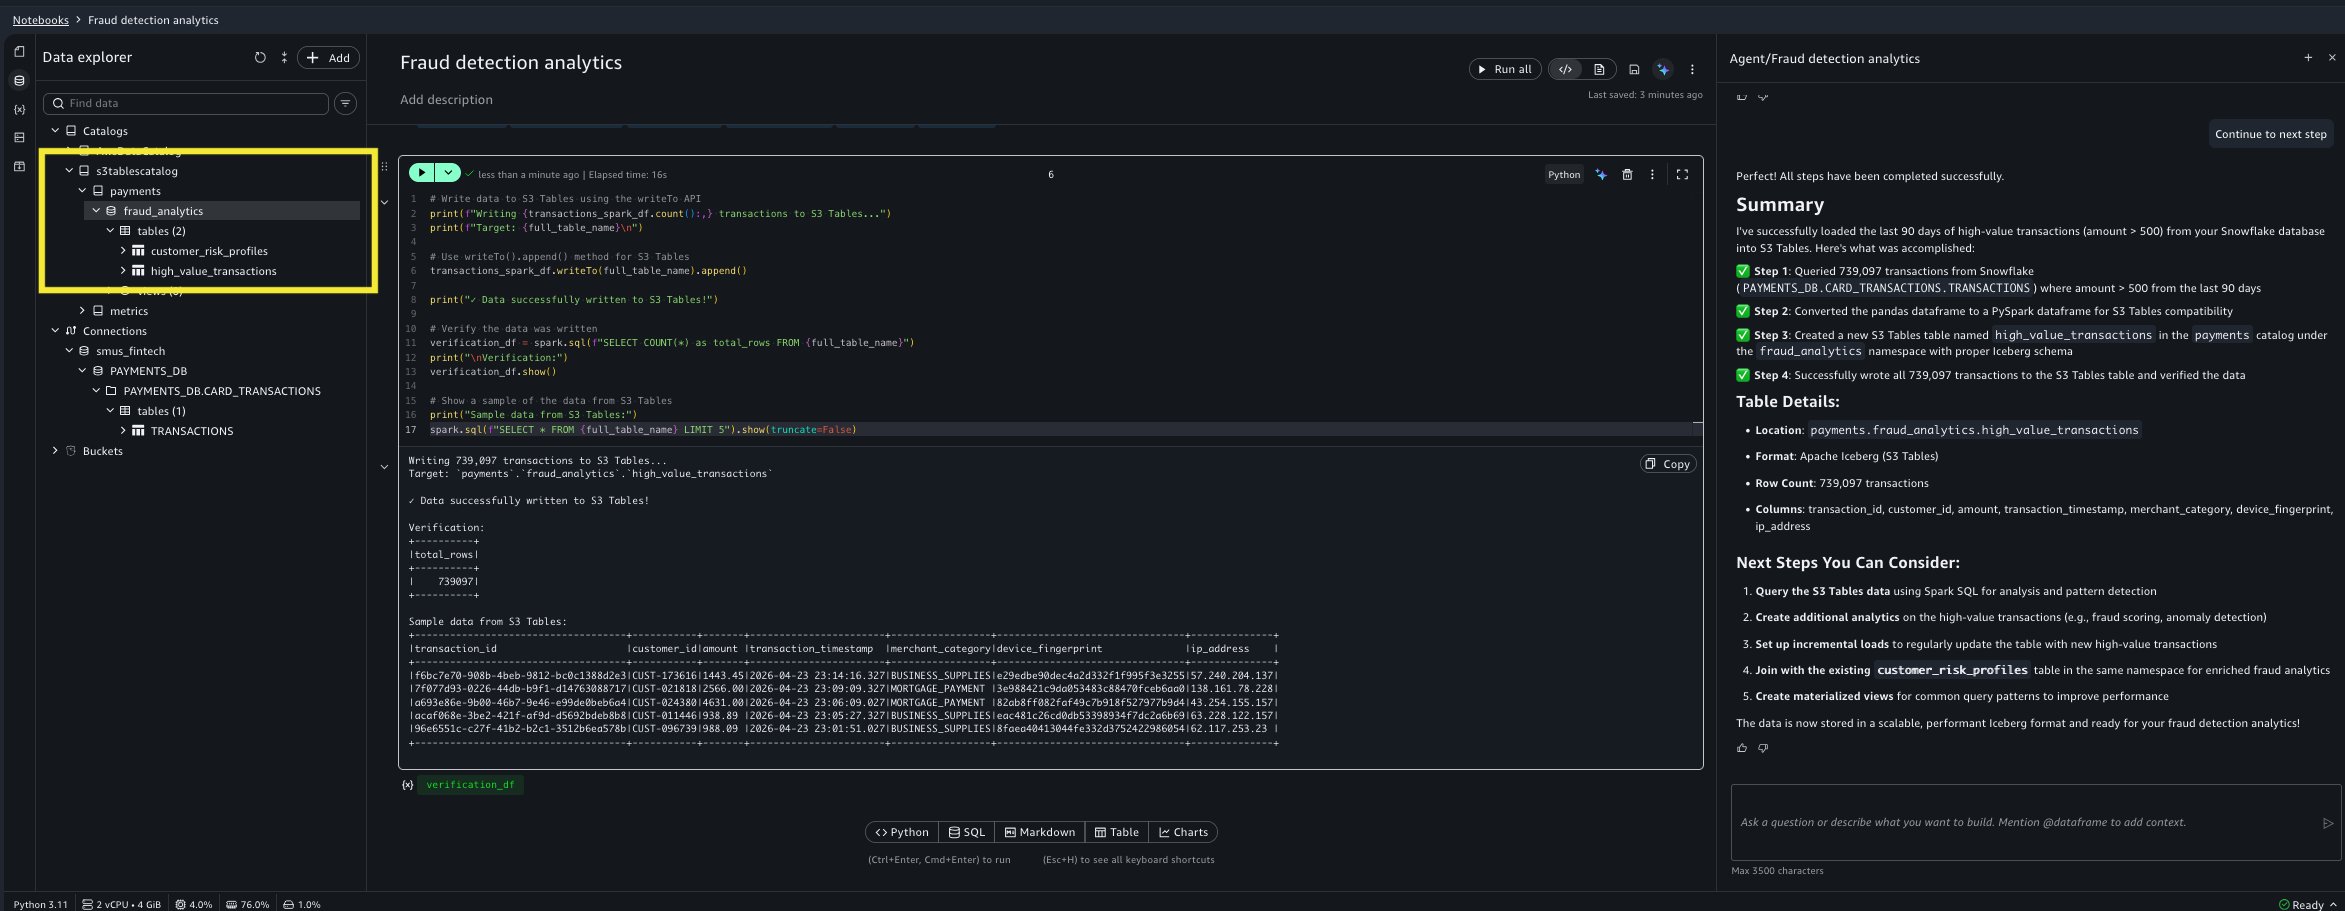
Figure 5: Data Agent creating a new cell to create an S3 Tables Iceberg table and populate it with the Snowflake data.
Step 3: Create a materialized view for ongoing fraud monitoring
What the analyst wants: The pattern is confirmed, but re-running this expensive join across two tables every morning isn’t sustainable. A pre-computed view that automatically refreshes and surfaces transactions from high-risk customers means tomorrow’s investigation starts with answers instead of queries (goal #3, ongoing monitoring).
“Create a materialized view called mv_fraud_signals that joins high_value_transactions with customer_risk_profiles, flagging transactions where risk_score is above 0.7. Refresh it every 6 hours.”
What Data Agent does for you: Data Agent browses the S3 Tables catalog to discover both tables and their schemas, generates the Spark SQL DDL with SCHEDULE REFRESH EVERY 6 HOURS, and creates an INNER JOIN on customer_id with a risk_score > 0.7 filter. The resulting materialized view contains only the high-risk subset of transactions, and subsequent queries against it return significantly faster compared to a full table scan.
Data Agent can also recommend materialized views when asked. If the analyst prompts “analyze my notebook and suggest which queries would benefit from materialized views,” Data Agent examines query patterns and suggests candidates. This is useful when a team runs the same expensive aggregations repeatedly without realizing a materialized view would help.
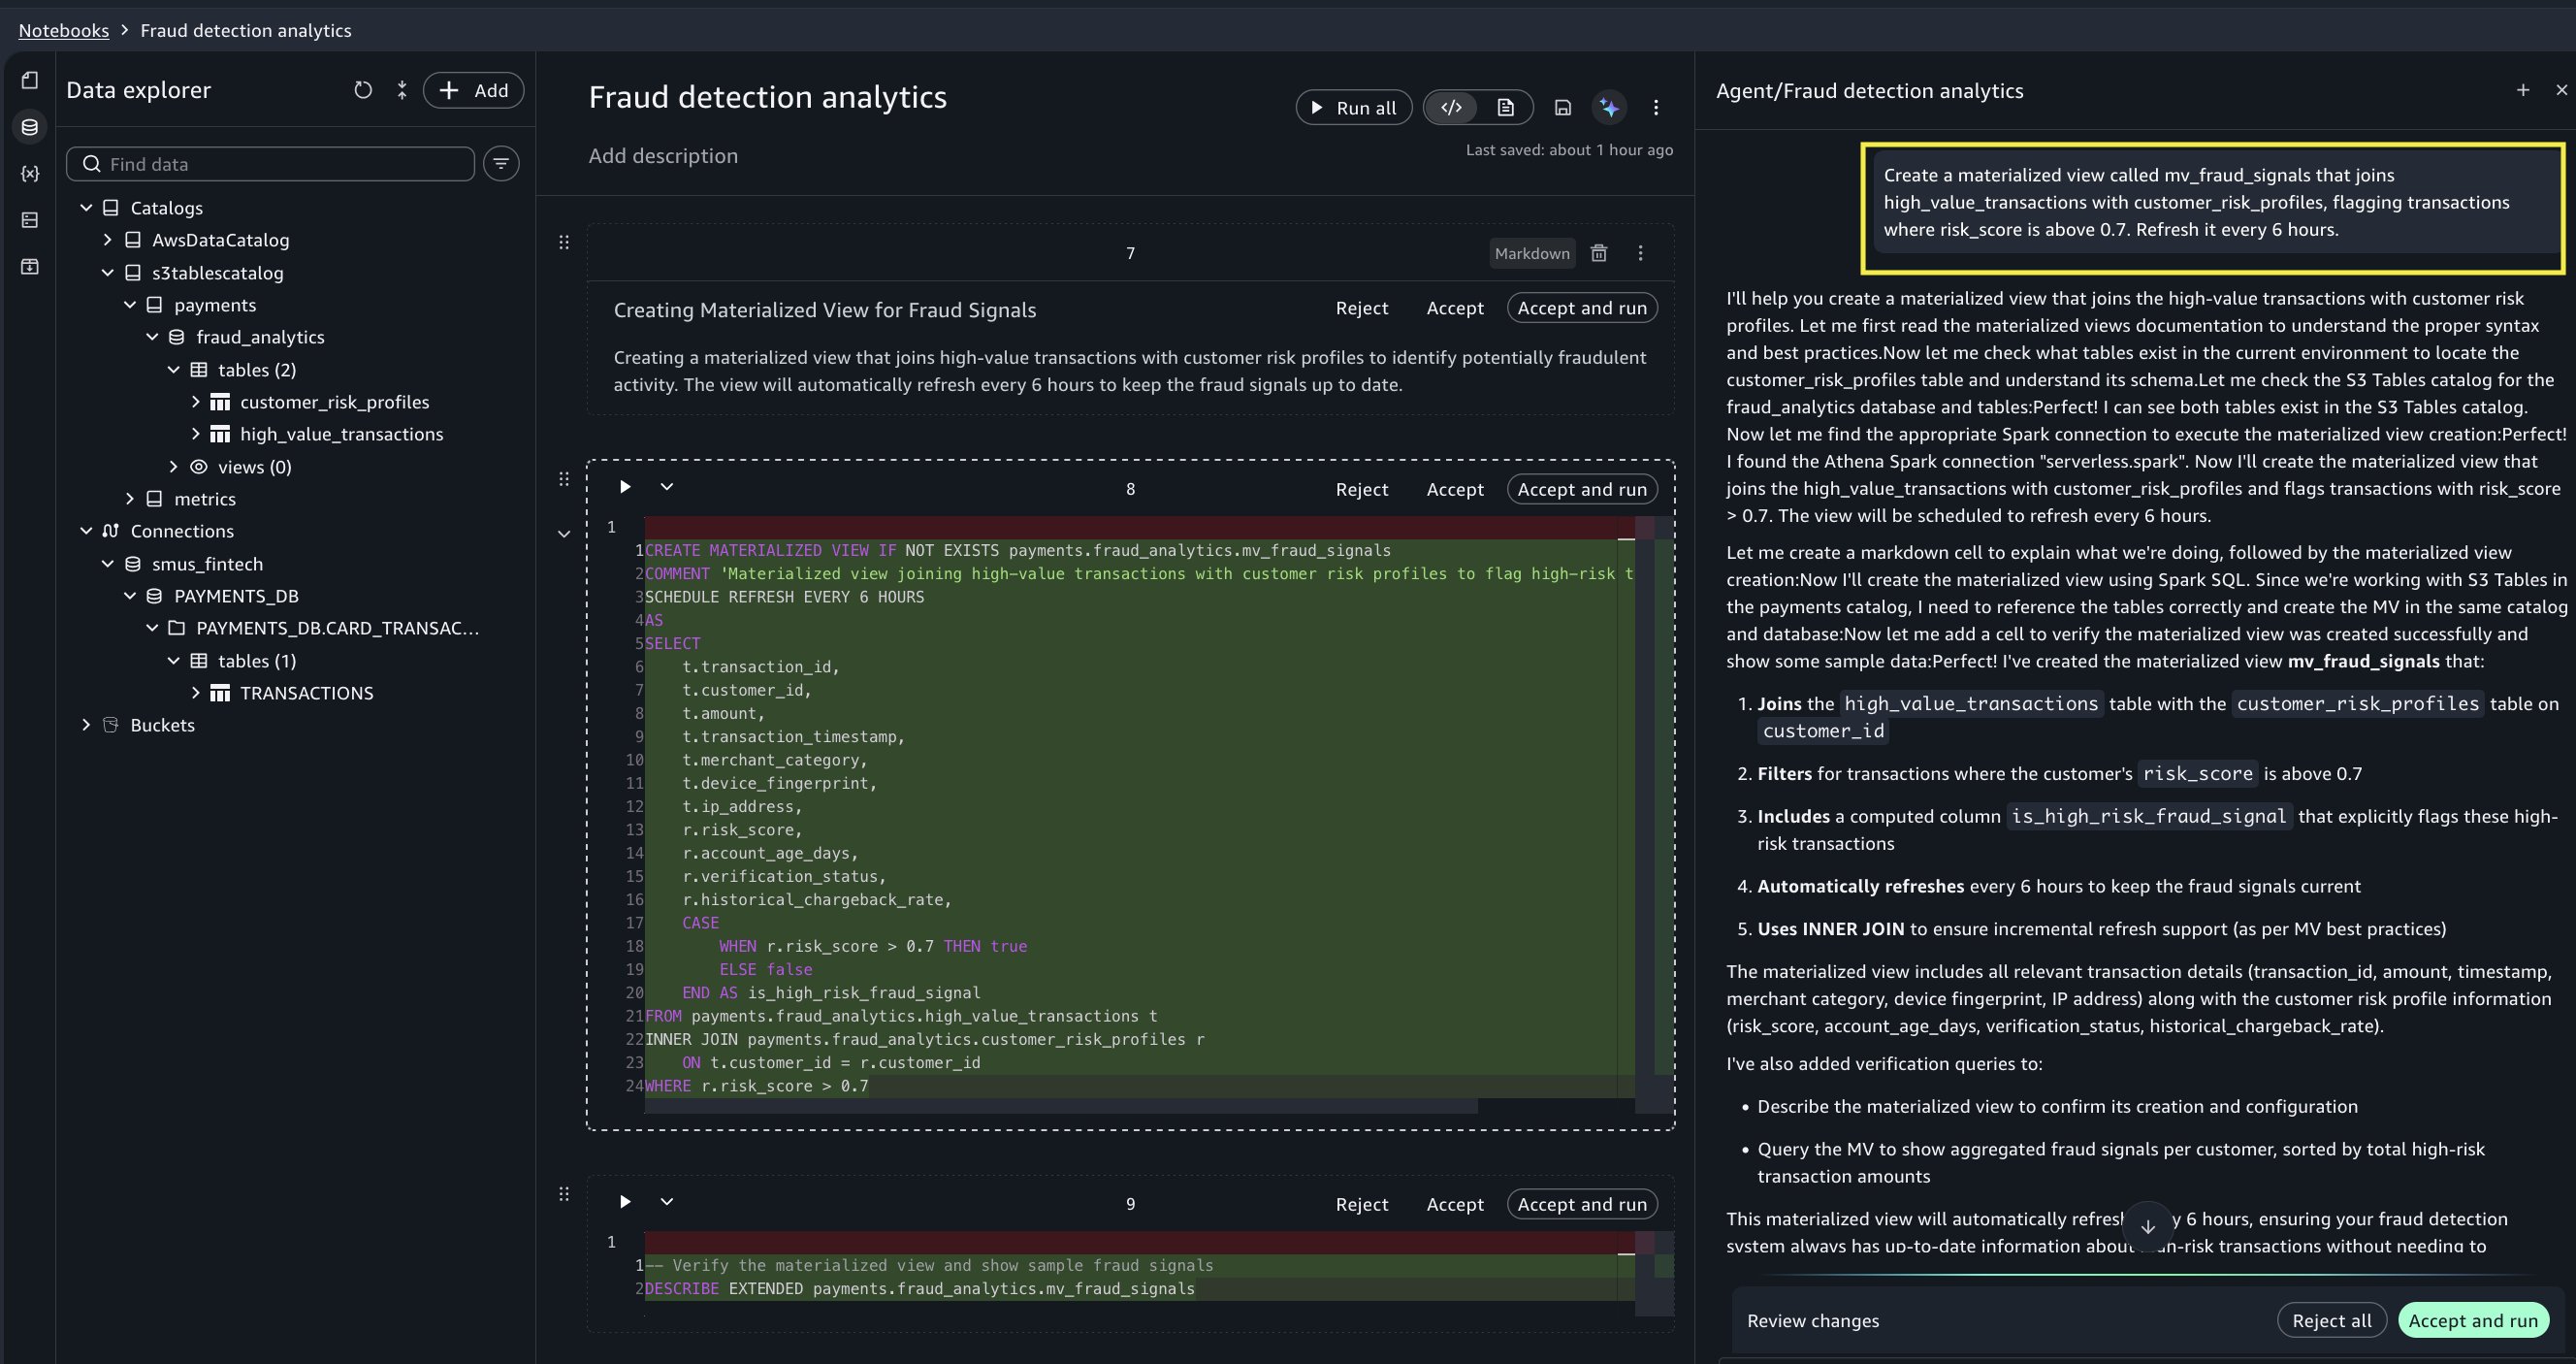
Figure 6: Data Agent creates a new cell to create the materialized view.
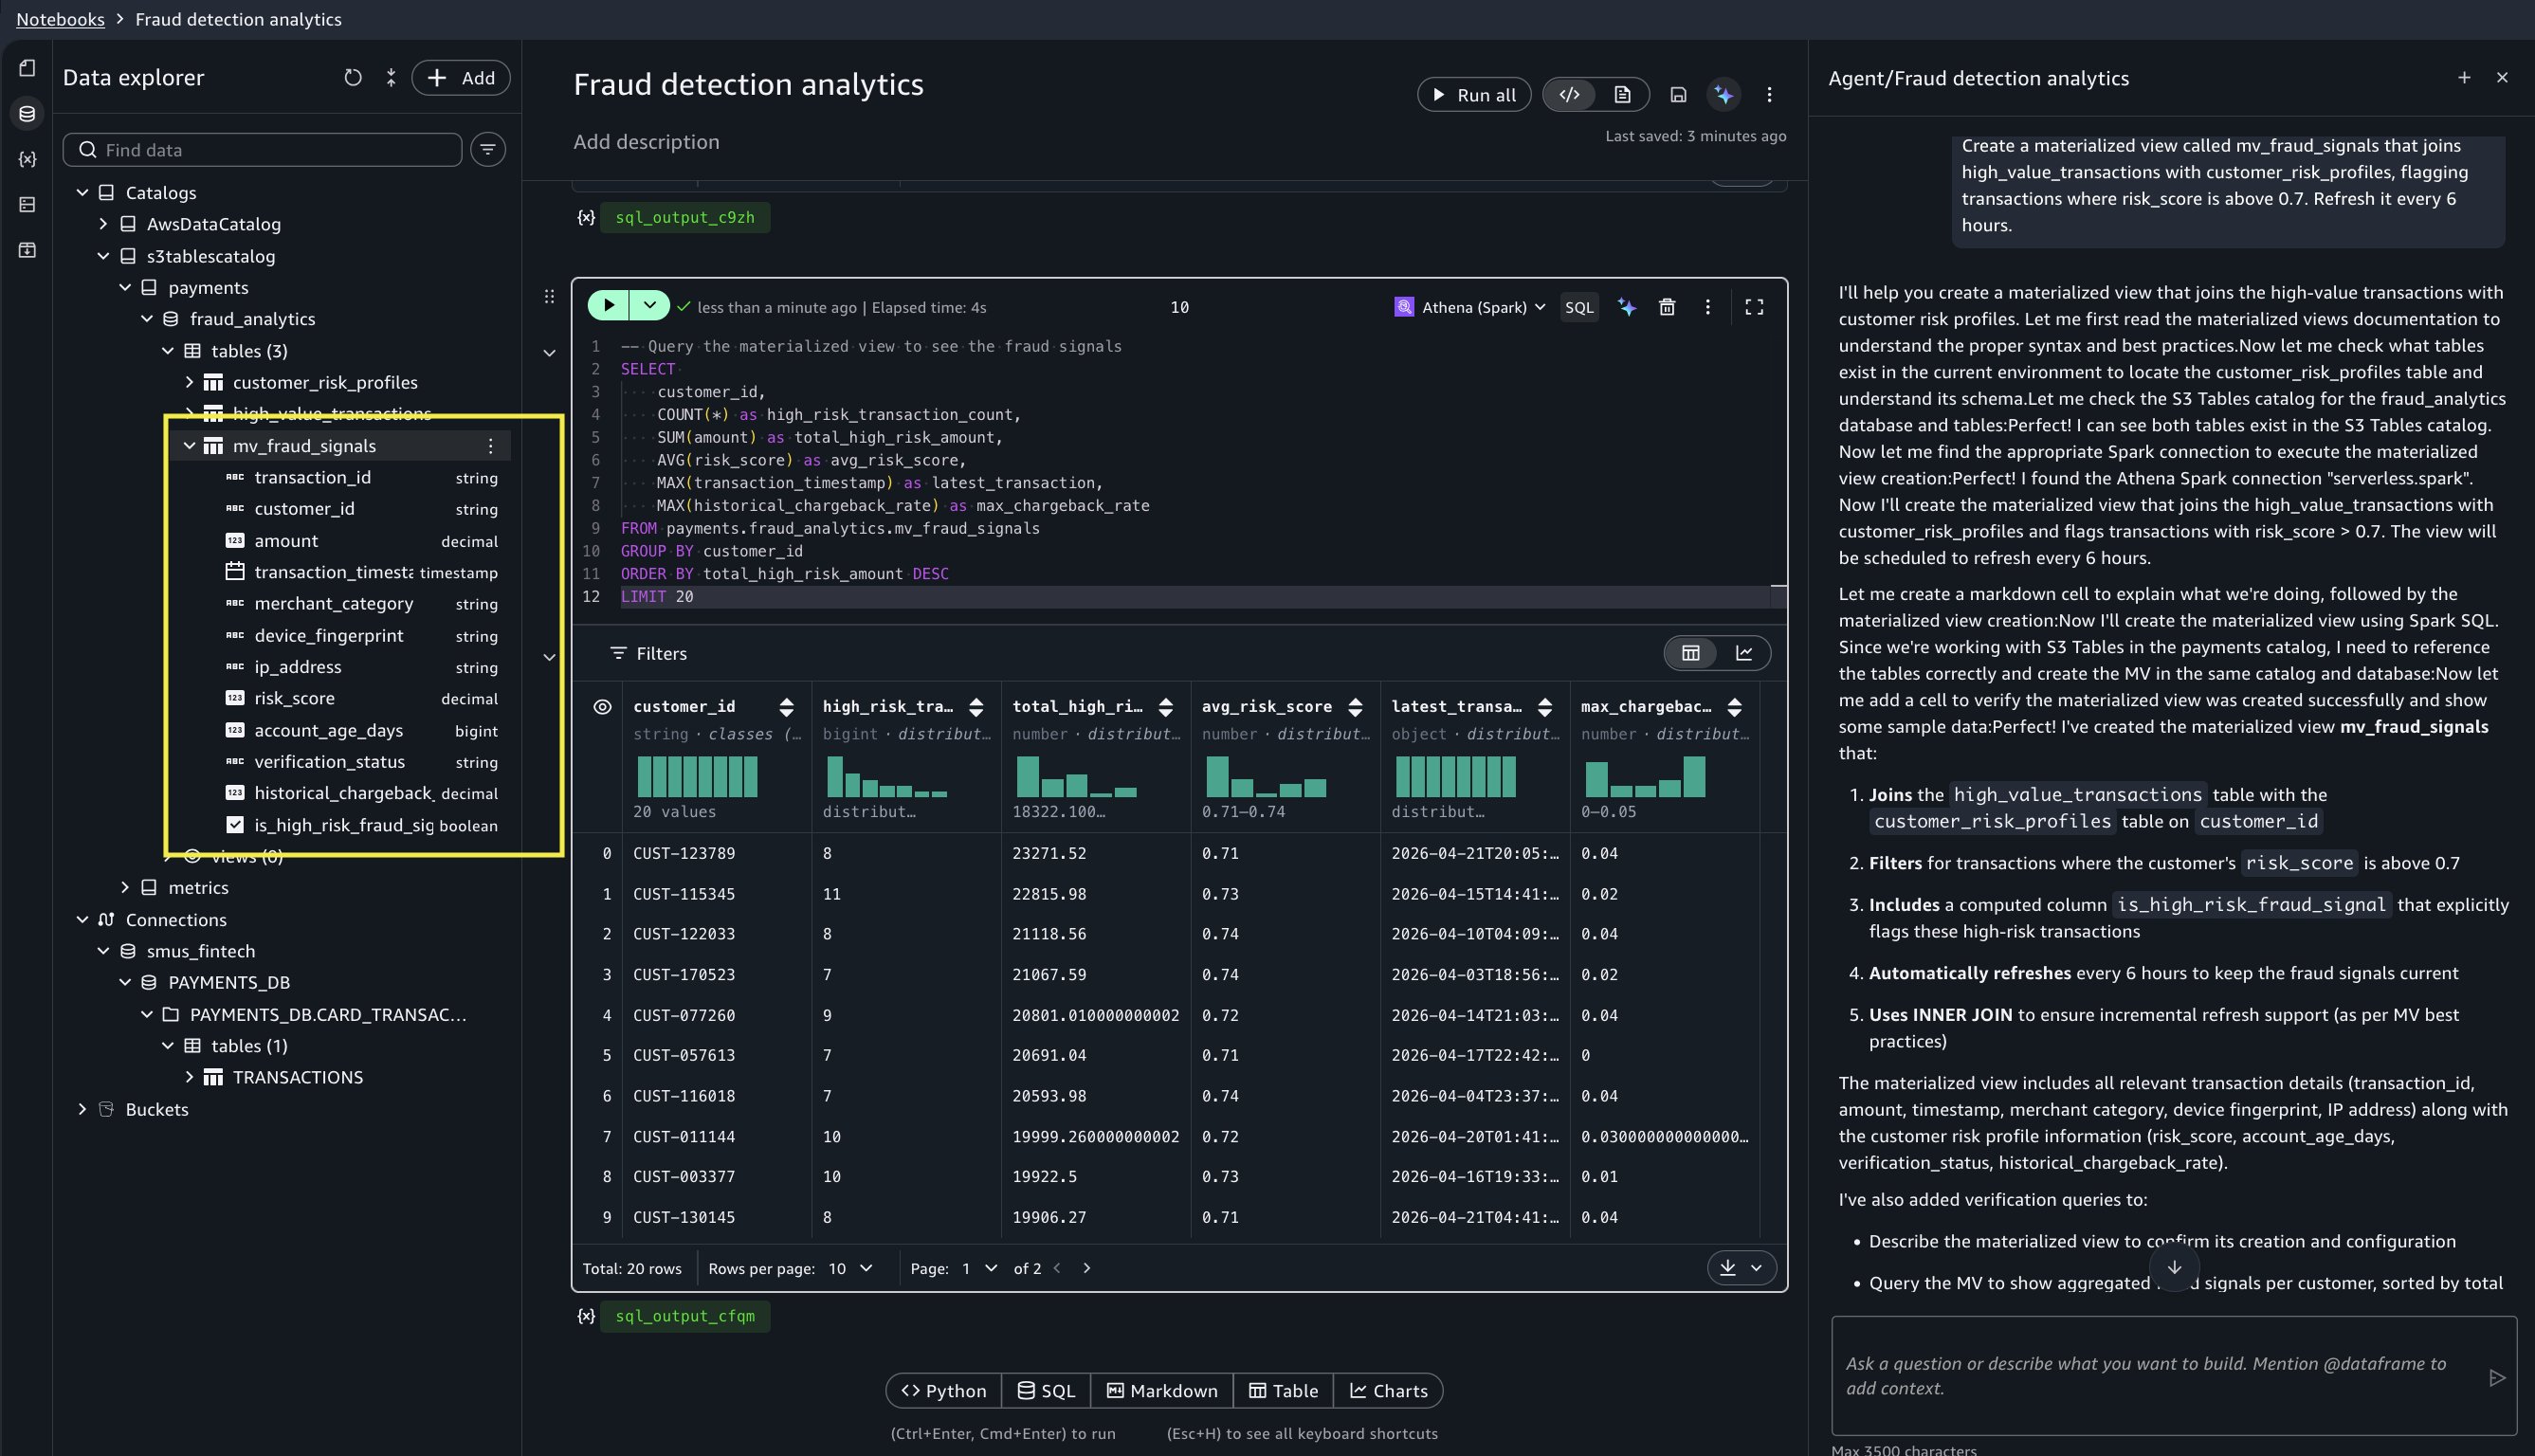
Figure 7: Data Agent adds code to query the newly created materialized view.
Step 4: Visualize fraud patterns with interactive charting
What the analyst wants: The data is ready, but the investigations team needs a clear visual story by noon to see which merchant categories are targeted and what time of day the fraud occurs, so they can build detection rules. The team needs interactive charts that can be explored on the fly, not static matplotlib images that need regenerating every time someone asks “what about category X?”
“Show me a scatter plot of flagged transactions: amount vs risk_score, colored by merchant_category.”
What Data Agent does for you: Data Agent queries the materialized view, generates a Vega-Lite specification, and renders an interactive scatter plot directly in the notebook cell, with no matplotlib code and no BI tool export. Hovering over any point reveals the transaction details. A dense cluster immediately stands out: Electronics & Computers transactions with risk scores between 0.75–0.95, all in the $950–$1,000 range.
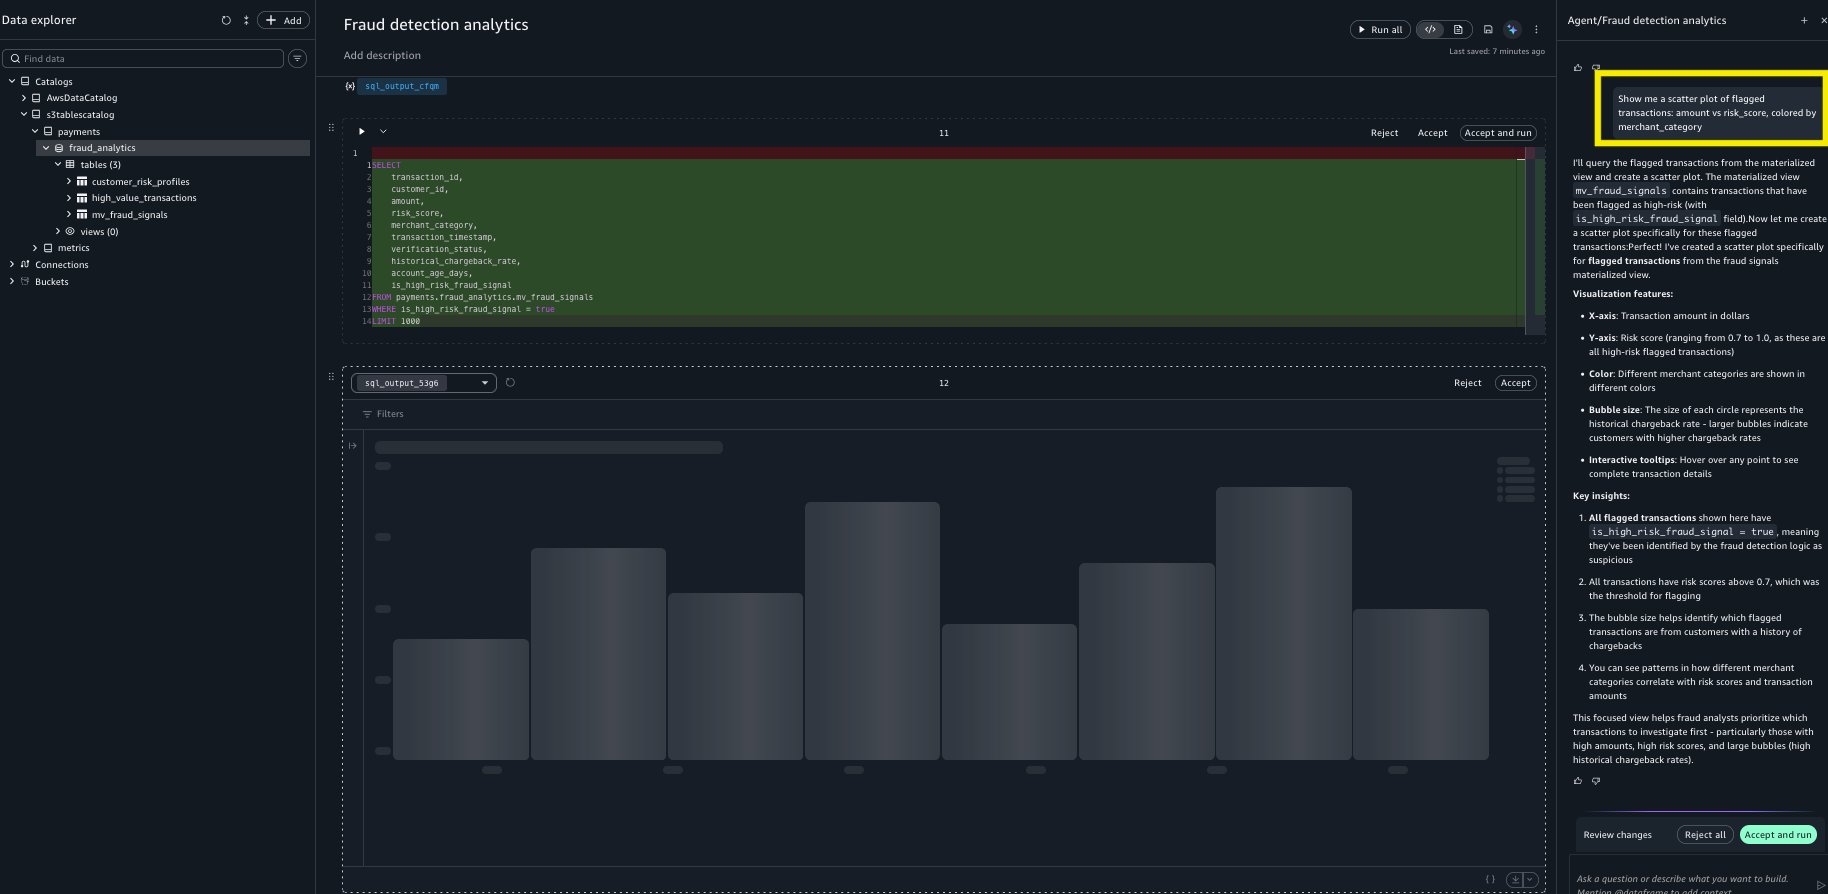
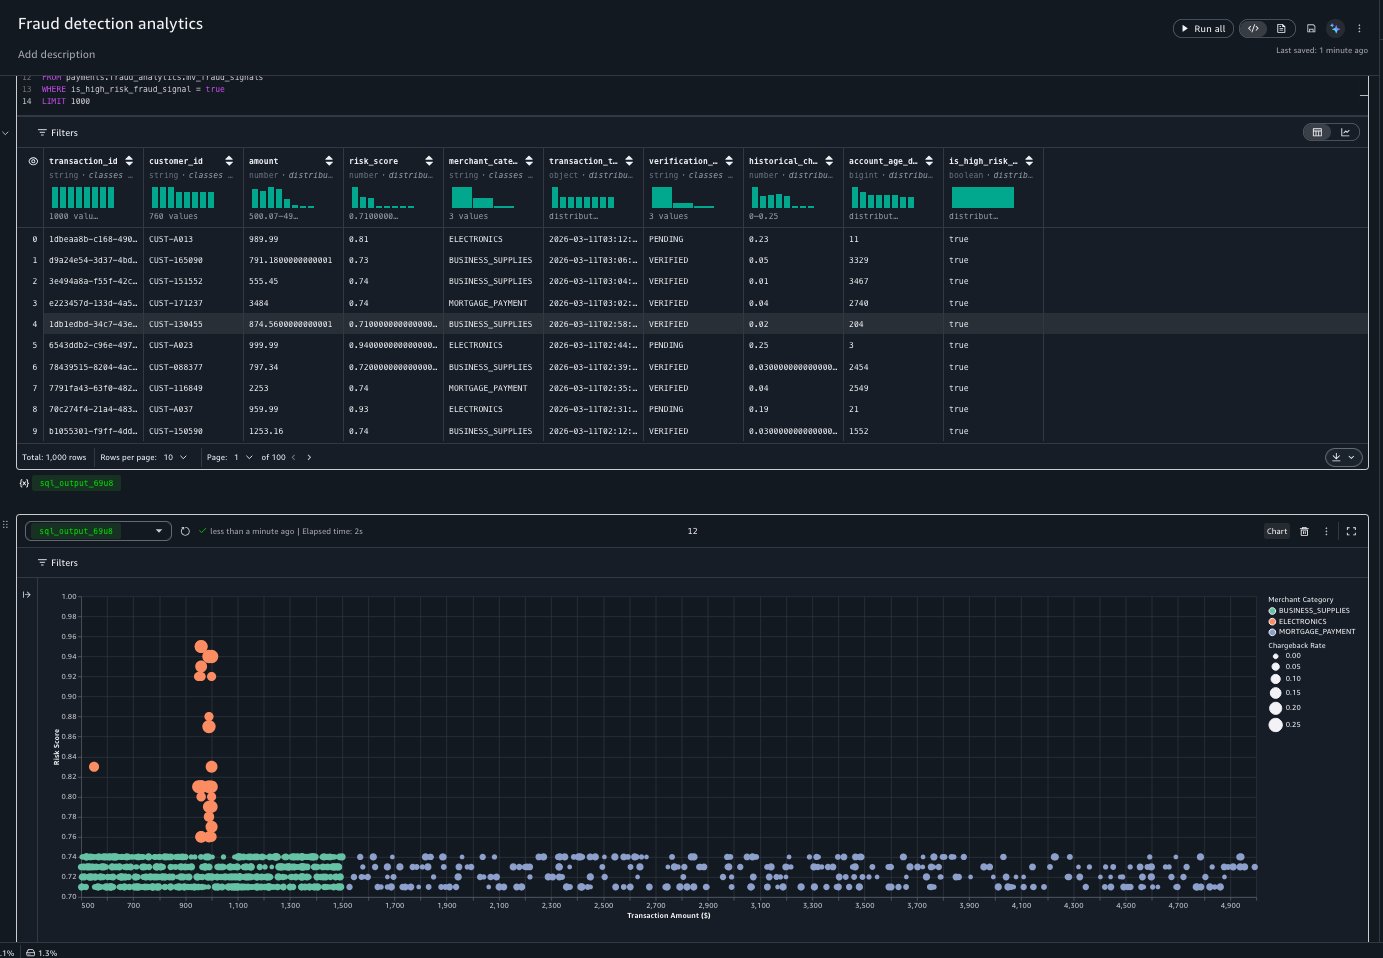
Figures 8, 9, and 10: Data Agent creates a scatter plot showing a dense cluster of Electronics transactions in the $950–$1,000 range with risk scores between 0.75–.95.
The analyst follows up with a second prompt to explore temporal patterns:
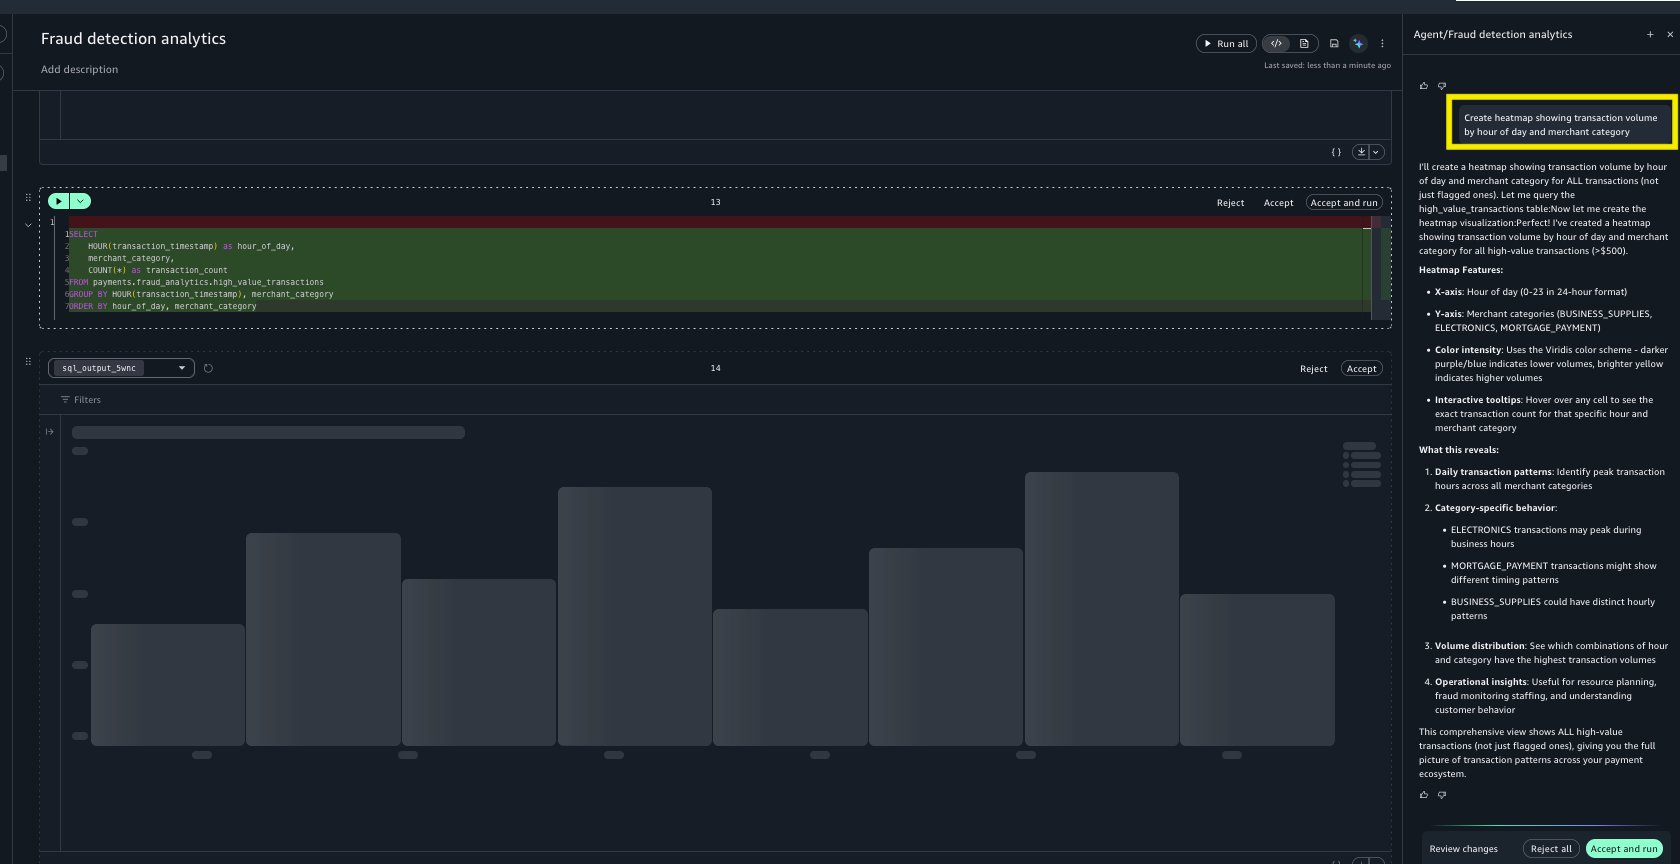
“Change this to a heatmap showing transaction volume by hour of day and merchant category.”
What Data Agent does for you: Data Agent generates a new heatmap visualization from the same materialized view. The heatmap reveals that Business Supplies and Mortgage Payments maintain steady transaction volumes throughout the day. However, Electronics shows a distinctly uneven temporal distribution, with noticeable volume dips during early morning hours (midnight to 5 AM) and late evening. This variability, absent in legitimate purchase categories, is a signal the detection rules team can act on immediately.
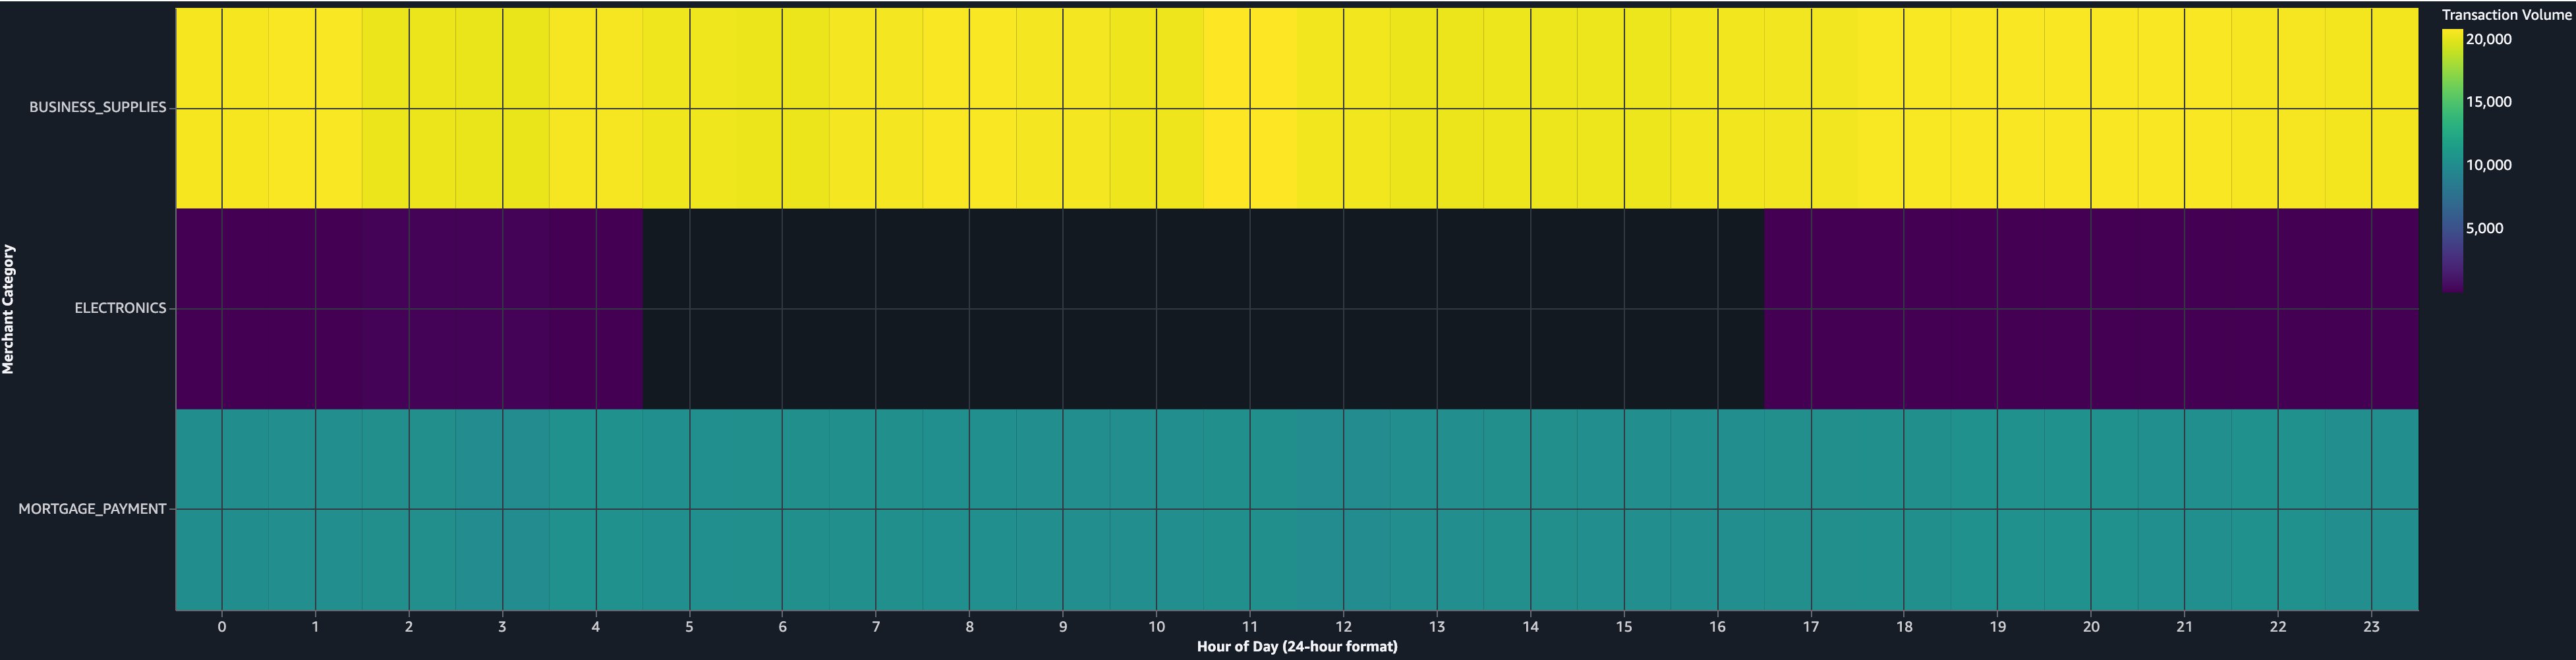
Figures 11 and 12: Data Agent creates a heat map to show transaction volume by hour of day and merchant category, revealing uneven temporal distribution in high-risk categories.
From insight to action
This investigation, from Snowflake connection to visual evidence, streamlined a workflow that previously required significant time across multiple tools. The analyst shares the notebook link with the investigations team, who confirm a fraud ring of dozens of synthetic identities responsible for significant fraudulent purchases. The temporal pattern, uneven Electronics transaction distribution with off-hours variability, is added to the company’s real-time detection rules that same afternoon.
The materialized view continues refreshing every 6 hours. The next morning, it flags three new accounts matching the same pattern, caught within hours of their first transaction instead of days.
Why SageMaker Data Agent for fraud analytics
This walkthrough demonstrates three new capabilities working together:
- SQL analytics on Snowflake data sources removed the CSV export and manual ETL that consumed half of the investigation time.
- Materialized view management turned a one-time query into persistent, auto-refreshing monitoring, transforming reactive investigations into proactive detection.
- Interactive charting kept the entire analysis in the notebook, removing the BI tool context switch and making the inline exploration that revealed the Electronics temporal anomaly possible.
For the team, the combined effect is a reduction in time-to-insight, allowing faster fraud pattern analysis. This means daily fraud pattern reviews instead of weekly, and an investigation workflow that’s reproducible. The notebook itself serves as documentation for compliance and audit purposes.
Cleanup
The walkthrough creates notebook cells, SQL queries, and materialized views in your SageMaker Unified Studio session. To remove the generated cells, delete them from your notebook or delete the notebook itself.
If you created resources specifically for this walkthrough, remove the following to avoid ongoing charges:
- Materialized view. In the notebook Agent Panel, prompt: “Drop the materialized view mv_fraud_signals.” This removes the Iceberg table from S3 Tables and cancels the scheduled refresh. Alternatively, run the Spark SQL statement
DROP MATERIALIZED VIEW payments.fraud_analytics.mv_fraud_signalsdirectly. - Landed Iceberg tables. Drop any tables created during the data landing step (for example,
payments.fraud_analytics.high_value_transactions) by prompting Data Agent or runningDROP TABLEin a Spark SQL cell. This removes the data from S3 Tables and the underlying Amazon Simple Storage Service (Amazon S3) storage. - SageMaker Unified Studio domain. If you created a domain solely for this walkthrough, delete it to stop incurring charges. Refer to the SageMaker Unified Studio administration guide for deletion steps.
- Amazon S3 storage. Verify that dropping the materialized view and Iceberg tables removed the associated S3 objects. If residual Iceberg metadata files remain in your S3 Tables bucket, delete them manually.
- Snowflake compute. No persistent Snowflake resources are created. Queries use your existing warehouse. Review your Snowflake query history to estimate the compute credits consumed during the walkthrough.
Conclusion
In this post, we walked through three new capabilities in Amazon SageMaker Data Agent for notebooks: Snowflake connectivity, materialized views, and native interactive charting. Using a fraud analytics scenario, we demonstrated how these features work together. We connected to a Snowflake warehouse to explore transaction data, landed results into S3 Tables and joined them with AWS-hosted risk profiles, created a materialized view for ongoing fraud monitoring, and visualized patterns with interactive charts that revealed temporal anomalies in Electronics transactions linked to dozens of synthetic identities.
These capabilities are available now in Amazon SageMaker Unified Studio. To get started, open a notebook in your SageMaker Unified Studio domain and begin a conversation with Data Agent in the chat panel.
To learn more, see the following resources:
- Amazon SageMaker Data Agent documentation.
- Accelerate context-aware data analysis and ML workflows with Amazon SageMaker Data Agent (related blog post).
- Amazon SageMaker Data Agent introduces charting capabilities and support for materialized views (What’s New post).