Post Syndicated from Brian Krygsman original https://aws.amazon.com/blogs/compute/running-self-hosted-ai-agent-sandboxes-with-aws-lambda-microvms/
Organizations are building AI agents that autonomously write code, query databases, and interact with internal systems on behalf of their teams. These agents handle use cases such as automated code review, data pipeline optimization, and infrastructure troubleshooting. When your AI agent generates a shell command, queries a database, or writes to a file system, that code needs a secure environment to run in. Without isolation, one session’s tool calls can contaminate another session’s state, inadvertently expose sensitive data across tenants, or unintentionally allow untrusted code to reach production resources. Self-hosted sandboxes solve this by keeping agent execution within your own AWS account, giving you full control over networking, secrets, and governance.
Say you’re building an internal AI agent that optimizes database queries for your engineering team. A developer asks it to find the ten slowest queries in your analytics database, rewrite them with better indexing, and test the results. That’s three tool calls in a single session. One hits a live database with real credentials. One generates code. One executes it. Now multiply that by fifty developers using the assistant at the same time. Each session needs its own credentials, its own filesystem, its own network boundary. If credentials or state cross session boundaries, you have inadvertent data exposure.
AWS Lambda MicroVMs is a serverless compute environment that provides general-purpose runtimes with the strong isolation of virtual machines and the rapid scaling of AWS Lambda. Powered by Firecracker virtualization, each MicroVM runs Amazon Linux with full OS access for up to 8 hours. You launch, suspend, resume, and terminate MicroVMs programmatically. You get the serverless benefits of managed infrastructure, responsive scaling, and pay-per-use pricing. Three capabilities make Lambda MicroVMs a strong fit for agent sandboxes:
- VM-level isolation per environment: Each MicroVM runs in its own Firecracker virtual machine, providing hardware-virtualization-based isolation between sessions without the resource overhead and startup time required of full VMs. One developer cannot see a teammate’s session, even when both run at the same time.
- Launch from snapshot: Like Lambda SnapStart, MicroVMs boot from a pre-captured memory and disk snapshot, skipping application initialization entirely. Your agent gets a near-instant ready-to-use environment.
- 4x vertical scaling without re-provisioning: A running MicroVM can scale CPU and memory up to 4x its initial allocation, which can range from 0.25 vCPU/0.5 GB to 4 vCPU/8 GB, without terminating or re-creating the environment. If the agent needs to run a heavy data transformation mid-session, it can get more resources without starting over.
In this post, we show you how to architect and build a self-hosted AI agent that uses Lambda MicroVMs as secure, isolated sandboxes for tool-call execution. Lambda MicroVMs can handle the compute isolation for running tool calls, while the host for production AI agents, such as Amazon Bedrock AgentCore, manages the agent logic, model routing, and session state. A complete reference solution is available in aws-samples.
How self-hosted sandboxes work
A developer asks the agent to “find the ten slowest queries in our analytics database and suggest index improvements.” The agent orchestration system starts a session then breaks the objective into tool calls and distributes them. A worker needs to pick up that session, run the queries, and return results.
Most AI agent orchestration services and frameworks use a work queue model to distribute tool-call execution. The orchestration service enqueues sessions representing tool-call work. A worker, the process that claims a session and executes its tool calls, runs inside a compute environment, posts results, and exits. In this architecture, each Lambda MicroVM is the compute environment, and the worker is the process running inside it. Claude Managed Agents self-hosted sandboxes run those workers inside your own infrastructure rather than on a shared, multi-tenant compute pool. Your database credentials stay in your virtual private cloud (VPC). Your network, introspection, and governance rules apply.
You can trigger workers in two ways:
- Webhook-triggered: The orchestration application sends a notification when a session is ready. Your control plane launches a worker on demand.
- Always-on: A long-running process continuously polls the work queue for new sessions.
The Lambda MicroVMs lifecycle aligns with the webhook-triggered pattern, where each session produces one inbound event that launches a fresh MicroVM. Lambda MicroVMs support configurable idle policies. After a configurable idle period, a MicroVM suspends automatically, preserving disk and memory state. It resumes when inbound traffic arrives or when you call the resume API. The MicroVM runs for the duration of the session, the worker exits, and the idle policy suspends then finally terminates the VM. Lifecycle hooks allow you to run custom logic at key steps in the MicroVM lifecycle.
In contrast, the always-on pattern risks breaking the polling loop by suspending the MicroVM when idle, since there’s no inbound traffic between sessions. You could disable the configurable idle period, but then you pay for empty polling. Use the webhook-triggered approach for self-hosted sandboxes on Lambda MicroVMs.
Architecture
The following figure shows the reference solution’s architecture, with the Anthropic agent orchestration service control plane on the left interacting with a self-hosted sandbox environment in AWS on the right.
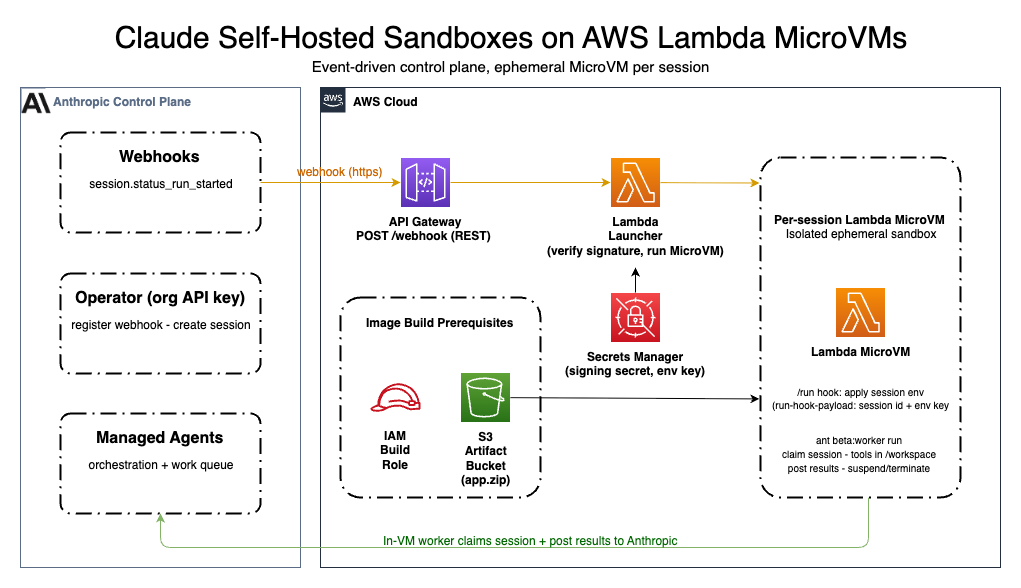
Figure 1: Reference architecture for self-hosted AI agent sandboxes on Lambda MicroVMs
The sample architecture is event-driven. The only inbound traffic is the webhook call. When the event arrives, the handler launches a MicroVM. Once launched, the MicroVM pulls its assigned session from the orchestration system’s work queue and runs the task. In our example, the developer’s “find slow queries” request has been queued as a session. The agent now needs to reach your infrastructure, spin up an isolated environment, and hand off the work. The following sequence shows how each component interacts to fulfill a single session.
The orchestration service queues work as sessions. A MicroVM launches to service each session, and the worker is the process running inside that MicroVM that claims the session, executes tool calls, and returns results.
- Once the orchestration service marks a session as ready to run, it sends a
session.status_run_startedwebhook to an Amazon API Gateway endpoint, triggering a MicroVM launch. - The launcher verifies the webhook signature using a signing secret from AWS Systems Manager Parameter Store, rejecting invalid or stale deliveries before spending compute.
- The launcher calls
RunMicrovm, passing the session ID and a secret reference throughrunHookPayload. It deduplicates on the webhook event ID (backed by Amazon DynamoDB) so retries do not launch duplicate VMs. - The MicroVM boots from a pre-captured Firecracker snapshot and receives the dispatch on its
/runlifecycle hook. The worker fetches the environment key from Parameter Store using its execution role. It pulls the matching session from the work queue, claims it, and executes tool calls in an isolated/workspacedirectory. When finished, it posts results and exits. The idle policy suspends then terminates the VM.
Deduplication. The webhook event ID serves as the idempotency key. The launcher uses Powertools for AWS Lambda (Python) with a DynamoDB persistence layer to verify exactly-once processing. If the orchestration application retries a delivery with the same event ID, Powertools protects the system from launching extra MicroVMs and doing extra work.
Credential boundaries. Each component accesses only the single secret it needs. The launcher reads only the webhook signing secret to verify inbound events. It passes only an ARN reference to the environment key into the MicroVM payload. The MicroVM’s execution role retrieves only that environment key at runtime. No single component holds both secrets.
| Component | Has access to |
| Launcher Lambda | Webhook signing secret (verify inbound events) |
| MicroVM worker | Environment key (through the execution role, to poll and claim sessions) |
Cost model. You pay for MicroVM run time per session, plus standard charges for API Gateway requests, Parameter Store API calls, and Lambda invocations for the launcher. When no sessions are active, no MicroVMs run. Cost scales with concurrent sessions and their duration, avoiding idle compute charges.
Implementation
The following sections explore the reference architecture in more depth.
Project structure
The reference solution uses AWS Serverless Application Model (AWS SAM) for infrastructure-as-code. Alternatively, if you use an AI coding agent such as Claude Code, Kiro, or Cursor, the Agent Toolkit for AWS includes a Lambda MicroVMs skill that gives your agent the procedures to provision, configure, and deploy MicroVM-based sandbox environments on your behalf.
Launcher: verify the webhook before spinning up compute
When the webhook arrives saying a developer’s session is ready, the launcher’s first action is signature verification. If it fails, the function returns 401 immediately. No MicroVM launches. No DynamoDB writes. You don’t pay for fraudulent or replayed requests.
After verification, the launcher builds a dispatch payload containing the session ID, environment ID, region, and an ARN reference to the environment key secret. It passes this to RunMicrovm through runHookPayload:
MicroVM worker: claim one session, execute, exit
The MicroVM image is built from a Firecracker snapshot. The worker process starts during image creation and is captured in the snapshot, so there is no application startup at run time. The /run lifecycle hook delivers the dispatch payload:
The worker acknowledges the hook within its timeout, fetches the environment key, and claims the session. This is where the requested work begins. The worker connects to the analytics database, runs EXPLAIN ANALYZE on the flagged queries, writes optimized alternatives to /workspace/suggestions.sql, and posts the results back to the developer. All of that happens inside this single VM. When the session completes, the worker calls terminate-microvm to release all compute resources.
Deployment
For full deployment instructions, see the reference solution README. Before deploying, make sure you have these prerequisites.
Prerequisites
- An AWS account with permissions for Amazon Simple Storage Service (Amazon S3), AWS Identity and Access Management (IAM), AWS Systems Manager Parameter Store, Amazon API Gateway, AWS Lambda, AWS WAF, Amazon CloudWatch Logs, and AWS Lambda MicroVMs.
- AWS Command Line Interface (AWS CLI) v2+.
- The AWS SAM CLI.
- An existing Anthropic Claude Managed Agents agent configured with a
self_hostedenvironment (note the agent ID and environment ID). - A webhook signing secret and environment key, both generated in the Anthropic Claude Console.
Four steps
- Deploy the control plane. Build and deploy the SAM stack, which creates the launcher Lambda, API Gateway endpoint, WAF WebACL, DynamoDB idempotency table, Parameter Store entries, and MicroVM execution role.
- Register the webhook and populate secrets. In the Claude Console, register the stack’s
WebhookUrloutput as a webhook endpoint subscribed tosession.status_run_started. Store the signing secret and environment key in the Parameter Store resources created by the stack. - Build the MicroVM image. Package the Dockerfile and worker code, upload to Amazon S3, and create the image. The service runs your Dockerfile, launches the worker, and captures a Firecracker snapshot. Monitor build progress in Amazon CloudWatch under
/aws/lambda/microvms/<image-name>. - Verify. Create a test session and confirm a MicroVM launches and completes end-to-end. The reference solution includes a verification script that creates a session, triggers the webhook, and validates the full flow.
Using Claude Platform on AWS (CPOA)
The preceding architecture works similarly when you access Claude through Claude Platform on AWS rather than the first-party API. Three things change in the worker:
- Client initialization. Replace the first-party client with the AWS client and supply your workspace ID:
- Authentication options. CPOA supports two modes:
- CPOA API key (
aws-external-anthropic-api-key-...): Store it in Parameter Store the same way as the first-party environment key. These keys are short-lived (12-hour STS tokens) and must be regenerated when they expire. - SigV4 (IAM): The MicroVM execution role can sign requests directly, so there is no secret to store or rotate. Set the environment key secret to a placeholder value (for example,
use-sigv4) and the SDK falls through to IAM credentials automatically. This is the recommended path for production.
- CPOA API key (
In both authentication modes, attach the AWS managed policy AnthropicSelfHostedEnvironmentAccess to the MicroVM execution role. This policy grants the aws-external-anthropic actions needed to poll the work queue, claim sessions, and post results. See IAM actions for Claude Platform on AWS for the full reference.
Prerequisite: Enable outbound web identity federation once per AWS account:
Everything else, including webhook verification, deduplication, credential separation, and idle policy remains the same.
Security
Earlier we talked about what goes wrong without isolation. Credentials exposed between sessions. Scripts unintentionally reaching production. Agents escaping their sandbox. This architecture implements defense in depth to help prevent these.
Each component accesses a single, scoped secret. The launcher passes only an ARN reference to the worker credential into the MicroVM. The MicroVM’s execution role retrieves only that credential at runtime. The analytics database connection string does not touch the launcher and does not leave your environment.
AWS WAF applies managed rule sets (OWASP, known bad inputs, IP reputation) and per-IP rate limiting. Amazon API Gateway request validation rejects malformed bodies. The launcher performs HMAC signature verification as the true authentication boundary.
Each session runs in its own MicroVM. Sessions do not share memory, disk, or network namespaces. Firecracker provides hardware-virtualization-based isolation. The launcher IAM role reads only the signing secret. The MicroVM execution role reads only the worker credential. Both are scoped to specific Parameter Store ARNs. The Amazon S3 artifact bucket blocks public access, enables versioning, and uses server-side encryption.
Conclusion
This post walked through how to give your internal AI agent a safe place to run database queries, generate code, and execute scripts on behalf of fifty developers without leaking data between sessions or reaching resources it shouldn’t.
AWS Lambda MicroVMs provide ephemeral, VM-isolated compute environments that align with the per-session execution model of AI agent sandboxes. Snapshot-based launch avoids application startup latency. Idle policies terminate VMs once sessions complete. Firecracker isolation verifies that sessions do not share state. You pay only for active execution time and maintain full control over credentials, networking, and governance within your AWS boundary.
You build and operate a serverless control plane. You get per-session VM isolation with no idle compute cost and no shared tenancy.
To get started, explore these resources:
- Read more about Lambda MicroVMs in the launch announcement post.
- Clone the reference solution in the aws-samples repository.
- Add the MicroVMs skill to your coding agent.
- Learn more about AWS Lambda MicroVMs in the Developer Guide.
- Learn about Anthropic self-hosted sandbox configuration in the self-hosted sandbox documentation.
- For more serverless learning resources, visit Serverless Land.