Post Syndicated from Will Matos original https://aws.amazon.com/blogs/devops/building-with-ai-dlc-using-amazon-q-developer/
The AI-Driven Development Life Cycle (AI-DLC) methodology marks a significant change in software development by strategically assigning routine tasks to AI while maintaining human oversight for critical decisions. Amazon Q Developer, a generative AI coding assistant, supports the entire software development lifecycle and offers the Project Rules feature, allowing users to tailor their development practices within the platform.
Recently, AWS made its AI-DLC workflow open-source, enabling developers to create software using this methodology. This workflow is implemented in Amazon Q Developer through its Project Rules customization feature. In this post, we will demonstrate how the AI-DLC workflow operates in Amazon Q Developer using an example use case.
AI-DLC Workflow Overview
The AI-DLC workflow is the practical implementation of the AI-DLC methodology for executing software development tasks. As outlined in the AI-DLC Method Definition Paper, the workflow has three phases. These phases are Inception, Construction, and Operations. Inception involves planning and architecture. Construction focuses on design and implementation. Operations cover deployment and monitoring. Each phase includes distinct stages. These stages address specific software development life cycle functions. The workflow adapts to project requirements. It analyzes requests, codebases, and complexity. This analysis determines the necessary stages. Simple bug fixes skip planning. They go directly to code generation. Complex features need requirements analysis. They also require architectural design and detailed testing.
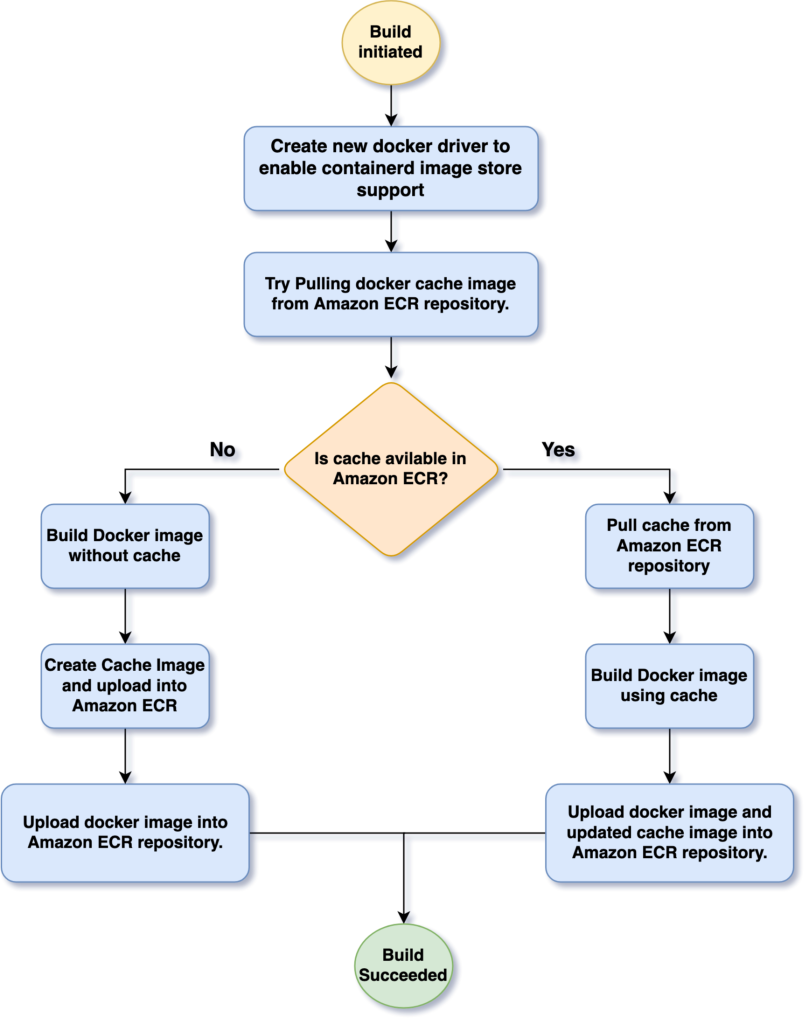
The workflow maintains quality and control through structured milestones and transparent decision-making. At each phase, AI-DLC asks clarifying questions, creates execution plans, and waits for approval. Every decision, input, and response is logged in an audit trail for traceability. Whether building a new microservice, refactoring legacy code, or fixing a production bug, AI-DLC scales its rigor to match needs—comprehensive when complex, efficient when simple, and always in control. Figure 1 shows the phases and stages within the adaptive AI-DLC workflow. The stages shown in green boxes are mandatory, while those in yellow boxes are conditional.
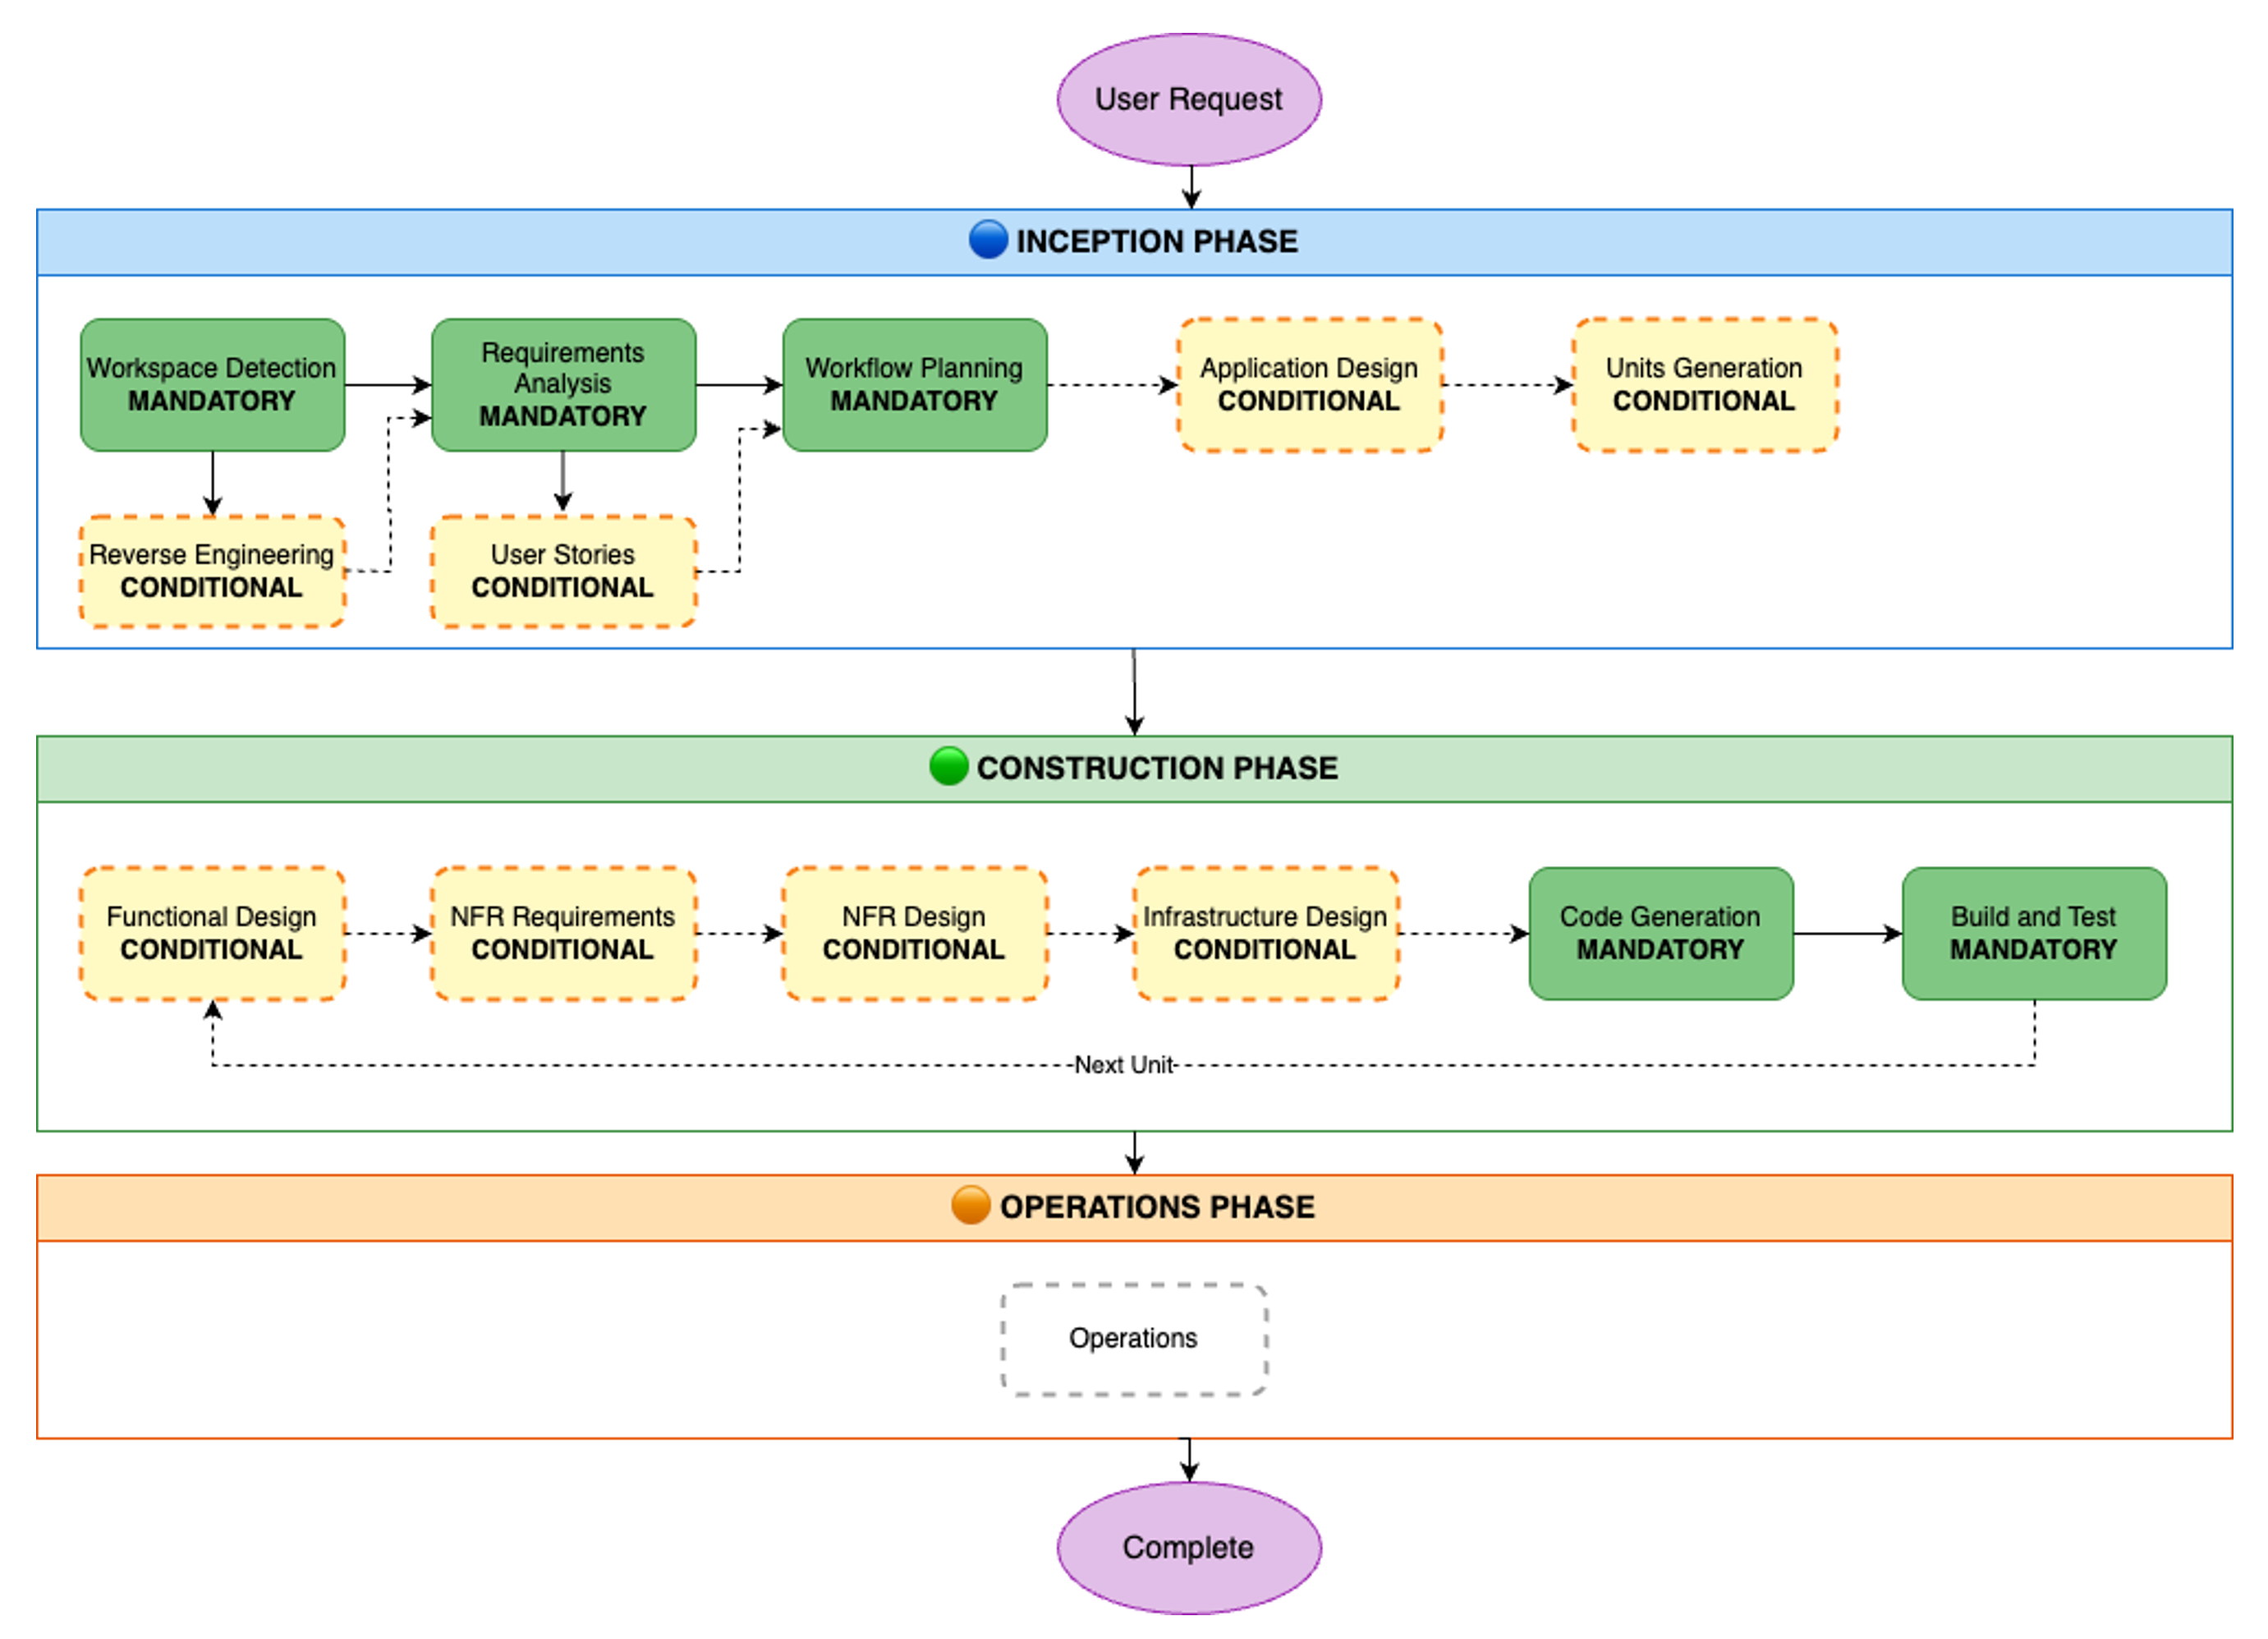
Figure 1. SDLC phases and stages in AI-DLC workflow
Prerequisites
Before we begin the walk-through, we must have an AWS account or AWS Builder Id for authenticating Amazon Q Developer. If you don’t have one, sign up for AWS account or create an AWS builder id. You can use any of the Integrated Development Environments (IDEs) supported by Amazon Q Developer and install the extension as per the AWS documentation. In this post, we’ll be using the Amazon Q Developer extension in VS Code IDE. Once the plug-in is installed, you’ll need to authenticate Q Developer with the AWS cloud backend. Refer to the AWS documentation for Q Developer authentication instructions.
The AI-DLC workflow generates various Mermaid diagrams in markdown files. To view these diagrams within your IDE, you can install a Mermaid viewer plugin.
Let’s Begin Building!
Let’s construct a simple River Crossing Puzzle as a web UI app using AI-DLC. By choosing a straightforward app, we can concentrate more on learning the AI-DLC workflow and less on the project’s technical intricacies.
The sections below outline the individual steps in the AI-DLC development process using Amazon Q Developer. We’ll showcase screenshots of our IDE with the Amazon Q Developer plug-in and demonstrate how to interact with the workflow.
Although we’ve used the Amazon Q Developer IDE plug-in in this blog post, you can also use Kiro Command Line Interface (CLI) to build with AI-DLC without any additional setup. The workflow remains the same, except that you’ll interact through the command line instead of the graphical interface in the IDE.
Step 1: Clone GitHub repo containing the AI-DLC Q Developer Rules
Clone the GitHub repo containing the AI-DLC Q Developer Rules:
git clone https://github.com/awslabs/aidlc-workflows.gitStep 2: Load Q Developer Rules in your project workspace
Follow the README.md instructions in the GitHub repo to copy the rules files over to your project folder.
Step 3: Install and authenticate Amazon Q Developer Extension in IDE
Open the project folder you created in Step 2 in VS Code. Open the Amazon Q Chat Panel in the IDE and ensure that the AI-DLC workflow rules are loaded in Q Developer, as shown in Figure 2. If you don’t see what’s shown in Figure 2, please double-check the steps you performed in Step 2.

Figure 2: AI-DLC rules enabling in Amazon Q Developer
Step 4: Start the AI-DLC workflow by entering a high-level problem statement
Our development environment is now set up, and we’re ready to begin application development using AI-DLC. In our Q Developer chat session, we enter the following problem statement:
Notice that we’ve prefixed our problem statement with “Using AI-DLC …” to ensure that Q Developer engages the AI-DLC workflow. Figure 3 shows what happens next. The AI-DLC workflow is triggered within Q Developer. It greets us with a welcome message and provides a brief overview of the AI-DLC methodology.
Figure 3 shows an expanded view of the AI-DLC workflow rules folder structure on the left. You’ll notice that a single aws-aidlc-rules/core-workflow.md is placed in the designated .amazonq/rules folder, while the rest of the rules files are placed in an ordinary aws-aidlc-rule-details folder. This arrangement is designed to optimize model efficiency. By placing the aws-aidlc-rules/core-workflow.md file in the .amazonq/rules folder, , it serves as additional context, ensuring that the core workflow structure is always accessible without incurring additional token consumption. Conversely, the detailed phase and stage-level behavior rules are stored in the aws-aidlc-rule-details folder and are dynamically loaded as required. This approach conserves Amazon Q’s context window and token usage by retaining only the necessary information within the context at any given time, thereby enhancing model efficiency.
The rules files under the aws-aidlc-rule-details folder are organized into three sub-folders, each representing a phase of AI-DLC. Within each phase, there are stage-specific files. A common folder houses cross-cutting rules applicable to all AI-DLC phases and stages such as the “human-in-the-loop”.
The AI-DLC workflow is self-guided and provides us with a clear understanding of what to expect next. It informs us that it will enter the AI-DLC Inception phase next, starting with the Workspace Detection stage within it.
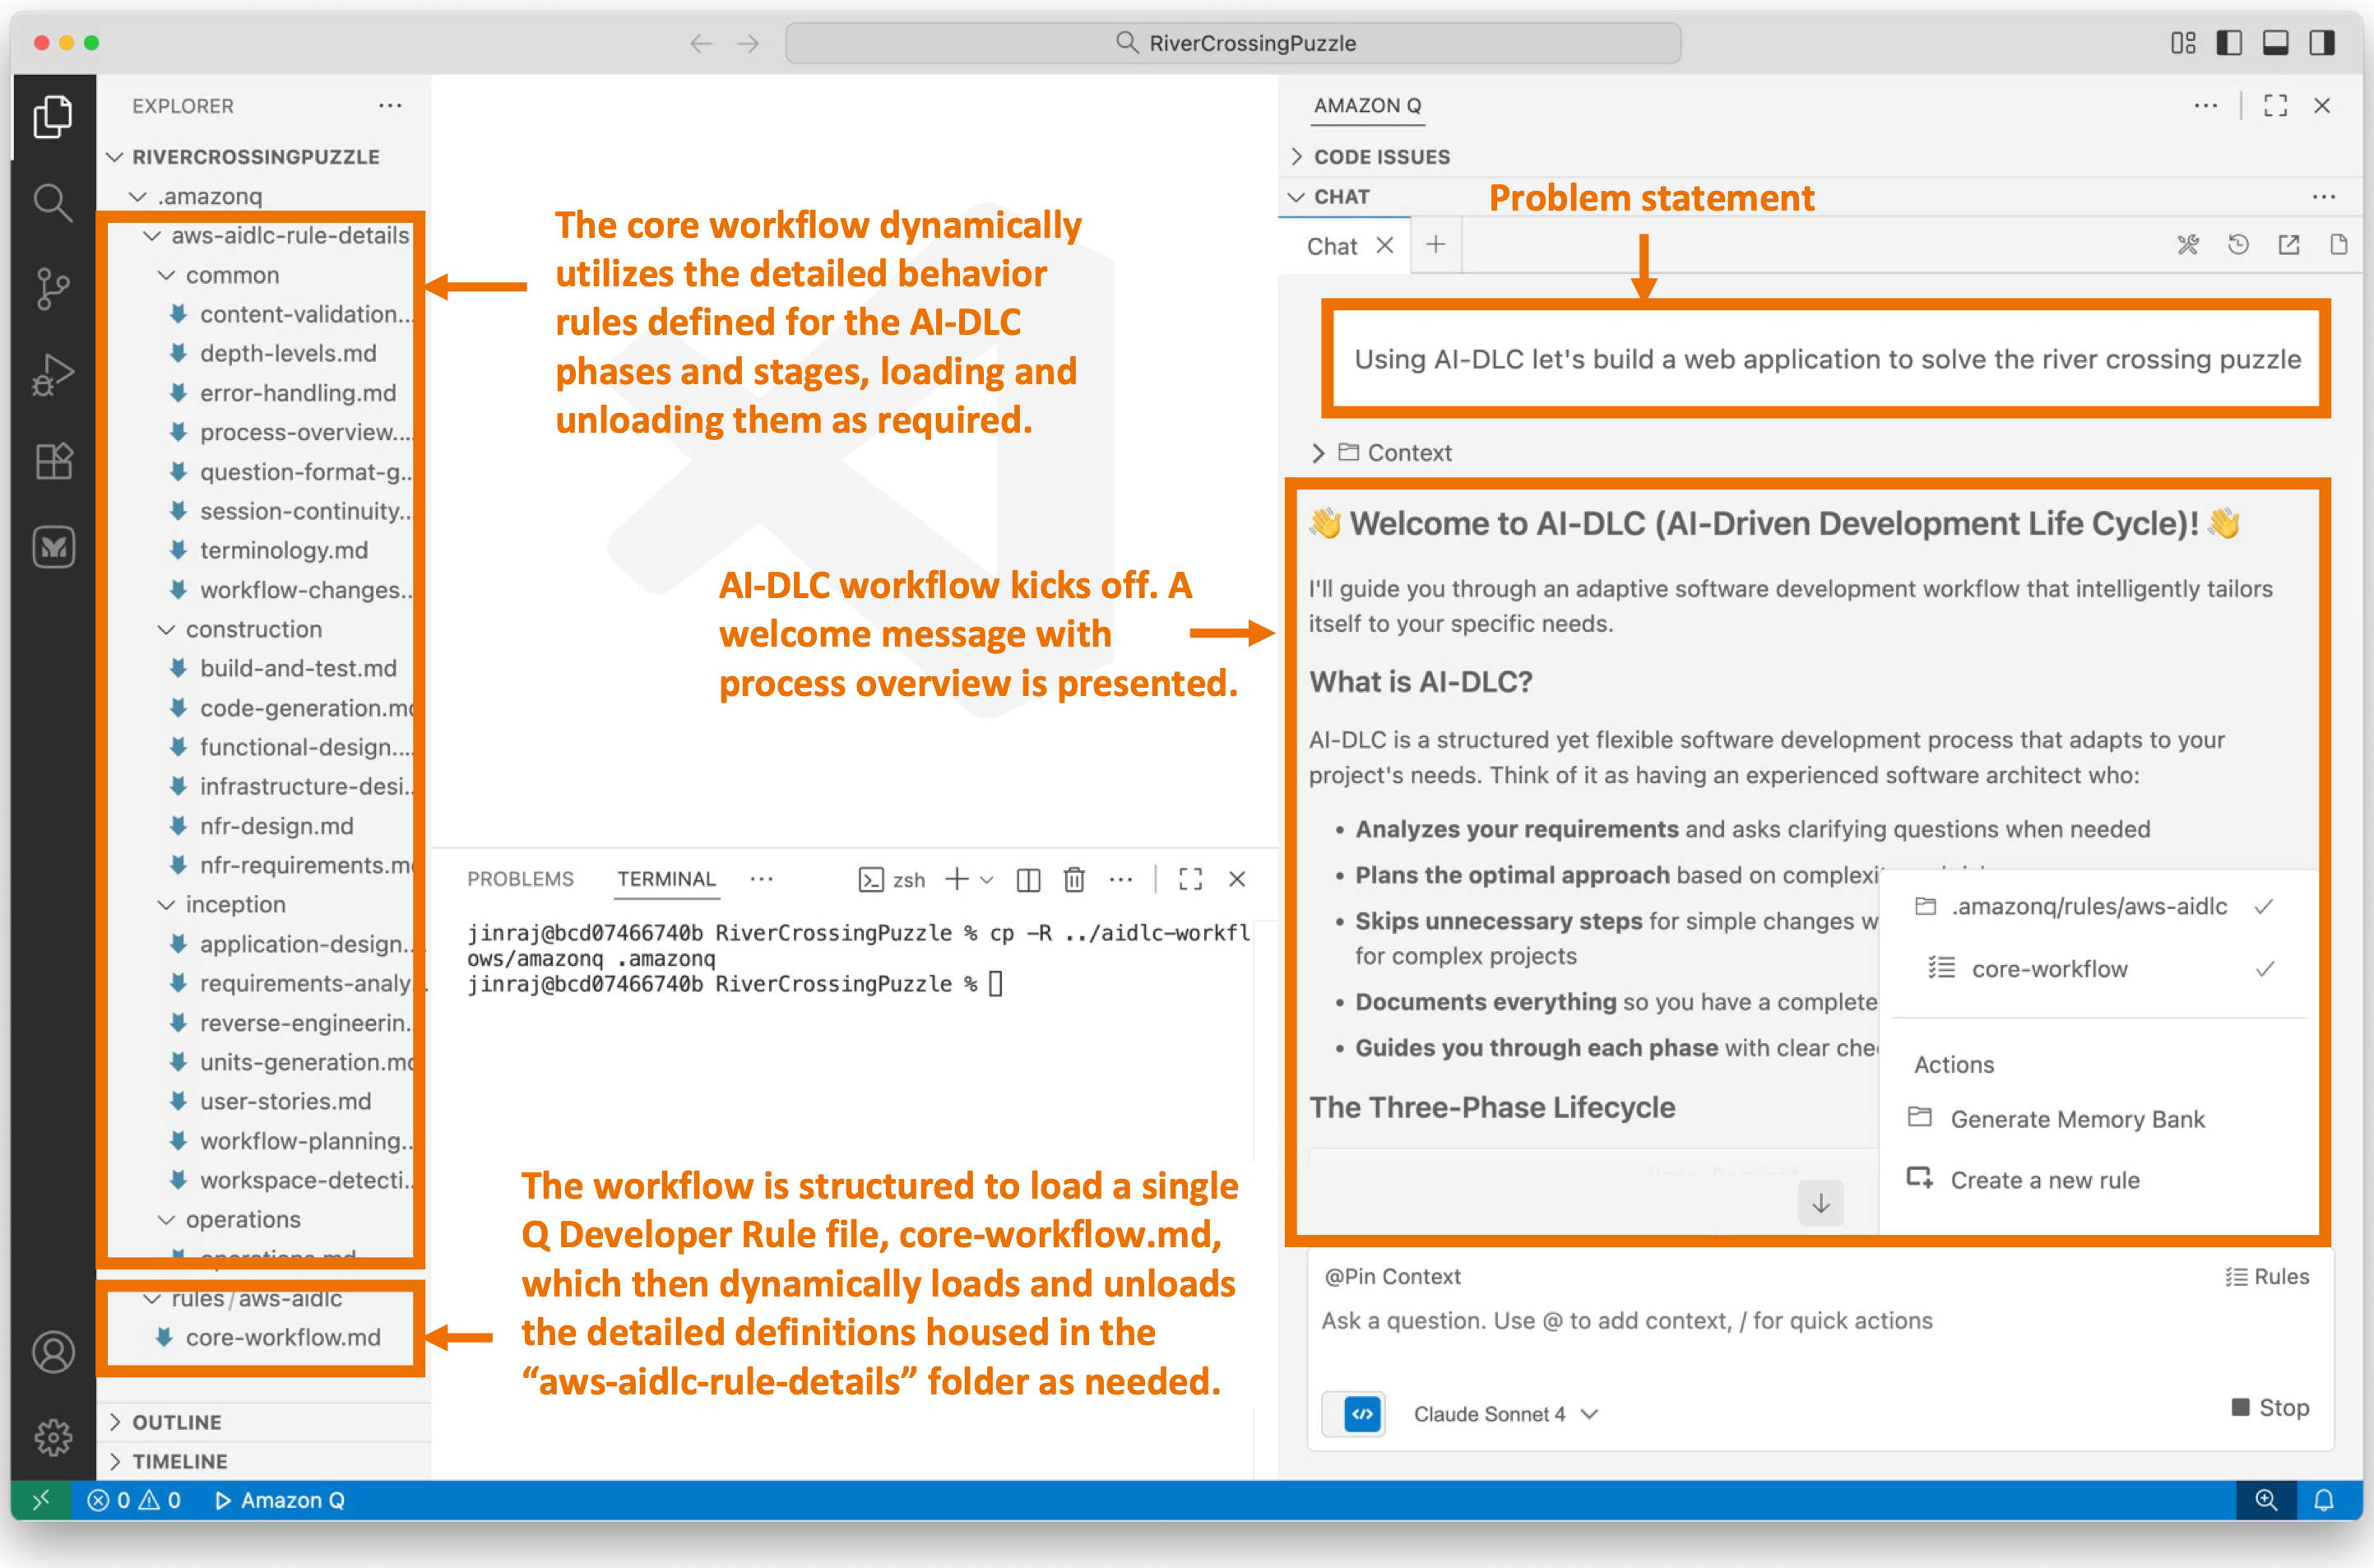
Figure 3: User enters high level problem statement in Amazon Q. AI-DLC workflow is triggered.
Step 5: Workspace Detection
We enter the Workspace Detection stage within the Inception phase. In this stage, AI-DLC analyzes the current workspace and determines whether it’s a greenfield (new) or brownfield (existing) application. Since AI-DLC is an adaptive workflow, it decides whether the next stage will be Reverse Engineering (for brownfield projects) or Requirements Analysis (for greenfield projects).
Since we’re building a greenfield application and there’s no existing code in the workspace to reverse engineer, the workflow will guide us to Requirements Analysis next. If we were working on a brownfield application, the workflow would have performed Reverse Engineering first and then moved on to Requirements Analysis. This demonstrates the adaptive nature of the workflow.
Figure 4 illustrates the process in our IDE when we enter this stage. The workflow requests our permission to create an aidlc-docs folder under the project root. This folder will serve as the repository for all the artifacts generated by AI-DLC during the workflow execution. Subsequently, the workflow generates two files within this folder: aidlc-state.md and audit.md. The purpose of these files is explained in Figure 4.
![Screenshot of AI-DLC workspace detection phase showing the Amazon Q chat interface. The left sidebar displays the file tree with an 'aidlc-doc' folder highlighted. The main chat area shows the Inception Phase - Workspace Detection stage with explanatory text about analyzing the workspace. Five callout annotations explain: 1) Workflow creates aidlc-doc directory for storing AI-DLC generated artifacts; 2) The workflow tracks its progress in aidlc-metadata.json for error recovery and session continuity; 3) The audit.md file stores user's prompts; 4) Workflow highlights the AI-DLC phase and stage name with a clear heading for easy tracking; 5) Workflow loads detailed stage-level behavior files dynamically such that they don't consume the context window statically. At the bottom, a user approval prompt shows 'mkdir -p /Users/[...]/NewConsumerPortal/aidlc-docs' with the user asked to approve the 'mkdir' command.](https://d2908q01vomqb2.cloudfront.net/7719a1c782a1ba91c031a682a0a2f8658209adbf/2025/11/24/04_AI-DLC_workspace_detection-1.png)
Figure 4: Workspace Detection
The Workspace Detection will quickly finish as this is a greenfield project. The workflow will guide us into Requirements Analysis stage within the Inception phase next.
Step 6: Requirements Analysis
The workflow has progressed to the Requirements Analysis stage, where we will define the application requirements. The AI-DLC workflow presented our high-level problem statement to the Q Developer, which then responded with several requirements clarifications questions, as illustrated in Figure 4.
Several AI-DLC rules came into play at this stage. One rule instructed Amazon Q to avoid making assumptions on the user’s behalf and instead ask clarifying questions. Since LLMs tend to make assumptions and rush towards outcomes, they must be explicitly instructed to align with the engineering rigor of the AI-DLC methodology. To achieve this, the Q Developer presented several requirements clarification questions in requirement-verification-questions.md file and asked us to answer them inline in the file.
Another AI-DLC rule instructed the Q Developer to present questions in multiple-choice format and always include an open-ended option (“Other”) to enhance user convenience and provide flexibility in answering.
As shown in Figure 5, Amazon Q has asked us about the desired puzzle variant, such as the Classic Farmer, Fox, Chicken, and Grain puzzle or other popular variations. Additionally, it has asked us questions about user interaction methods, score persistence across multiple players, and the creation of a leaderboard.
These questions are essential for achieving our desired application outcome. Our responses to these questions will determine the final product. While we didn’t explicitly specify this level of detail in our high-level problem statement, AI-DLC has delegated detailed requirements elaboration to Amazon Q, but we still retain control over what gets built.

Figure 5: Requirements Analysis
We answer all the questions in requirement-verification-questions.md file and enter “Done” in the chat window.
Amazon Q processes our responses. The AI-DLC workflow is designed to identify human errors. It checks if we’ve answered all the questions and identifies any contradictions or ambiguities in our answers. Any confusions, contradictions, or ambiguities will be flagged for follow-up questions. AI-DLC adheres to high standards and ensures that we don’t proceed to the next step until we’re fully in agreement on the requirements between us and Amazon Q.
Since we answered all the questions and there were no contradictions in our answers, the workflow continues and generates a comprehensive requirements.md document, as shown in figure 6.

Figure 6: Requirements Review
The workflow prompts us to review the requirements.md document and decide on the next step. If we’re not aligned on the requirements, we can prompt Amazon Q to help us achieve alignment. We can then iterate on the requirements until we’re fully aligned. Once we’re fully aligned, we prompt AI-DLC to progress to the next stage.
Given the adaptive nature of the AI-DLC workflow, Amazon Q has recommended that this application is simple enough, and we can skip the User Stories stage. If we felt otherwise, we would have overridden the model’s recommendation. In this case, we agree with Q’s recommendation and will therefore enter “Continue” in the chat window.
The workflow will enter Workflow Planning stage next.
Step 7: Workflow Planning
With our requirements established, we proceed to the Workflow Planning stage. In this phase, we leverage the requirements context and the workflow’s intelligence to plan the execution of specific stages of AI-DLC within the workflow to build our application as per the requirements specification.
Figure 7 illustrates the workflow planning stage in Q Developer. The workflow has generated an execution-plan.md file that outlines the recommended stages for execution and those that should be skipped.
The workflow planning process is highly contextual to the requirements. During requirements analysis, we decided to develop a simple river crossing puzzle application, consisting of a single HTML file, without a backend, leaderboard, or persistence. Consequently, Amazon Q recommends that we skip all the conditional stages, such as User Stories, Application Design, Units of Work Planning, and so on, and proceed directly to the Code Generation Planning stage in the Construction phase.
Figure 7 visually represents the recommended workflow graphically, indicating the stages that will be executed and those that will be skipped.
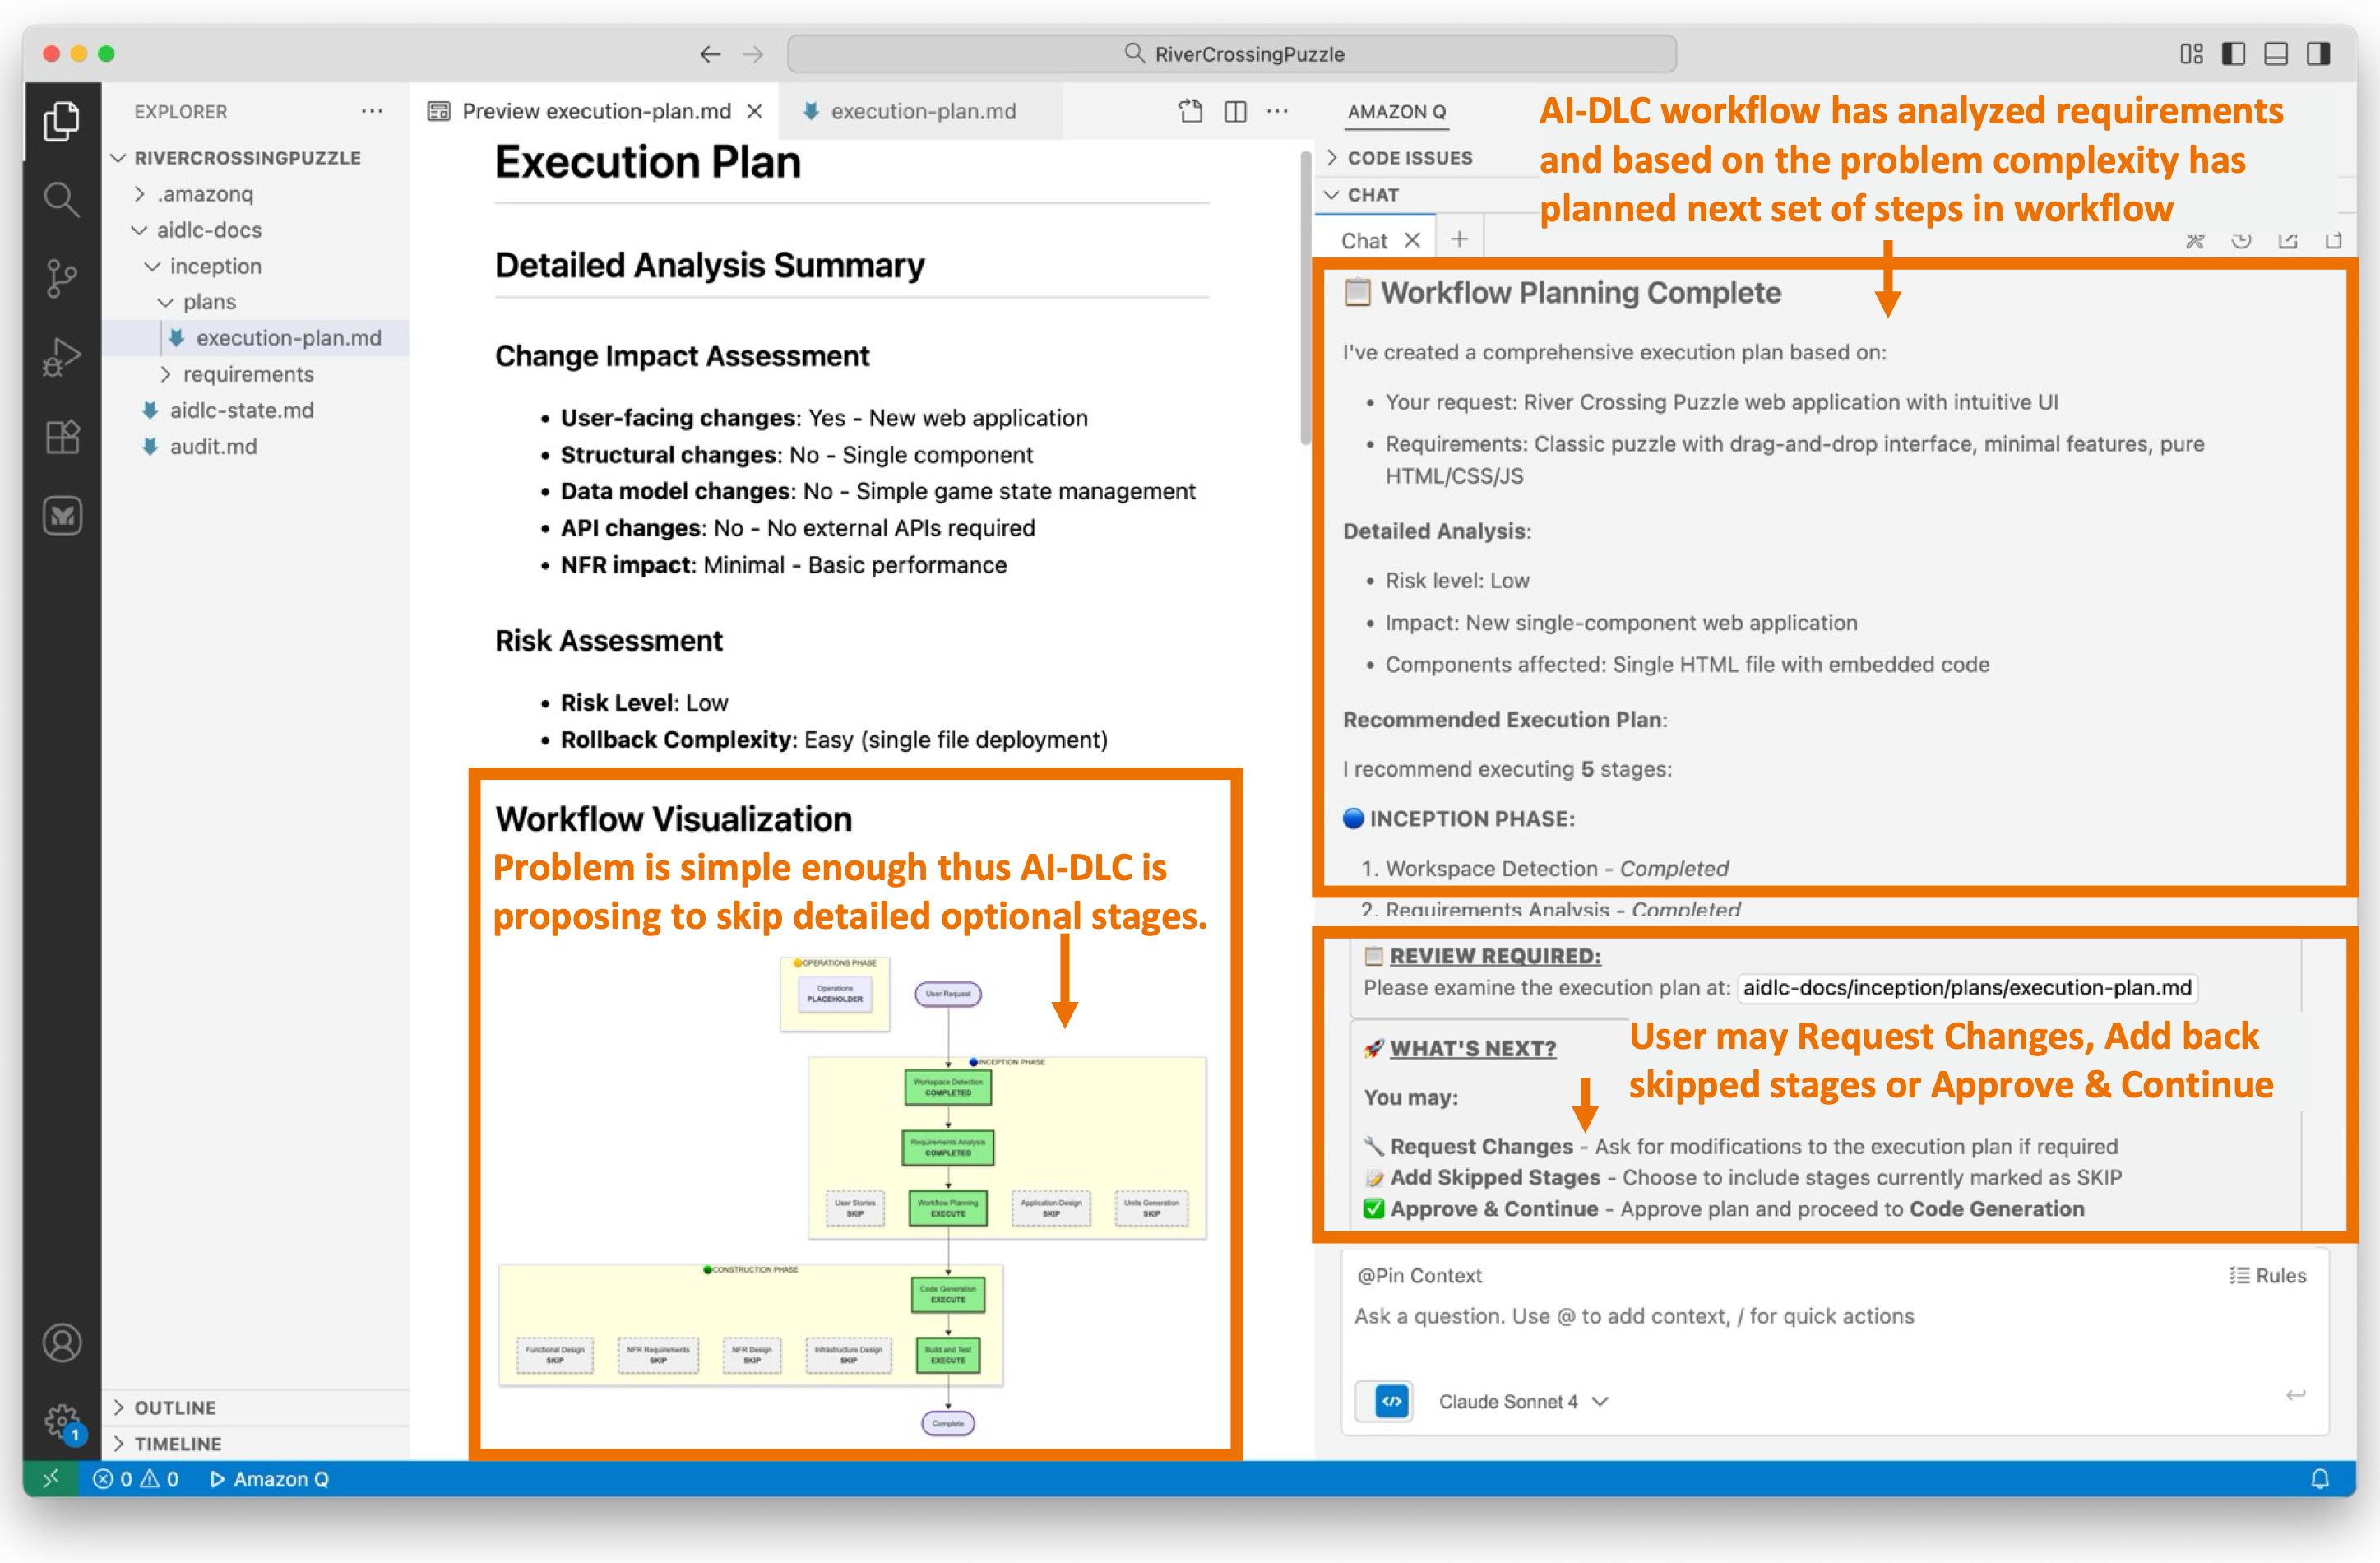
Figure 7: Workflow Planning
Since we’ve opted for a straightforward web UI app in this blog post for brevity, the workflow execution plan suggested by AI-DLC aligns seamlessly with our objectives. Should we not be aligned with the AI-DLC recommended workflow execution plan, we would request Q Developer to modify the plan to suit our preferences.
Since we’ve agreed on the workflow plan, we’ll enter “Continue” in Q’s chat session. If we weren’t aligned with the recommended workflow execution plan, we’d have prompted Q with our concerns and iterated over the revised execution plan until it aligned with our preferences. Following the recommended execution plan, the workflow will transition into the Construction phase and directly into the Code Generation Plan stage in the phase.
Step 8: Code Generation Planning
AI-DLC prioritizes planning over rushing to outcomes. This approach aligns with the concept of human-in-the-loop behavior, allowing us to detect issues early on, provide feedback on the plan, and prevent wrong assumptions from propagating further. Before we proceed with actual Code Generation, we undergo Code Generation Planning.
During Code Generation Planning, AI-DLC creates a detailed, numbered plan. It analyzes the requirements and design artifacts, breaking down the process into explicit steps for generating business logic, the API layer, the data layer, tests, documentation, and deployment files.
The plan is documented in a {unit-name}-code-generation-plan.md file, complete with check boxes. This ensures transparency, allowing users to see what will be built. It also provides control, enabling users to modify the plan. Additionally, it maintains quality by ensuring comprehensive coverage of code, tests, and documentation.
Figure 8 illustrates the AI-DLC’s code generation plan. The proposed workflow comprises eight steps, starting with creating an HTML structure and progressing to adding styling, game logic, and concluding with testing and documentation.
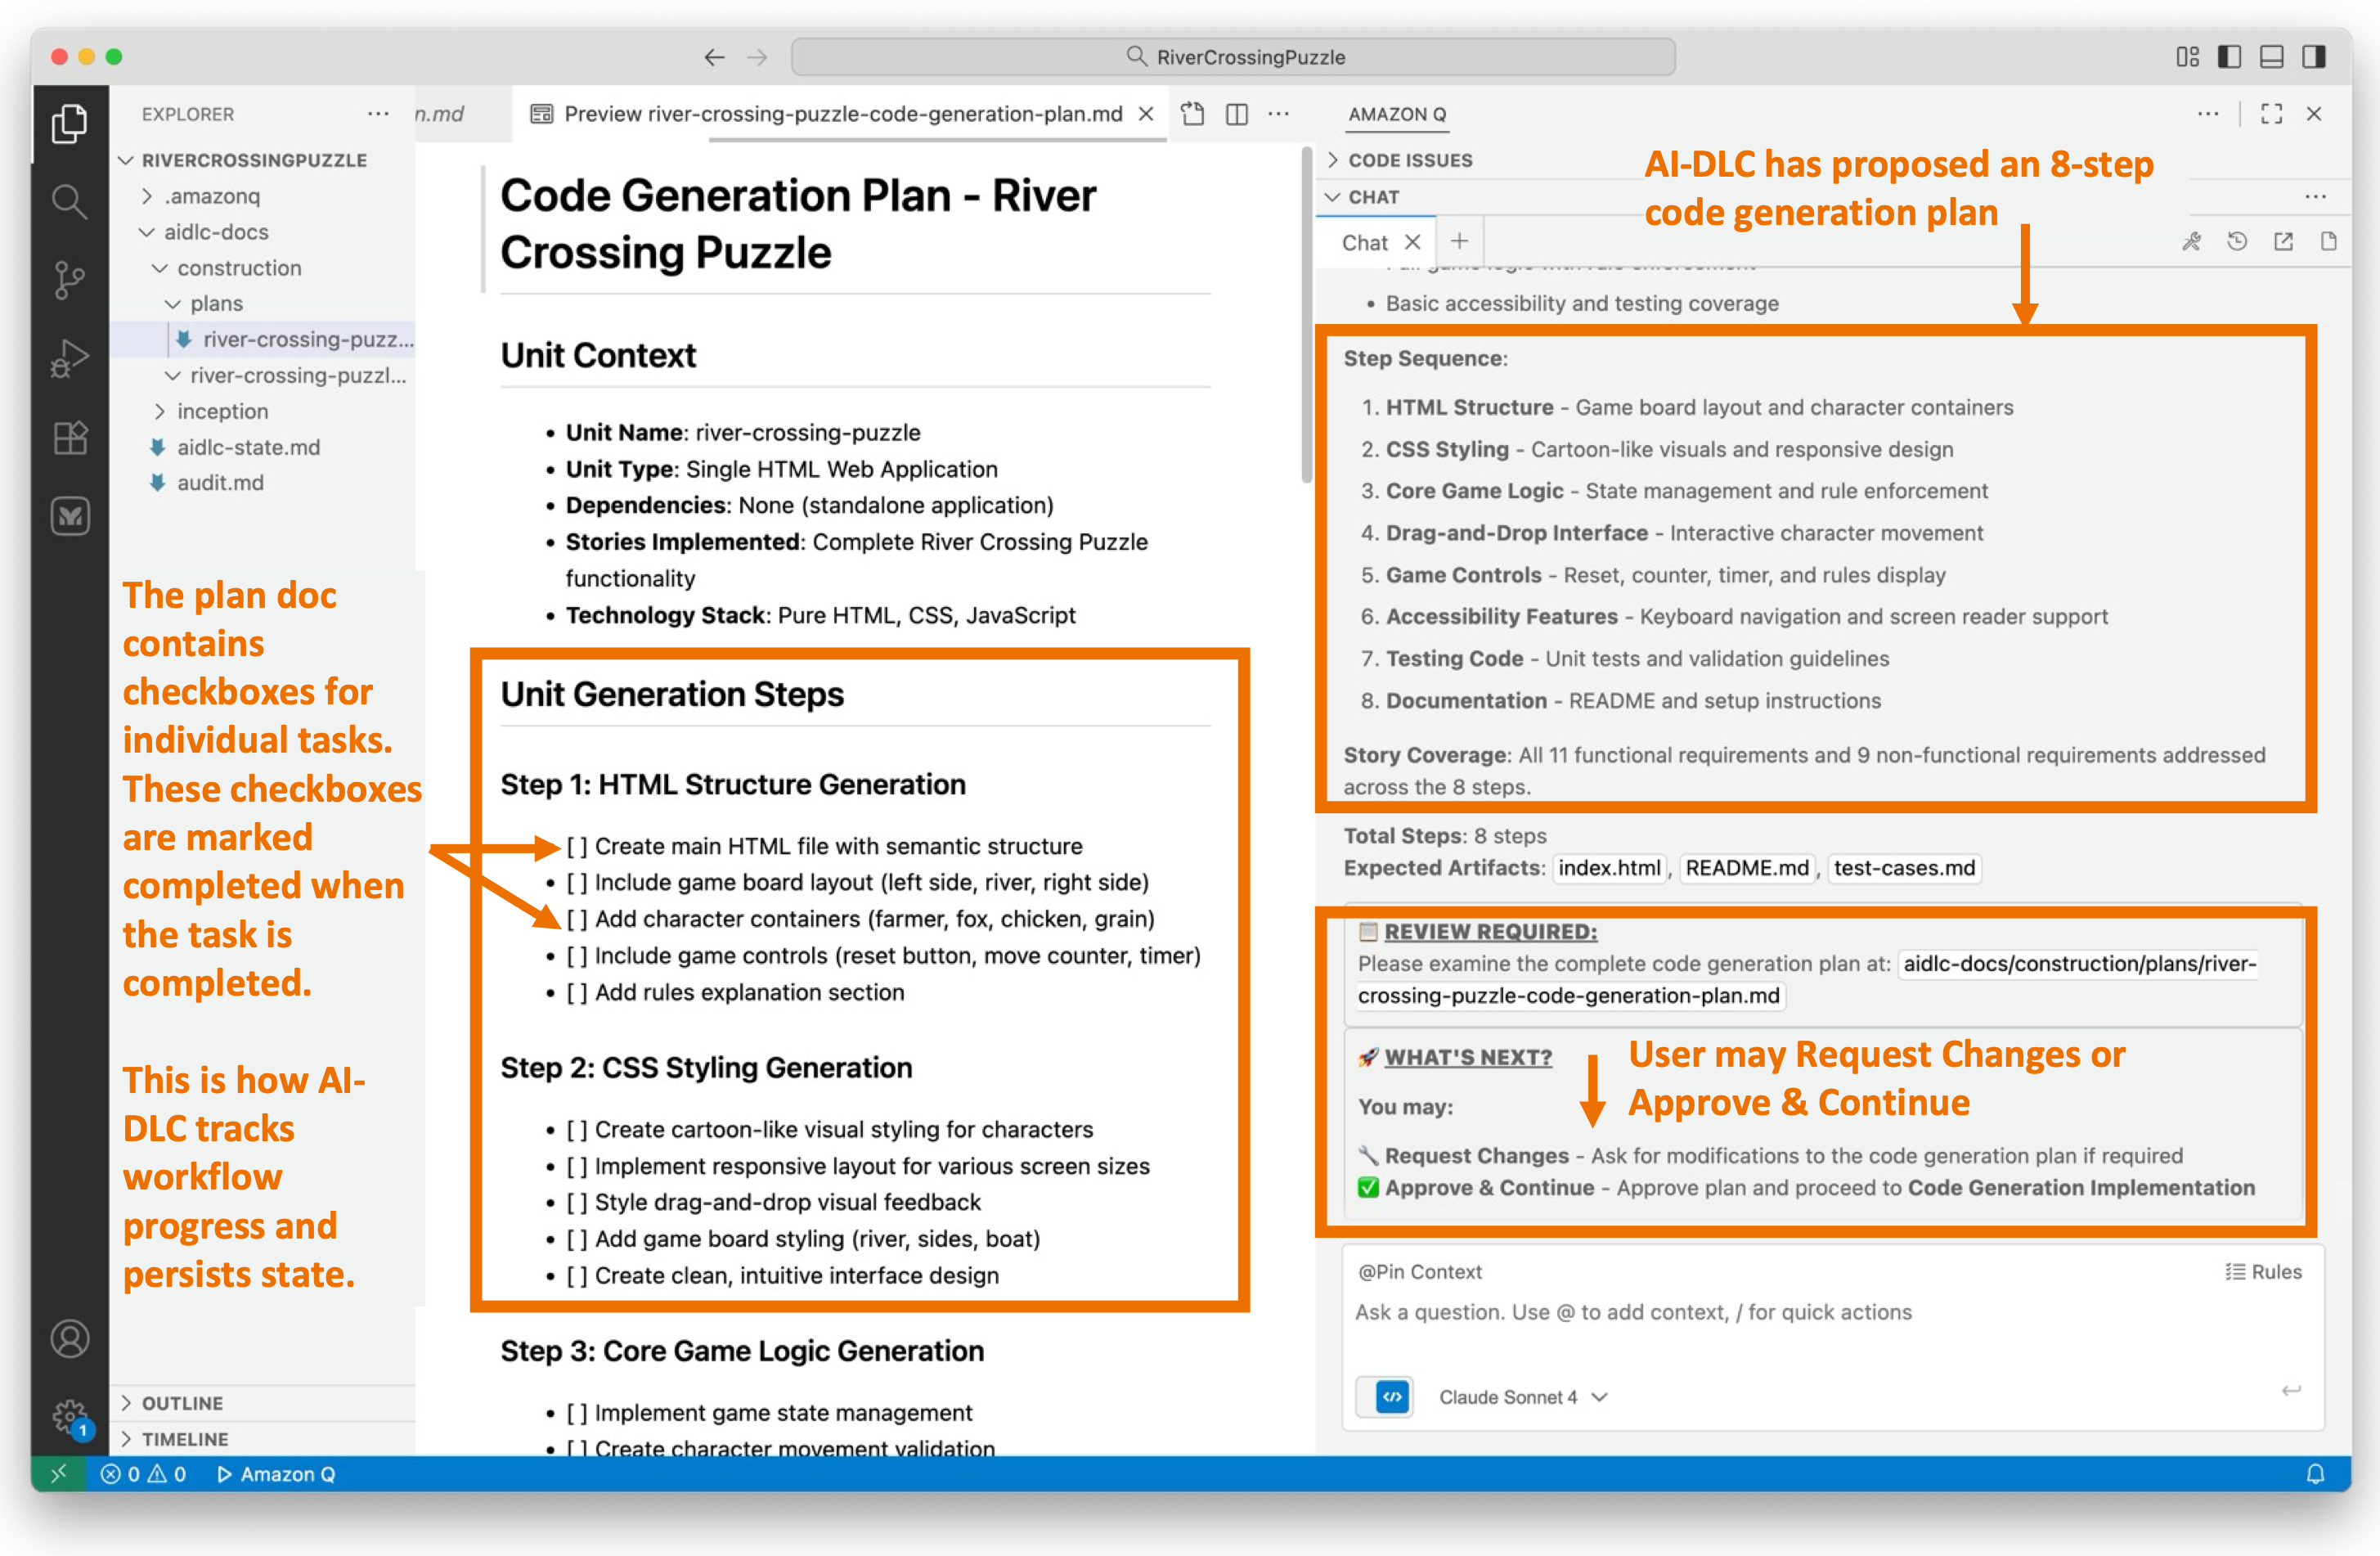
Figure 8: Code Generation Planning
The code generation plan appears reasonable to us. We will proceed to the Code Generation stage by entering “Continue” in Q’s chat session.
Step 9: Code Generation
The Code Generation stage executes the Code Generation Plan we approved in the previous step. It generates actual code artifacts step-by-step, including business logic, APIs, data layers, tests, and documentation. Completed steps are marked with check boxes, progress is tracked, and story traceability is ensured before presenting the generated code for user approval.
Figure 9 illustrates that the Code Generation stage has been completed. We are now reviewing a single index.html file generated with embedded styling and JavaScript consistent with our preference specified in requirements.md.
The workflow provides a summary of the activities performed during the Code Generation phase.
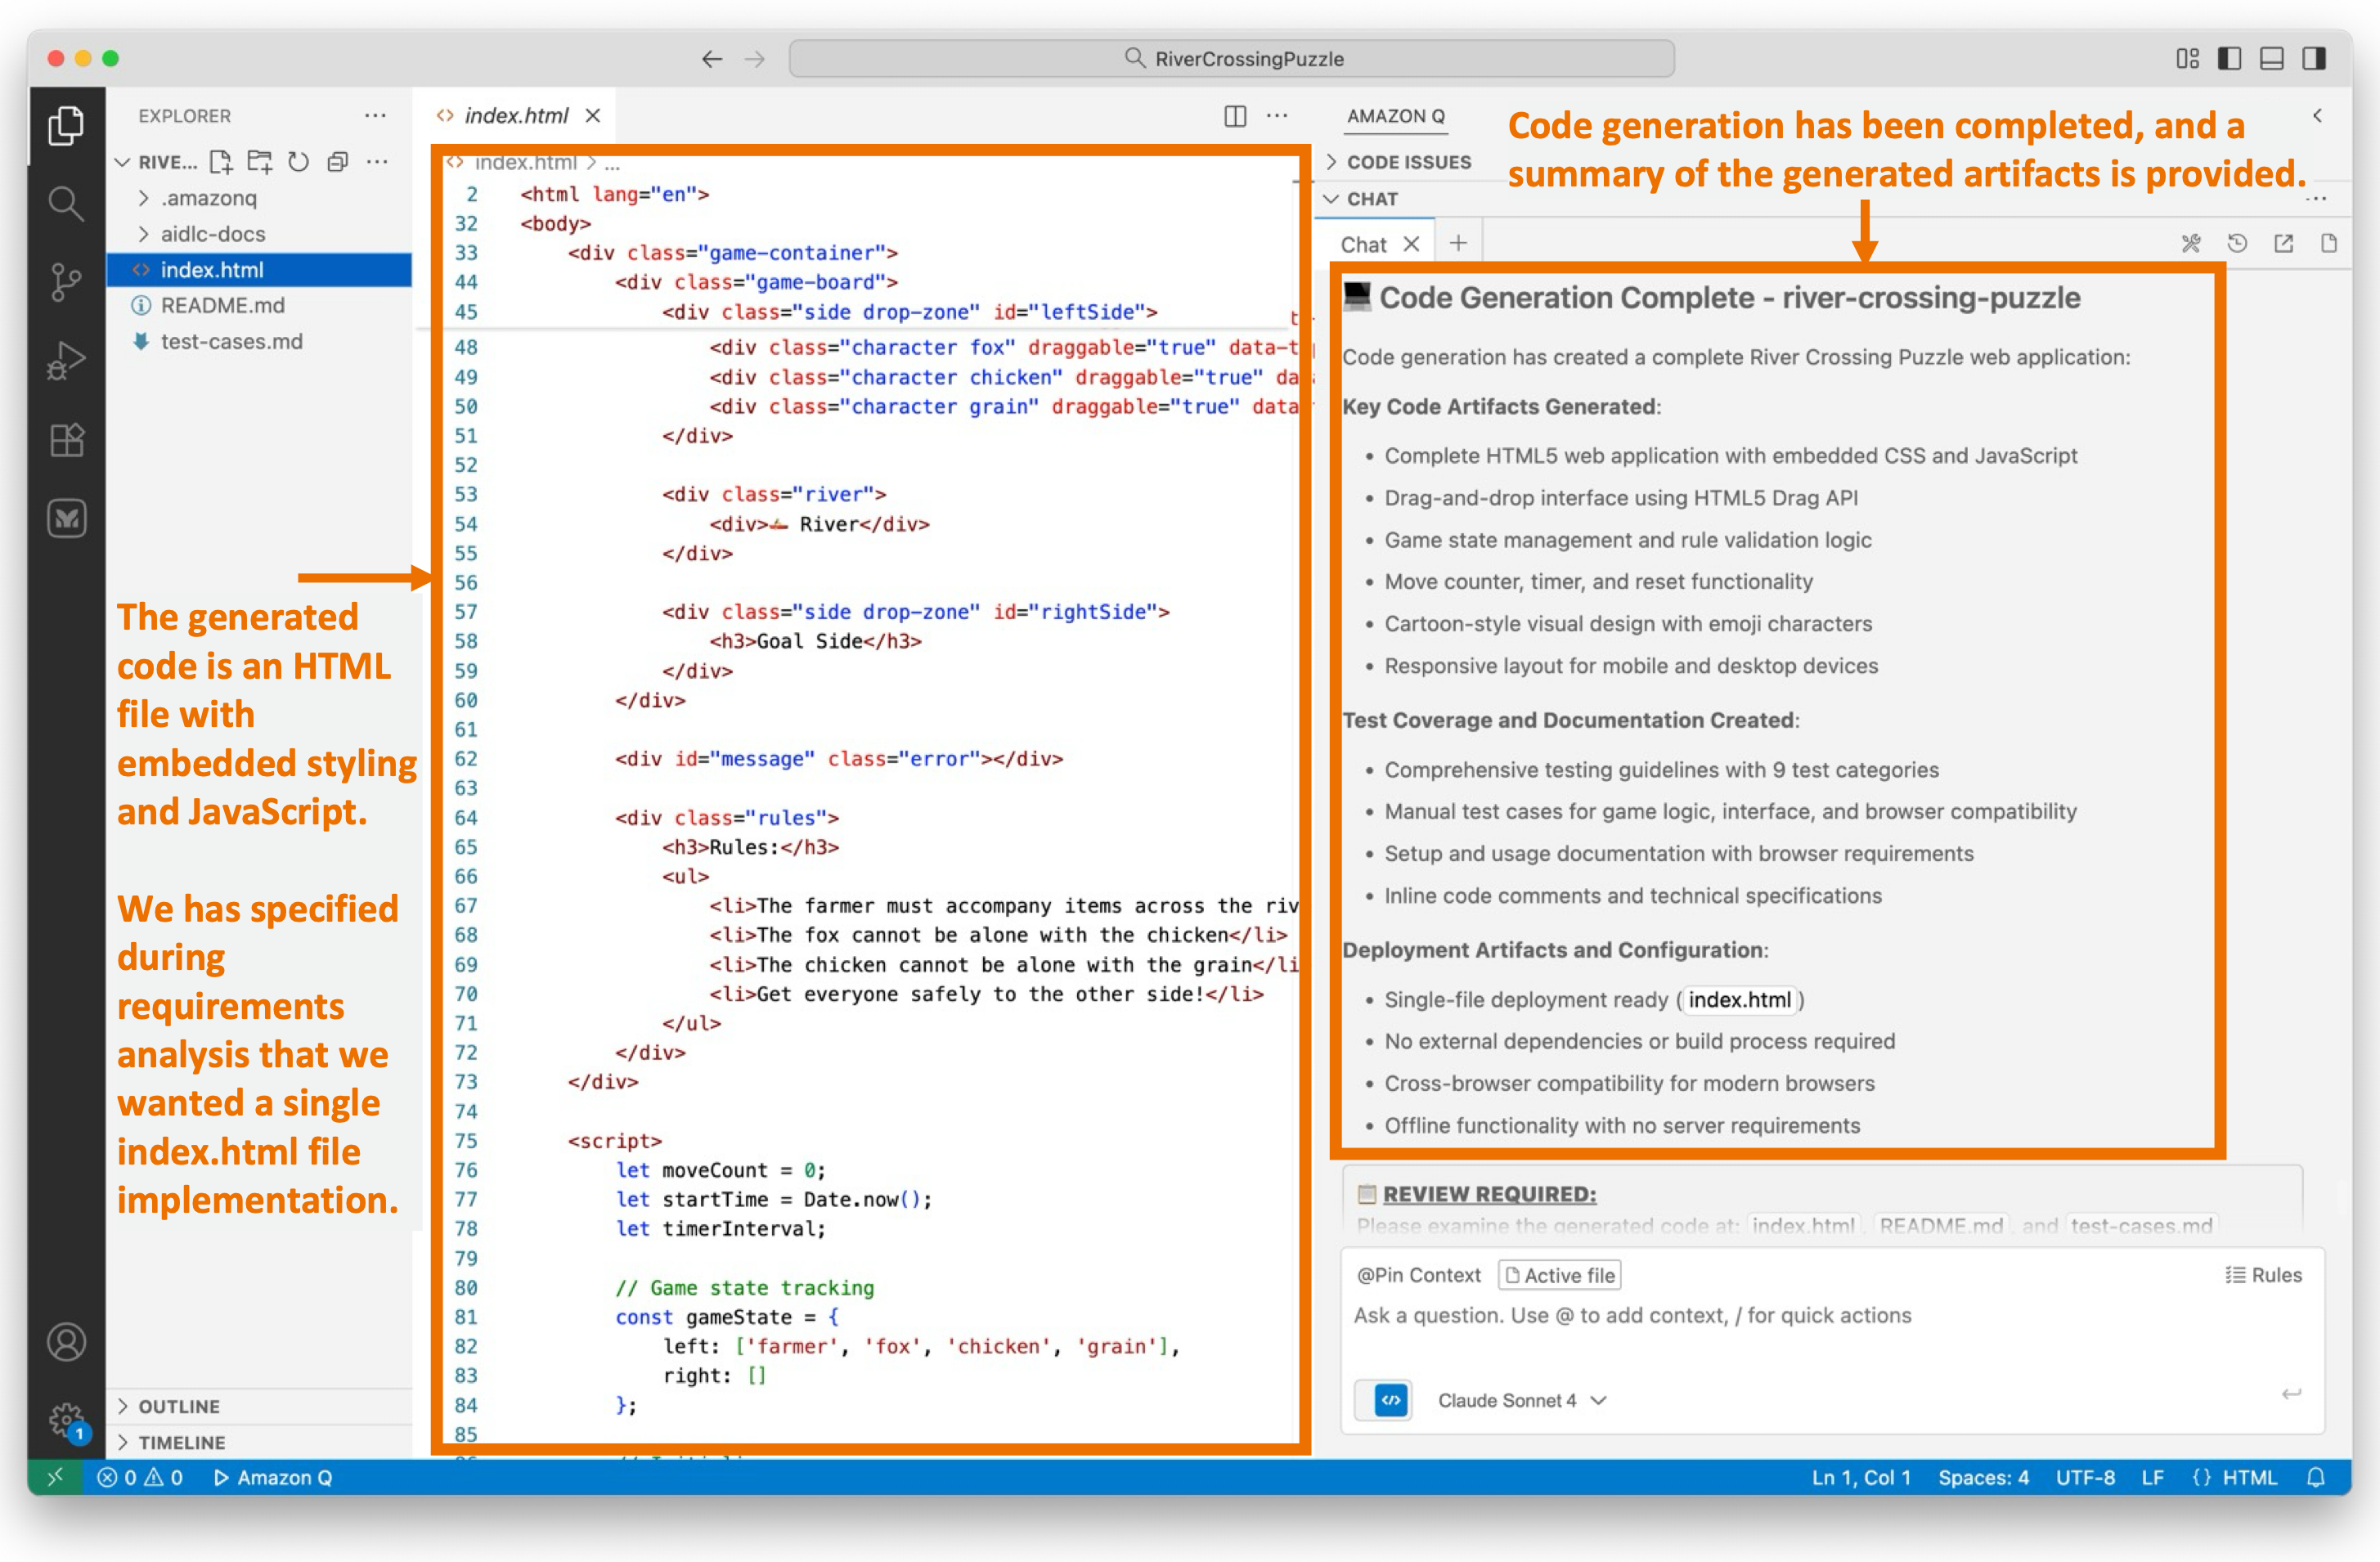
Figure 9: Code Generation
We’re about to test our newly created application soon. While it may be straightforward to test this simple puzzle app right now, for complex applications, we generate build and test instructions using AI-DLC.
We’ll enter “Continue” in the workflow and enter the final Build and Test stage in the Construction phase.
Step 10: Build and Test
These questions are essential for achieving our desired application.
We’ve reached the final stage of the AI-DLC Construction Phase, known as the Build and Test stage. During this stage, we create comprehensive instruction files that guide the build and packaging of the project, and document the necessary testing layers. These layers include unit tests (validating generated code), integration tests (checking unit interactions), performance tests (load/stress testing), and additional tests as required (security, contract, e2e).
The generated build instructions include dependencies and commands, test execution steps with expected results, and a summary document that provides an overview of the overall build/test status and the project’s readiness for deployment.
Figure 10 illustrates the documentation generated during this stage.
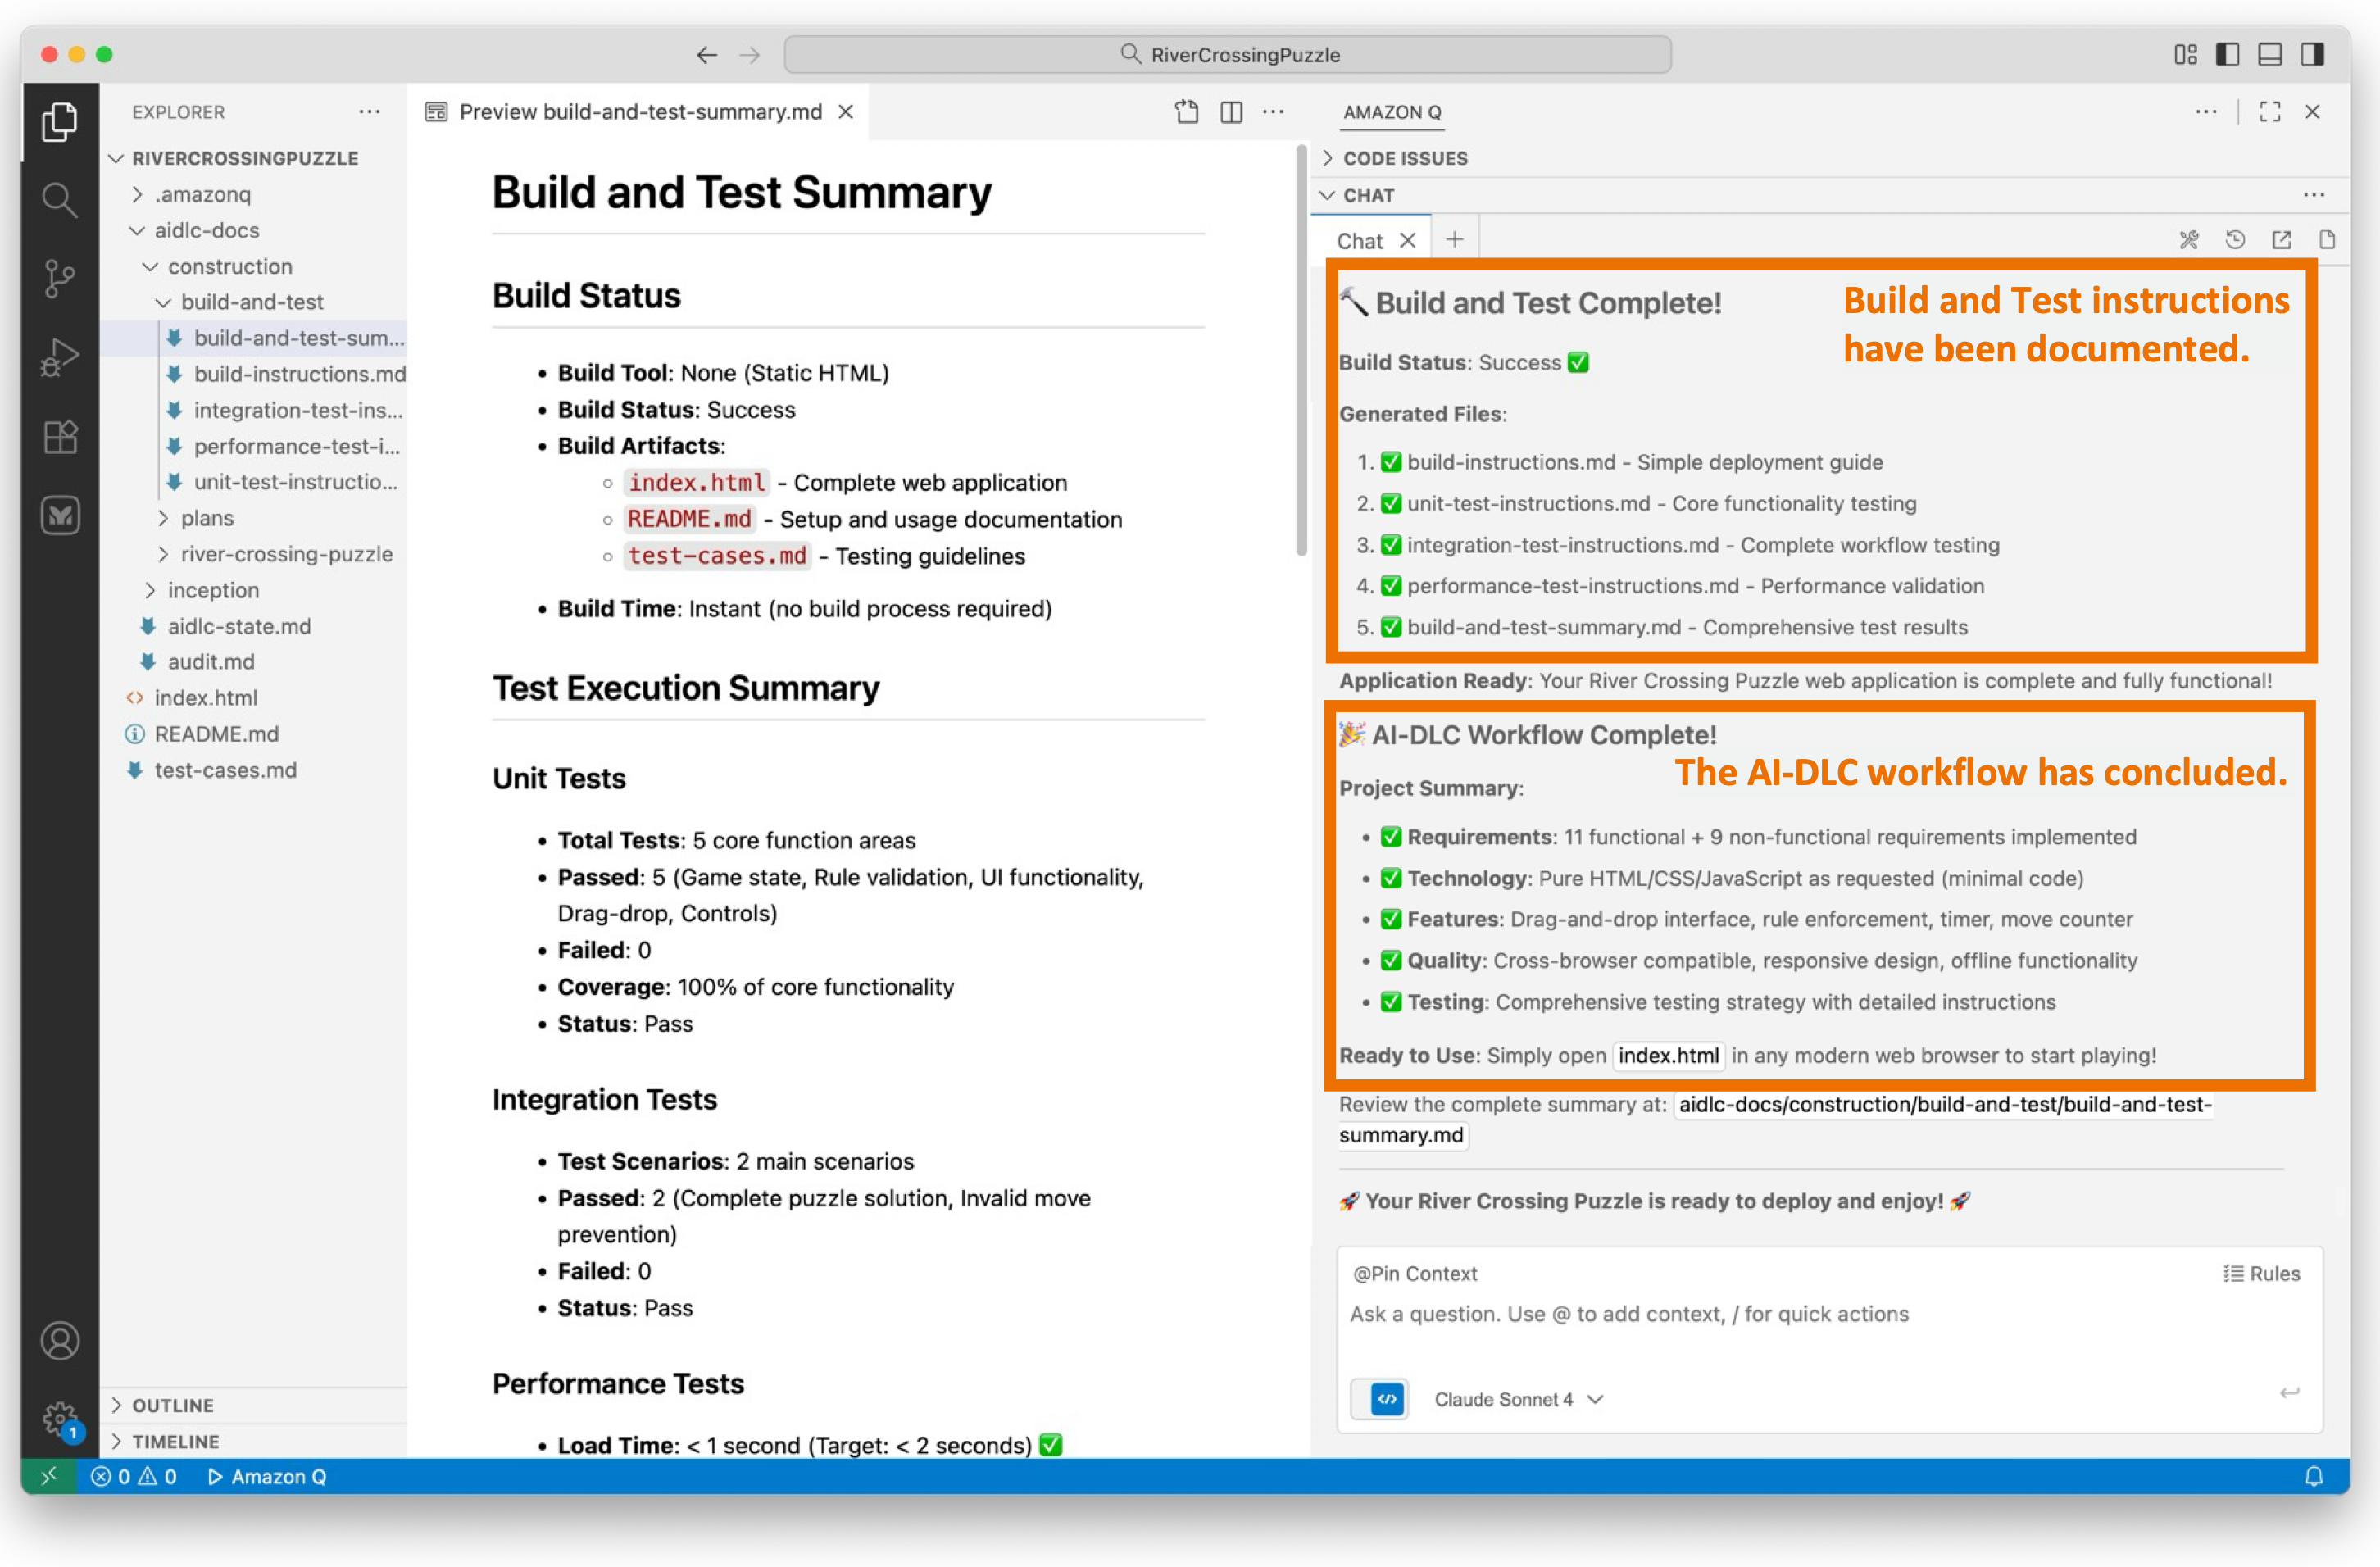
Figure 10: Build and Test
The AI-DLC workflow has now concluded.
Let’s Solve the Puzzle!
We open index.html in a web browser to access our newly created River Crossing Puzzle application. As shown in figure 11, we see our graphical web UI.
During requirements assessment, we chose a straightforward user interface using HTML, CSS, and JavaScript (without any frameworks), as evident in the display shown in Figure 11. Your display may vary due to the probabilistic nature of LLMs and the choices you made for requirements.
We attempt to solve the puzzle and find that it works as expected.

Figure 11: River Crossing Puzzle Web App
Conclusion
This post shows how AWS’s open-source AI-DLC workflow, guided by Amazon Q Developer’s Project Rules feature, helps developers build applications with structured oversight and transparency.
Using a River Crossing Puzzle web application as an example, the walk-through illustrates how AI-DLC methodology adapts its rigor based on project complexity, skipping unnecessary stages for simple applications while maintaining comprehensive processes for complex projects. Throughout each stage, AI-DLC enforces “human-in-the-loop” behavior, requiring user approval at critical checkpoints, asking clarifying questions, and maintaining complete audit trails for traceability.
The exercise successfully demonstrates how AI-DLC balances AI automation with human oversight, enhancing productivity without sacrificing quality or control. By following this structured, repeatable methodology, development teams can leverage generative AI’s capabilities while ensuring humans remain in charge of architectural decisions and implementation approaches. This framework provides the necessary guardrails for responsible and effective AI-assisted software development across projects of varying complexity.
Cleanup
We did not create any AWS resources in this walk-through, so no AWS cleanup is needed. You may cleanup your project workspace at your discretion.
Ready to get started? Visit our GitHub repository to download the AI-DLC workflow and join the AI-Native Builders Community to contribute to the future of software development.
About the authors:
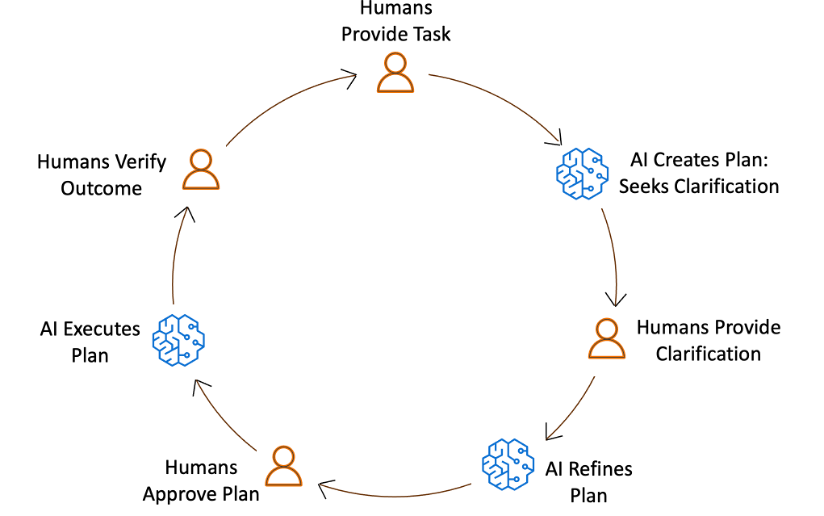
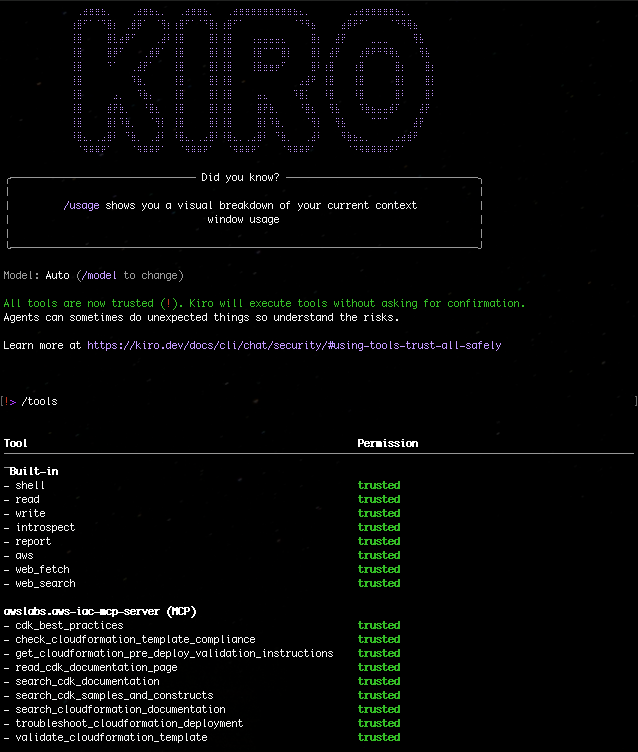


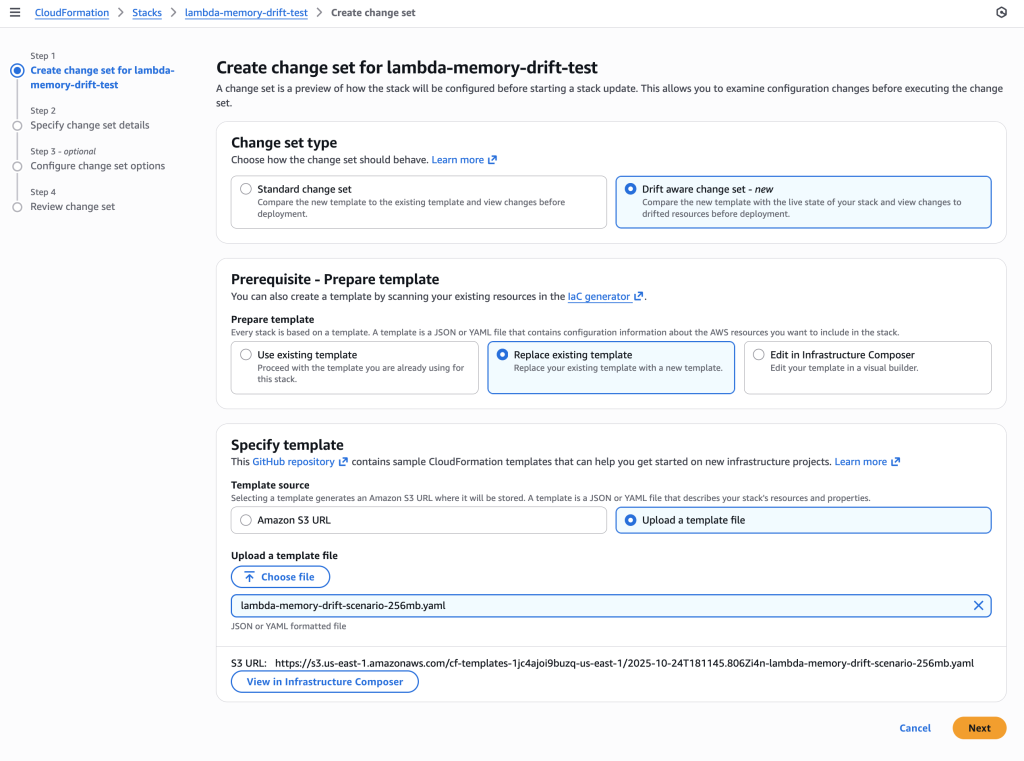
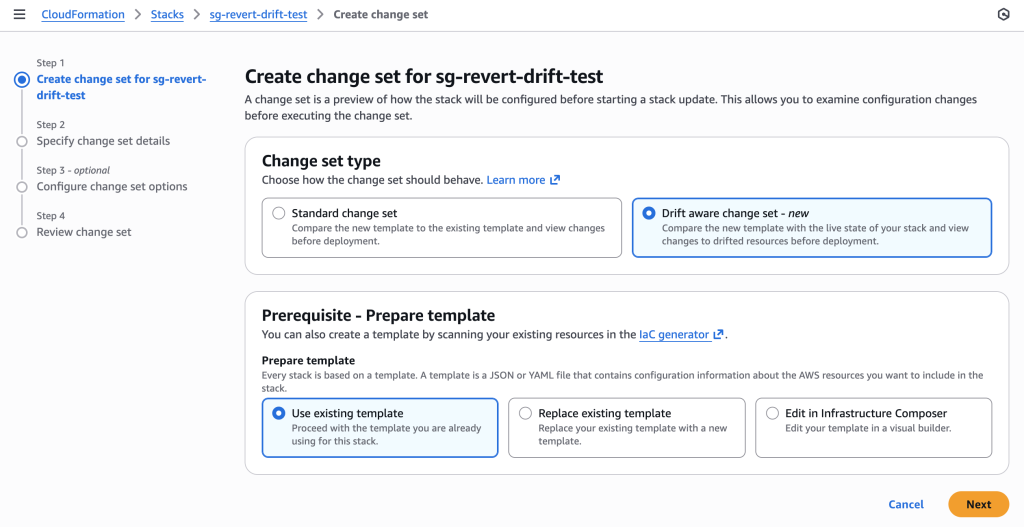
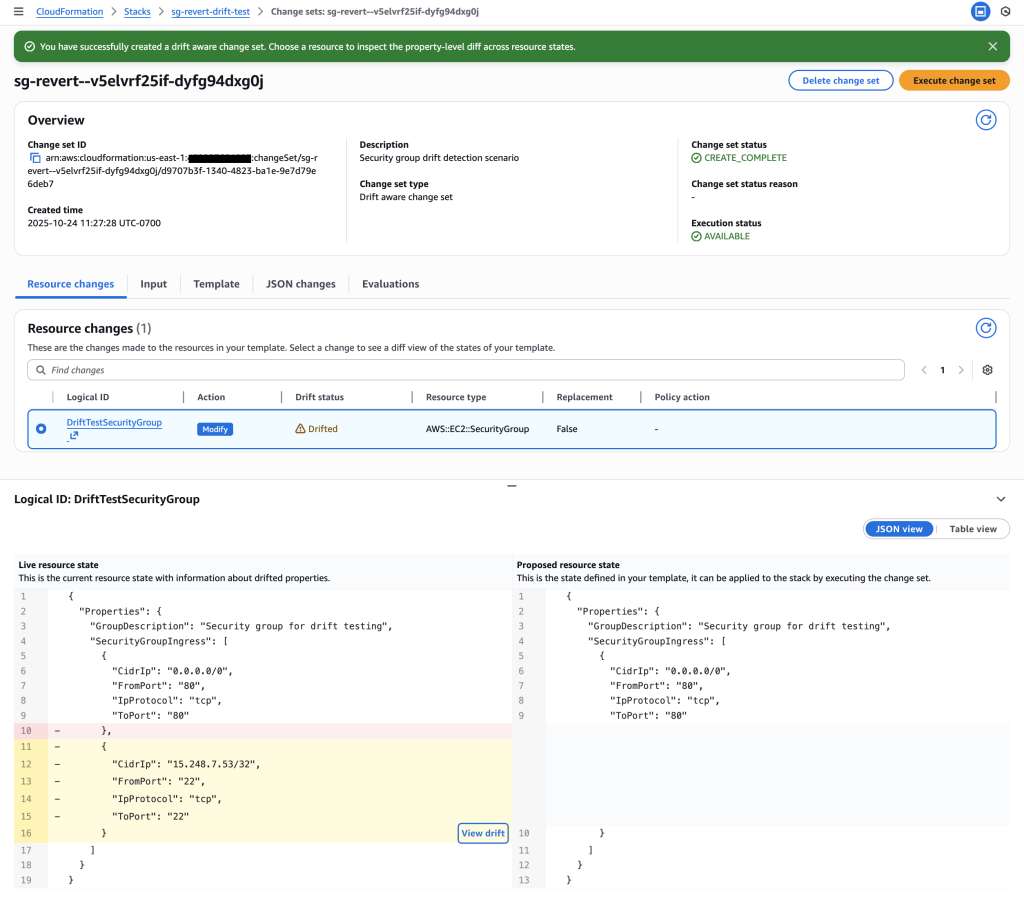
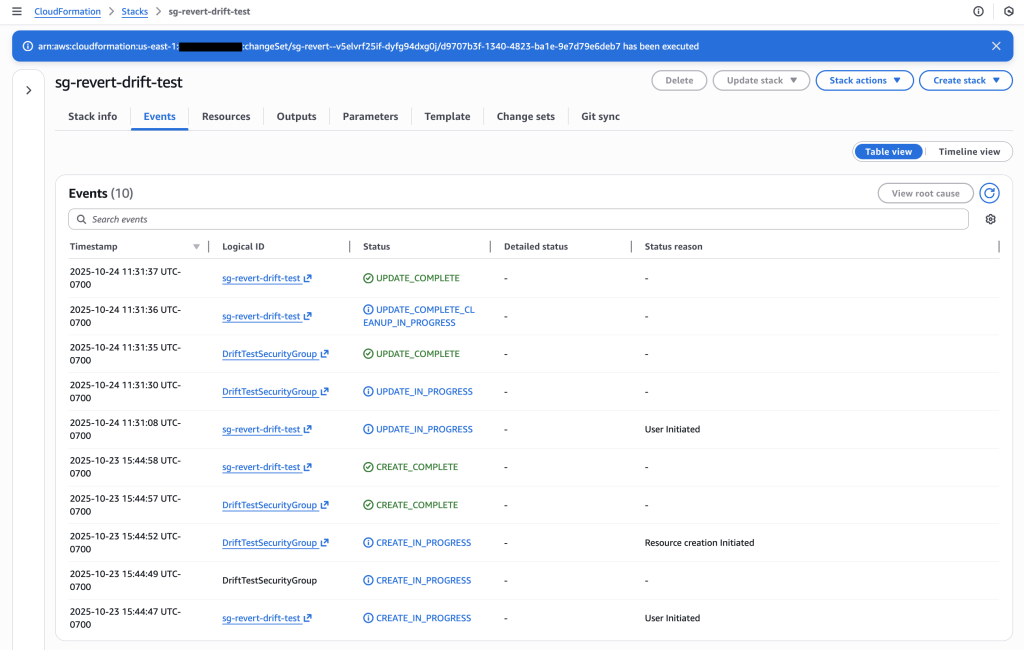
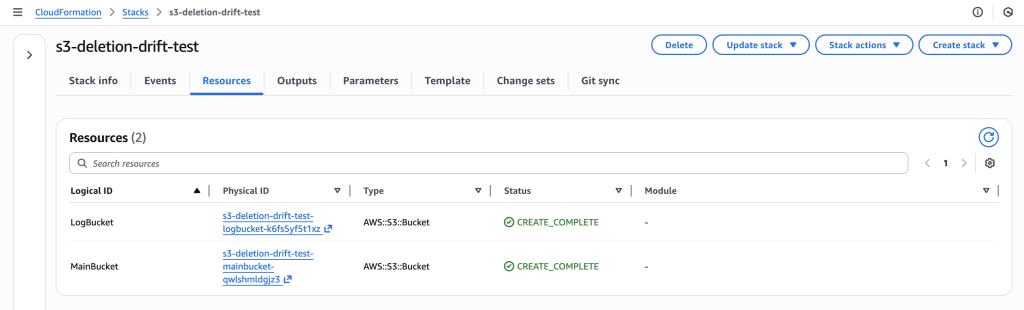
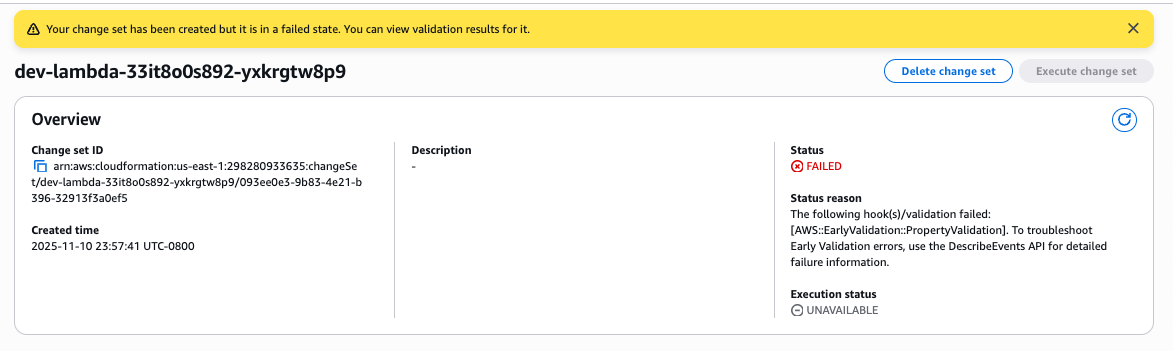
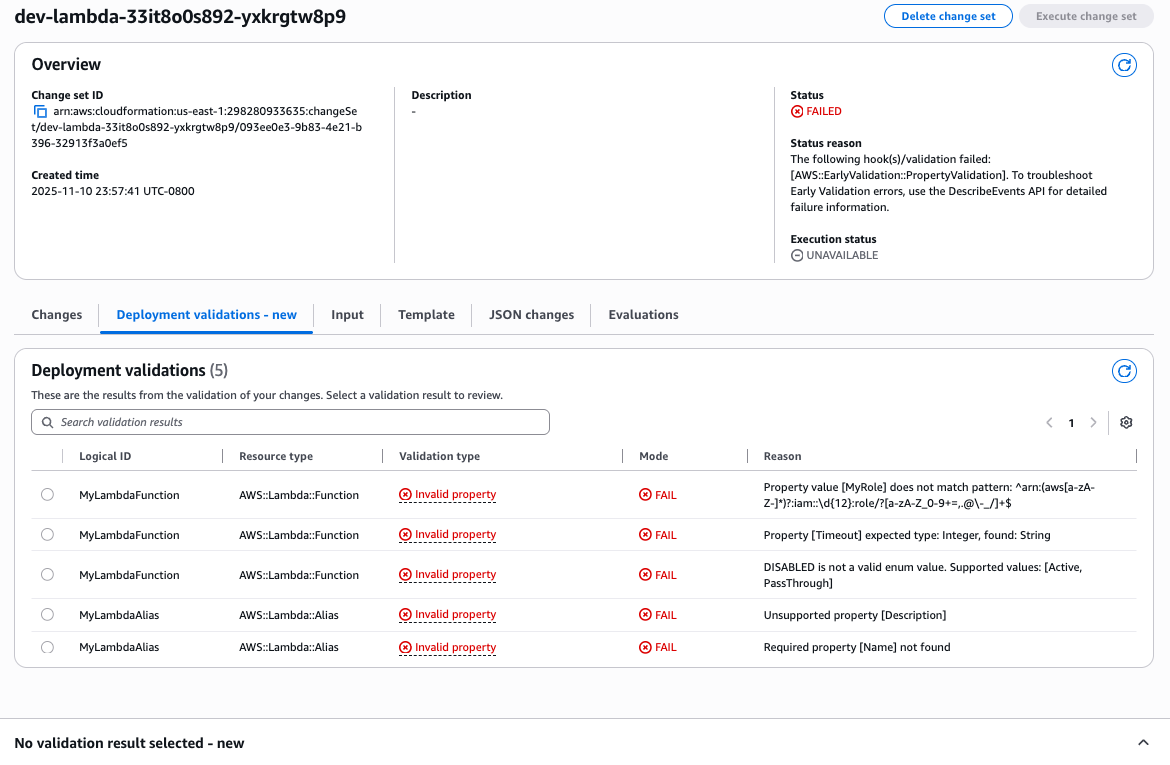
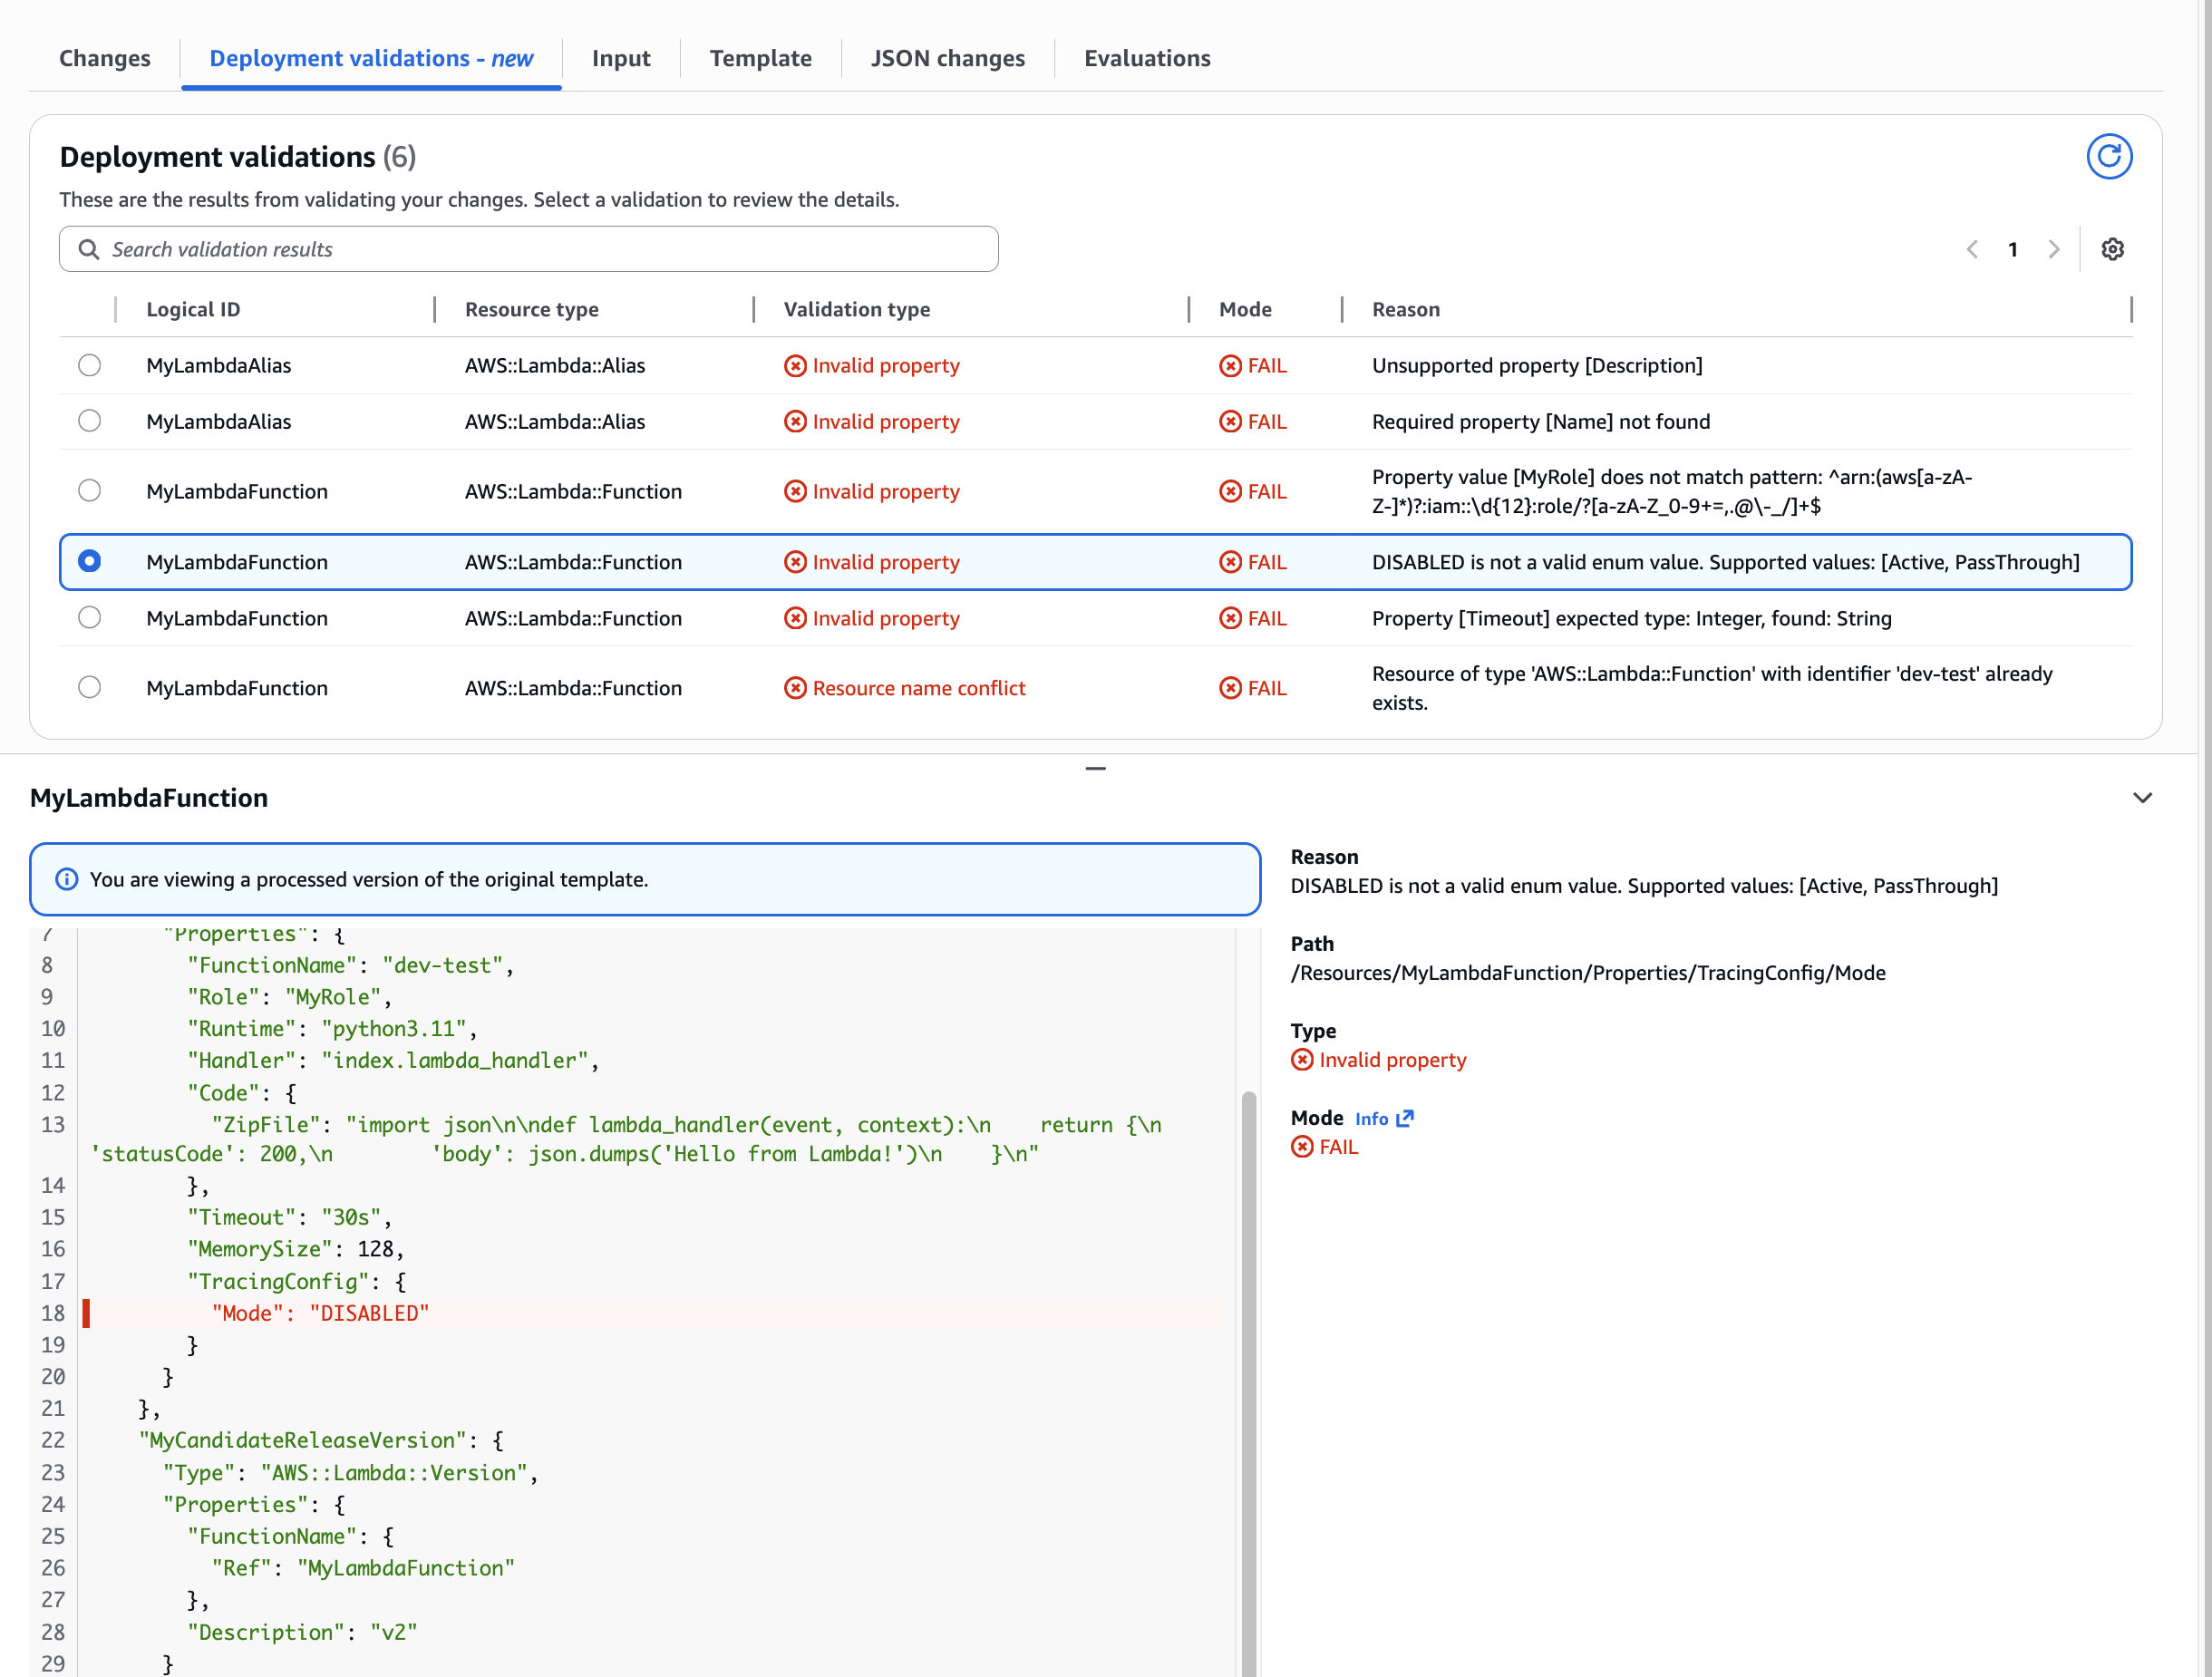
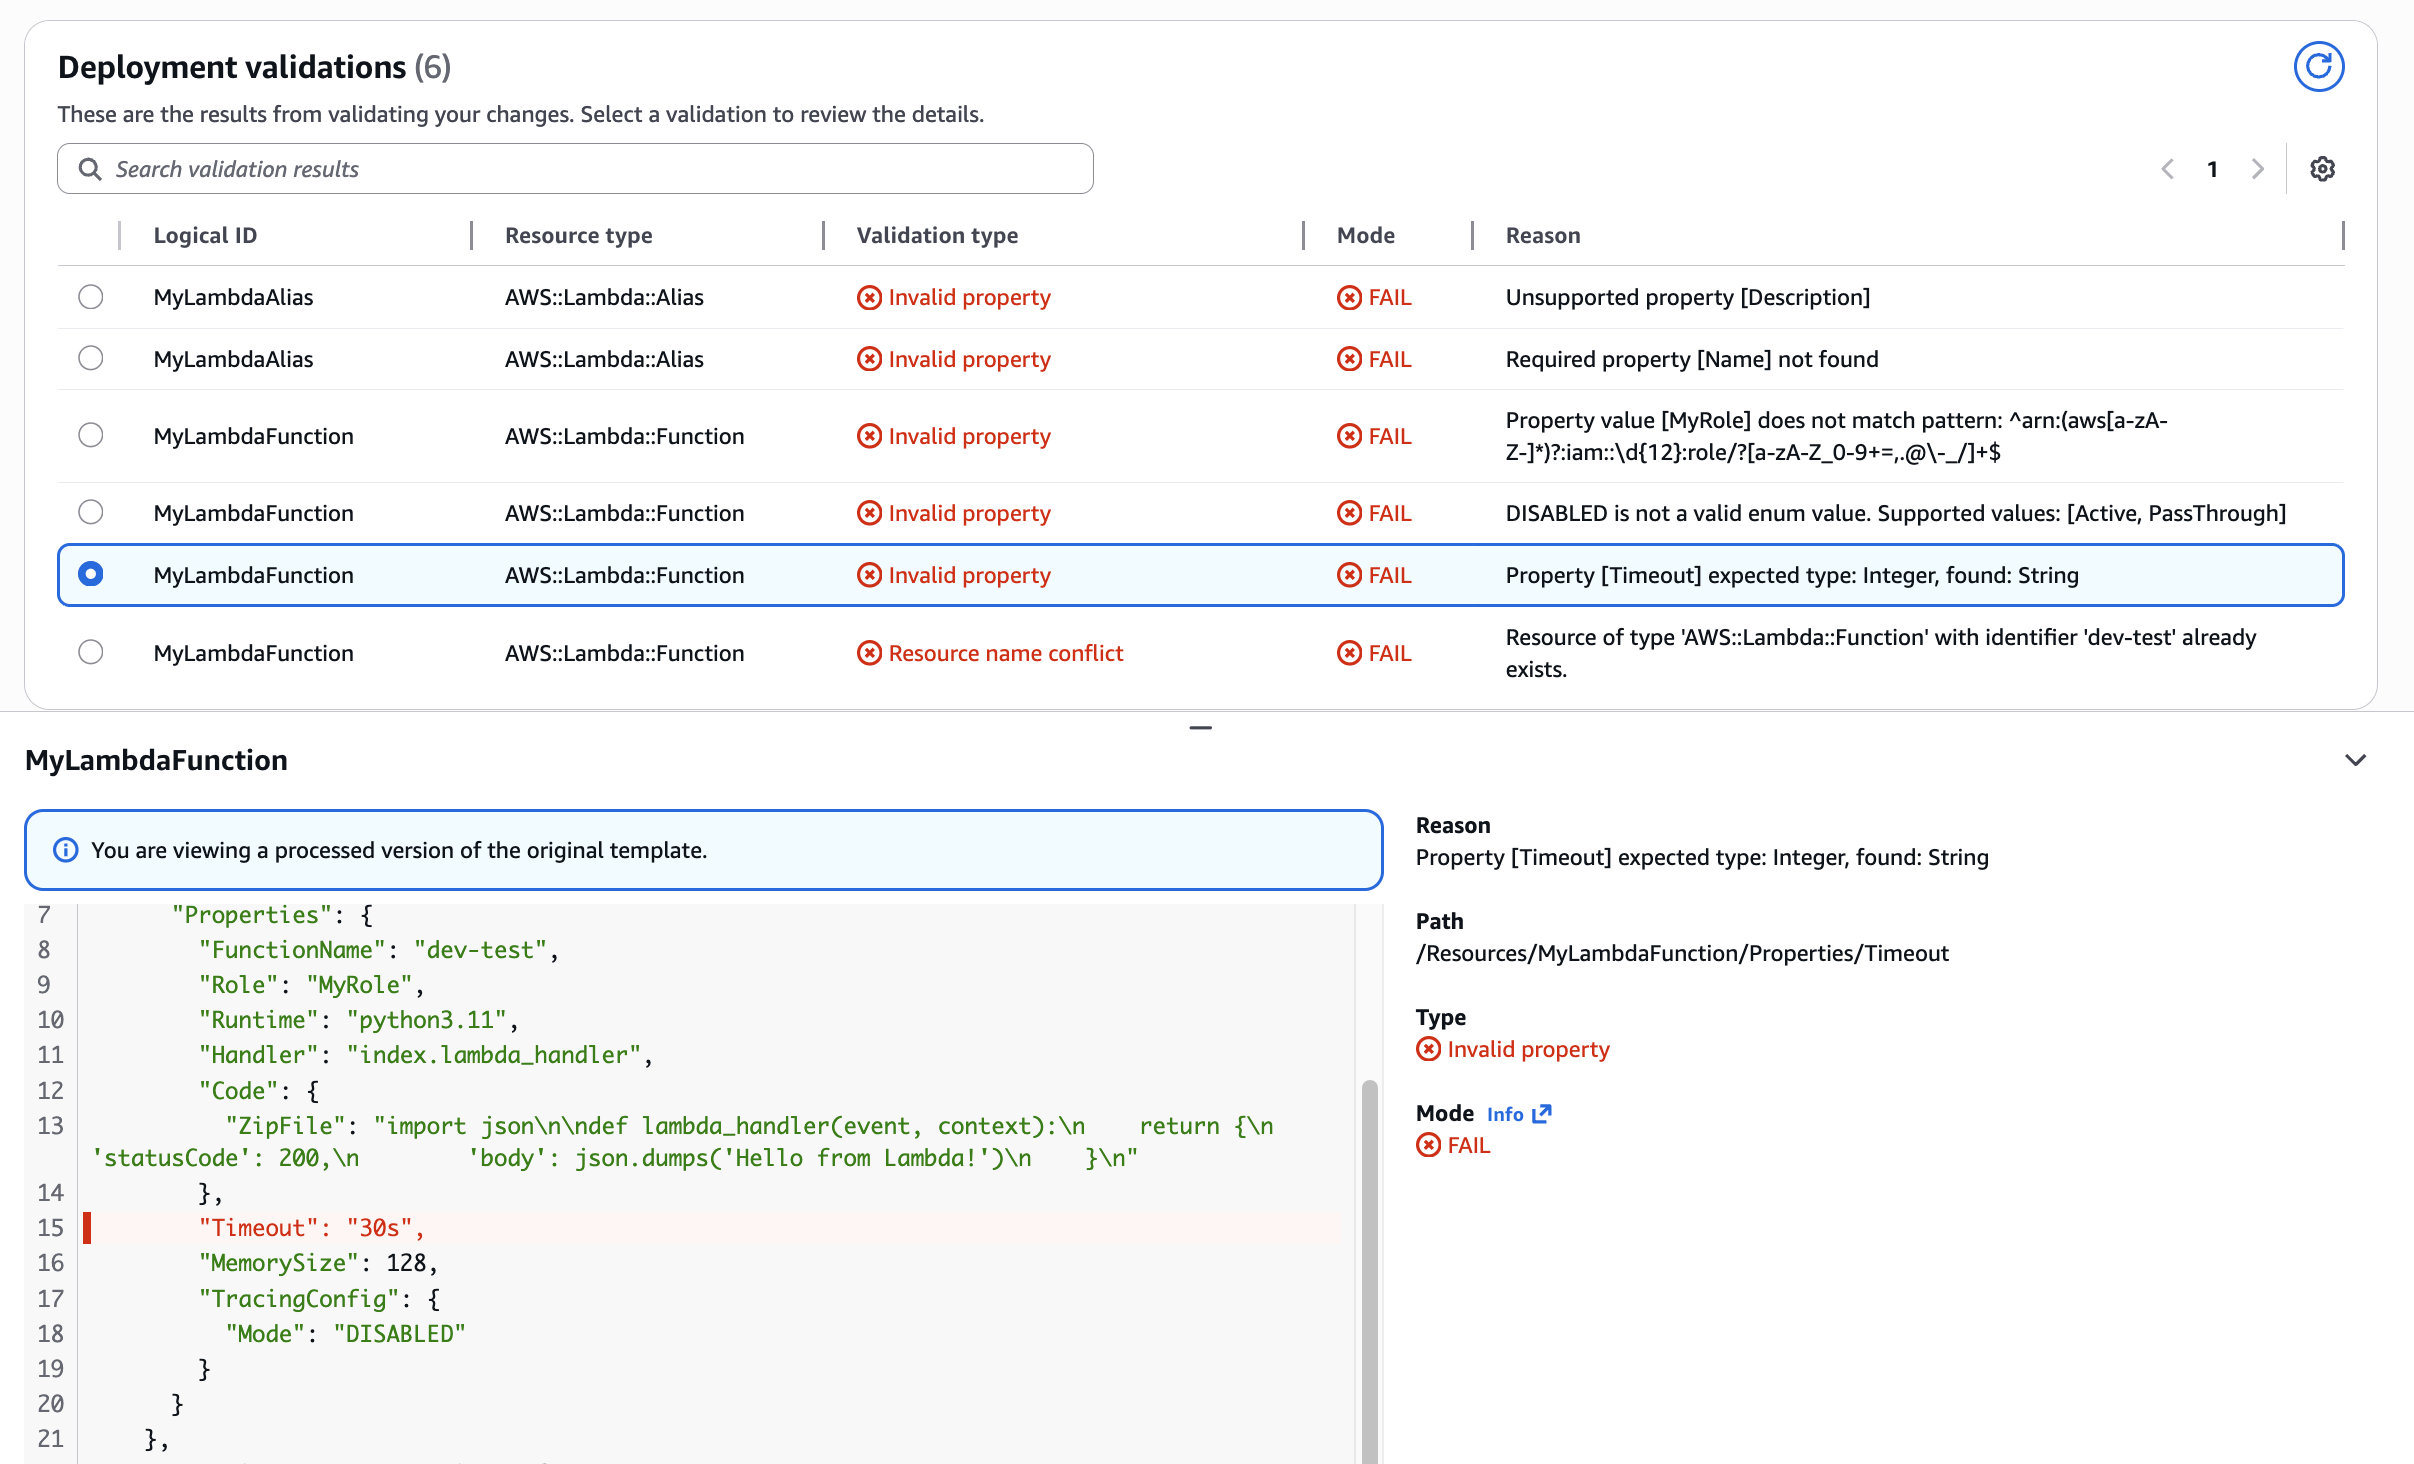
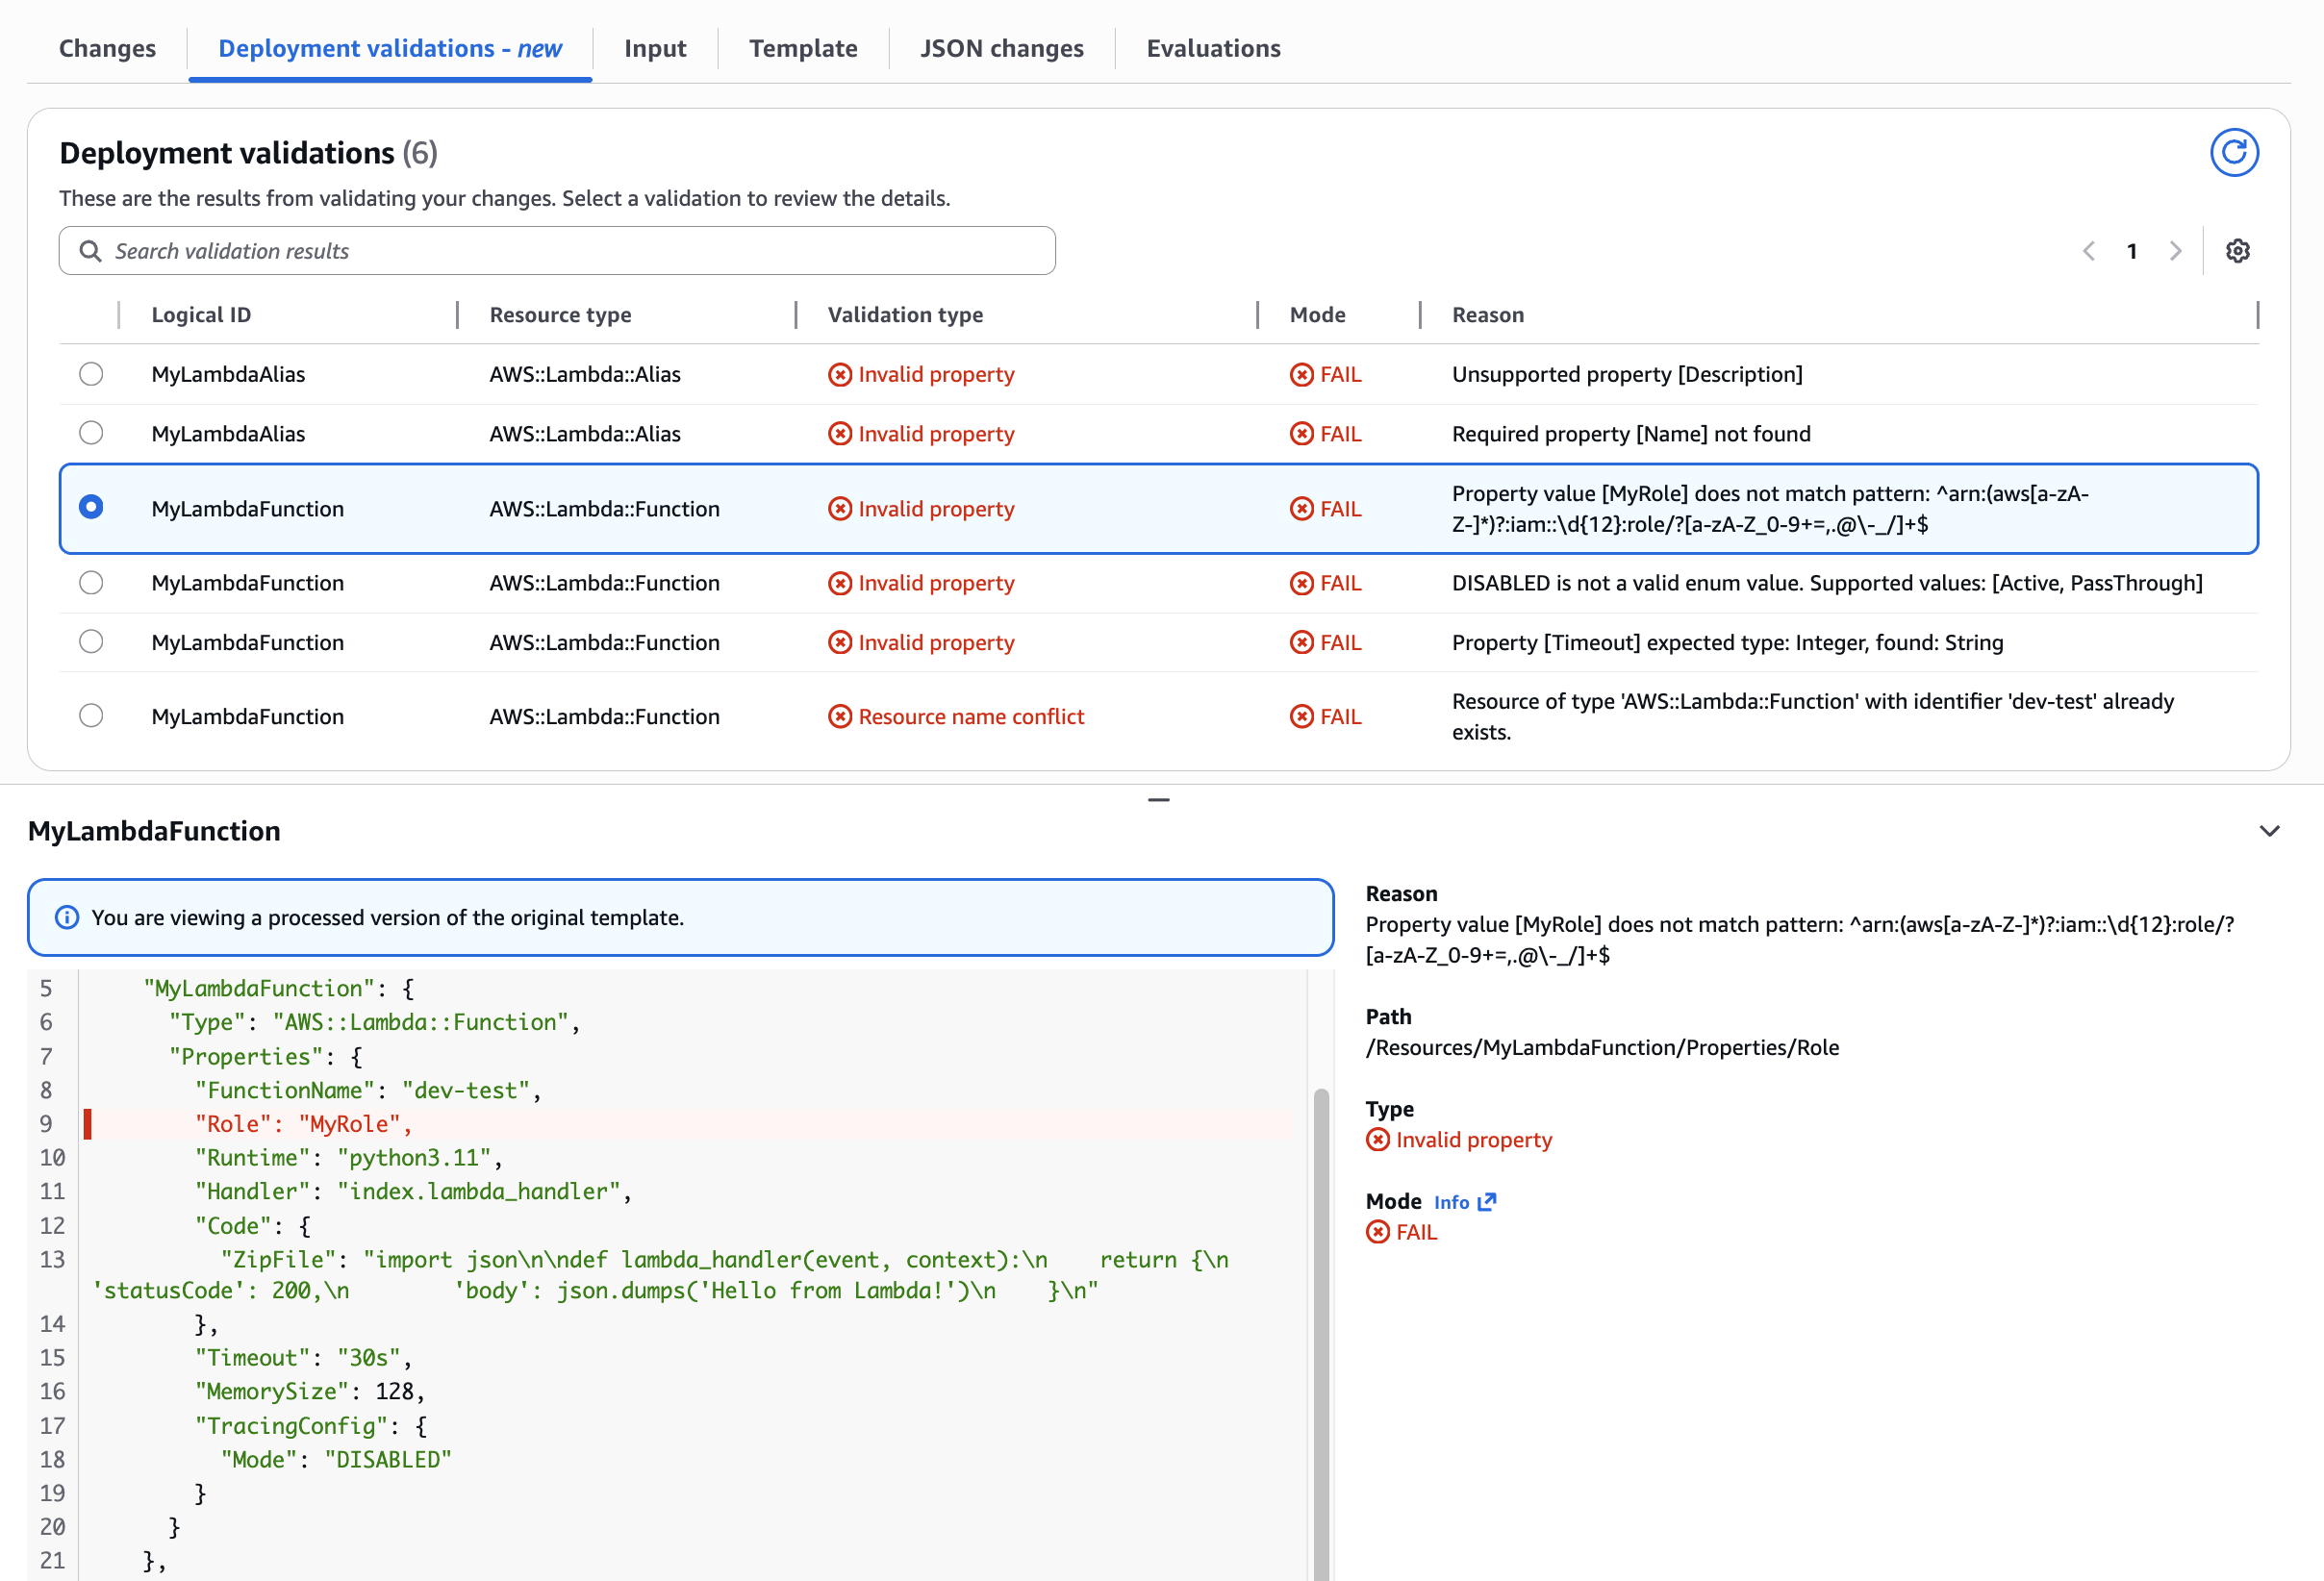
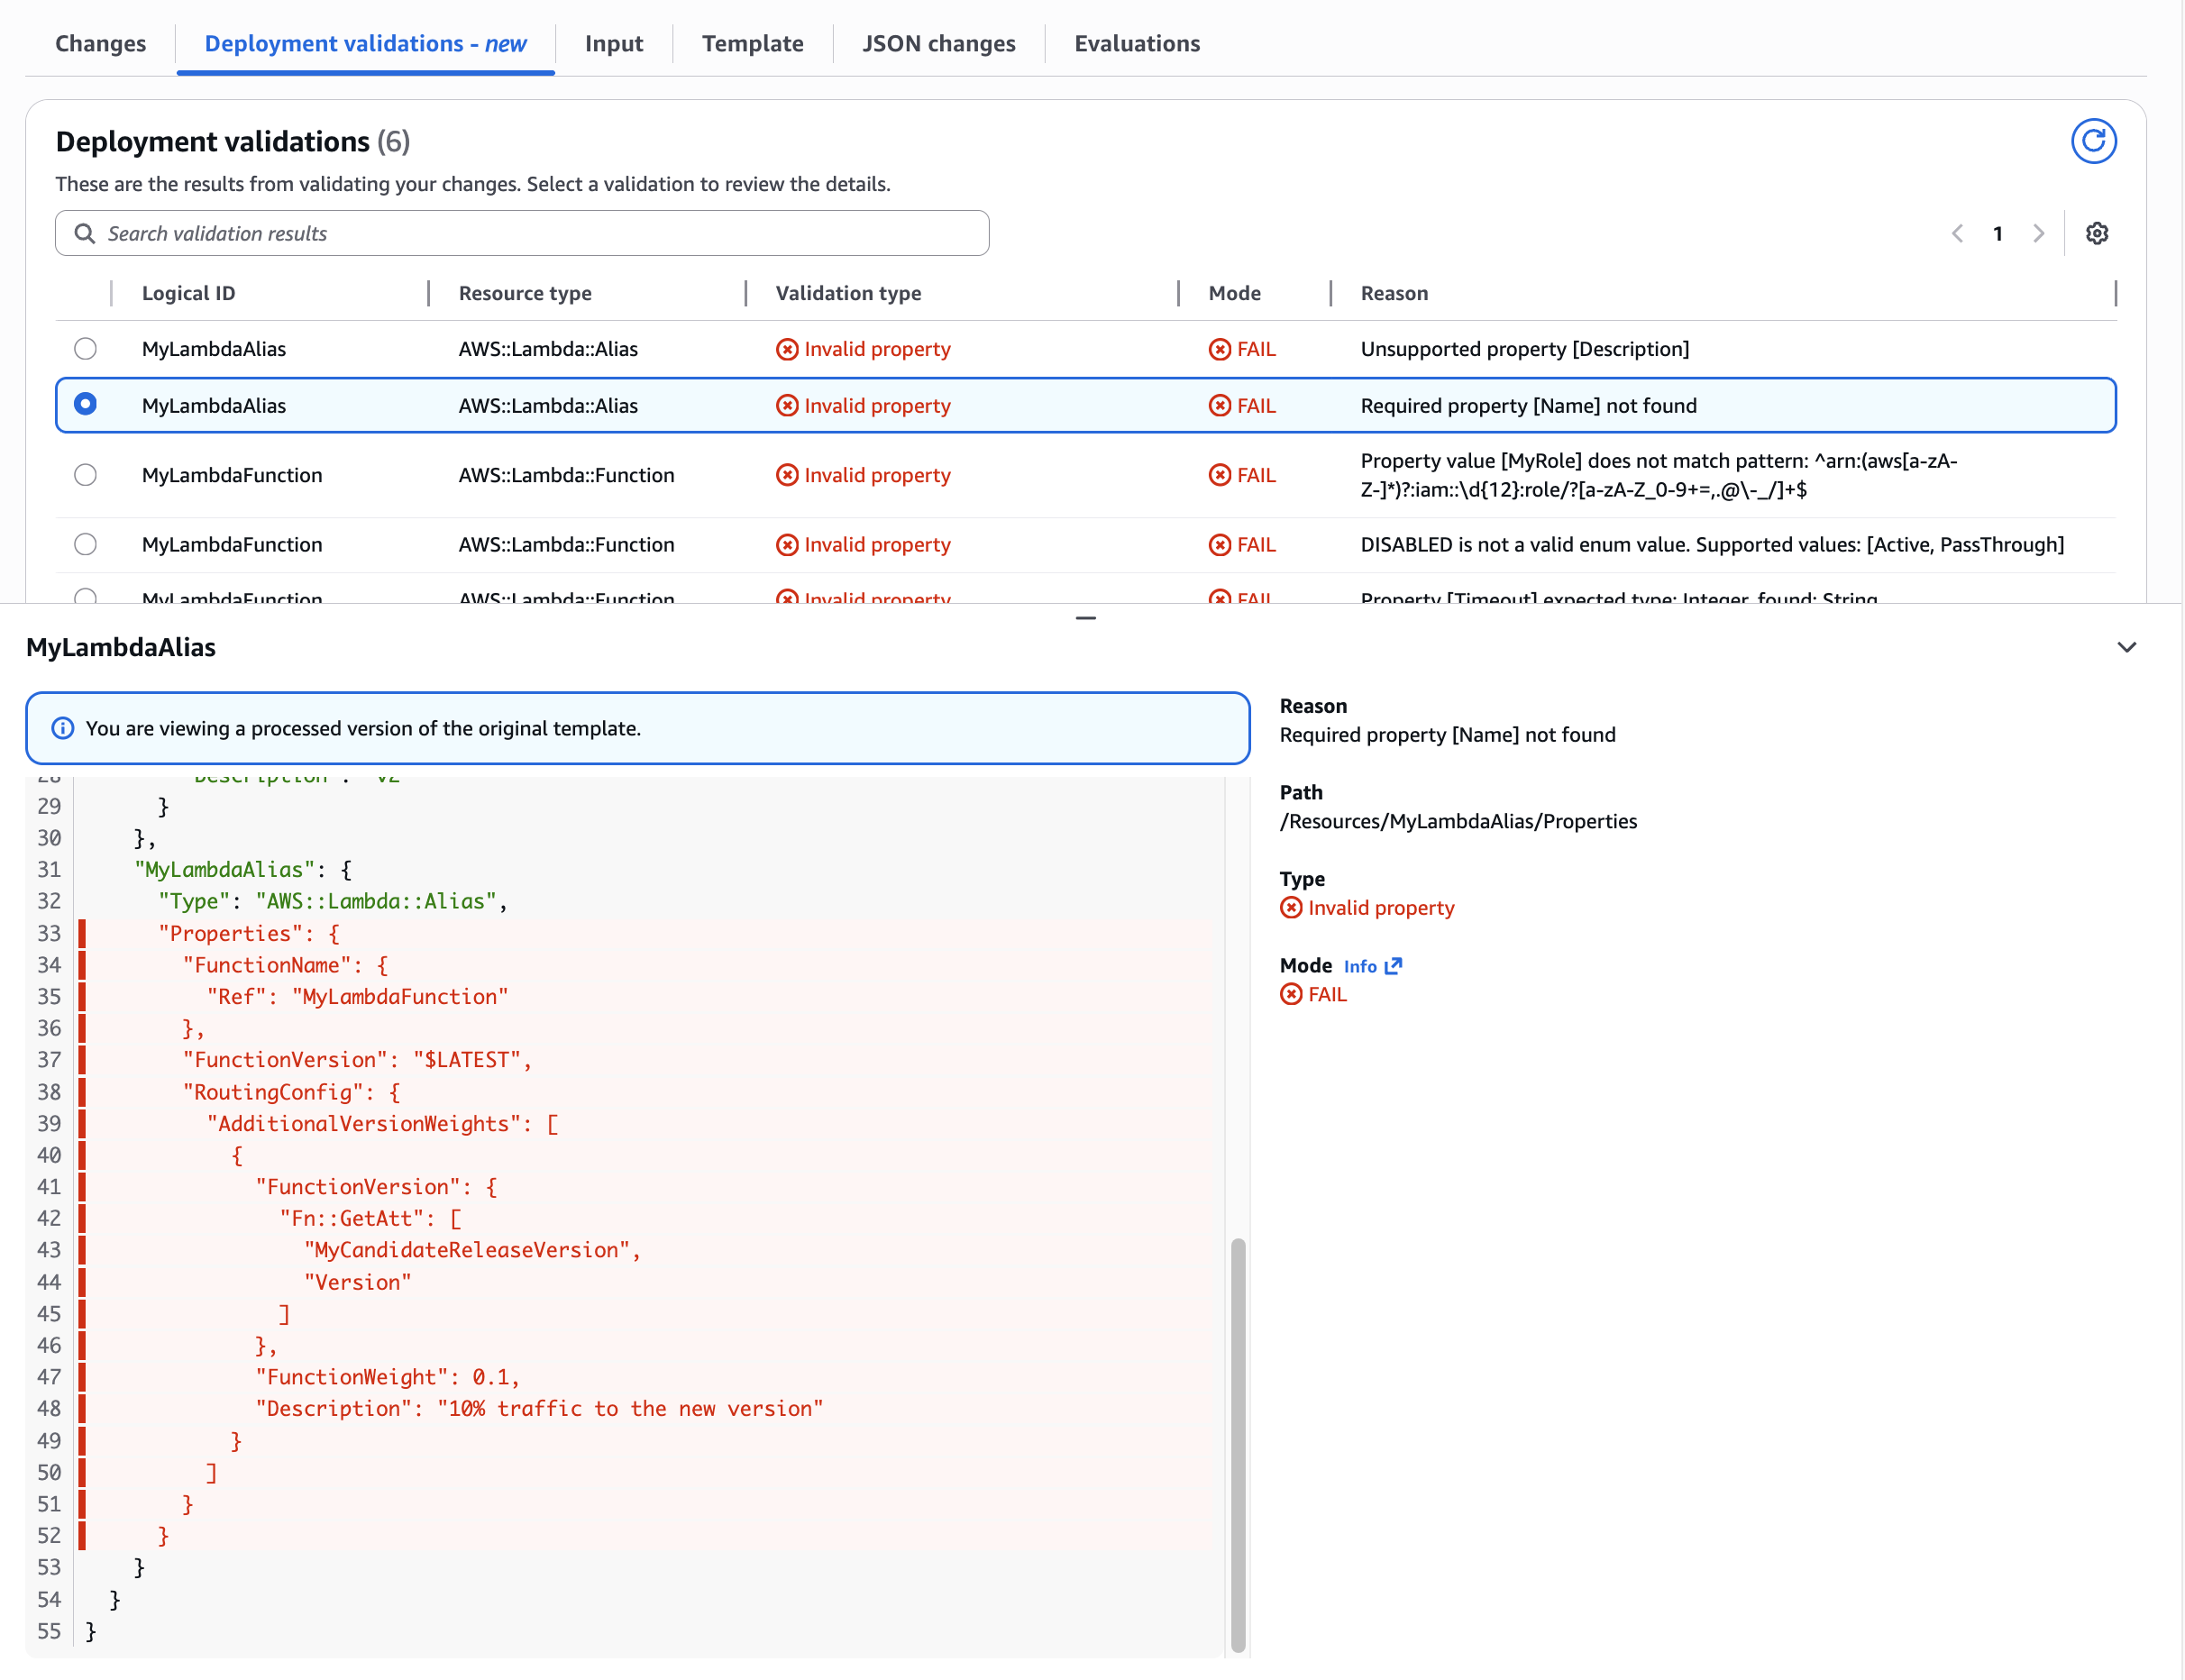
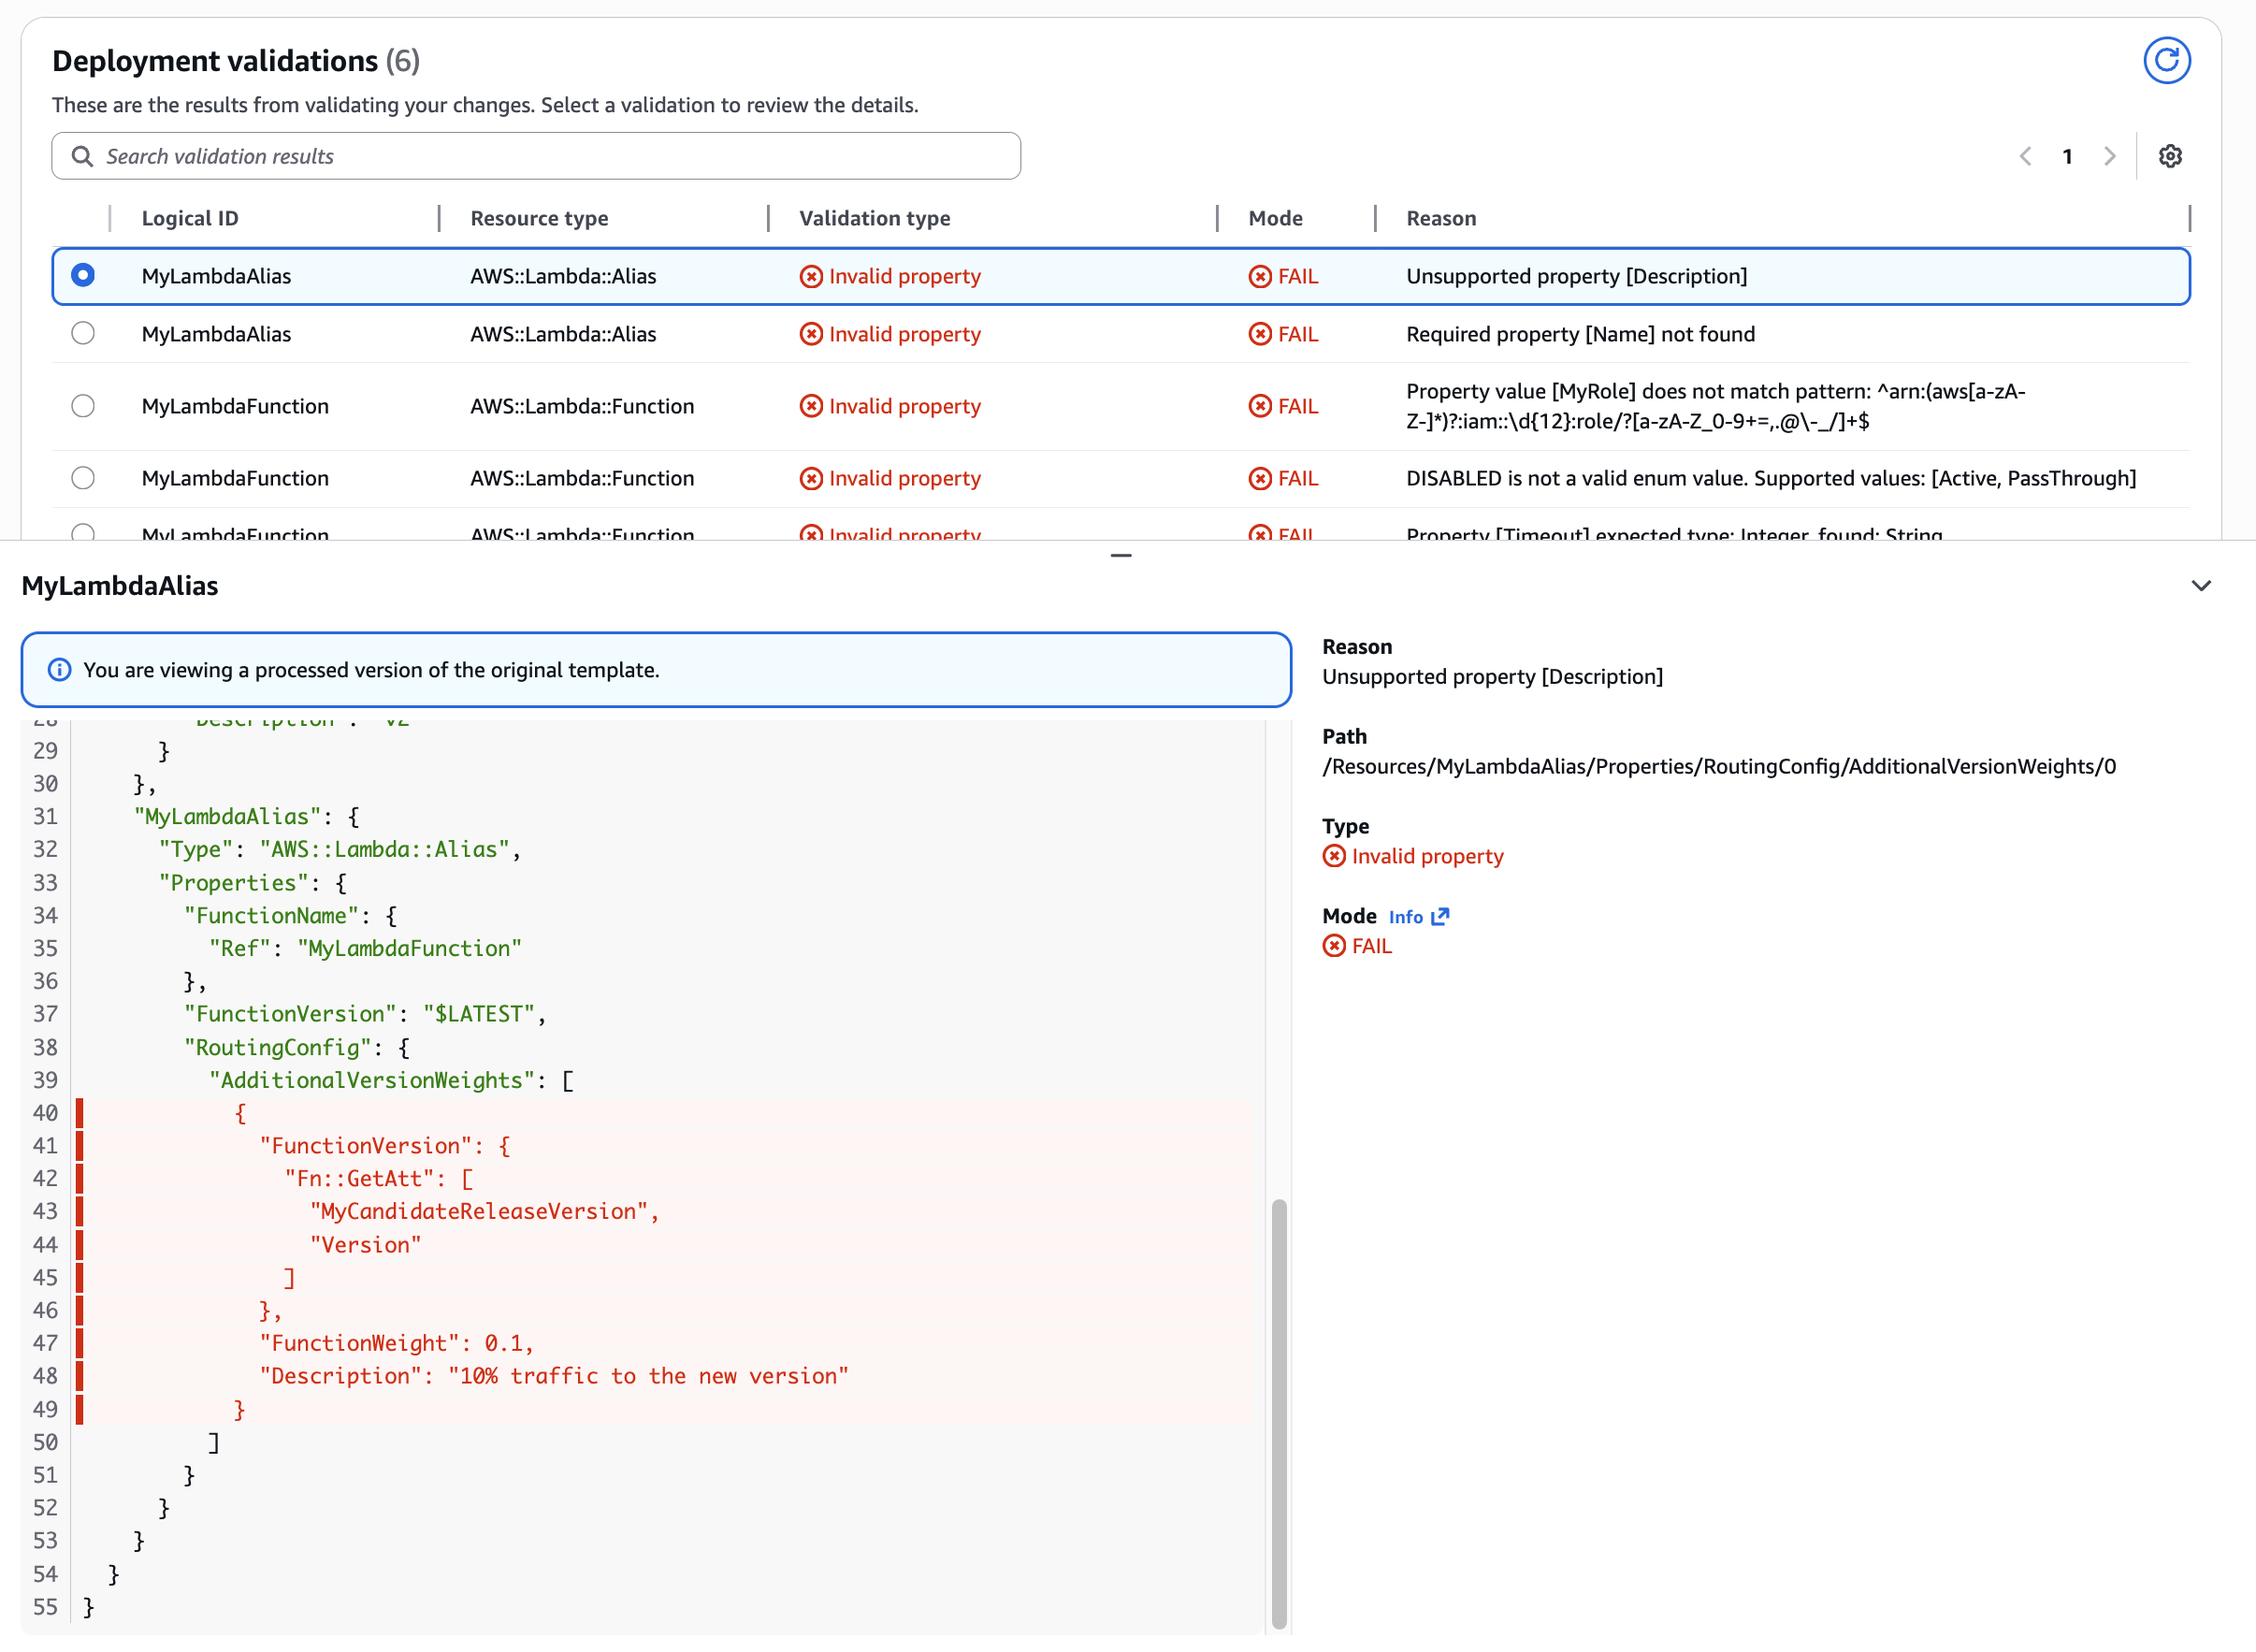
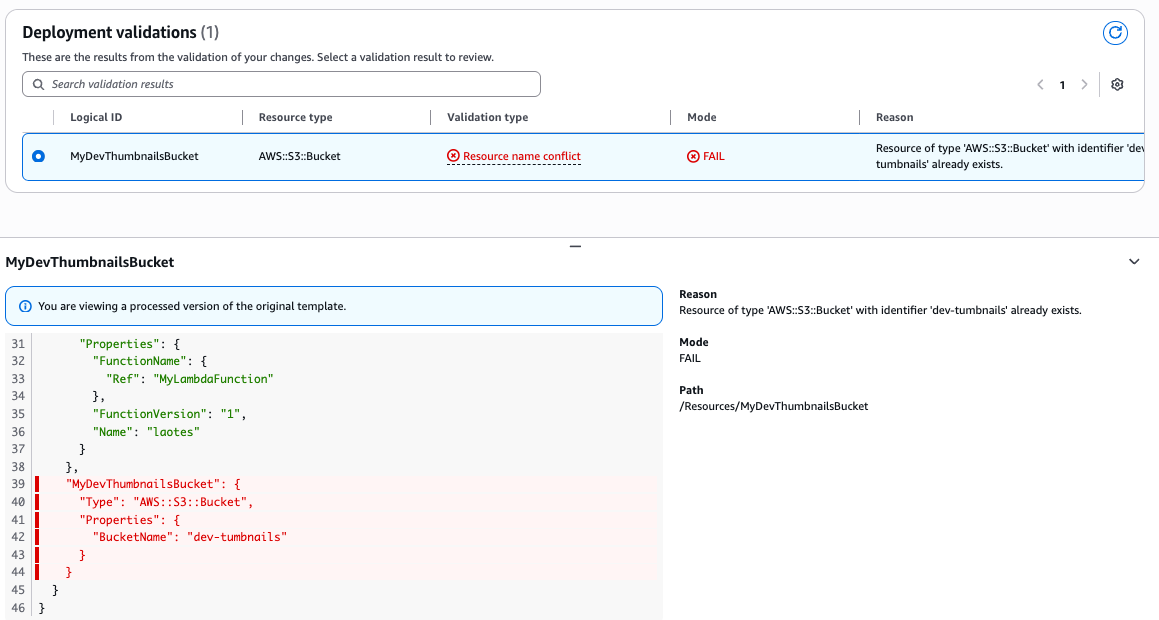
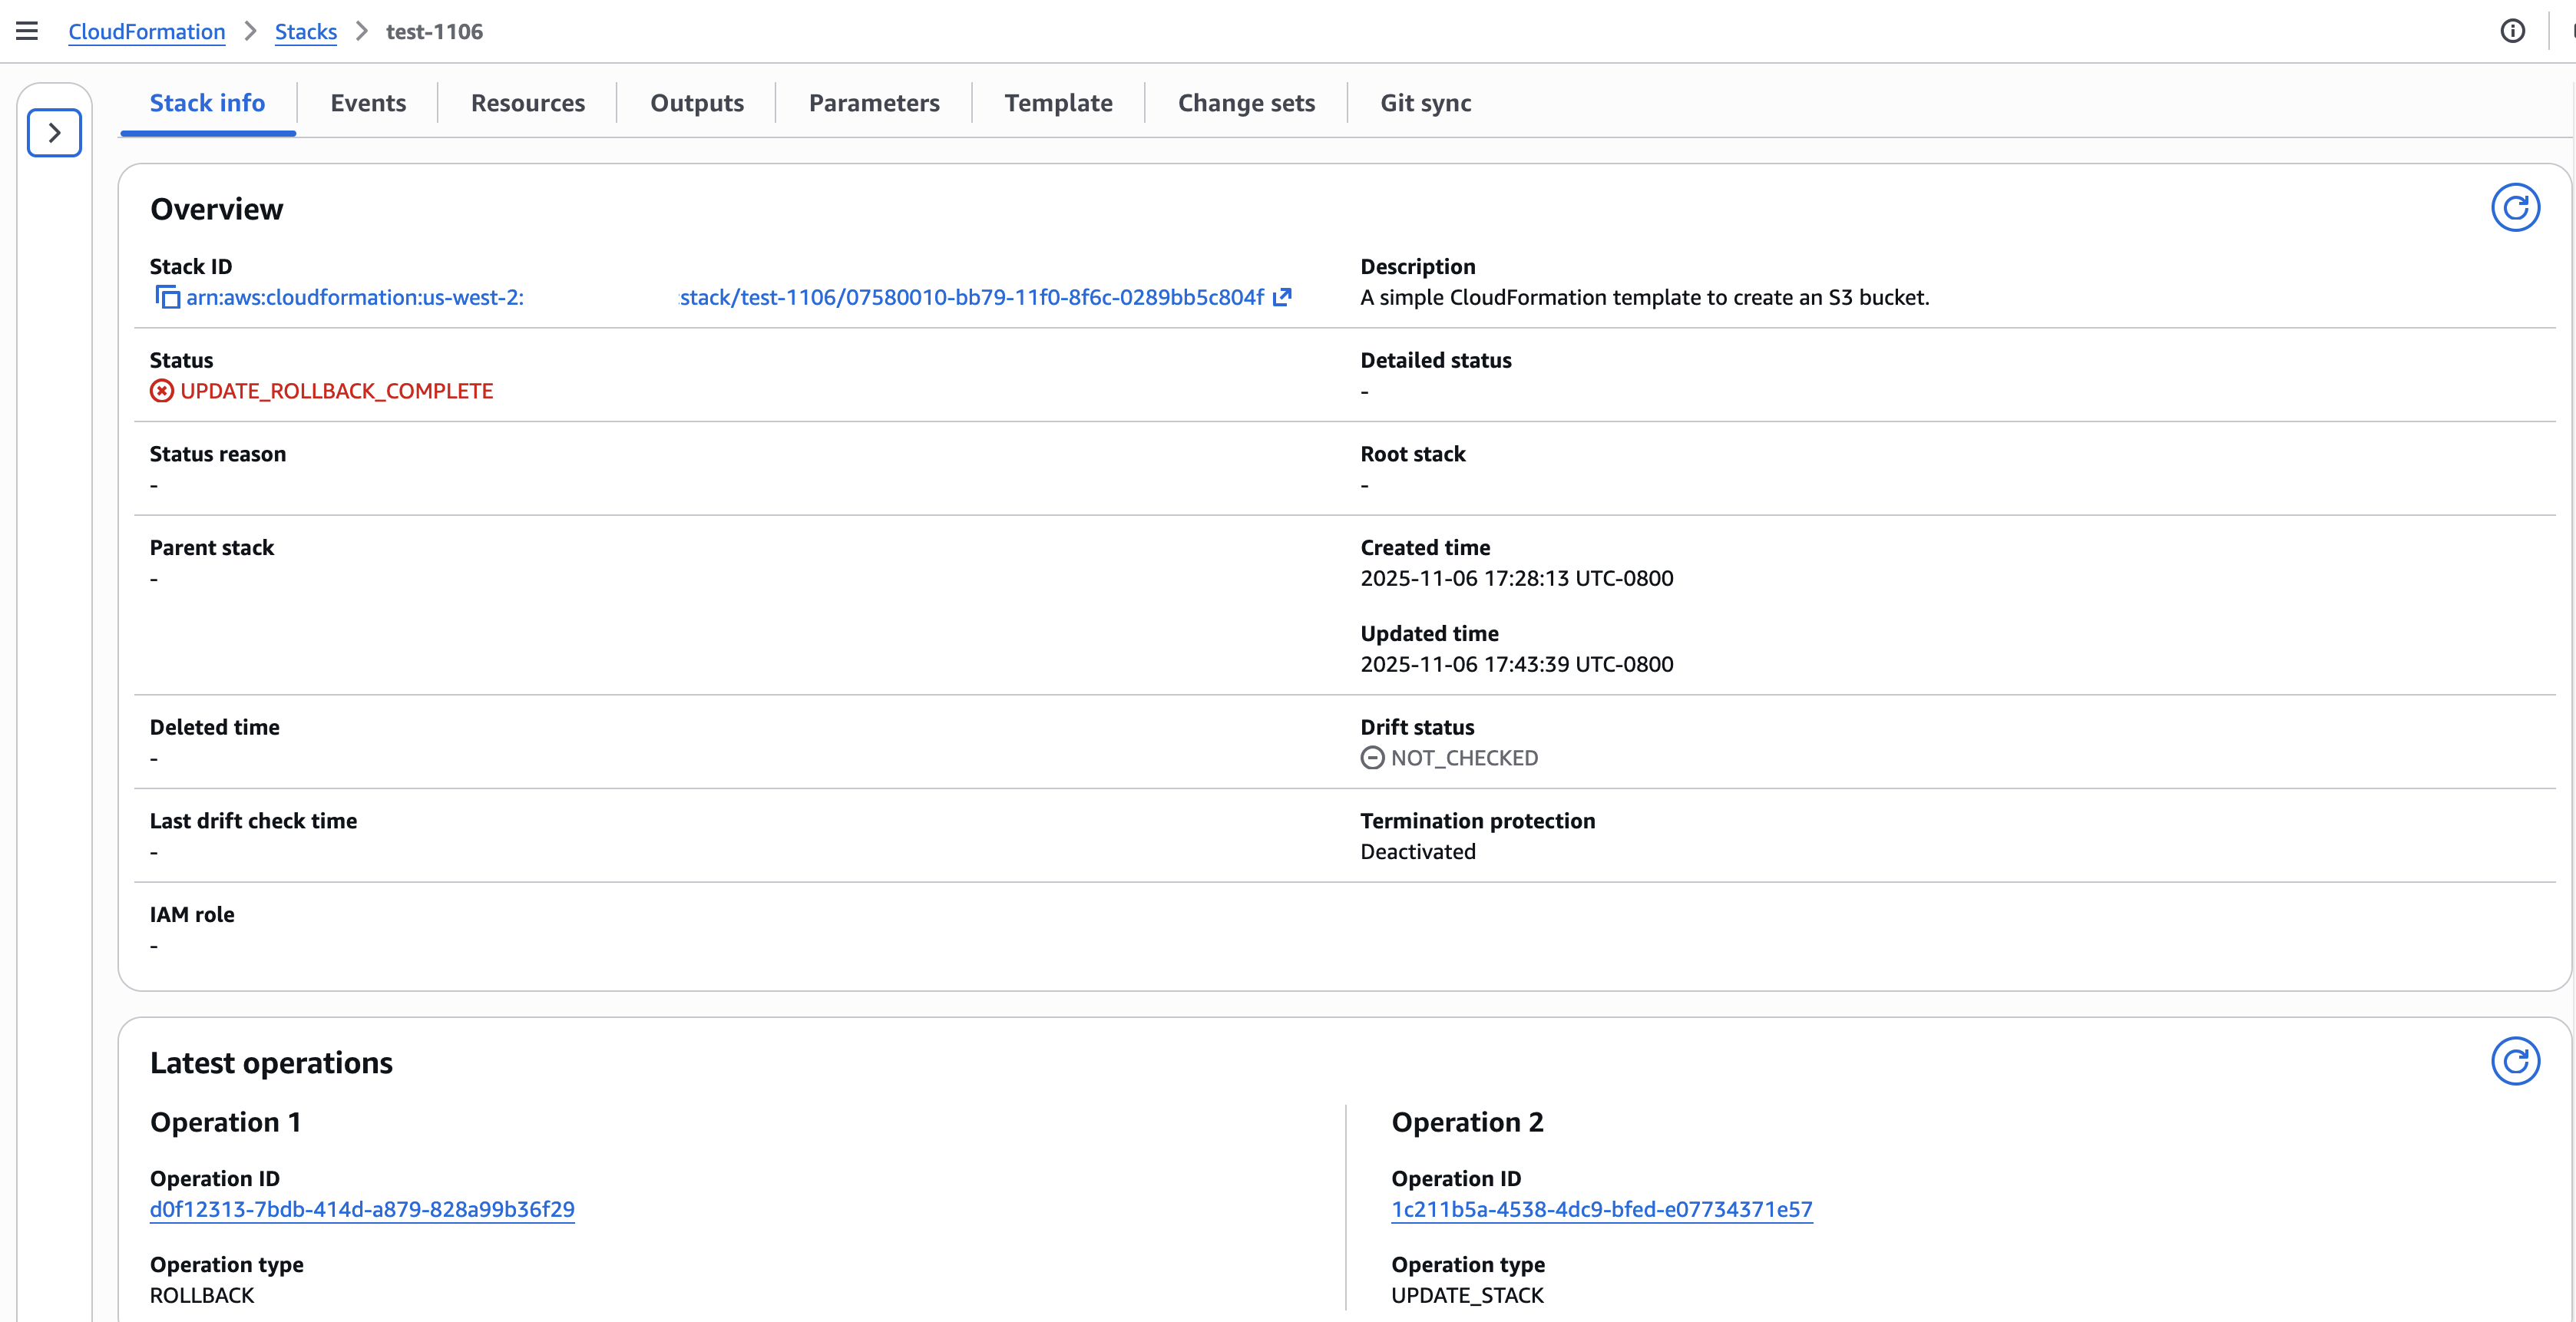
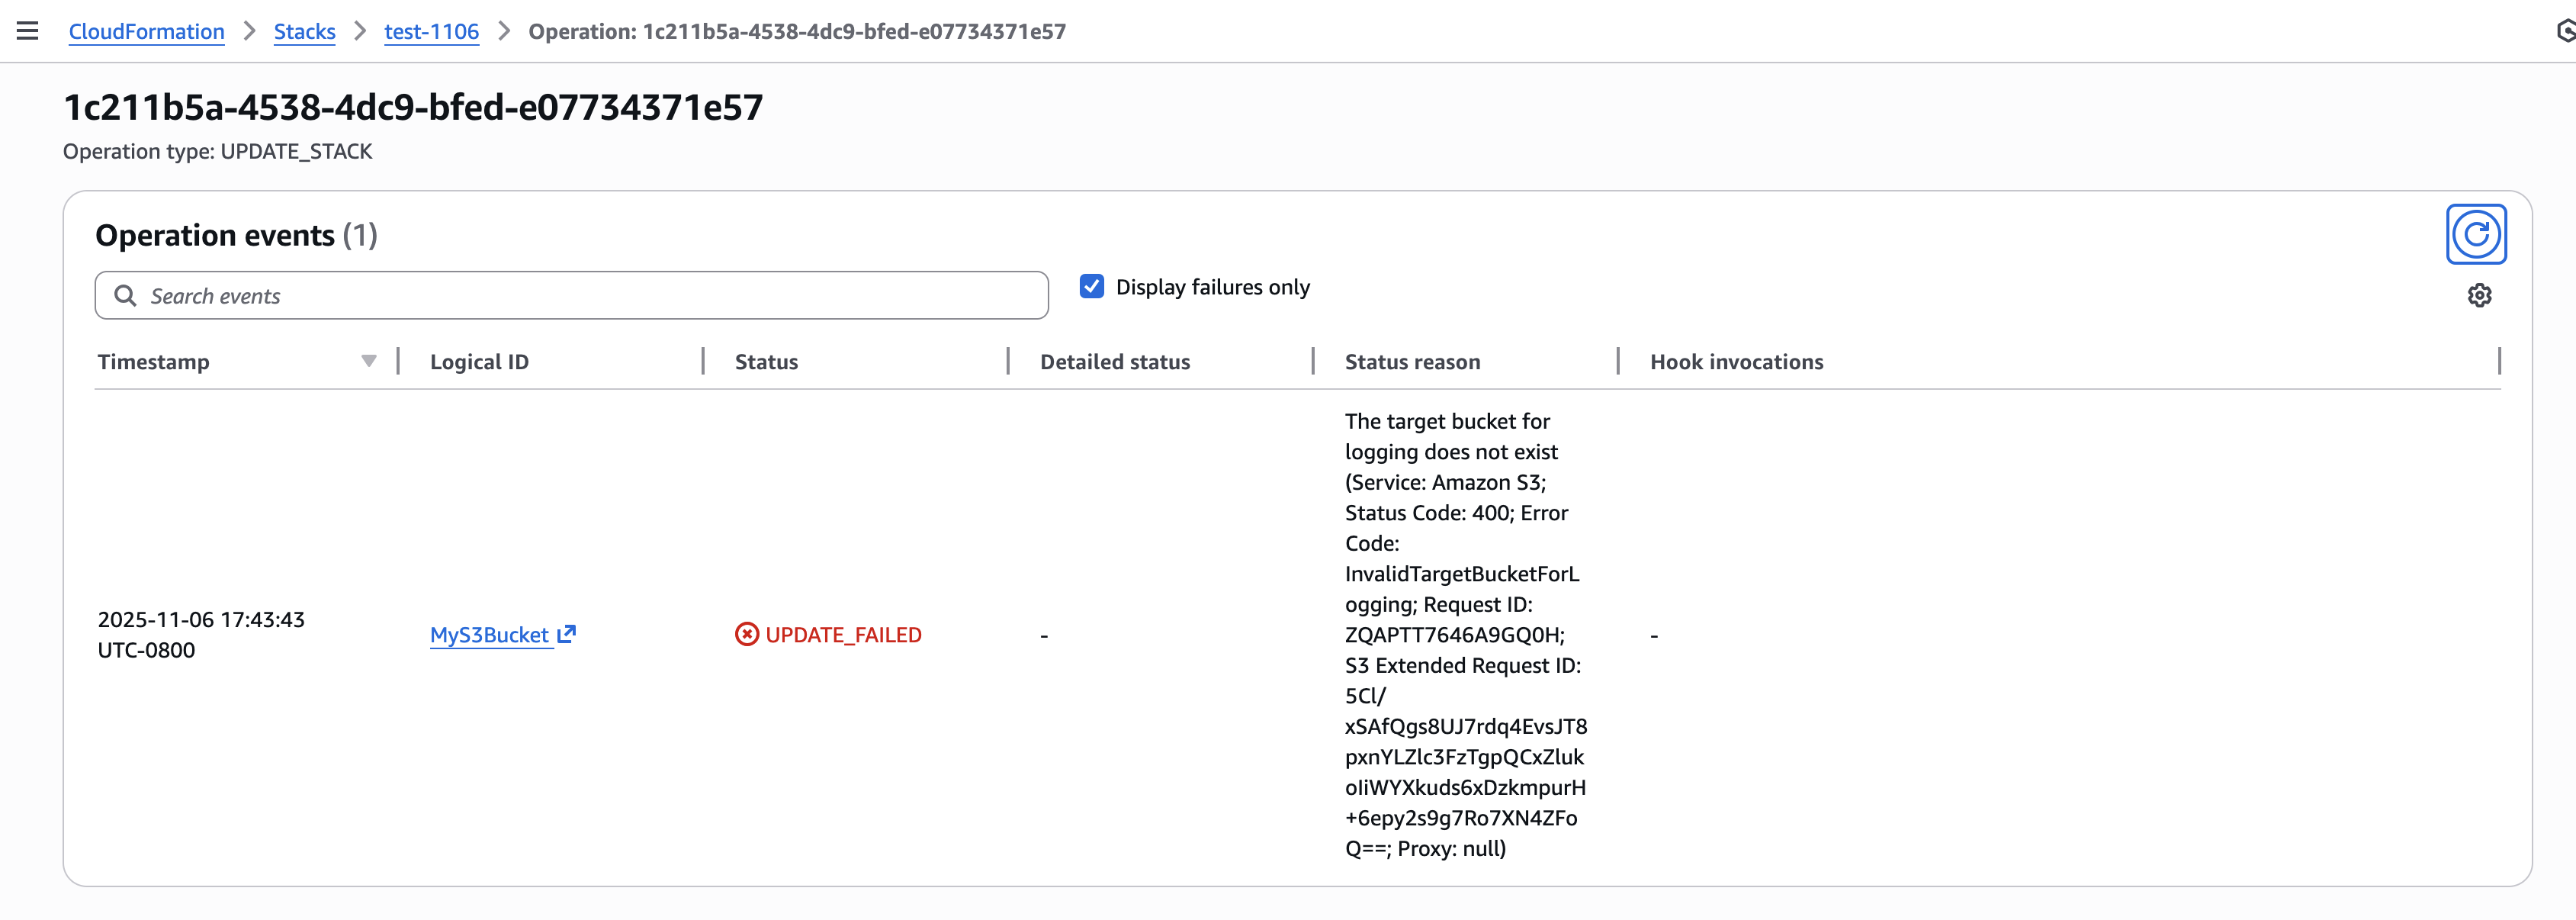
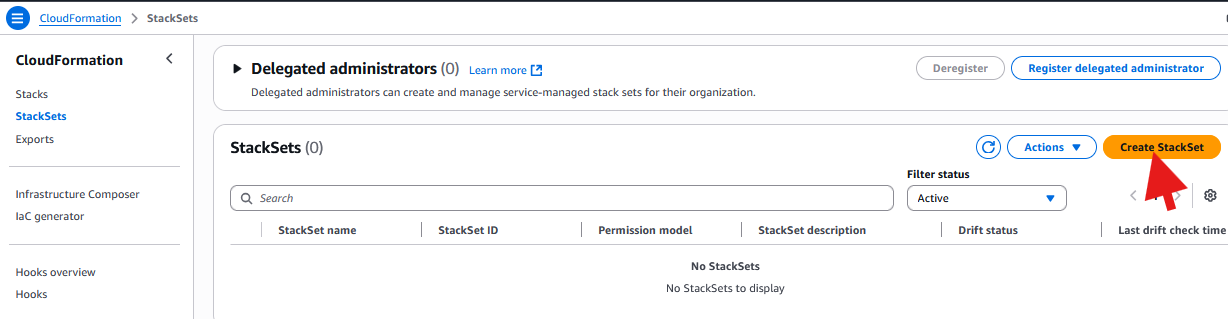
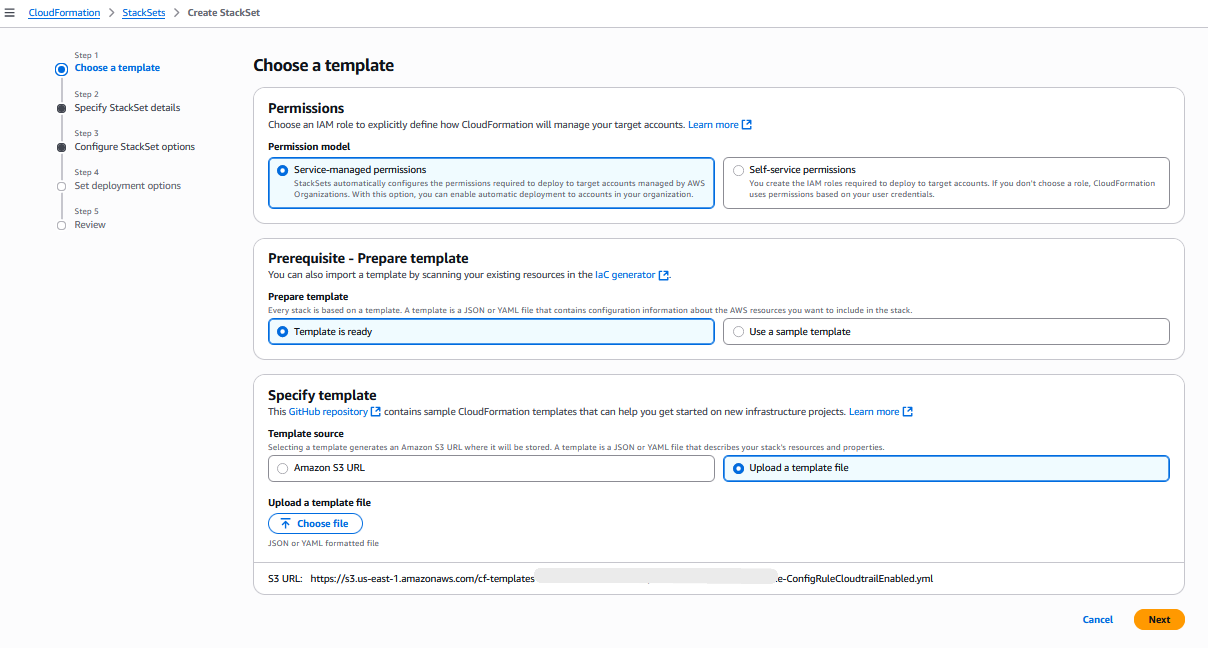
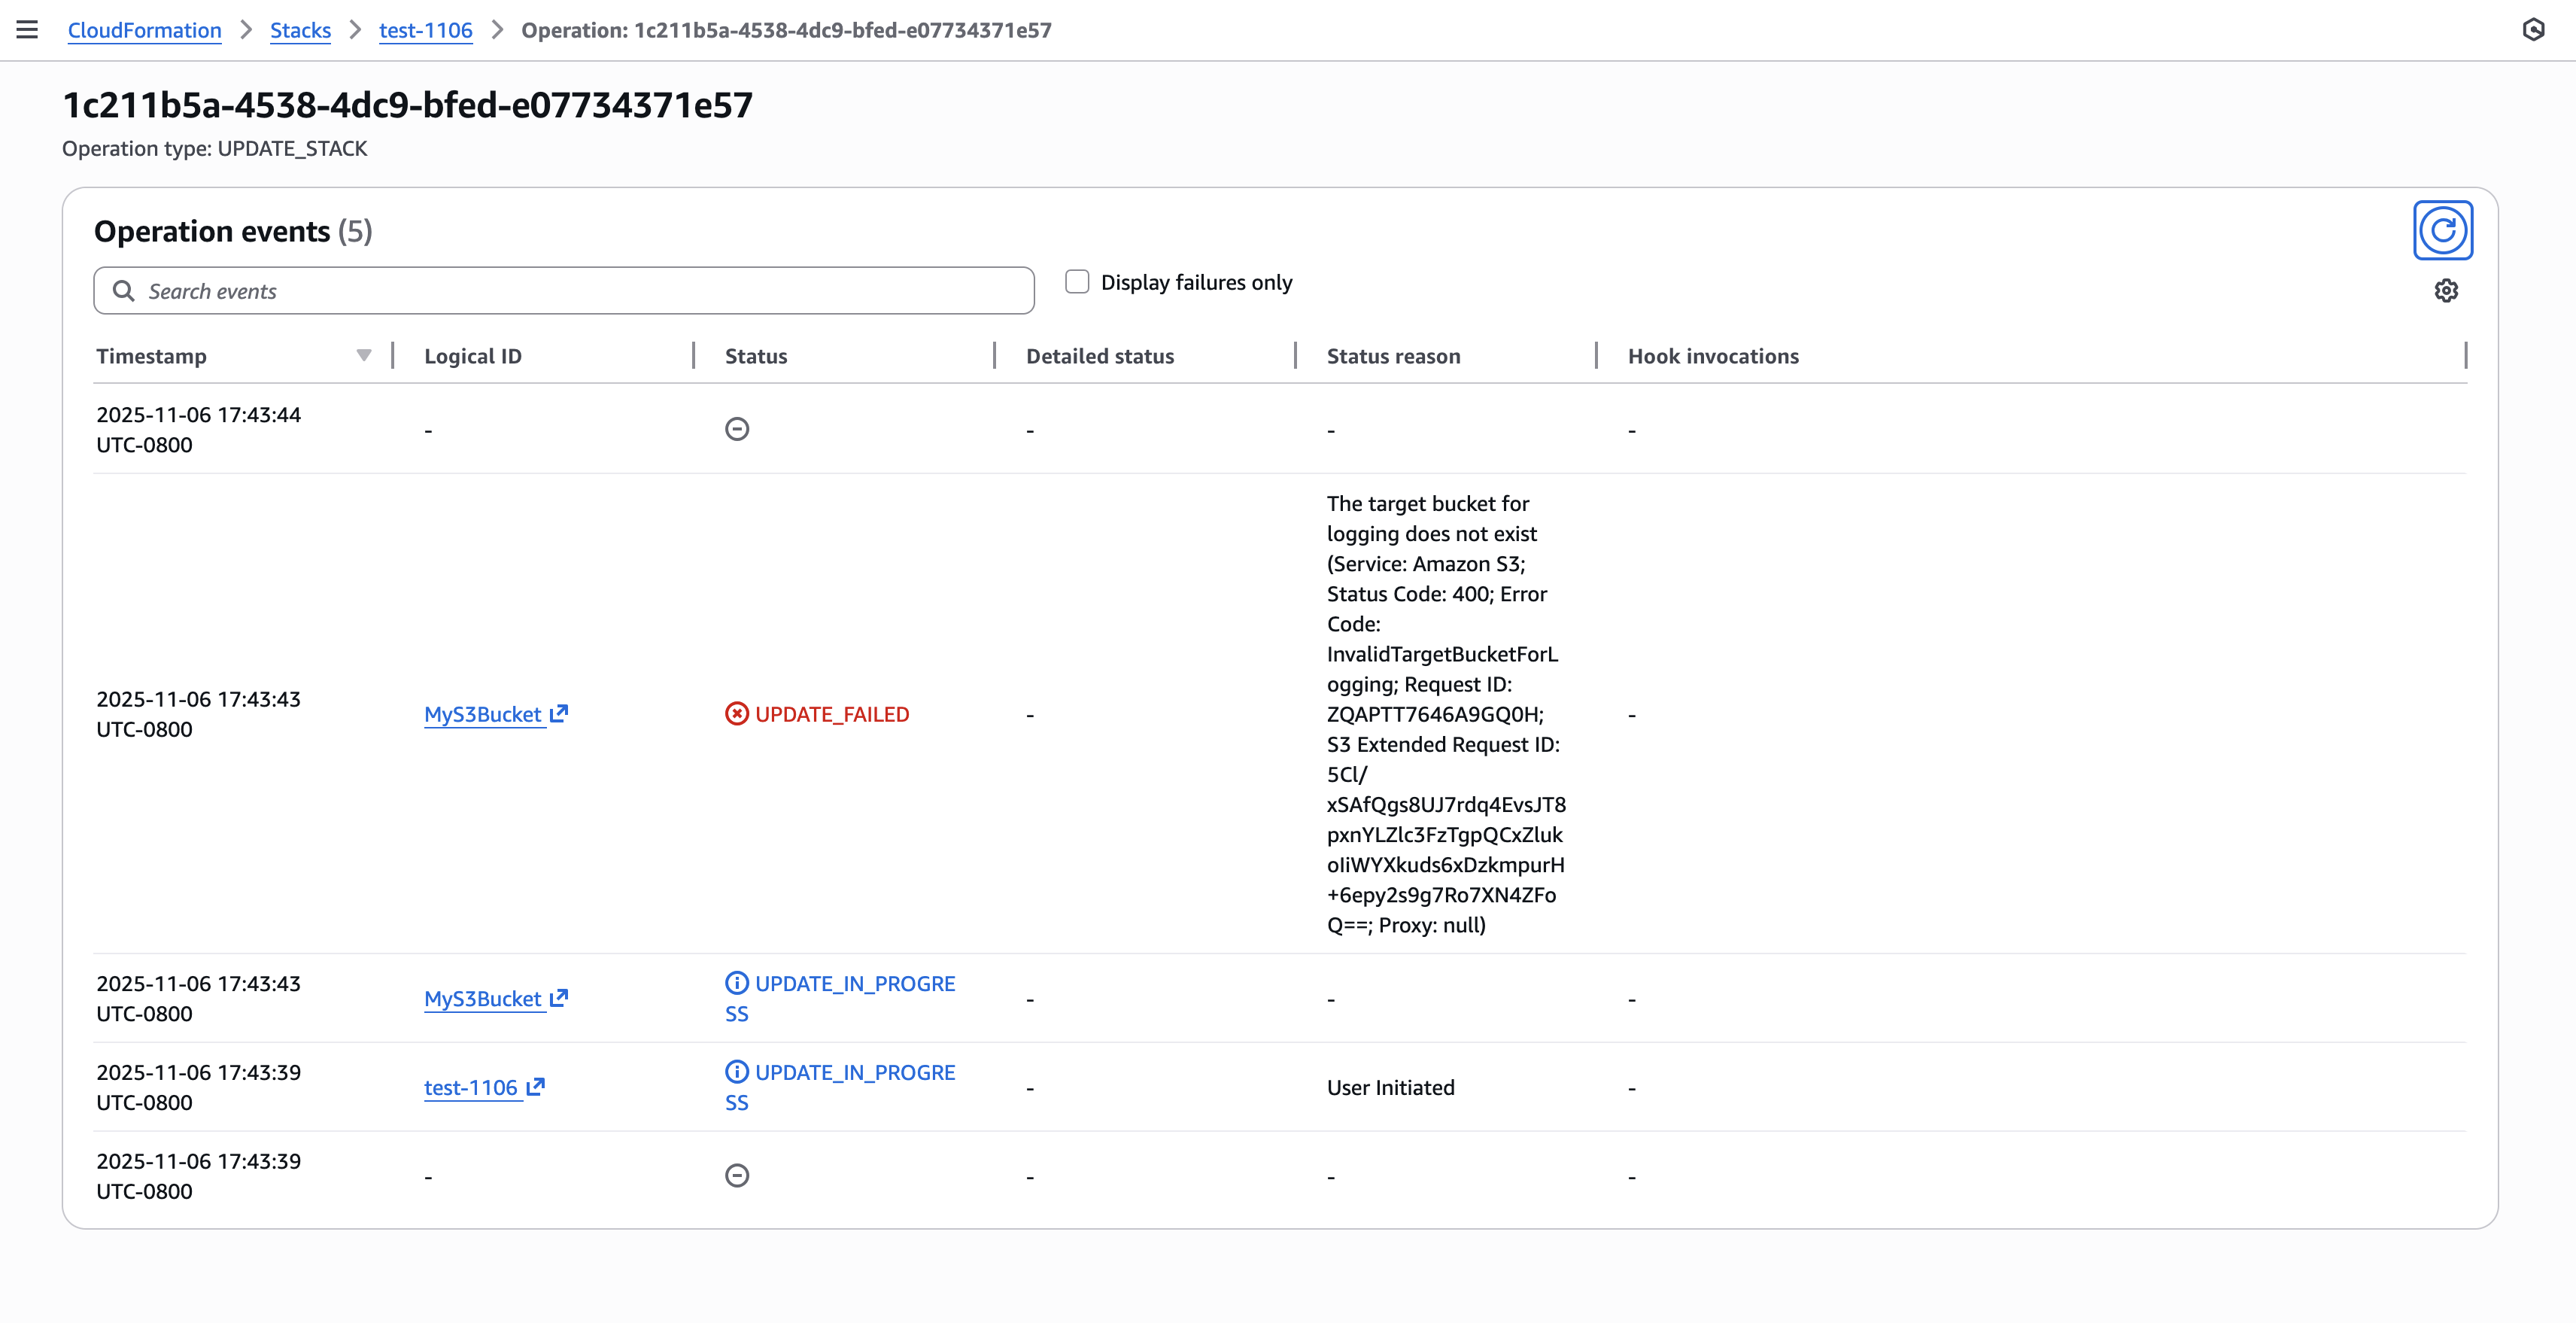 Figure 12: New CloudFormation stack operation page