All posts by Performance Stats Team

Backblaze Performance Stats Q1 2026

Post Syndicated from Performance Stats Team original https://www.backblaze.com/blog/backblaze-performance-stats-q1-2026/

A decorative image with the title Q1 2026 Performance Stats.

Cloud performance is easy to claim and hard to measure. As data volumes grow and workloads become more complex, the real question isn’t just how fast a provider is—it’s how that performance holds up in practice, and what you’re actually getting for what you pay.

Our answer to that challenge is Performance Stats, the most recent addition to our Stats franchises, Drive Stats and Network Stats. This ongoing, quarterly report will share performance testing results for both Backblaze and competitors, as well as the testing methodology so that anyone can recreate, compare results, and contribute to building better tests if necessary. (And, as always, we love the healthy debate in the comments section and beyond.)

By sharing the full results—strengths, limitations, anomalies, and more—we’re working to give developers and teams a more complete picture of how cloud storage providers perform in practice. We’re building a dataset over time, and we’re just at the beginning—let’s dive in.

And we can talk about it, too

Join the Performance Stats team on Thursday, April 9, 2026 to go over the stats, talk about testing methodology, and more. Have a question for us? Submit your question ahead of time here.

Register for the Webinar

Q1 2026: The results

We ran performance testing for Backblaze B2, AWS S3, Cloudflare R2, and Wasabi Object Storage in two regions, US-East and the EU-Central. Our EU data center is in Amsterdam, and just like in our first round of testing, we matched the other cloud provider locations as closely as possible. You can jump to the testing methodology if you’d like more details. 

Key findings: 

  • Average upload and download times for US-East improved across nearly all providers and file sizes compared to Q4 2025. Backblaze led in upload averages for 256KiB and 5MiB files, with Wasabi taking the 2MiB category.
  • Sustained throughput testing continues to tell a different story than averages alone. As with last quarter, the spread between highest and lowest values per file size remains wide—particularly in multi-threaded tests, where providers’ architectural choices show up most clearly. 
  • EU-Central results show meaningful regional variation. Provider rankings shifted between US-East and EU-Central—for example, Cloudflare R2 performed notably well on EU upload and download averages, while Wasabi led in several EU upload throughput categories. The takeaway: geography matters, and no single provider’s US performance predicts their EU performance.
  • Multi-threaded download tends to see a sharp rate of increase and then level out. In both US-East and the EU and for most of the tested providers, we see a sharp increase in mebibytes per second performance from the 256KiB to 5MiB file size, then a relatively flat trendline thereafter. This is an early trend that has existed quarter-on-quarter, and worth watching over time. 

And, here’s a roadmap if you want to quickly reach each test: 

A reminder of why we’re doing this

We want to cut through the noise on cloud performance, and we’re working to build a transparent dataset to support that. This transparency is also why we’re publishing our testing methodology. 

We want to take a hard look at performance on a level playing field for two reasons: 

  1. Buyers should know what they’re getting and have the tools to sniff out the hype and misleading messaging many providers peddle about their performance. 
  2. If we don’t measure ourselves, we won’t get better. We want you to understand where we’re doing well today, and we want to take you along for the ride as we work to improve where we’re not. 

We’ve outlined the methodology at the end of this report. And, across the board, it’s important to note that this project is still young. Young datasets have lots of variability before they show true patterns: So, the best way to understand these results is to re-create them yourselves within your own tech stack. 

On the subject of transparency, let’s talk rate limits

From the start, we expected the data to surface both strengths and weaknesses, which is why transparency has to include context—not just raw results. This time around, the thing that was revealed is our rate limits

At a certain level of scale, cloud storage providers have to implement rate limits to ensure consistent performance and keep the platform secure from intentional or unintentional volumetric attacks. And, we even saw an example of that behavior last quarter in the Wasabi data—in that case, the limit they have in place is that they don’t allow users to run HTTP requests for the first 30 days of a new account period. 

Our rate limits work differently. I’m simplifying a bit, but there are three different ways you can trigger a rate limit: too much bandwidth being pushed, too many requests per second, or too many threads running concurrently. On the user’s side, you see either a 429 error (if you’re running our B2 Native API) or a 503 error (if you’re running the S3 compatible API).

We didn’t hit rate limits in all tests. In fact, we only hit them in the multi-threaded throughput tests at the larger file sizes, which indicated to us that we were running into bandwidth caps. And, since throughput testing by nature is a stress test, this is relatively unsurprising. We’re trying to push as much data as possible in a five minute period—if the platform doesn’t know testing is happening, it can look like a volumetric attack. 

Now to the sticky part from a reporting perspective: When we set out to write this report, the testing methodology includes the parameter that we’d test standard account tiers. In practice, we actually have no control over whether our testing accounts are being treated differently on the back-end with other providers, for better (preferential treatment) or worse (throttling). That’s also why we run testing from an independent Vultr server—it means we aren’t using a Backblaze-owned IP address, so the testing account isn’t identifiable by other providers. The accounts are being judged on their behavior. 

So what do we do here? How do we balance testing against real world behavior? We decided to show you what it looks like when you hit rate limits and outline some potential steps for user-side mitigation. 

On every cloud storage platform, we can expect that there are default rate limits applied. When we saw our own, we had the advantage of knowing that that’s what we were seeing—if we were in the real world, we’d do additional investigation to confirm. From a testing perspective, we went forward in a way that would be the most likely scenario in the real world: We incorporated an auto-retry script. 

In all cases for this report, we were hitting bandwidth caps at the larger file sizes in the multi-threaded throughput tests. So, if the test tried and failed, we raised that limit and only that limit—all other account parameters stayed in line with the default standard account. In the real world, you would have completed your investigation, then reached out to Support to raise bandwidth caps, which would then apply to your account going forward. 

There are actions you can take before requesting a change, especially because sometimes API calls are failing for other reasons. So it’s helpful to do things like retry with exponential backoff, double check your lifecycle rules and other automated processes (especially sequential operations), increase or decrease thread count, change file size, etc., and keep all the logs, too. Sometimes just those things will solve the issues you need to solve. 

More importantly, all of those actions are things that will give you more information about what type of configuration issues you’re having, and, if you are running into a rate limit issue, (at least with us) you can request a specific configuration change. For example, in this case, we only raised the bandwidth cap, and kept all the other account configuration variables in line with our standard tier. Our concern was to keep the testing as fair and consistent as possible.  But, in a real-world scenario, that may mean you’d avoid something like jumping into a different pricing tier. In all cases and with all providers, testing and communication are key at this stage. Data, as always, is king. 

Back to this report: we have two important impacts. First, we can’t confidently make quarter over quarter comparisons this time around because we’ve changed the testing methodology (though we can do so in our upload and download averages, as they weren’t affected). We may point out observational patterns, but we can’t say they’re significant. And hey, the dataset is young—we shouldn’t be doing that yet anyway. Second, if we hit a rate limit, we went ahead and included that data as a separate line item in our tables—so I’ve updated our testing methodology accordingly. 

With that out of the way, let’s get into the report. 

US-East

This quarter, we’ve added a second region to our reporting. We’ll start with US-East, then move to EU-Central. 

Upload comparisons

This test shows the average time in milliseconds it takes to upload a file. Averages were taken across a month of data and for three different file sizes.

In these tests, a lower result is better, and as with the last report, we’ve highlighted the category winners in green for readability.
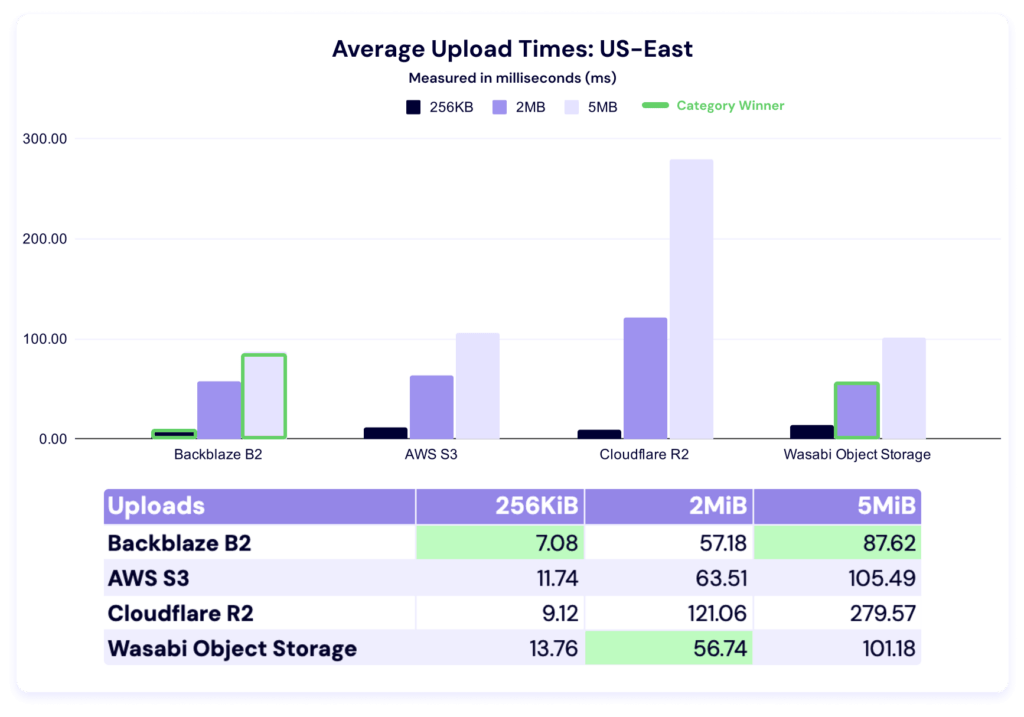
We’ve got a young dataset here, so it’s hard to attribute significance this early, but let’s look at a quarter-over-quarter comparison. (Note: We did not have data from Wasabi last quarter.)
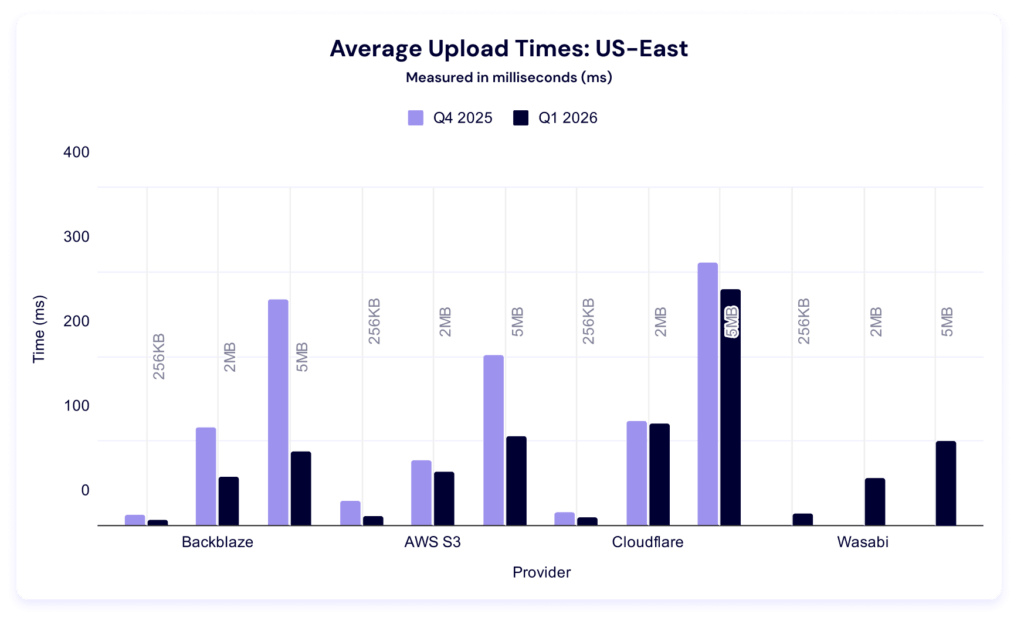
Interestingly, every provider had lower average upload times. Once again, Backblaze wins for 256KiB files. Last quarter, AWS led in the other two file sizes, but this quarter, Wasabi took over in the 2MiB category and Backblaze in the 5MiB.

Five minute multi-threaded upload benchmark

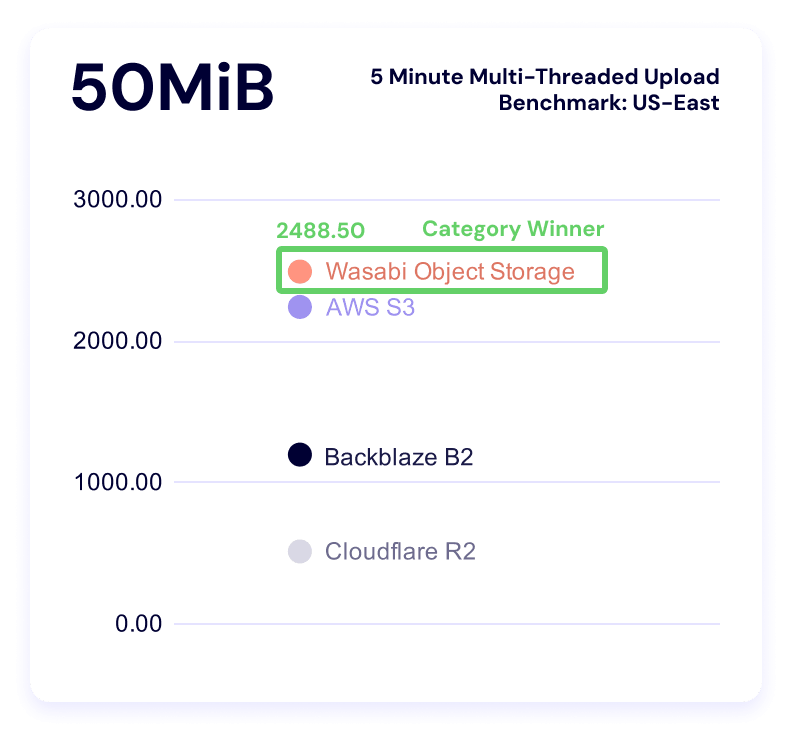
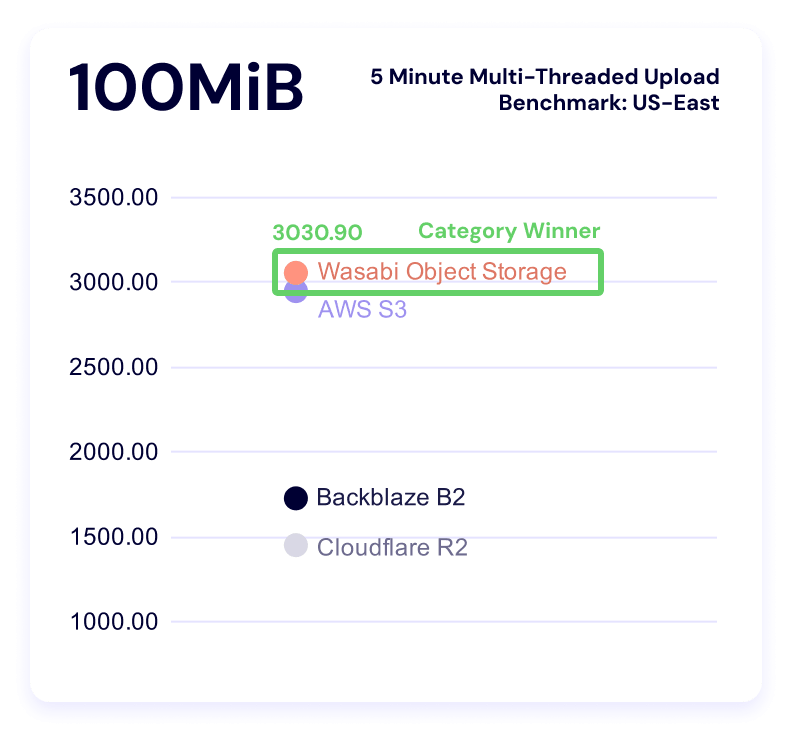
In these tests, a higher result is better, as the result represents more average data being pushed in the five minute time period. This gives us quite a bit more information than just average upload time for a single file—it tells us the sustained amount of data you can push to a cloud storage provider in five minutes. This is also where we see our first rate limit in action.
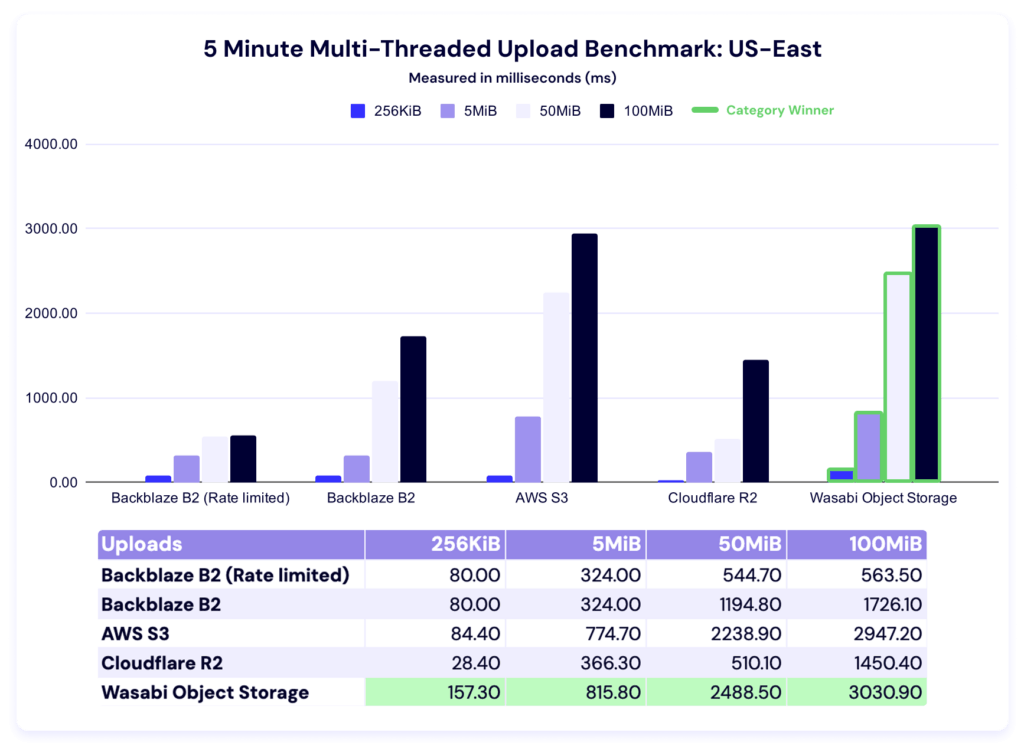
You’ll notice that the first two values for the rate limited and un-rate limited account are the same—which makes sense, because they hadn’t triggered the bandwidth cap. In the rate-limited version, the values in the higher file sizes are suspiciously similar. We had the benefit of knowing we were hitting our own rate limits, but if you were doing external testing, you’d go through the things we talked about above. Different providers have different policies on what they can and can’t allow, so check out each platform’s documentation for clarity. 

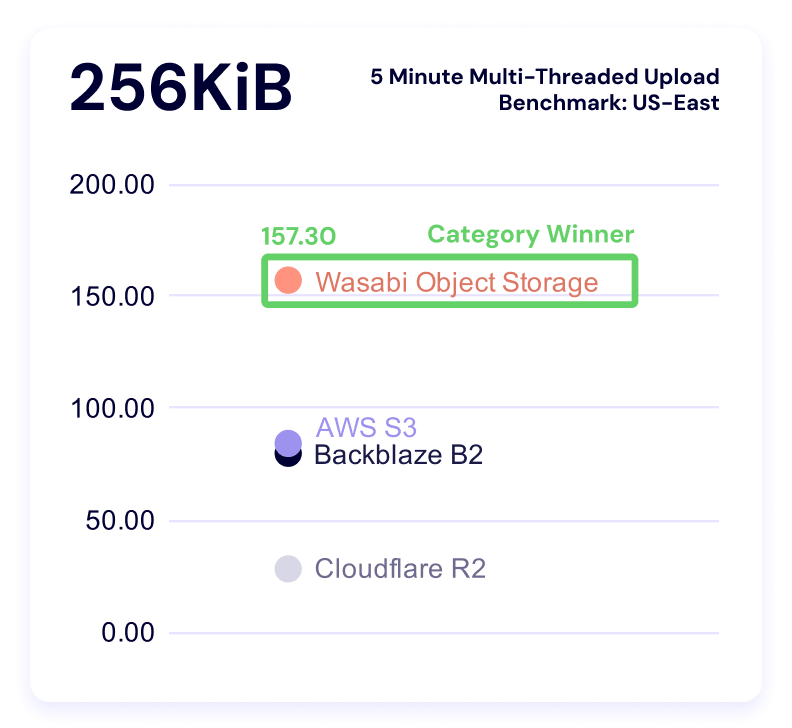
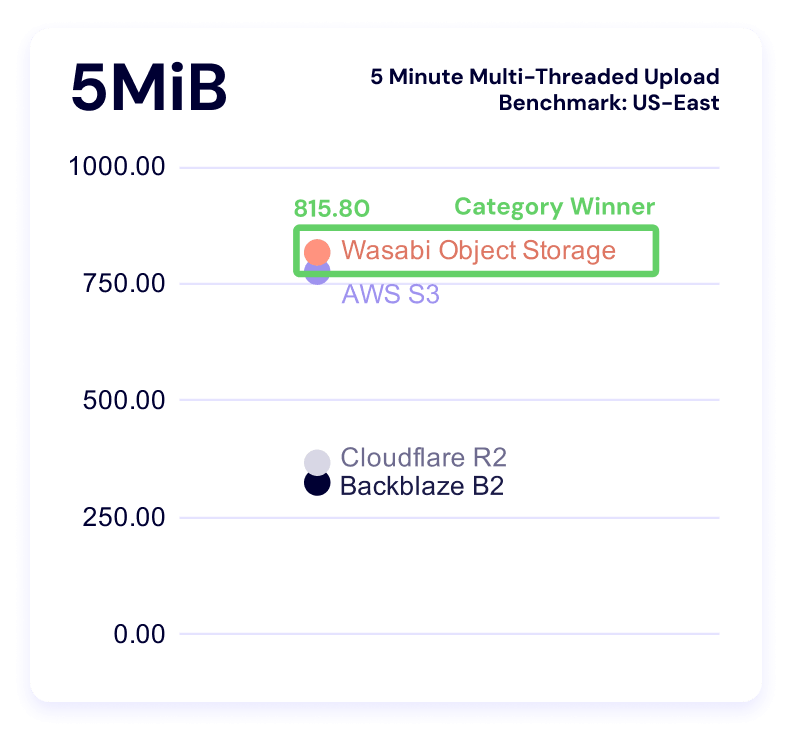
As for the rest of the data: Wasabi sweeps this category. As our dataset grows over time, we’ll have more of an ability to say what’s “normal.” And, as always, your use case comes into play here—there’s a difference between baseline averages and what you can tolerate within your workflows, and when you’re making business decisions, the latter is where you find real value. Trade-offs are strategy. 

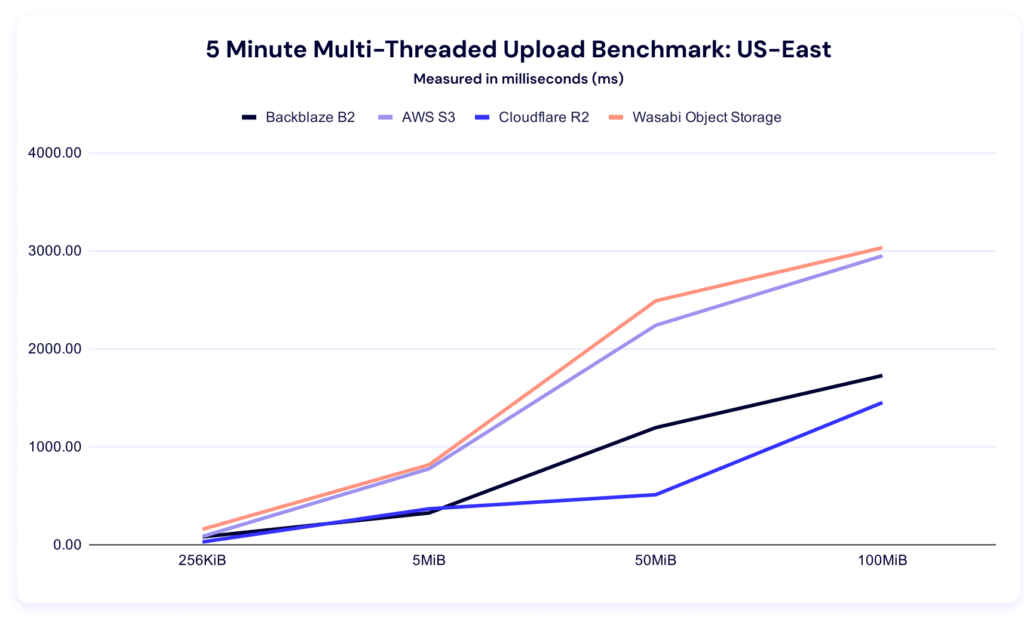
While we can’t perfectly compare quarter-on-quarter because of the methodology change, it’s interesting to note that we still have a wide variance between our highest and our lowest values per file size category in this test type, which is in line with what we saw last quarter. If that pattern continues in future quarterly datasets, we should make sure we take it into account when interpreting outliers

Now let’s bring forward our alternative visualizations with the rate of increase:
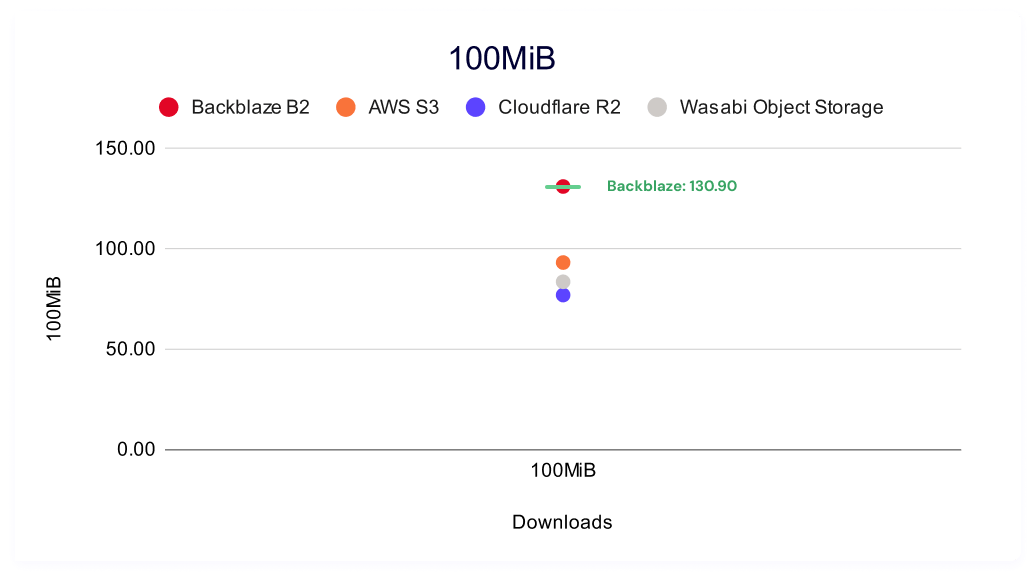
And check in on clustering within the file sizes:
Five minute single threaded upload test

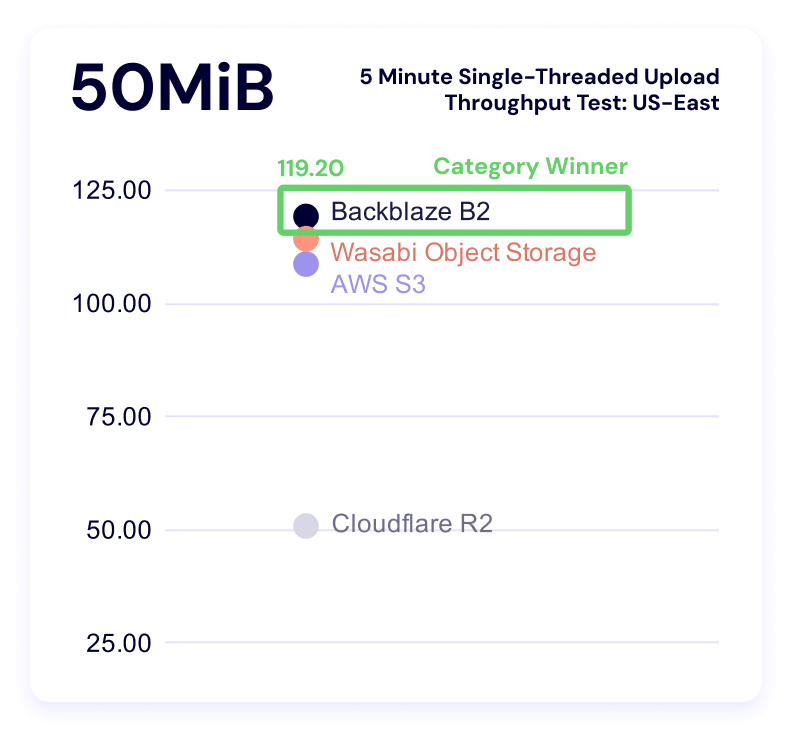
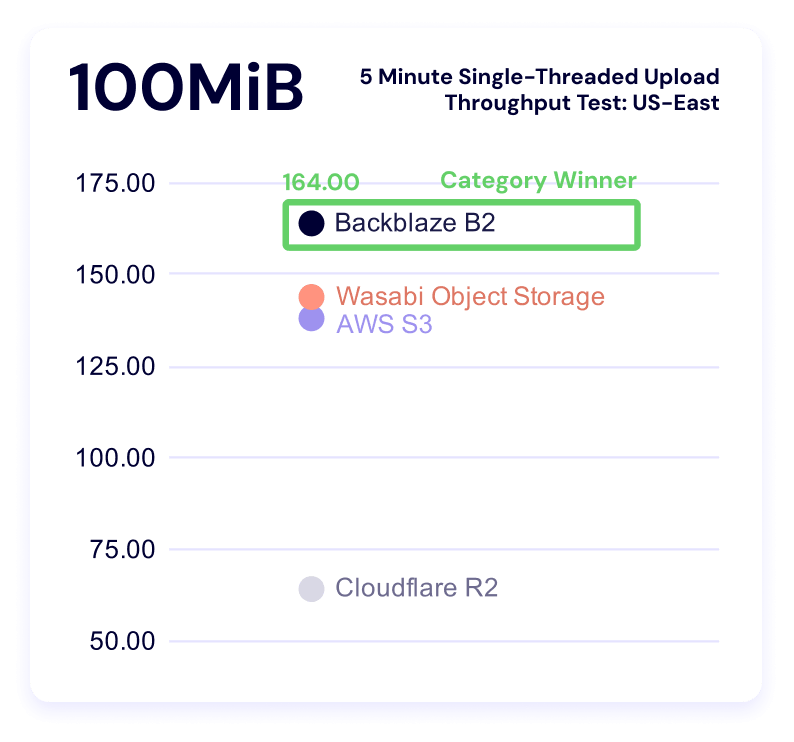
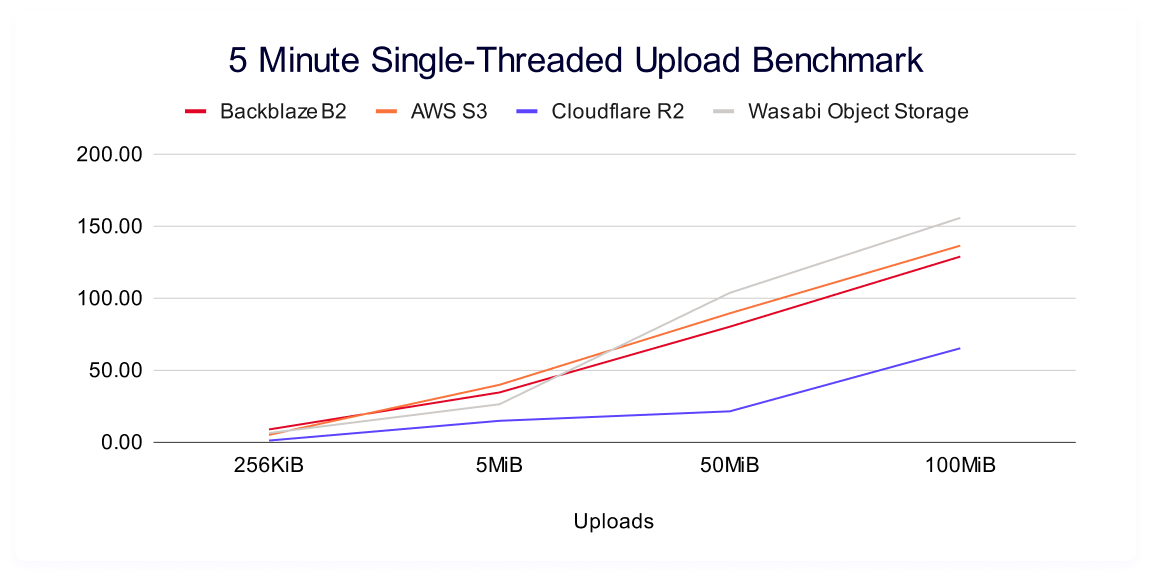
Once again, higher is better in this result, and it measures the sustained amount of data you can push to a server in a single thread with different file sizes.

Multi-threaded tests reveal what happens when you parallelize workload or data transfer whereas a single-threaded test measures how efficiently a provider handles one request. So, from our perspective, single threaded operations show us how a provider handles overhead including connection setup (handshake), request routing, waiting for the first byte, and then actual data transfer. It matters when APIs are making sequential calls or you have latency-sensitive or small-object workloads.
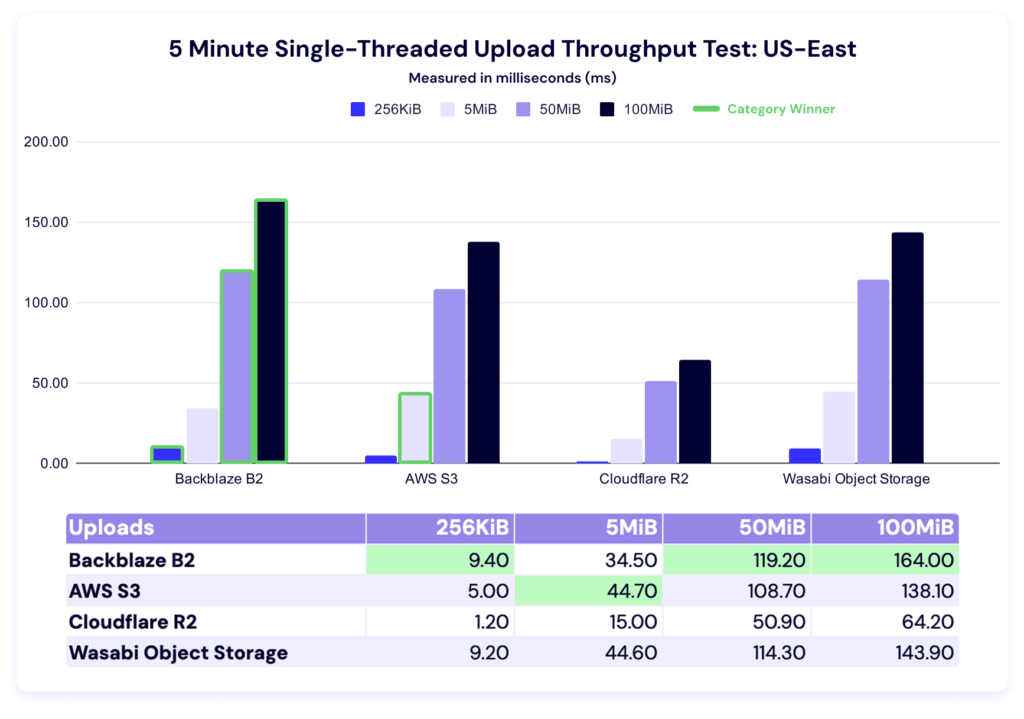
In this test, Backblaze leads in the 256KiB, 50MiB, and 100MiB categories, and AWS leads in the 5MiB category. Here’s our line graph: 
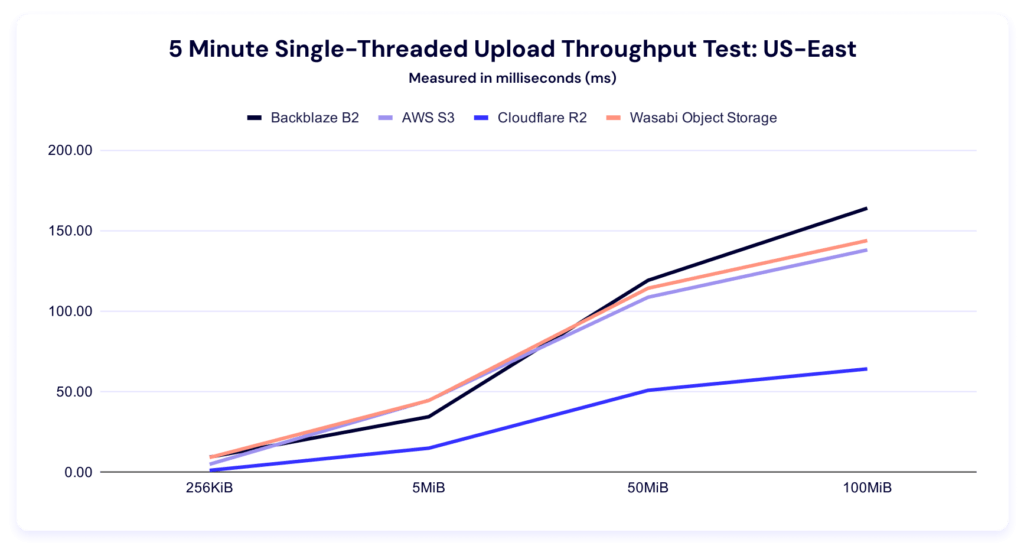
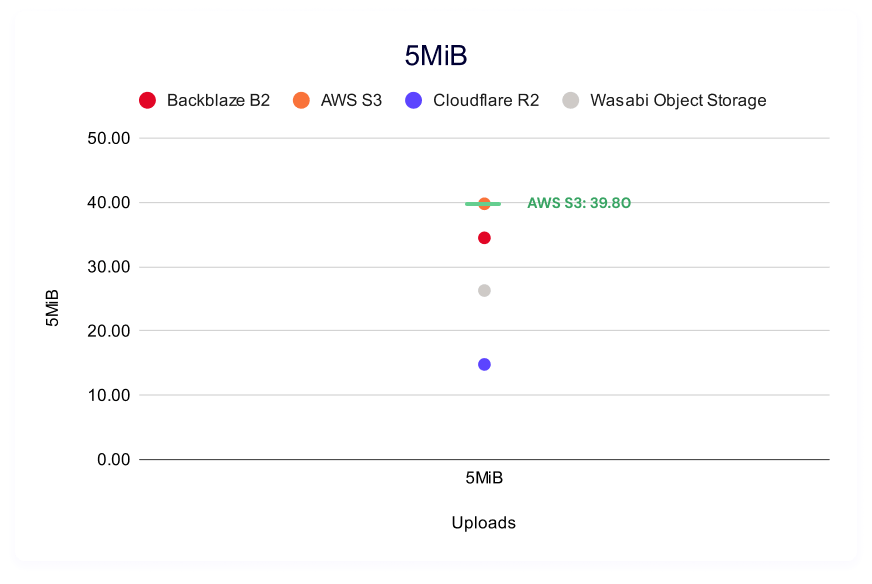
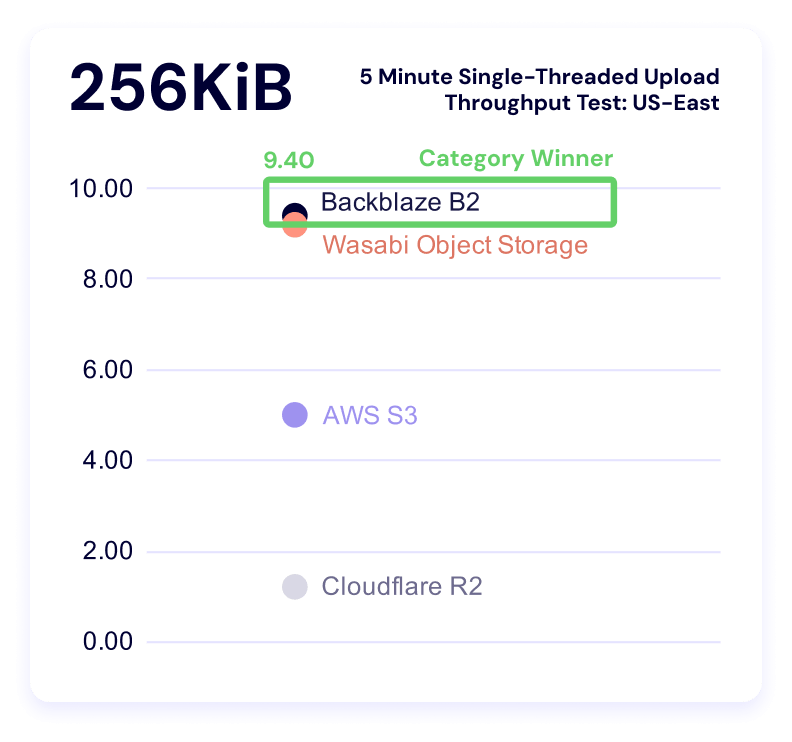
And, like the multithreading results, we see a high degree of variance between our highest and lowest results, which becomes even more apparent in our clustered view:
Download comparisons and TTFB

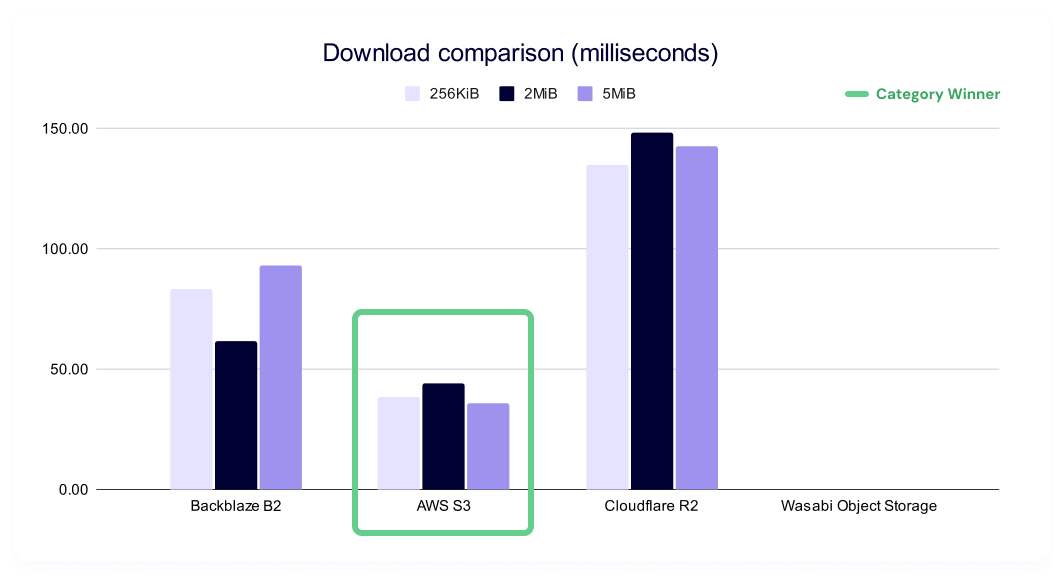
As with our upload average data, lower is better. This test measures how long it takes a single file to download, on average.
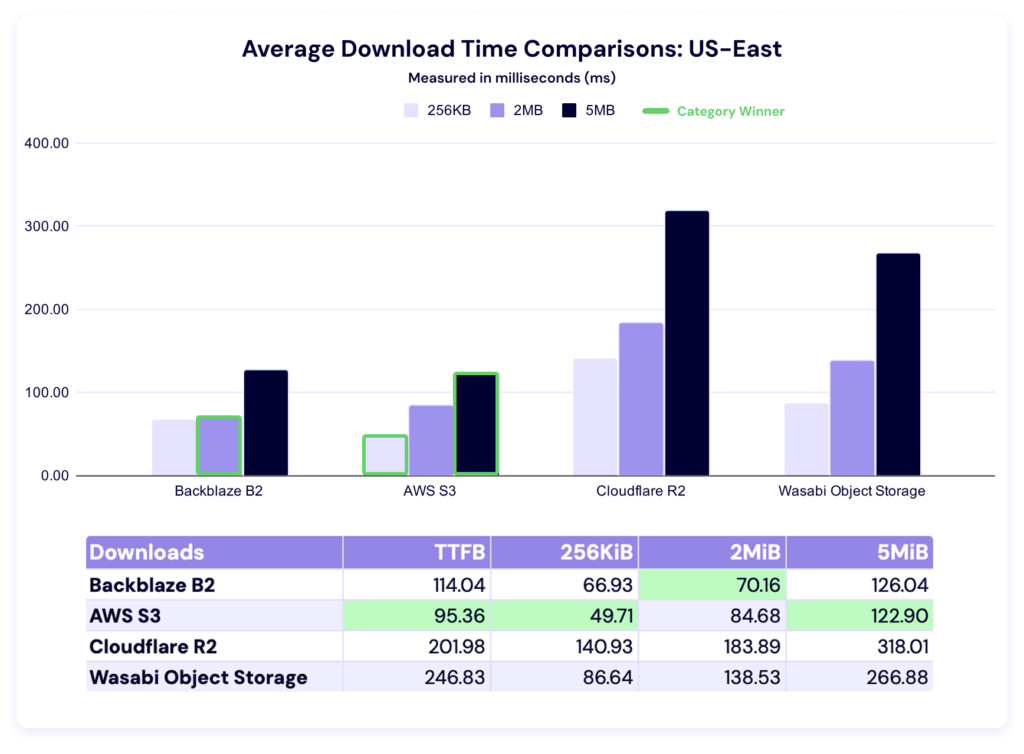
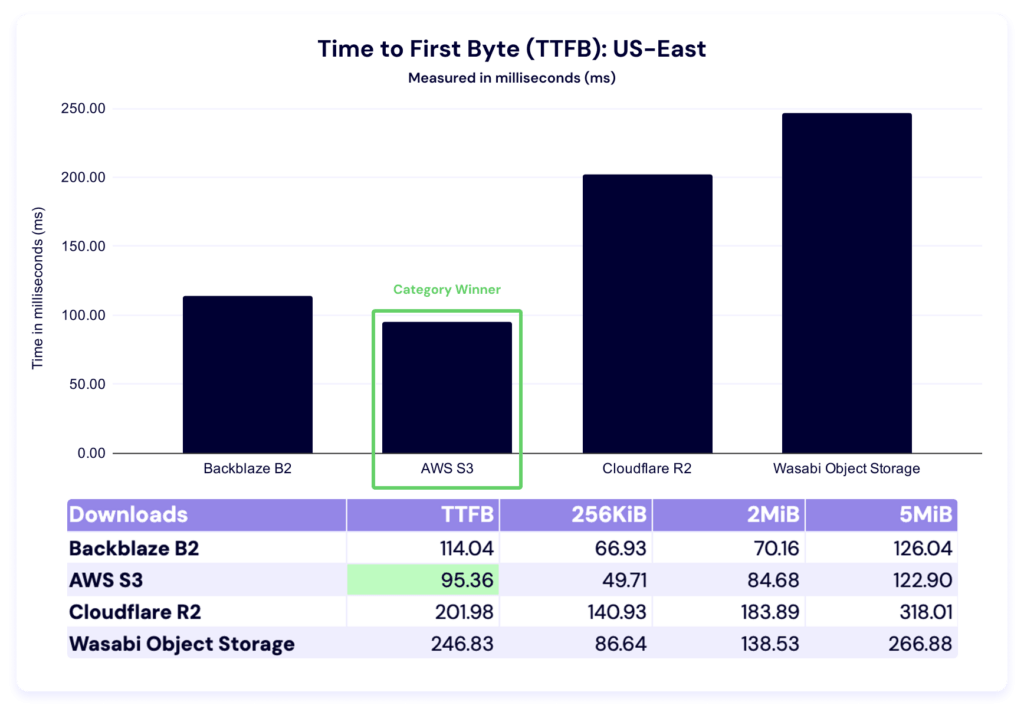
Last quarter, AWS led in all file sizes. This quarter, Backblaze overtakes in the 2MiB category, while Amazon S3 still leads in time to first byte (TTFB) as well as the 256KiB and 5MiB file sizes. Let’s zoom in on time to first byte (TTFB). 
And take a look at our QoQ comparison:
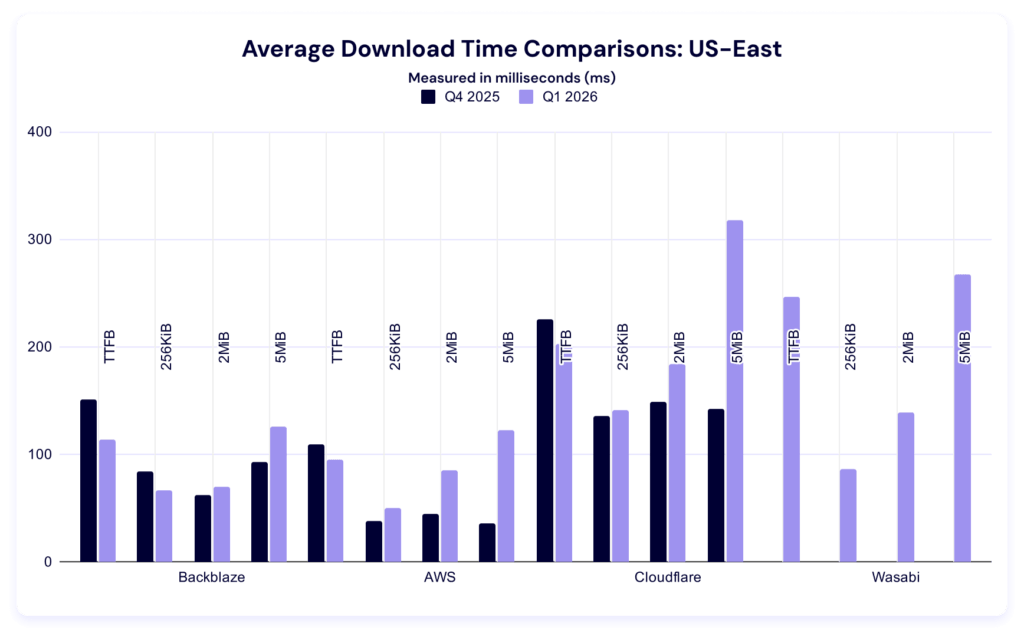
Again, our dataset is too young to determine the significance of changes within each category. Observationally, it’s interesting to note that most of these numbers improved.

Five minute multi-threaded download benchmark

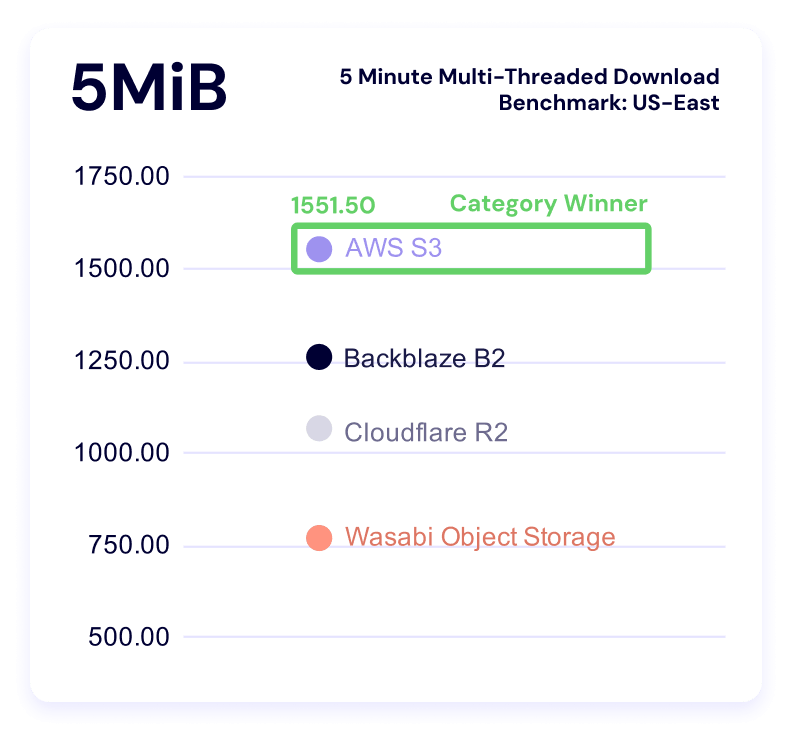
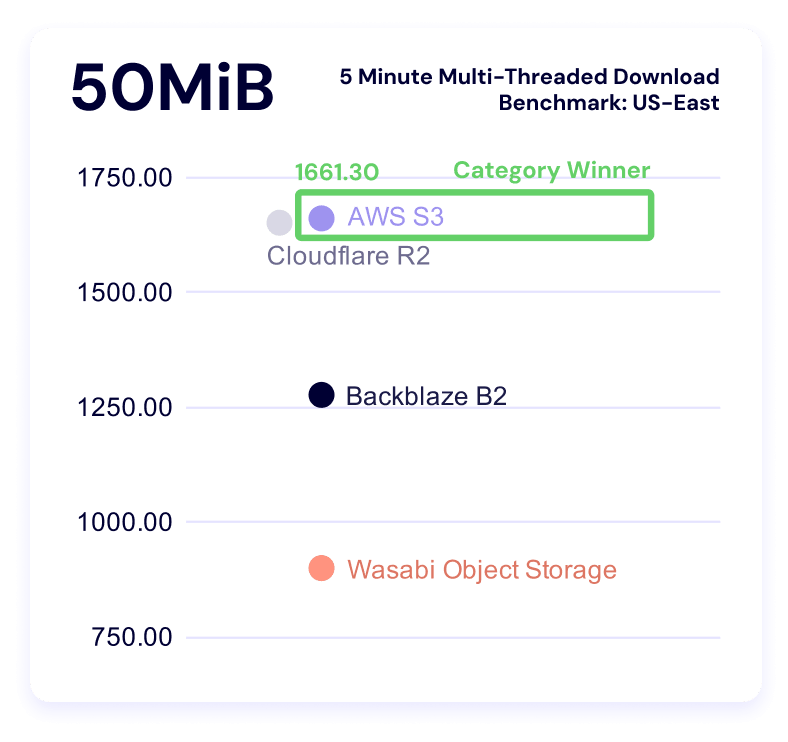
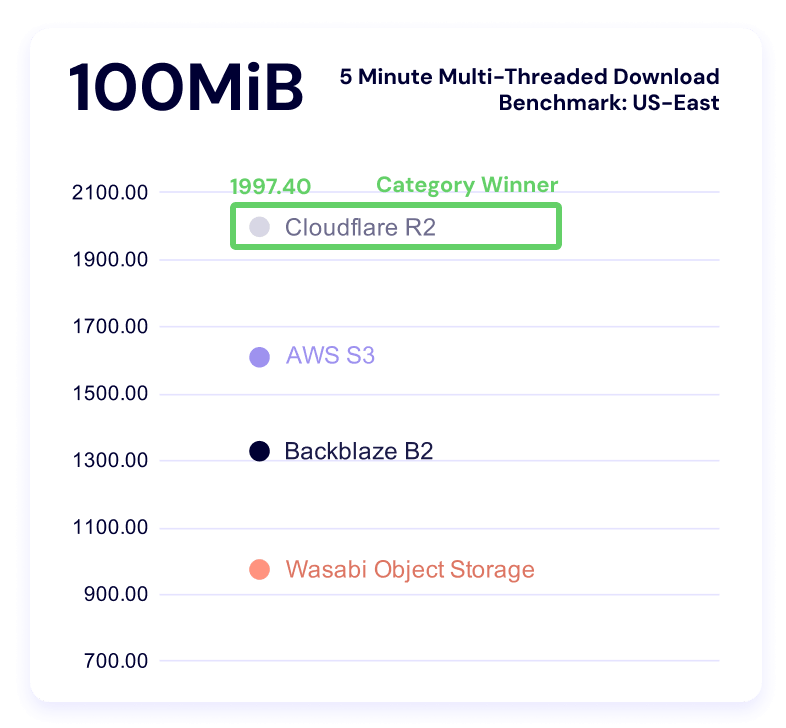
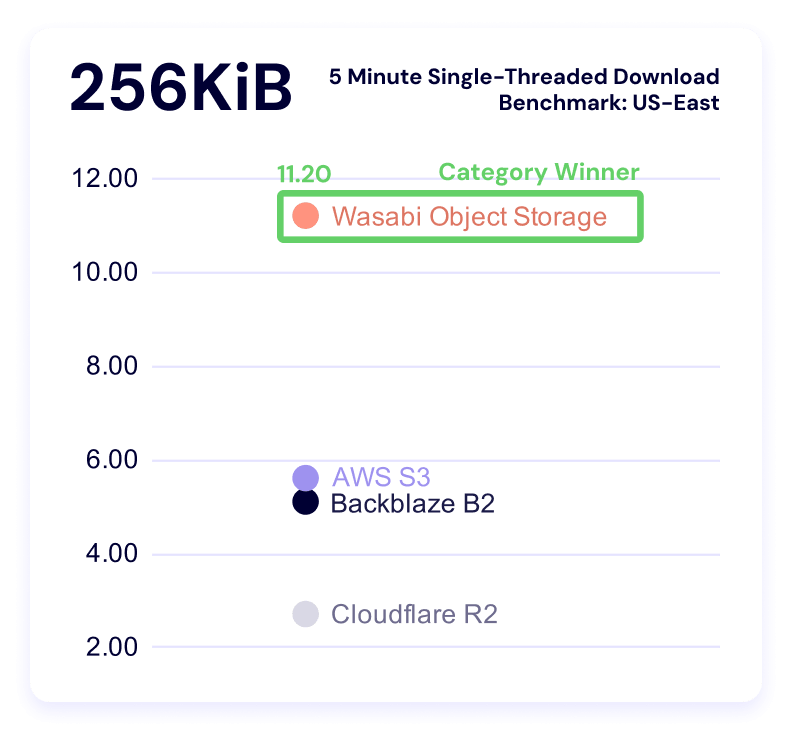
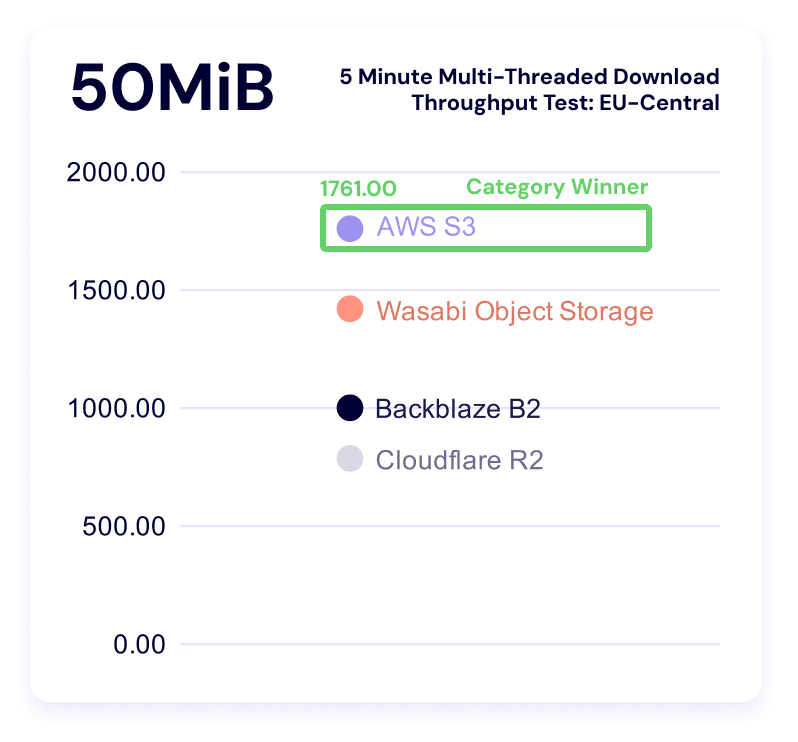
In these tests, a higher result is better, as the result represents more average data being downloaded in the five minute time period. And, as above, we can see Backblaze rate limits in the data. 
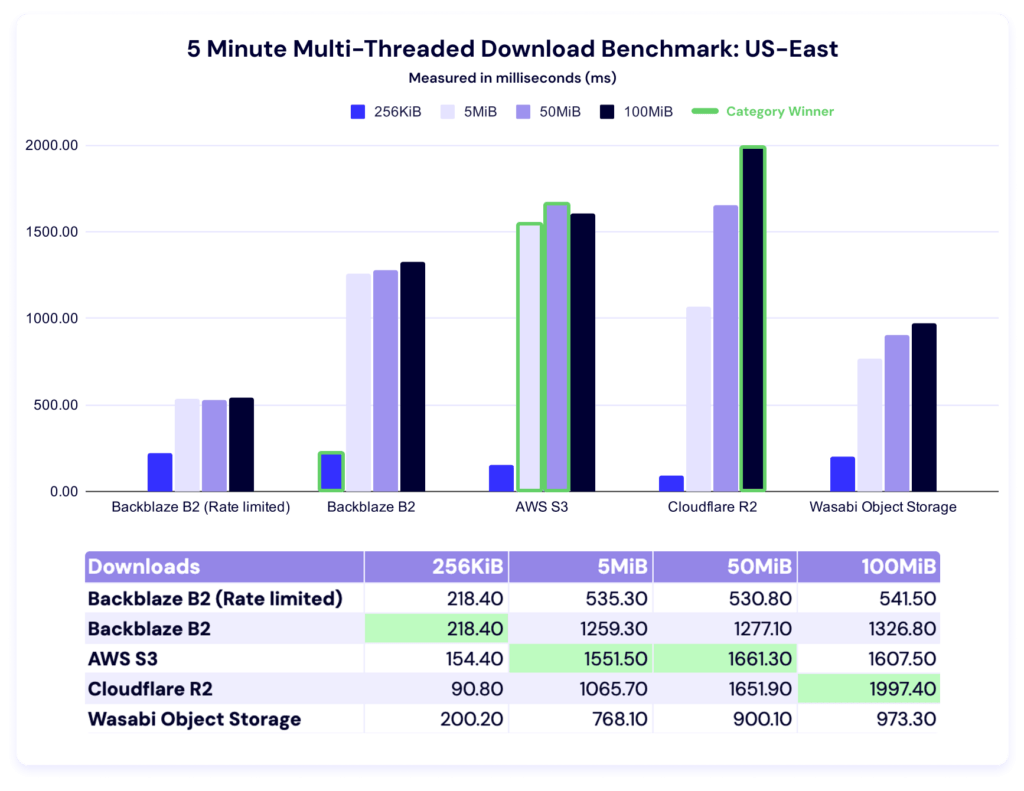
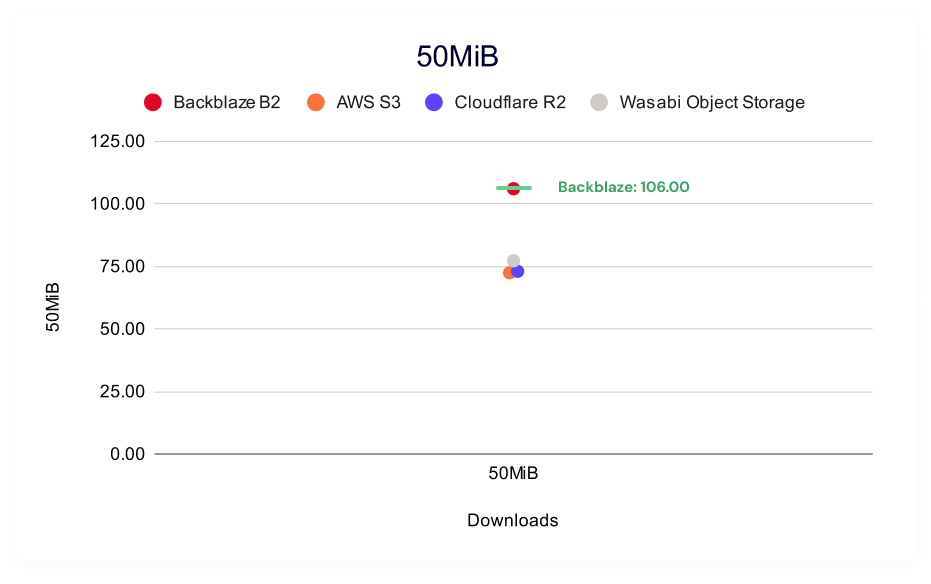
Backblaze leads for 256KiB files, AWS for 5MiB and 50MiB files, and Cloudflare for 100MiB files.

Let’s give ourselves the same charts as our upload tests. Here’s the trendline: 
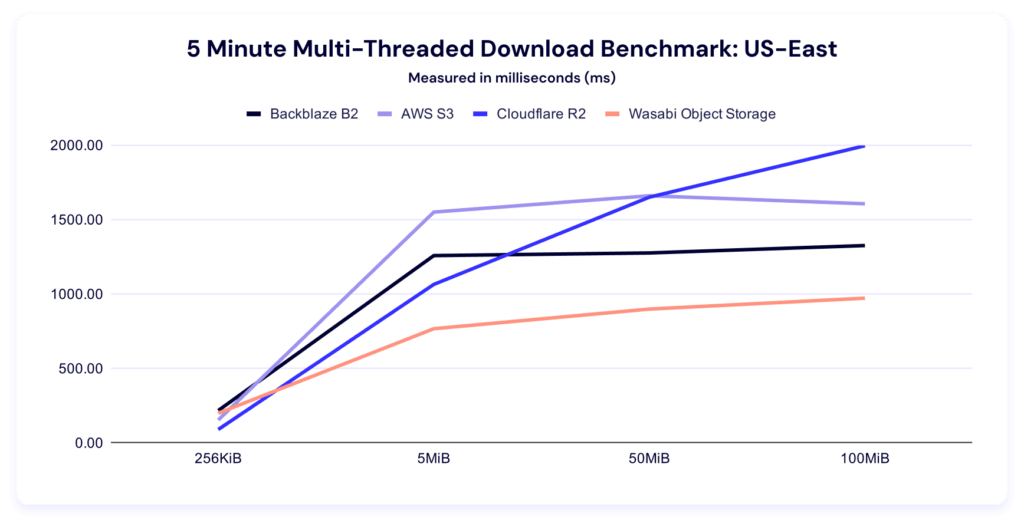
This chart makes clear how comparatively well Cloudflare R2 does at the larger file sizes—and as their core business is CDN, that makes a lot of strategic sense. 

Here’s the per-file size clustering: 

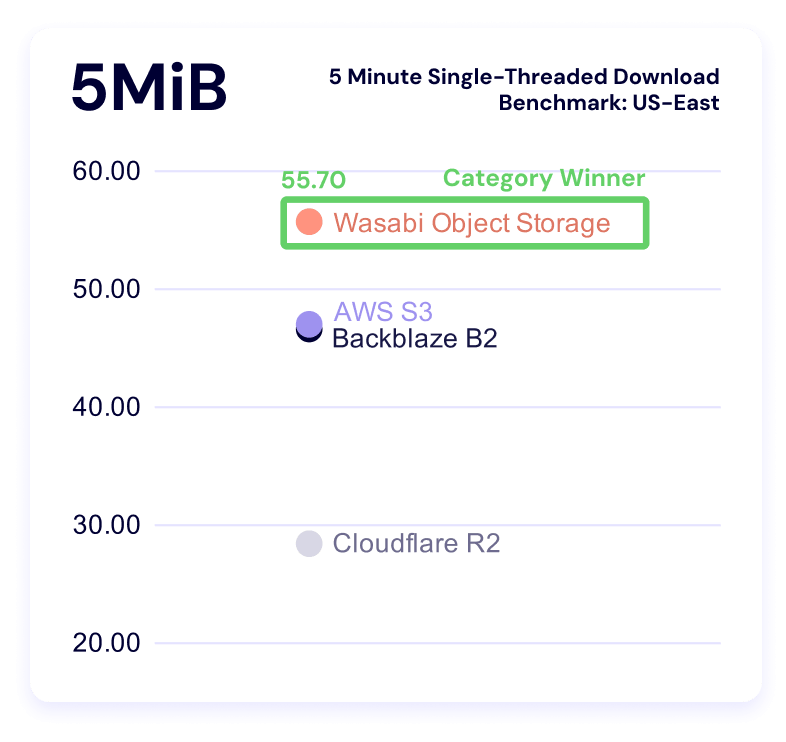
Five minute single-threaded download throughput
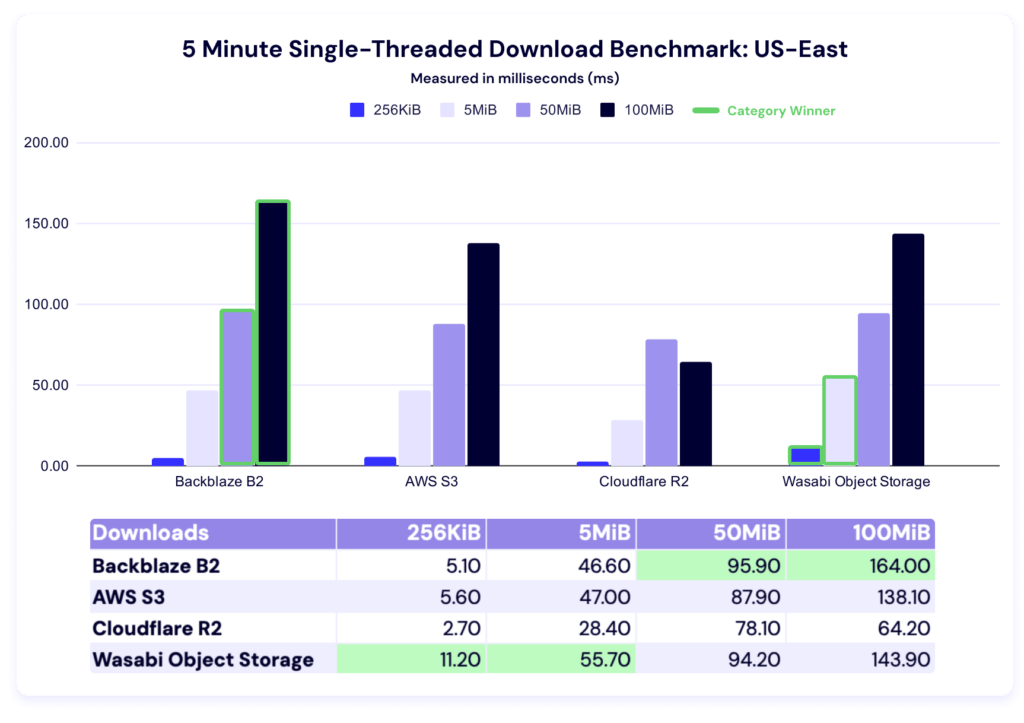
Wasabi comes in first for 256KiB and 5MiB files, and Backblaze for 50MiB and 100MiB files.
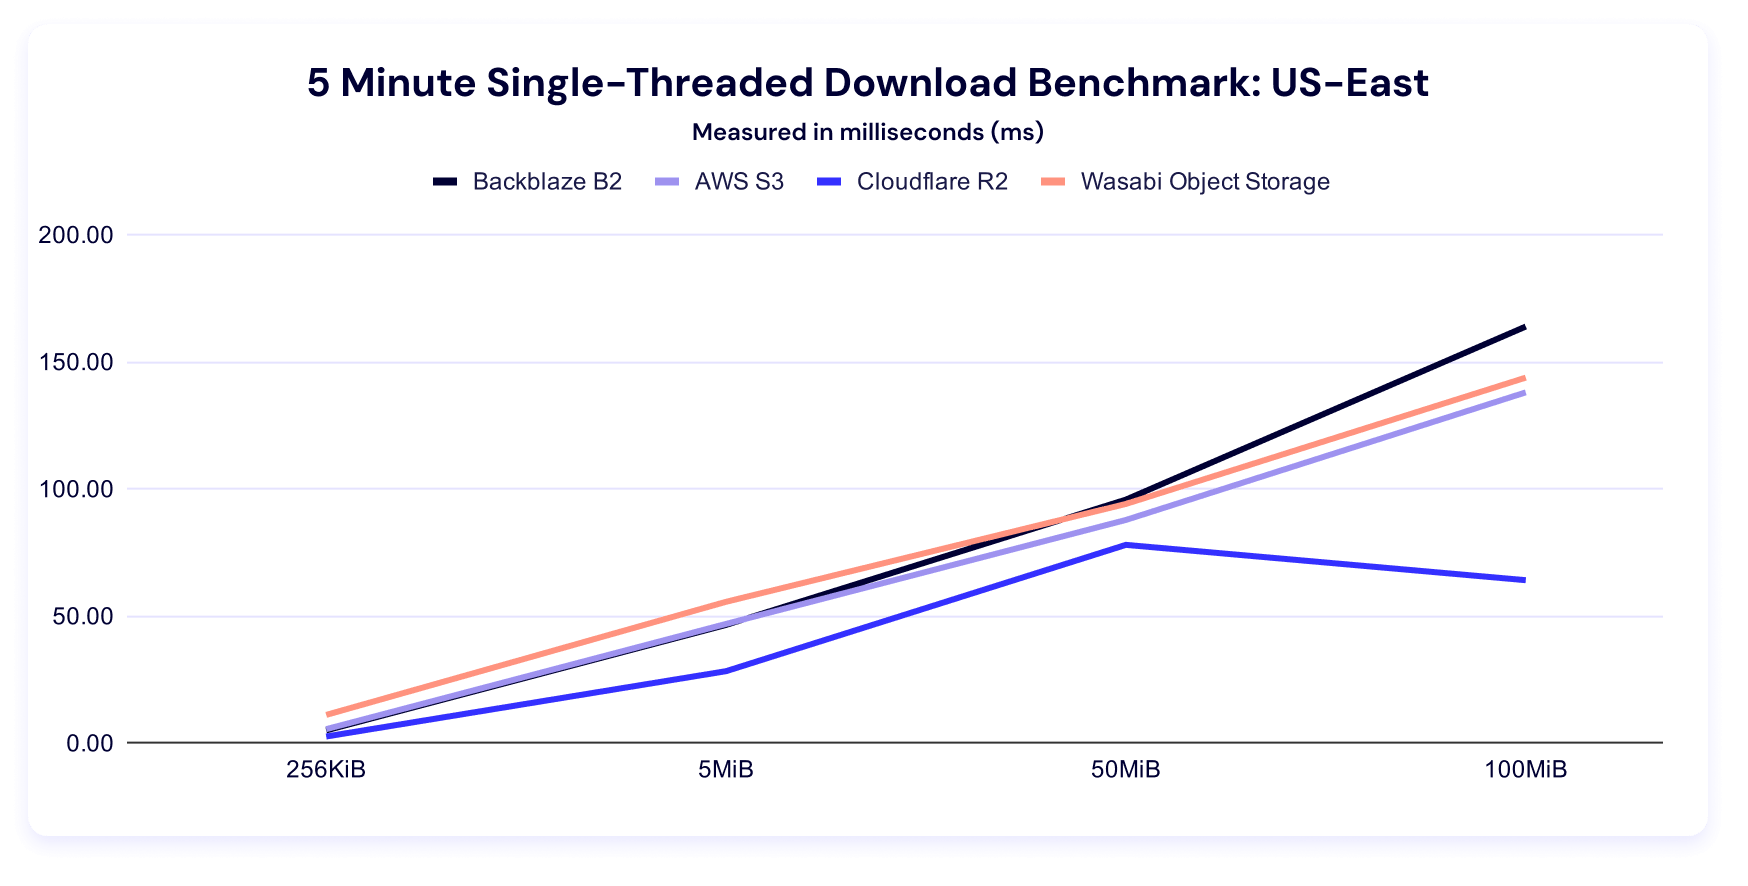
A line graph showing 5 minute single threaded download benchmark times for US-East.

And here’s our clustering:

EU-Central

Welcome to the new region! We’ll keep editorializing to a minimum—here’s the EU data.

Upload averages
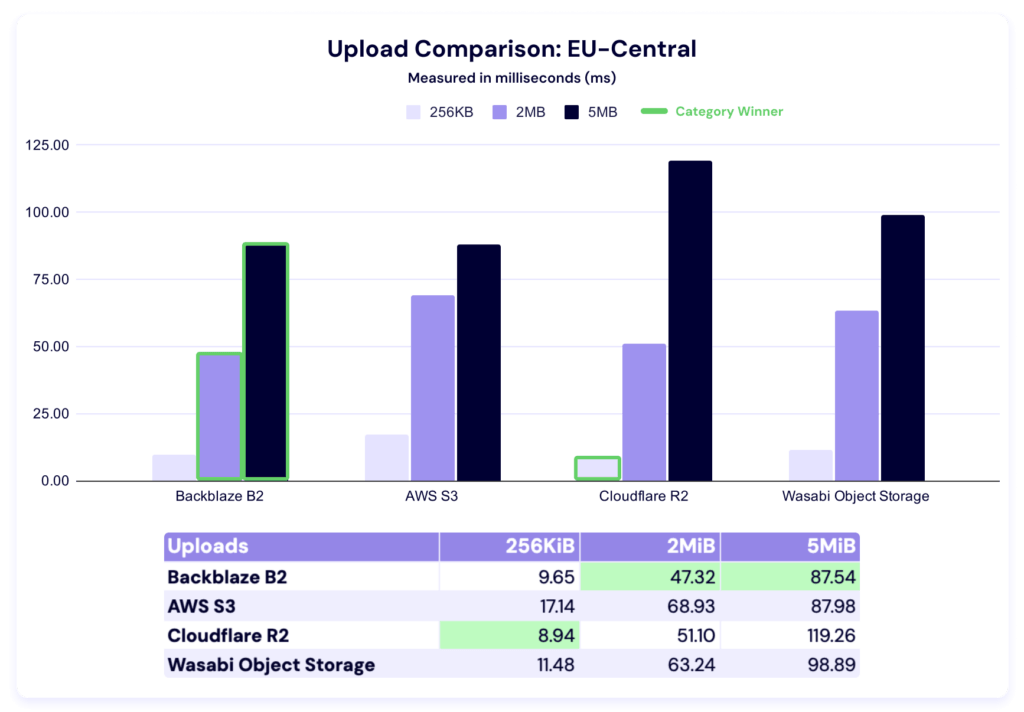
In this test, Cloudflare R2 takes the 256KiB category, while Backblaze is the fastest for both 2MiB and 5MiB file sizes. It’s tempting to compare these numbers to the US-East performance, but certainly premature. 

At the very least, it’s a good reminder of the strength of a multi-cloud approach—there’s always a balance between relying on a single provider regardless of their geographic presence or their strength in your particular use case needs.  Specialists bring value to the table if and when their addition doesn’t outweigh the operational costs of complexity.

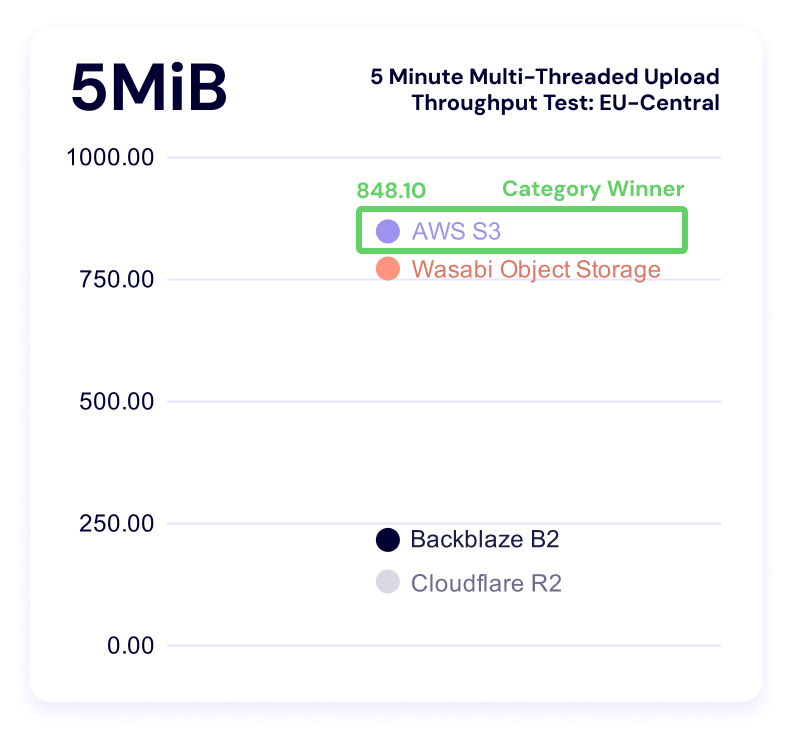
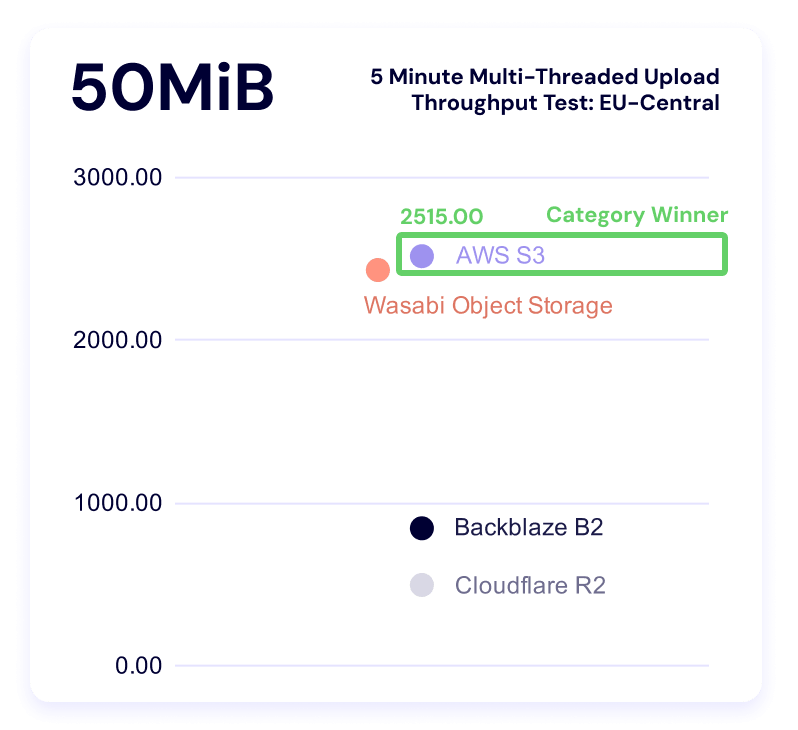
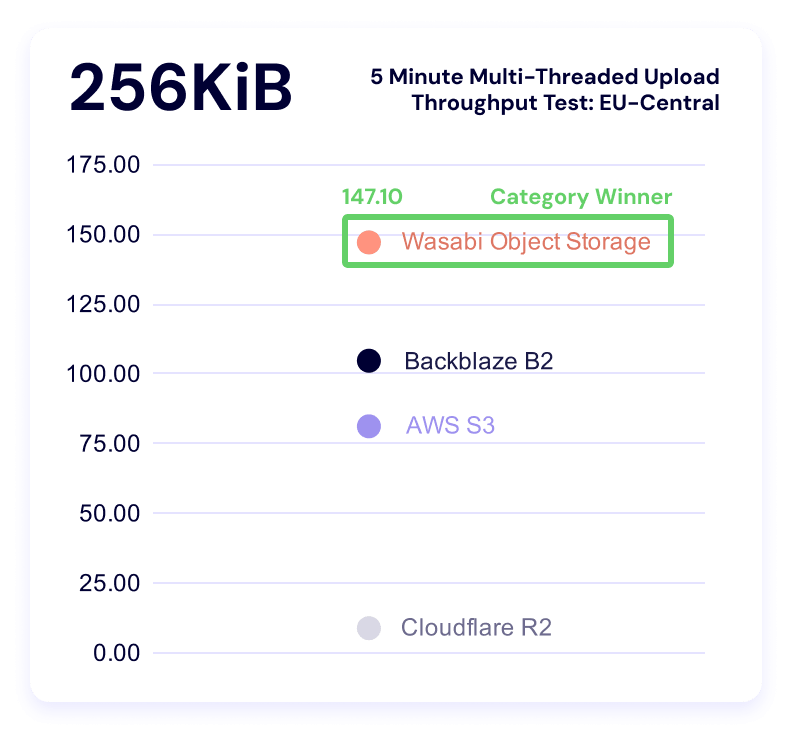
Five minute multi-threaded upload test

Top of section reminder: Higher is better in this test.
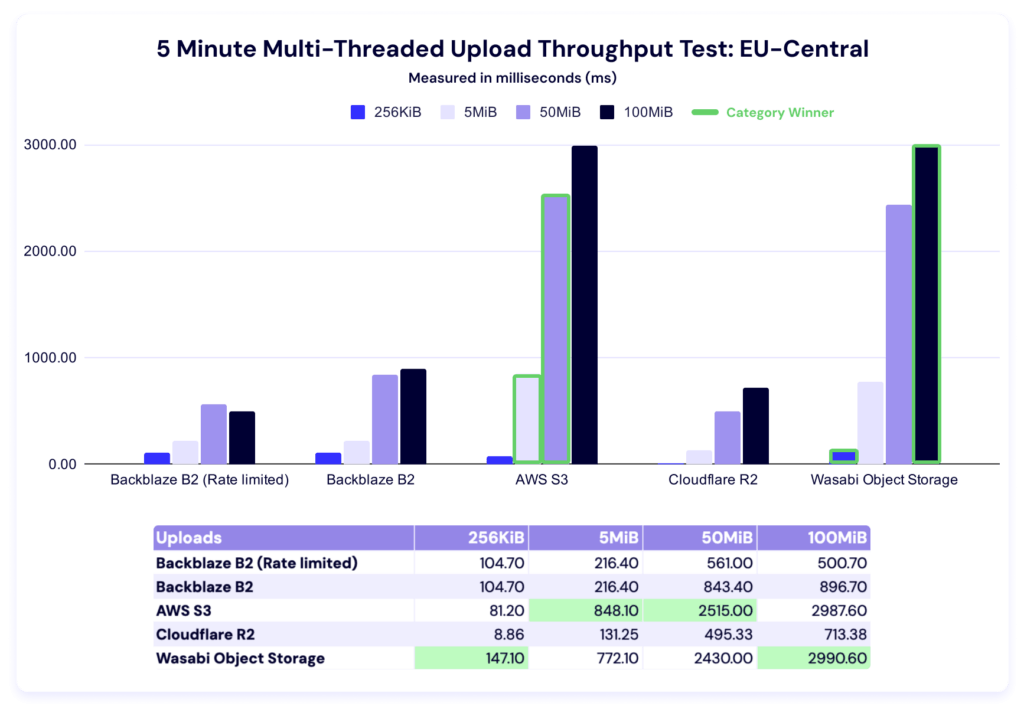
In these results, Wasabi leads in the 256KiB and 100MiB categories, while AWS wins out for the 5MiB and 50MiB file sizes. 

Here’s the trendline:
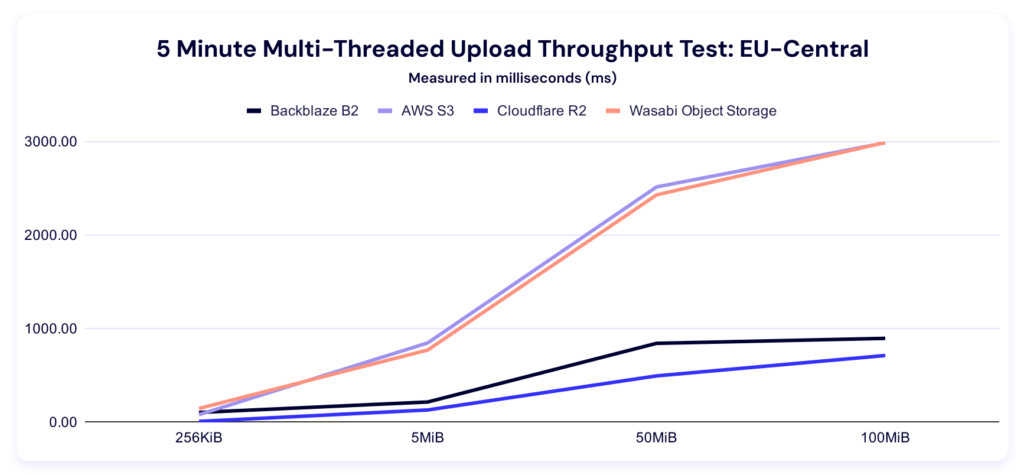
And here’s the by-file-size clustering:
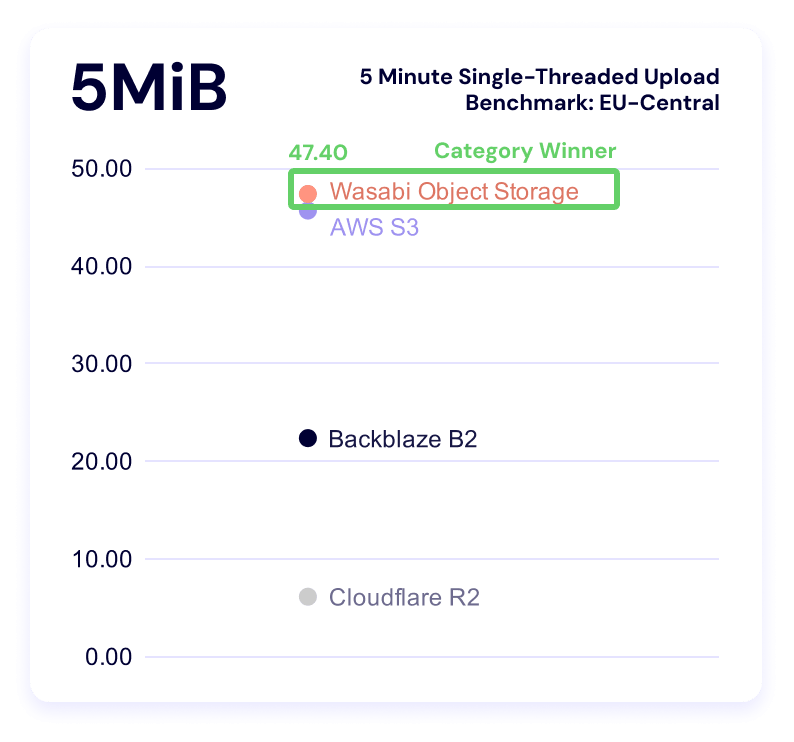
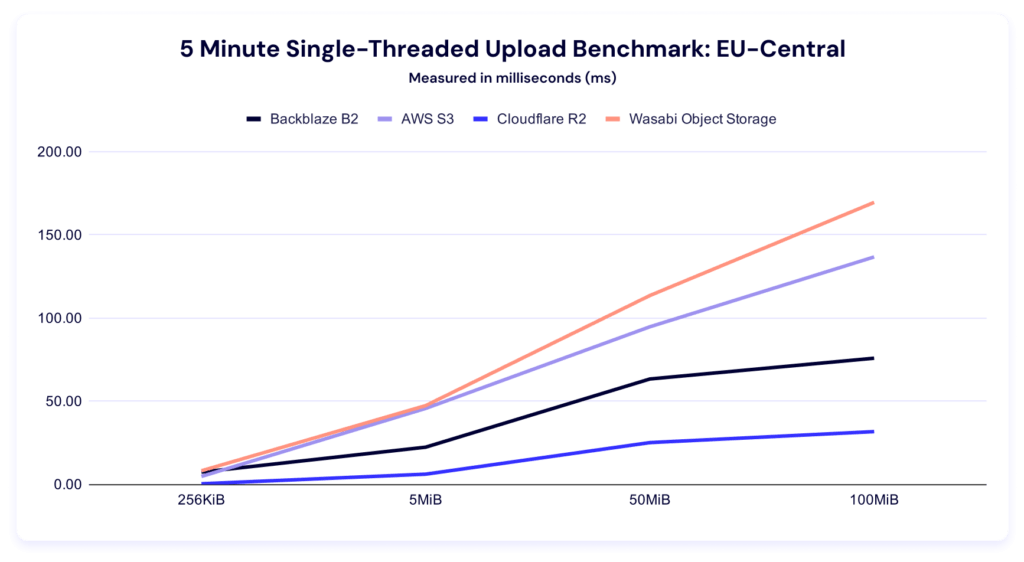
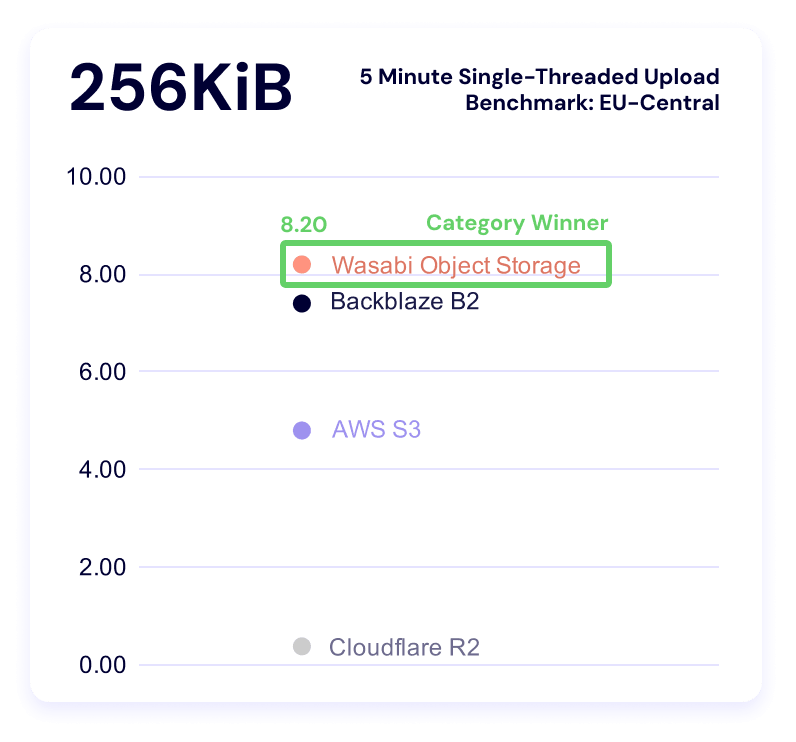
Five minute single-threaded upload test
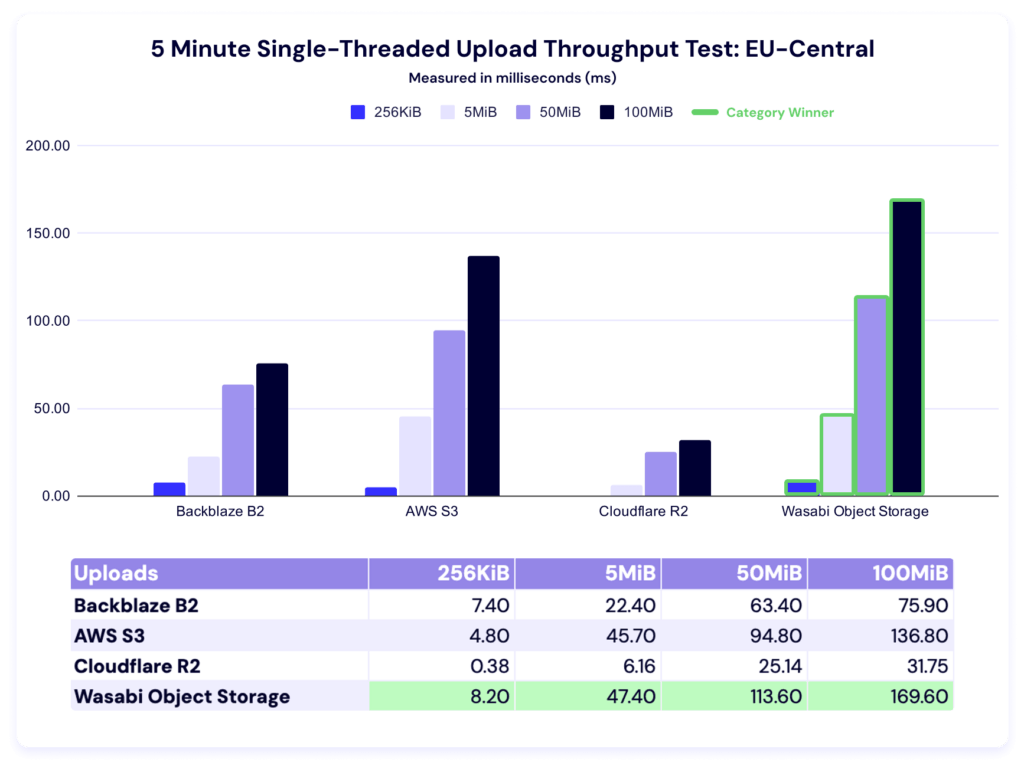
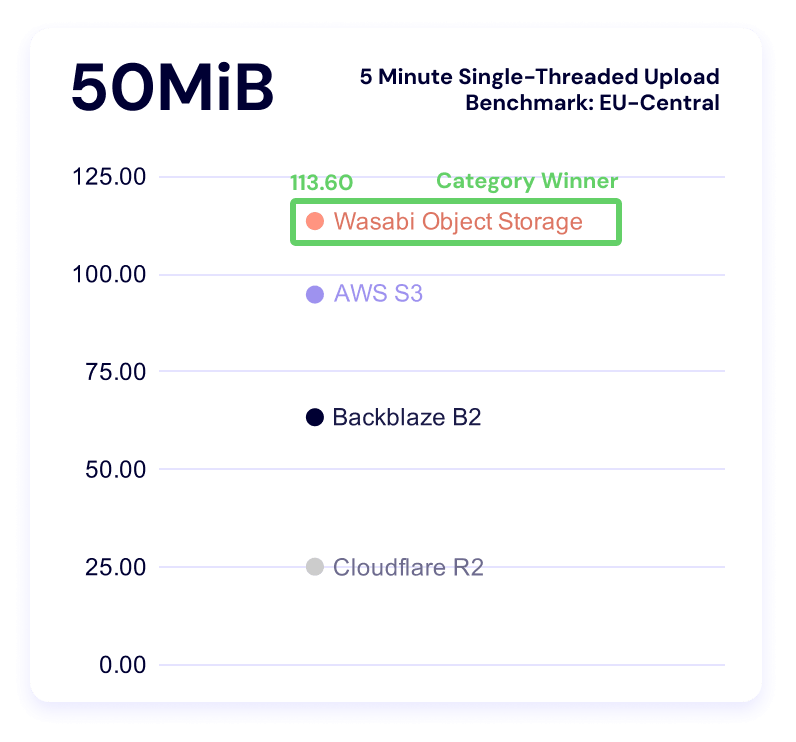
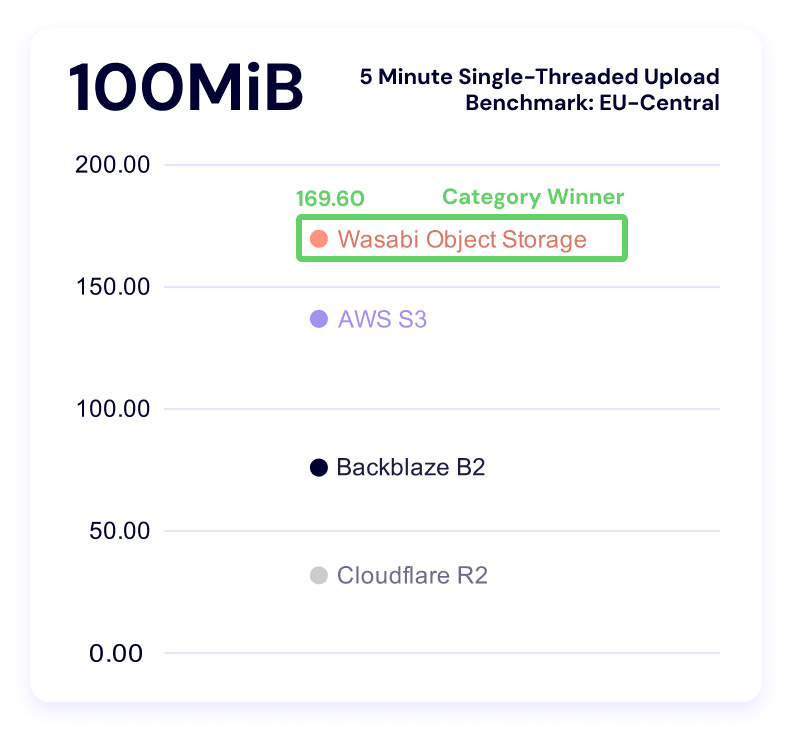
Wasabi dominates this category. Backblaze is a close second for the smallest file size, and S3 takes second for both the 50MiB and 100MiB categories.
Download averages and TTFB
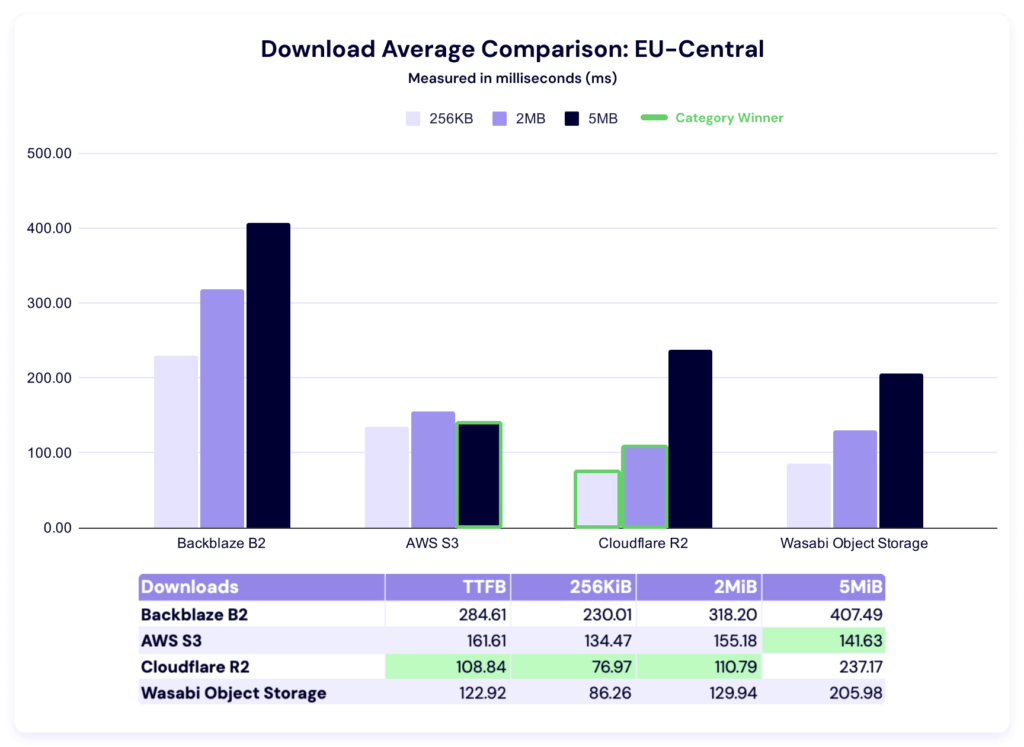
Cloudflare performs well in this region, with the fastest average times in TTFB, 256KiB, and 2MiB categories. AWS wins on the remaining 5MiB file size. Here again we see a huge delta between the highest and lowest average times. 

And, here’s our TTFB chart:
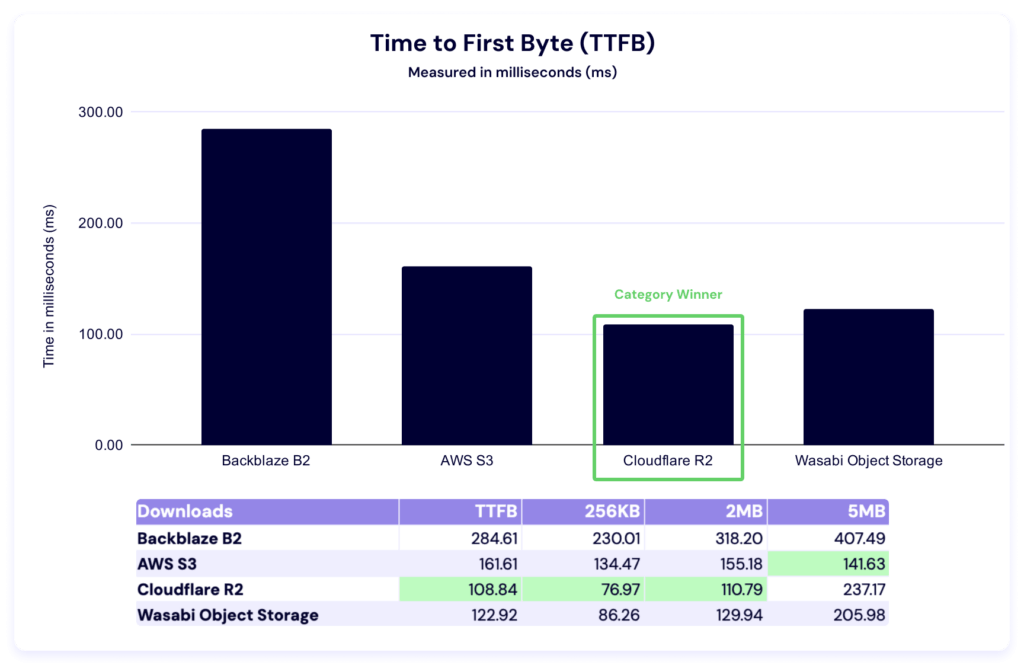
Just like in the Drive Stats series, when we see numbers like this, we do some internal investigation—comparative numbers show us where we can improve, which is why this testing is so critical. We’ve identified an issue we believe was contributing; we’ll report on the impact of our fixes in a future report.

Five minute multi-threaded download test
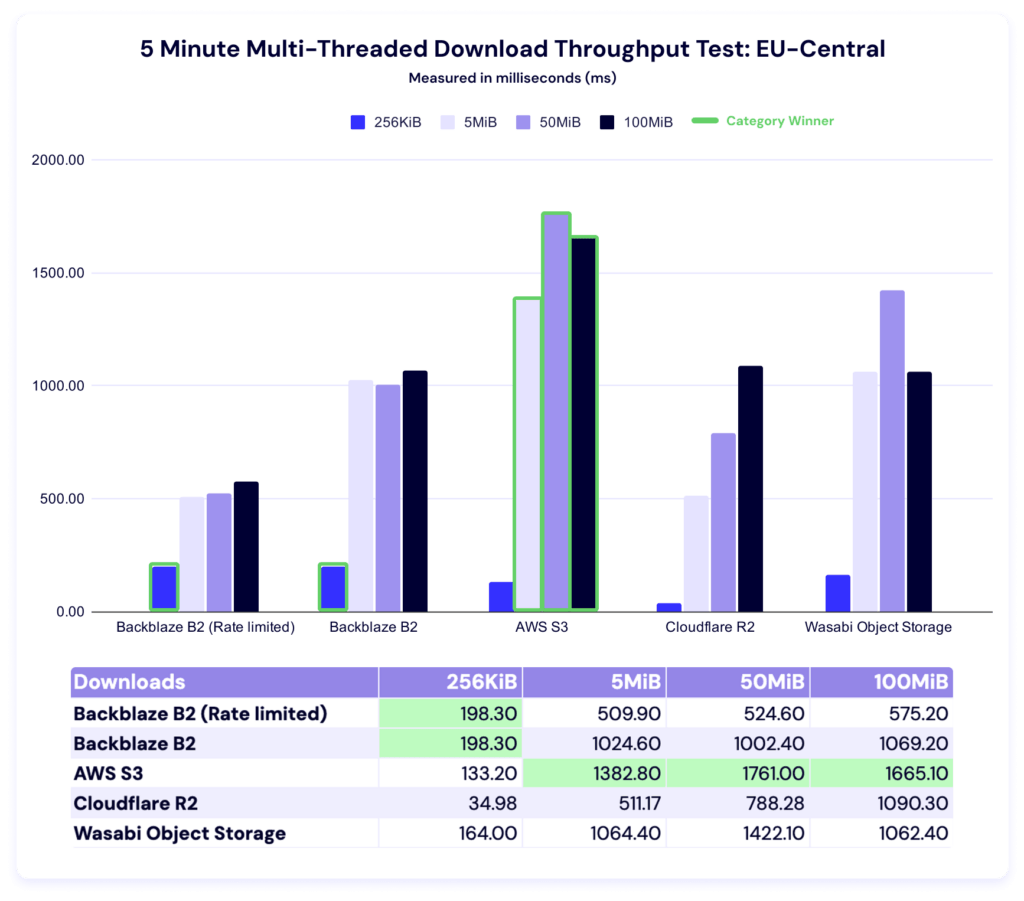
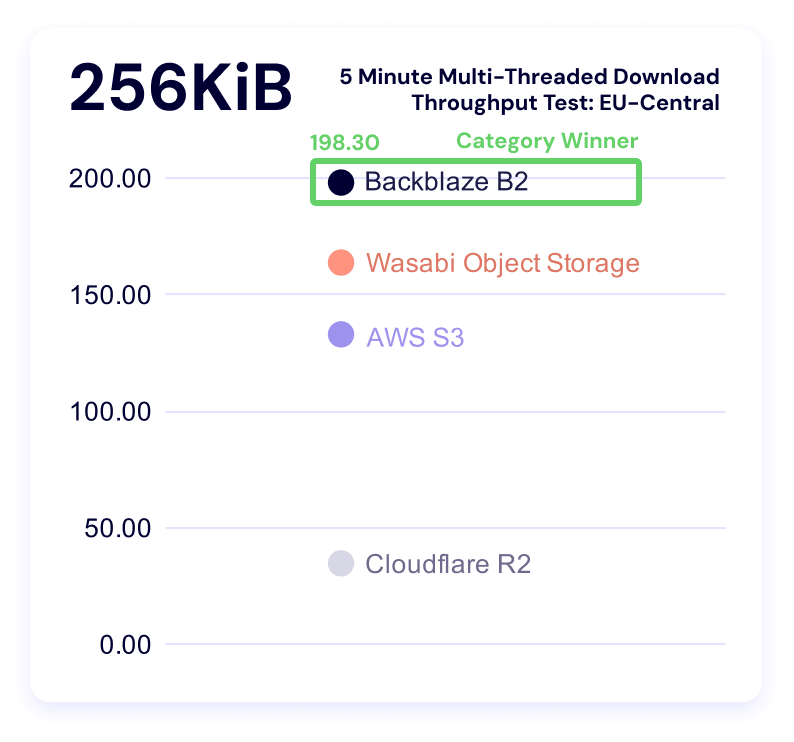
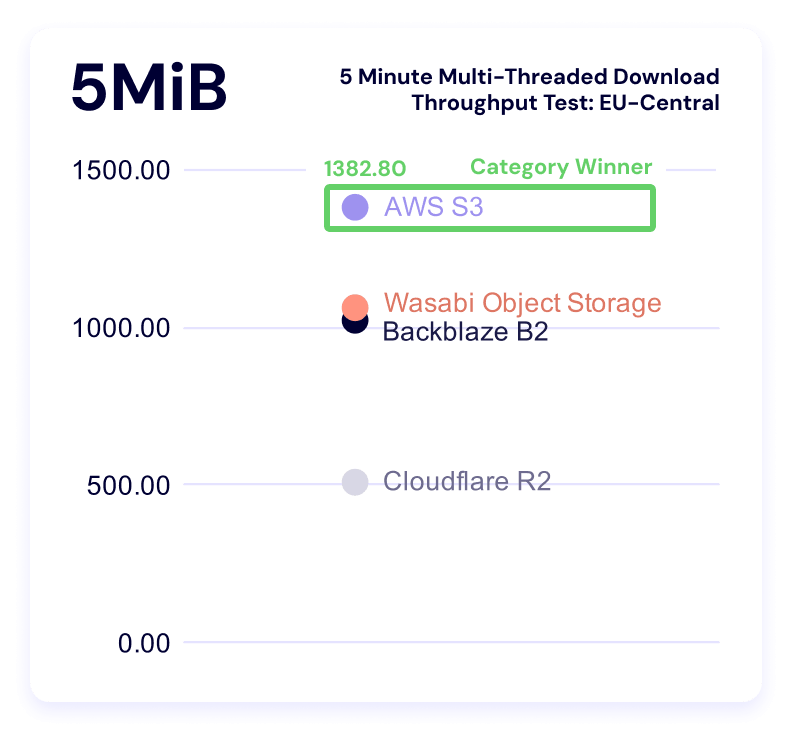
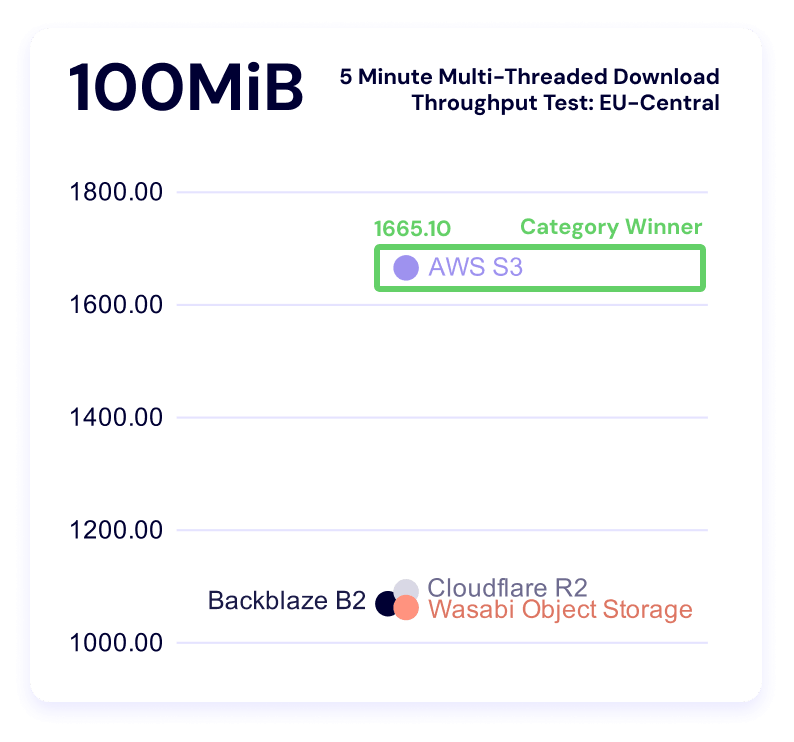
Backblaze leads in the 256KiB file size, while AWS leads in the other three categories. Let’s look at our alternate views. 
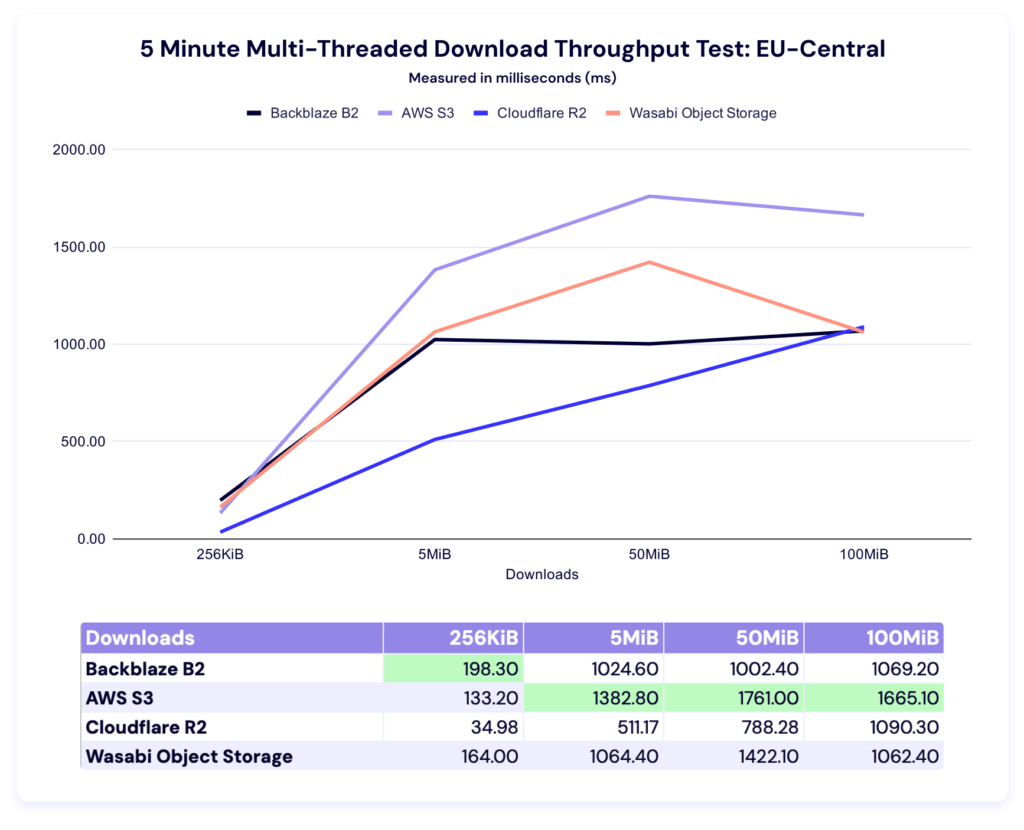
Five minute single-threaded download test
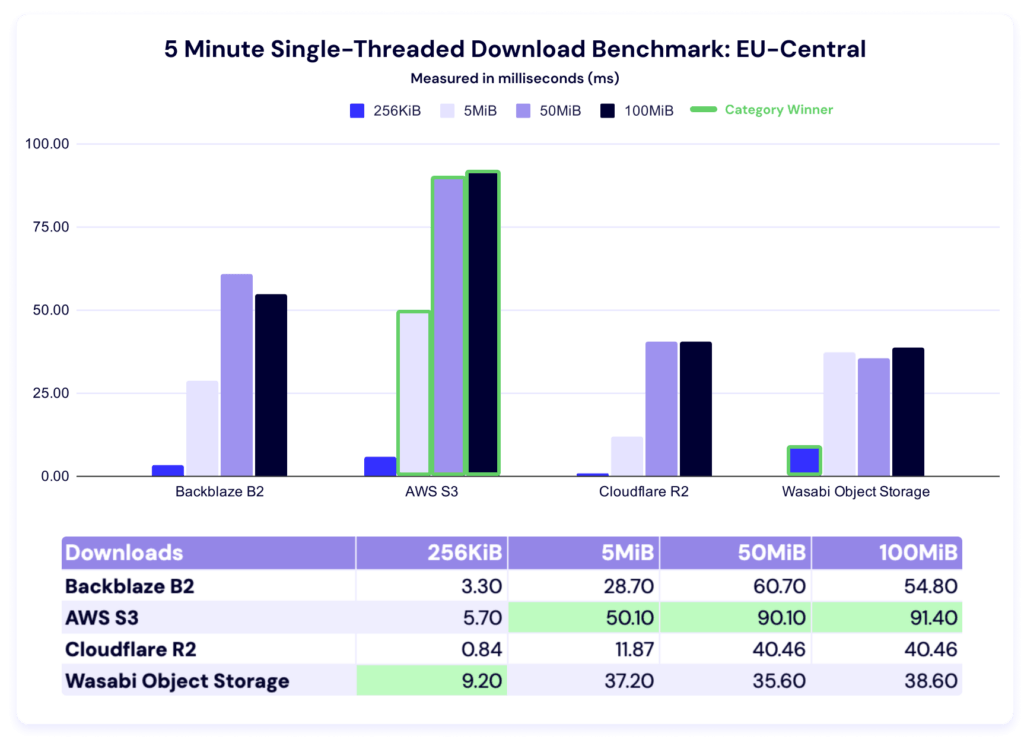
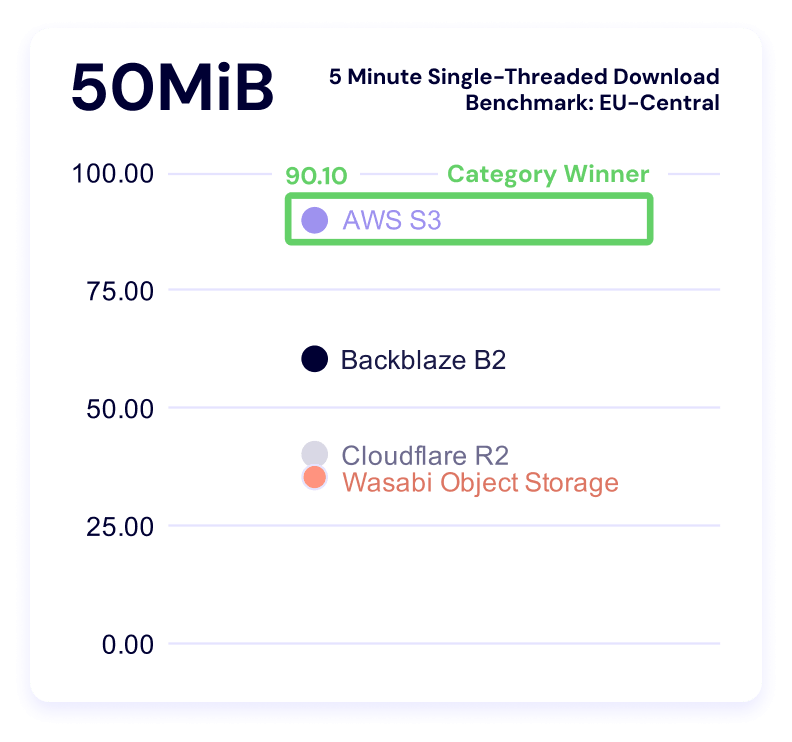
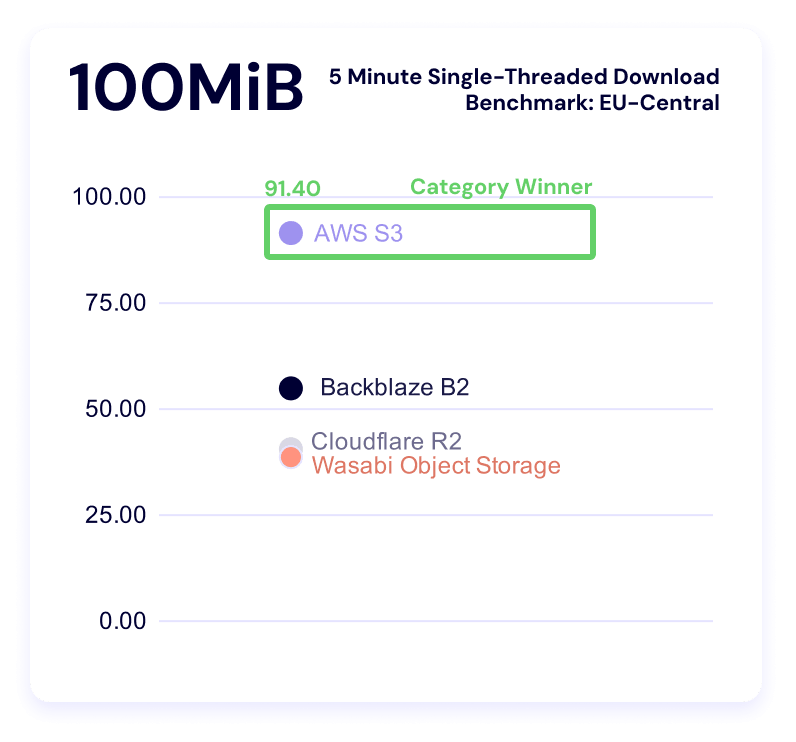
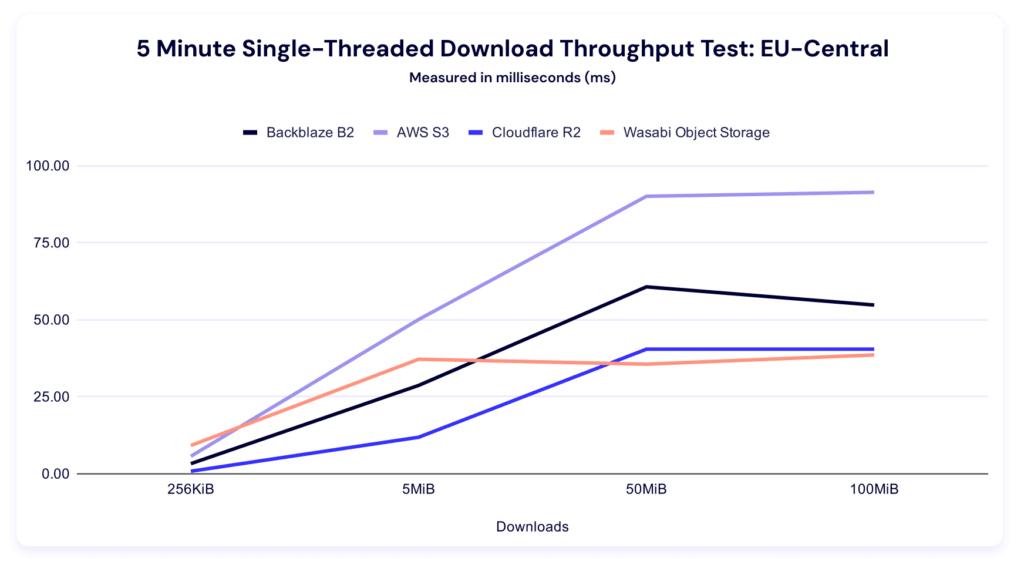
Wasabi comes first in the 256KiB file size, while AWS leads in all other categories. Here’s the trendline:
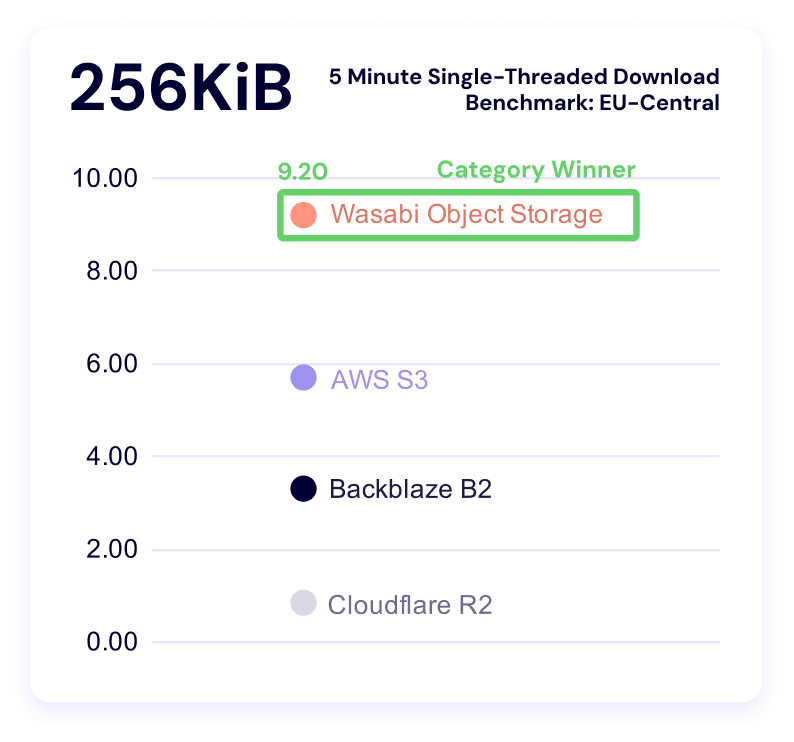
And our clustering:
Test methodology

Our goal with these benchmarks is simple: to understand how our cloud performs under real-world conditions and to share that information as clearly as possible. To do that, our Cloud Operations team runs repeatable, synthetic tests that measure upload (PUT) and download (GET) performance. 

We ran both upload and download tests across all six vendors. Upload tests measured average total time to download a single file of the following file sizes:

  • 256KiB
  • 2MiB
  • 5MiB

Download tests measured:

  • Time-to-first-byte (TTFB)
  • Average total time to download the following file sizes:
    • 256KiB
    • 2MiB
    • 5MiB

Throughput tests run in five-minute profiles to observe consistency over time, and we ran both single and multi-threaded upload and download tests. From a practical perspective, what’s happening in this test is that we’re pushing repeated requests to a cloud storage provider as many times as we can for five minutes. In multi-threaded tests, we run 20 concurrent threads. Throughput tests use the following file sizes: 

  • 256KiB
  • 5MiB
  • 50MiB 
  • 100MiB

All tests originate from a Vultr-hosted Ubuntu virtual machine (VM) located in the respective test regions (US-East and EU-Central), routing through Catchpoint’s network into the object storage regions. By keeping the source environment stable and the test target consistent, we isolate performance variables within each provider’s infrastructure rather than the test environment itself.

Consistency measures

To ensure each test result represents genuine performance rather than environmental noise, we built repeatability into the process:

  • Identical test instances: All runs used the same VM type, operating system (OS) image, and configuration.
  • Fixed regions: Tests originated from the same location (NY/NJ) targeting the same US-East or EU-Central region across providers.
  • Controlled routing: Network paths were held constant through Catchpoint’s monitoring network to minimize geographic or peering variation.
  • Repeated runs: Each test profile (5 min) was executed multiple times, and averages were used to reduce the impact of transient spikes.
  • Standardized payloads: All uploads and downloads used identical objects to ensure a consistent file-size baseline.
  • Unchanged test intervals: Tests were scheduled at regular intervals over multiple days to capture both typical and outlier performance.

About synthetic testing

Synthetic monitoring provides a controlled, apples-to-apples comparison, but it doesn’t replicate every production workload. These tests are run outside our own infrastructure—from neutral vantage points—to simulate a customer’s experience at the “last mile.” This distinguishes our approach from competitors who benchmark internally under optimized conditions.

It’s important to note that synthetic results won’t mirror every customer’s experience. Different architectures, connection paths, and file patterns will produce different performance profiles. Our intent is to offer transparency into the methodology and relative behaviors, not to suggest that all workloads will perform identically.

Limitations and future work

Every benchmark is an approximation. These results provide a controlled look at how cloud storage performs under repeatable conditions, but they don’t capture every variable in production environments. Below, we outline what our current tests don’t measure and where we’re headed next to deepen the picture.

  • Synthetic, not real-world workloads: These benchmarks simulate real activity but don’t reproduce the full variability of customer workloads, concurrency levels, or data locality patterns. They are best understood as directional insights rather than absolute truths.
  • The internet is the internet: Once traffic leaves the test node, we can’t control the routing, peering, or transient network conditions between endpoints. Each provider’s own network policies and routing optimizations—for example, Wasabi’s inbound connection rules—can influence the results.
  • File size constraints: Our testing environment currently limits file sizes to 10MiB or smaller due to timeout thresholds. That means we can’t yet model the large-object transfers typical of certain workloads.
  • Static test conditions: All tests were conducted from a single region (NY/NJ to US-East cloud providers). Real-world customers operate globally, where peering arrangements, congestion, and latency differ widely.
  • Potential caching effects: Although we designed the tests to avoid cached reads, Catchpoint does not allow full data randomization. It’s possible some repeated reads benefited from intermediate caching at any network layer. 
  • Traffic shaping and rate limiting: Providers may apply rate limits or throttling when detecting high-frequency test traffic. For example, Wasabi temporarily blacklisted our IPs due to testing volume—a reminder that these results represent observed behavior, not formal service guarantees.

Your mileage may vary, or what this means in the real world

One of the reasons it’s so hard to get directly comparable performance benchmarks is because there are so many configurable elements on the user’s side that can affect the results. For example, if you know that your provider is faster on smaller files, you might choose to store your unstructured data in smaller parts so that you achieve faster performance. 

We did some comparison between existing use cases that Backblaze succeeds based on the data above including AI/ML inference, feature stores and embedding lookups, LLM-based RAG systems, log and event analytics, interactive data lake querying, and CDN origin. The biggest takeaway is something that we noted when talking about the EU metrics—specialists bring flexibility to the table, which is where you truly start to unlock value. 

For a cloud storage provider, tracking these metrics over time and comparing to other aspects of our internal architecture enables us to support ongoing and continual performance improvement, and to understand how much of an impact single changes might make. This means that what seems like a simple project to change the way we read header requests can produce asymmetrically favorable results.

What’s next?

Performance is an evolving target, and this dataset is still early. What we can say today is directional: different providers behave differently under different conditions, and those differences become more pronounced as workloads scale.

We’ll keep expanding this work in future reports—across regions, workloads, and test conditions—with the expectation that clearer patterns will emerge. In the meantime, the most valuable use of this data is to map it against your own systems, your own constraints, and your own definition of performance.

If you’re doing that, we’d like to hear what you’re seeing. Sound off in the comments below, on socials, drop us a line by email, or send us some questions you want answered in the upcoming webinar

The post Backblaze Performance Stats Q1 2026 appeared first on Backblaze Blog | Cloud Storage & Cloud Backup


Backblaze Performance Stats for Q3 2025

Post Syndicated from Performance Stats Team original https://www.backblaze.com/blog/backblaze-performance-stats-for-q3-2025/

A textured background with the word Q3 2025 Performance Stats on it.

In cloud storage and compute, “less is more” no longer applies. As data grows and expectations rise, businesses need performance, reliability, and real value—not just lower costs. It can be tempting to rely solely on hyperscalers like AWS, but the challenge is understanding where cloud performance truly meets value.

That’s why Backblaze is launching Performance Stats, our newest stats content built on the transparency of Drive Stats and Network Stats. This ongoing, quarterly report will share performance testing results—for both Backblaze and competitors—as well as the testing methodology so that anyone can recreate, compare results, and contribute to building better tests if necessary. (So, feel free to argue with us in the comments.)

By publishing everything—strengths, weaknesses, and all—we’re hoping to give AI leaders, app developers, and decision-makers a clear, honest view of how Backblaze and other cloud storage providers perform in the wild.

Get the full Stats picture live

Drive Stats was the beginning. Want to see the evolution? Check out the Backblaze Stats webinar, bringing together content from all of our Stats series. We’re going to chat about all things Backblaze and beyond—by the numbers.

Save My Seat

Cutting through the noise on cloud performance 

Frankly, it’s super frustrating how opaque performance metrics can be, and how many misleading storage reports are out there. Building accurate tests is complicated for a lot of reasons—so many factors are contingent on things that product builders and even end users control, like where and how data is stored, where it’s being served to end users, and so on. And, most published content on this topic has been tested from inside the cloud storage company’s architecture, which means that they’d give themselves preferential results.  

While our report may not be perfect, our transparent approach—particularly publishing the testing methodology—will allow us to mitigate some of those concerns. 

We want to take a hard look at performance on a level playing field for two reasons: 

  1. Buyers should know what they’re getting and have the tools to sniff out the hype and misleading messaging many providers peddle about their performance. 
  2. If we don’t measure ourselves, we won’t get better. We want you to understand where we’re doing well today, and we want to take you along for the ride as we work to improve where we’re not. 

Without further ado, here are the results

We ran performance testing for Backblaze B2, AWS S3, Cloudflare R2, and Wasabi Object Storage. These tests were conducted using Warp, an open-source S3 benchmarking tool for cloud object storage performance. We’ll expand on the methodology after we get into the numbers. 

Key findings:

  • While AWS S3 demonstrates the lowest average download speeds across the board, the hyperscaler didn’t win on sustained download throughput measurements. Five minute single- and multi-threaded benchmarking tests showed AWS winning on only one out of eight sustained throughput tests, indicating that there’s much more to the story than average download speeds. Meanwhile, Backblaze won in six out of eight categories, with Wasabi coming in first on the remaining test. (That being said, it’s wise to take this with a grain of salt given the small cohort in this initial dataset—more robust testing may show different results.)
  • Sustained throughput testing shows the most differentiation at small file sizes for both single and multi-threaded testing. For example, in multi-threaded upload benchmarking for the 256KiB file size, our highest value was 580% higher than the lowest. In single threaded upload benchmarking for the same file size, the highest value is 700% higher. Download throughput showed 247% and 304% in multi- and single-threaded tests, respectively. Small file size testing can have interesting impacts on overall performance—these files have the most overhead, and are typically more likely to show latency. 
  • Backblaze B2 demonstrates the fastest average upload speeds for small file sizes, with AWS S3 leading for larger file sizes. And, similar to downloads, the story becomes more nuanced when we look at sustained upload throughput, where Backblaze leads for both the smallest (256KiB) and largest (100MiB) file sizes on multi-threaded tests with Wasabi taking the lead in the mid-range.

And, here’s a jump-to if you want to quickly reach each test: 

Upload comparisons 

This test shows the average time in milliseconds it takes to upload a file. Averages were taken across a month of data and for three different file sizes. 

In these tests, a lower result is better (i.e., it represents a faster result). Note that we do not have data for Wasabi: Wasabi does not allow users to run HTTP requests for the first 30 days of a new account period, and when we ran this report, our testing account was still within that time period.

In each of the charts, we’ve outlined the “winner” in green for each category for easy readability. 

A bar chart showing average file upload speed for AWS, Backblaze, Wasabi, and Cloudflare.
A chart showing data about average file upload speeds for Backblaze, AWS, Wasabi, and Cloudflare.

Backblaze B2 wins for small files, coming in at 12.11ms, and AWS S3 leads for 2MiB and 5MiB files, coming in at 76.79ms and 201.40ms, respectively. Whether or not these numbers are inherently “good” or tolerable depends on quite a few factors—we’ll run through some examples comparing use cases to where we see Backblaze succeeding later in the report.

Five minute multi-threaded upload benchmark

In these tests, a higher result is better, as the result represents more average data being pushed in the five minute time period. This gives us quite a bit more information than just average upload time for a single file—rather, it tells us the sustained amount of data you can push to a cloud storage provider in five minutes. 

A bar graph showing sustained throughput averages for multi-threaded uploads to Backblaze, Wasabi, AWS, and Cloudflare.
A chart showing sustained throughput averages for multi-threaded uploads to Backblaze, Wasabi, AWS, and Cloudflare.

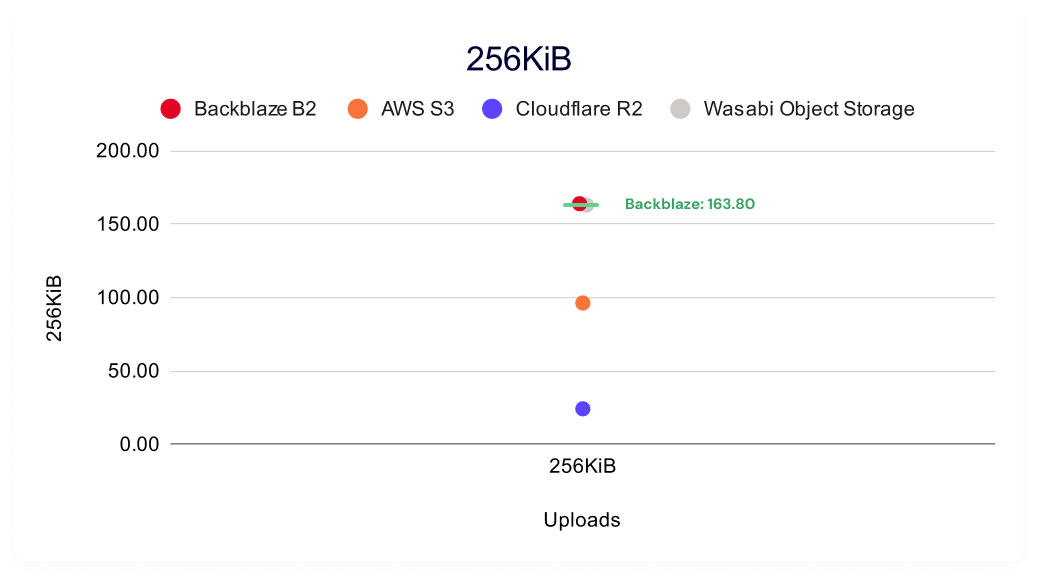
Interestingly, we have a pretty large spread between our highest and lowest values, most stark amongst the smallest files where Backblaze B2 demonstrates the highest sustained throughput at 163.80MiB/s and Cloudflare R2 demonstrates the lowest at 24.10MiB/s. 

This is important because the strength of object storage is that it lets you run concurrent operations to read many ranges of bytes in the same file. Moreover, thread operations are a configurable element of most cloud storage accounts (though too many concurrent operations can trip rate limits that are dependent on the provider).

So, when we think about contextualizing with the average time to a file upload completion, the task includes making the request, the handshake between requester and server, routing the request through the cloud storage provider, then time it takes to read all data, and then notification that your upload is complete. 

Threading lets you run the actual process of the return of information concurrently—so while file overhead (handshake) should be relatively consistent, you can get quite a bit faster on large file uploads. And, even when you have consistent results on file overhead, networking paths can make a difference on delivery times. While we can consider networking routes mostly stable (especially for synthetic performance testing), it’s certainly not a guarantee. Peering policy changes, network maintenance and/or outages, and CDN usage can all affect your routing day to day or month to month. 

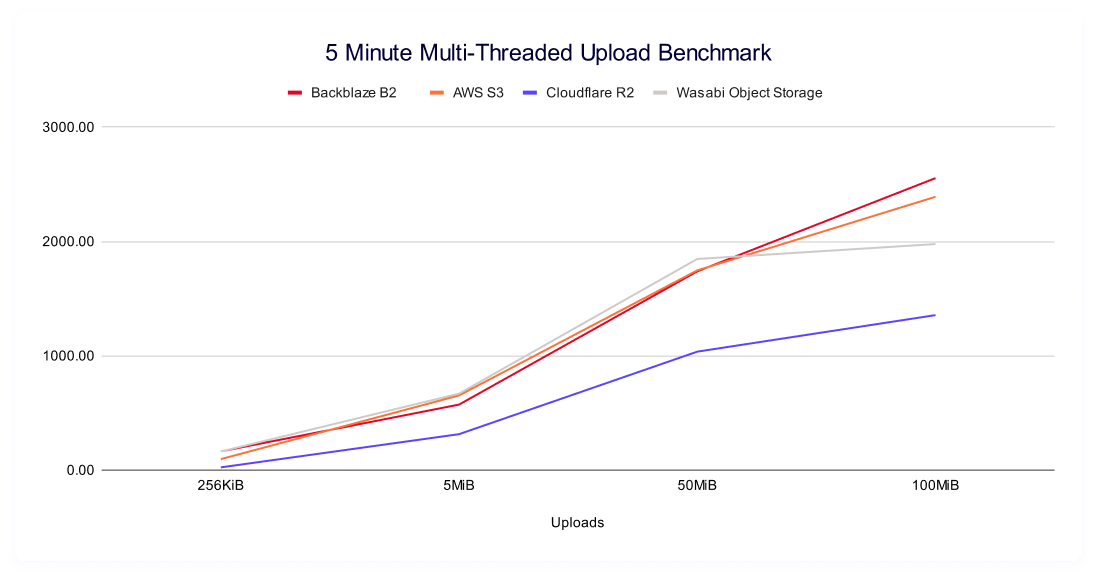
Changing the view a bit, we see some interesting shapes when we plot each providers’ improvement as file sizes get larger:

A trendline showing sustained throughput averages for multi-threaded uploads across file sizes to Backblaze, Wasabi, AWS, and Cloudflare.

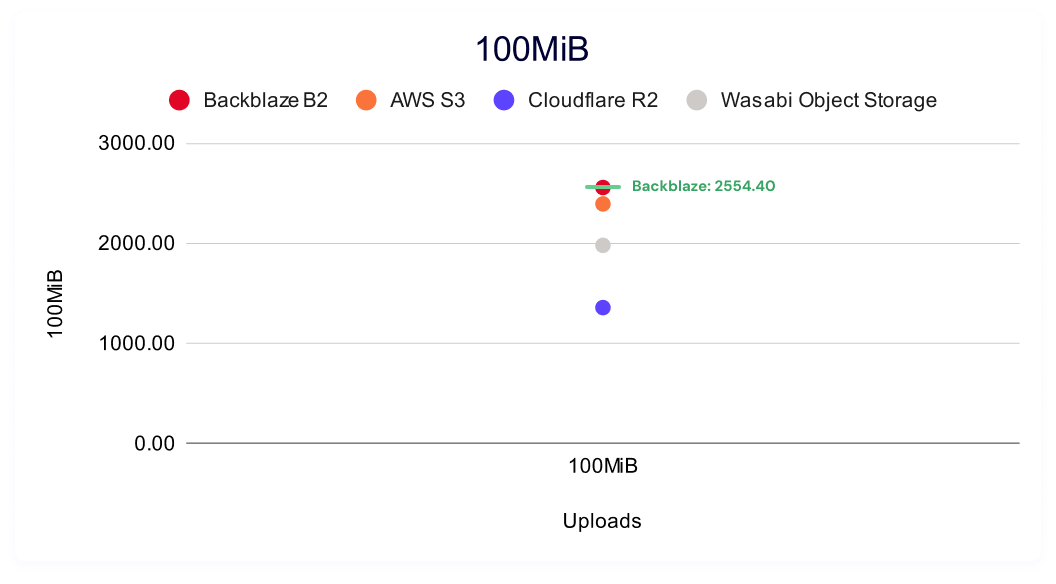
It’s intuitive that you’d automatically push more data as file sizes get larger, but the shape of each’s improvement is a stark contrast. The rate of increase (which you can see in our trendlines as the slope) isn’t constant, and we see Backblaze and AWS showing consistently better performance at the higher file sizes. Wasabi tracks with that growth in the smaller file sizes, but falls off at the 50MiB and 100MiB. Meanwhile, we see Cloudflare returning the lowest net values, while flattening out at smaller file sizes as well.  

In most performance data, you expect a logarithmic relationship between data points—and so comparing their different shapes—when the trendline flattens out and/or when it deviates from an ideal logarithmic scale—can be telling. You can define an expected logarithmic curve using an average of all providers, then compare each provider’s residuals (how far above or below that curve it sits). We’ll save that analysis for another day, and a more mature dataset. 

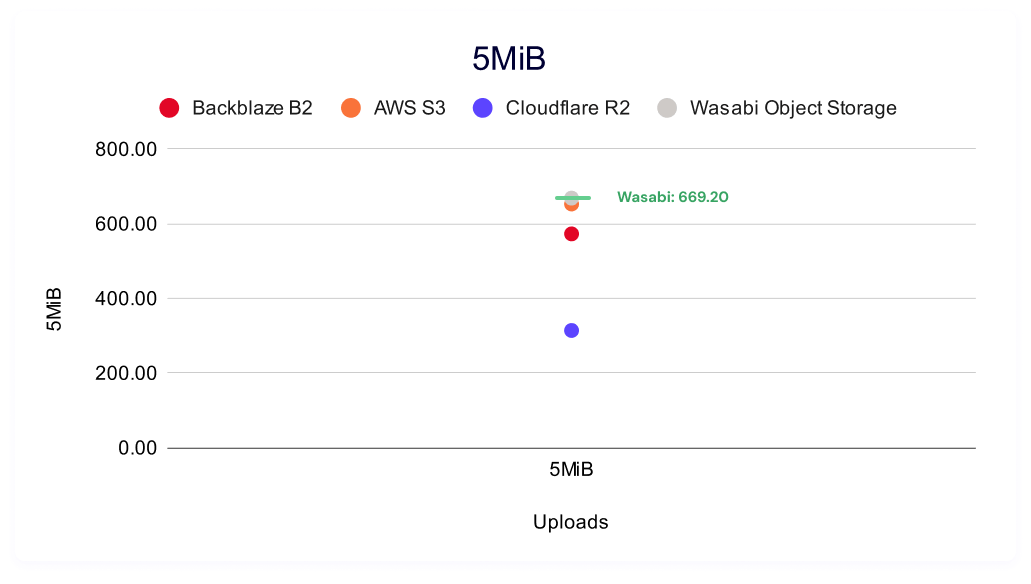
It’s also interesting to look at data point clustering by file size. As our dataset matures over time and as we add providers, clustering in these charts start to tell a story. If you want a quick idea of good, better, best and you don’t have a large enough cohort for a true tiered definitional schema, it’s a good visual shortcut—you can easily see if different providers’ results are spread out or if they cluster together at a specific level of performance. The winners for each test are labeled in green.

A clustering view showing sustained throughput averages for multi-threaded 256KiB uploads to Backblaze, Wasabi, AWS, and Cloudflare.
A clustering view showing sustained throughput averages for multi-threaded 5MiB uploads to Backblaze, Wasabi, AWS, and Cloudflare.
A clustering view showing sustained throughput averages for multi-threaded 50MiB uploads to Backblaze, Wasabi, AWS, and Cloudflare.
A clustering view showing sustained throughput averages for multi-threaded 100MiB uploads to Backblaze, Wasabi, AWS, and Cloudflare.

And, as we said above, in all cases (and one of the most frustrating parts about collecting performance stats) is that your mileage may vary—you always want to compare the needs of your customers and product to the performance you need and how much it costs you. 

Five minute single threaded upload

Once again, higher is better in this result, and it measures the sustained amount of data you can push to a server based on file size. As a reminder, multi-threading allows you to concurrently read a single file; while single threading is one, sustained process from start to finish.  

A bar chart showing sustained throughput averages for single-threaded uploads to Backblaze, Wasabi, AWS, and Cloudflare.
A chart showing data about sustained throughput averages for single-threaded uploads to Backblaze, Wasabi, AWS, and Cloudflare.

Backblaze B2 again leads in small file sizes, with AWS S3 leading for 5MiB files and Wasabi for 50MiB and 100MiB files.

As above, here’s the trendline: 

A trendline showing sustained throughput averages for single-threaded uploads across file sizes to Backblaze, Wasabi, AWS, and Cloudflare.

And, like in the multi-threading results, we can look at the clustering in each file type size: 

A clustering view showing sustained throughput averages for single-threaded 256KiB uploads to Backblaze, Wasabi, AWS, and Cloudflare.
A clustering view showing sustained throughput averages for single-threaded 5MiB uploads to Backblaze, Wasabi, AWS, and Cloudflare.
A clustering view showing sustained throughput averages for single-threaded 50MiB uploads to Backblaze, Wasabi, AWS, and Cloudflare.
A clustering view showing sustained throughput averages for single-threaded 100MiB uploads to Backblaze, Wasabi, AWS, and Cloudflare.

Download comparisons

This test shows the average time in milliseconds it takes to download a file. Averages were taken across a month of data and for three different file sizes. 

A reminder that lower is better in this test as it represents a faster result, and there’s no data for Wasabi in this series due to limitations on HTTP requests within the first 30 days of opening a new account.

A bar chart showing average file download speed for AWS, Backblaze, Wasabi, and Cloudflare.
A chart showing data about average file download speeds for Backblaze, AWS, Wasabi, and Cloudflare.

AWS S3 leads across the board on this test, with Backblaze B2 taking second and Cloudflare R2 taking third consistently.

And, it’s worth separately tracking TTFB because TTFB is a good, but not sufficient statistic when we’re interpreting results.  

A bar chart showing average time to first byte (TTFB) speed for AWS, Backblaze, Wasabi, and Cloudflare.

Why isn’t this datapoint sufficient to fastest speeds? Not only does TTFB conflate many parts of your networking layer (so it can be affected by things like connection reuse policies), but it’s also such a small part of the overall transfer time and highly variable based on environment. So, its use is really in conversation with the sustained throughput numbers.

Cached vs. uncached downloads (Backblaze only) 

We were also curious to see if caching within our own network would show up, and, if so, we’d want to make sure we weren’t unintentionally giving ourselves a favorable stance. So, we ran a series of tests for cached and uncached downloads by including the header X-Bz-Flush-Cache-First=true.

A bar chart showing the difference between cached and uncached downloads for Backblaze.

We do see slightly slower speeds in uncached downloads, but they’re likely a result of the same factors anyone externally hitting our system would see. Additionally, during the course of our testing, Backblaze made cacheless downloads the default behavior for our architecture—so, it will be interesting to monitor this statistic going forward. 

Five minute multi-threaded download benchmark

In these tests, a higher result is better, as the result represents more average data being downloaded in the five minute time period.

A chart showing sustained throughput averages for multi-threaded downloads to Backblaze, Wasabi, AWS, and Cloudflare.

Backblaze B2 leads for 256KiB, 50MiB, and 100MiB file sizes. AWS S3 has a slight advantage for 5MiB files. 

And, let’s give ourselves the same charts as our above upload tests for consistency’s sake. Here’s the trendline:

A trendline showing sustained throughput averages for multi-threaded downloads to Backblaze, Wasabi, AWS, and Cloudflare.

While AWS and Backblaze track closely for the 256KiB and 5MiB file sizes, Backblaze wins out at 50MiB and 100MiB. Meanwhile, Cloudflare lags at the smallest file sizes, but shows rapid improvement, peaking at the 50MiB file sizes. Interestingly, this is arguably Wasabi’s weakest showing compared to all other sustained throughput testing, though they have strong results at the 256KiB file size and a respectable showing at the 5MiB file size. 

And here’s the per-file size clustering:

A clustering view showing sustained throughput averages for multi-threaded 256KiB downloads to Backblaze, Wasabi, AWS, and Cloudflare.
A clustering view showing sustained throughput averages for multi-threaded 5MiB downloads to Backblaze, Wasabi, AWS, and Cloudflare.
A clustering view showing sustained throughput averages for multi-threaded 50MiB downloads to Backblaze, Wasabi, AWS, and Cloudflare.
A clustering view showing sustained throughput averages for multi-threaded 100MiB downloads to Backblaze, Wasabi, AWS, and Cloudflare.

Five minute single-threaded download throughput

Again, in these tests, a higher result is better, as the result represents more average data being downloaded in the five minute time period. 

A chart showing sustained throughput averages for single-threaded downloads to Backblaze, Wasabi, AWS, and Cloudflare.

Here, Wasabi wins for 256KiB files, and Backblaze wins for 5MiB, 50MiB and 100MiB files. Note that this is a solid trend for Wasabi in the 256KiB file sizes—they came in second in the multi-threading download testing, as well as both single and multi-threaded upload testing.

A trendline showing sustained throughput averages for single-threaded downloads to Backblaze, Wasabi, AWS, and Cloudflare.

And here’s our clustering: 

A clustering view showing sustained throughput averages for single-threaded 256KiB downloads to Backblaze, Wasabi, AWS, and Cloudflare.
A clustering view showing sustained throughput averages for single-threaded 5MiB downloads to Backblaze, Wasabi, AWS, and Cloudflare.
A clustering view showing sustained throughput averages for single-threaded 50MiB downloads to Backblaze, Wasabi, AWS, and Cloudflare.
A clustering view showing sustained throughput averages for single-threaded 100MiB downloads to Backblaze, Wasabi, AWS, and Cloudflare.

Test methodology

Our goal with these benchmarks is simple: to understand how our cloud performs under real-world conditions and to share that information as clearly as possible. To do that, our Cloud Operations team runs repeatable, synthetic tests that measure upload (PUT) and download (GET) performance. 

We ran both upload and download tests across all four vendors. Upload tests measured the following file sizes:

  • 256KiB
  • 5MiB
  • 50MiB
  • 100MiB

Download tests measured:

  • Time-to-first-byte (TTFB)
  • Total time to download the following file sizes:
    • 256KiB
    • 5MiB
    • 50MiB
    • 100MiB

Why do performance tests use mebibytes (MiB) instead of megabytes (MB)?

We’ve written articles in the past about how all computers are fundamentally a collection of logic circuits (transistors) in either an on or an off state, which means that they communicate in binary, or a base two language. Humans, however, tend to prefer base 10 languages. There are lots of reasons for this, but that’s a story for another time. 

MiB is a base two unit of measurement, whereas MB is a base 10. Here’s a comparison:

Unit Definition Bytes
1MB (megabyte) Base-10 (decimal) 1,000,000 bytes
1MiB (mebibyte) Base-2 1,048,576 bytes (1024×1024)

The difference between those two measurements may seem small, but it has a significant impact when you’re talking about performance sensitive systems. Oftentimes you’ll see marketing language shift to talking about MB because it’s more understandable to a wider audience, but to get accurate results, MiB is what you need.

Tests run in five-minute profiles to observe consistency over time, and we ran both single and multi-threaded download and upload tests. From a practical perspective, what’s happening is that we’re pushing repeated requests to a cloud storage provider as many times as we can for five minutes. 

All tests originate from a Vultr-hosted Ubuntu virtual machine (VM) located in the New York/New Jersey area, routing through Catchpoint’s network into object storage regions located generally in US-East. By keeping the source environment stable and the test target consistent, we isolate performance variables within each provider’s infrastructure rather than the test environment itself.

Consistency measures

To ensure each test result represents genuine performance rather than environmental noise, we built repeatability into the process:

  • Identical test instances: All runs used the same VM type, operating system (OS) image, and configuration.
  • Fixed regions: Tests originated from the same location (NY/NJ) targeting the same US-East region across providers.
  • Controlled routing: Network paths were held constant through Catchpoint’s monitoring network to minimize geographic or peering variation.
  • Repeated runs: Each test profile (5 min) was executed multiple times, and averages were used to reduce the impact of transient spikes.
  • Standardized payloads: All uploads and downloads used identical objects to ensure a consistent file-size baseline.
  • Unchanged test intervals: Tests were scheduled at regular intervals over multiple days to capture both typical and outlier performance.

About synthetic testing

Synthetic monitoring provides a controlled, apples-to-apples comparison, but it doesn’t replicate every production workload. These tests are run outside our own infrastructure—from neutral vantage points—to simulate a customer’s experience at the “last mile.” This distinguishes our approach from competitors who benchmark internally under optimized conditions.

It’s important to note that synthetic results won’t mirror every customer’s experience. Different architectures, connection paths, and file patterns will produce different performance profiles. Our intent is to offer transparency into the methodology and relative behaviors, not to suggest that all workloads will perform identically.

Limitations and future work

Every benchmark is an approximation. These results provide a controlled look at how cloud storage performs under repeatable conditions, but they don’t capture every variable in production environments. Below, we outline what our current tests don’t measure and where we’re headed next to deepen the picture.

  • Synthetic, not real-world workloads: These benchmarks simulate real activity but don’t reproduce the full variability of customer workloads, concurrency levels, or data locality patterns. They are best understood as directional insights rather than absolute truths.
  • The internet is the internet: Once traffic leaves the test node, we can’t control the routing, peering, or transient network conditions between endpoints. Each provider’s own network policies and routing optimizations—for example, Wasabi’s inbound connection rules—can influence the results.
  • Static test conditions: All tests were conducted from a single region (NY/NJ to US-East cloud providers). Real-world customers operate globally, where peering arrangements, congestion, and latency differ widely.
  • Potential caching effects: Although we designed the tests to avoid cached reads, Catchpoint does not allow full data randomization. It’s possible some repeated reads benefited from intermediate caching at any network layer. 
  • Traffic shaping and rate limiting: Providers may apply rate limits or throttling when detecting high-frequency test traffic. For example, Wasabi temporarily blacklisted our IPs due to testing volume—a reminder that these results represent observed behavior, not formal service guarantees.

Each of these limitations points toward future testing opportunities. Here’s what’s next on our testing roadmap:

  • Regional expansion: Extend current US-East tests to US-West and EU regions using equivalent test setups.
  • Vendor expansion: Extend testing to more vendors, including Google Cloud Platform and Azure.
  • File size sensitivity testing: Investigate performance across a wider range of file sizes, including 100MiB+ objects. This will help clarify where different architectures favor small-object throughput versus sustained large transfers.
  • Traffic rate & throttling analysis: Incorporate monitoring for request-per-minute and total-bytes-transferred metrics to detect possible provider-level rate limiting. We’d love to invite vendors to validate thresholds and eliminate false negatives.
  • Concurrency patterns: Test multiple thread and connection strategies to model real-world transfer concurrency, especially for use cases involving parallel uploads or downloads.
  • Benchmark visualization: Transition from CSV data collection to Grafana dashboards, enabling continuous visualization of test results and performance drift over time. 

Performance is an evolving target, and so is our testing methodology. Each round of analysis helps us not only understand how Backblaze performs in context, but also refine how we measure, compare, and communicate that performance. Our goal remains the same: make the data real, repeatable, and useful.

What this means for real-world use cases

Based on the results we’ve shared here, there’s plenty of room for argument around the value of different performance profiles. But, continuing our theme of transparency: Since we’re transparent about our performance, warts and all, we’re going to be transparently candid in the areas where think the Backblaze platform is showing some nice results:

  • AI/ML inference: Our strong read latency and throughput make Backblaze ideal for inference workloads that need to pull model artifacts, inputs, and outputs quickly. For example, when a service like Hugging Face or Runway ML feeds an image into a convolutional neural network, lower read latency directly translates to faster inference delivery.
  • Feature stores & embedding lookups (AI/ML): Optimized small-object reads and efficient small writes support rapid lookups and occasional updates common in vector databases and feature stores like Feast, Qdrant, Pinecone, or Weaviate.
  • LLM-based retrieval-augmented generation (RAG) systems: RAG systems store many small document chunks that are written once and read repeatedly, so our read-optimized performance accelerates retrieval of document chunks or embeddings, improving response times for large language model applications. Vectorized databases are also a hot topic right now for good reason—they’re changing patterns around file sizes and retrieval patterns in RAG applications and LLM training. 
  • Log & event analytics (SIEM, IoT, etc.): Competitive small-write performance and fast reads make Backblaze well suited for log aggregation and analytical querying with tools like Loki, Fluentd, Vector.dev, and OpenObserve once data is ingested.
  • Interactive data lake querying: Consistent throughput and fast download speeds deliver responsive querying and exploration for business intelligence (BI) and ad hoc analytics workloads.
  • CDN origin: Excellent read throughput, stable performance, and free egress make Backblaze a high-value choice for powering content delivery at scale.

As discussed, one of the reasons it’s so hard to get directly comparable performance benchmarks is because there are so many configurable elements on the user’s side that can affect the results. For example, if you know that your provider is faster on smaller files, you might choose to store your unstructured data in smaller parts so that you achieve faster performance. 

That means that when we share results like this, it enables you to interpret which provider is a better fit for your different types of workflows.

For a cloud storage provider, tracking these metrics over time and comparing to other aspects of our internal architecture enables us to support ongoing and continual performance improvement, and to understand how much of an impact single changes might make. This means that what seems like a simple project to change the way we read header requests can produce asymmetrically favorable results. 

And, there’s a layer of this that’s always going to come down to design decisions. For example, we’ve talked about some of the logic behind where our architecture knows which server to store data on. Basically, our system chooses to store a new file based on the available space of each server. So, if we have a server that has 40% space available, it would receive 40% of the incoming storage writes. (That’s a bit of an oversimplification, but you get the idea.) 

Other cloud storage providers might prioritize, say, randomness in their write architecture. When a request would enter their system, the routing protocol would say, “Hey, we haven’t written to this server over here in a while,” and write it in that sector. It’s a different choice that can have a subtle ripple effect across different aspects of storage architecture.

What’s next?

Our performance story is one of steady, measurable progress. We’re not optimizing for a single headline number; we’re building toward consistent reliability across diverse workloads. That’s why we test openly, publish what we find, and continuously refine how we measure.

Looking ahead, our next Performance Stats report will continue to share these findings quarterly, which will give us all a more mature dataset to work with, and will expand testing. This isn’t just a transparency exercise for us, it’s a commitment to the developers and teams building on Backblaze: you deserve data you can trust—and we intend to keep earning it. 

We’d love it if others—third parties and our competitors—also got involved, but we’ll see how things evolve. For now, feel free to let us know if these tests work for you. 

Disclaimer:
The performance data and comparisons presented here are based on tests conducted by Backblaze under the specific environments, configurations, and conditions described in this post. Actual results may vary depending on network conditions, workloads, geographic location, and other factors.

Backblaze has published its testing methodology so others can replicate or challenge the results; however, Backblaze makes no representation or warranty that its tests capture all possible variables or configurations. The information is provided for general informational purposes only and does not constitute a guarantee of future performance. In addition, the information in this post is based on data available at the time of publication, and Backblaze reserves the right to update or revise this information as new data, testing methodologies, or performance results become available.

All product names, trademarks, and registered trademarks are property of their respective owners. References to third-party products or services are for identification purposes only and do not imply endorsement or affiliation.

The post Backblaze Performance Stats for Q3 2025 appeared first on Backblaze Blog | Cloud Storage & Cloud Backup