Announcing a new integration between Backblaze B2 and Suite Studios’ S3 Native File Streaming that brings together scalable object storage and the familiar experience of working from a local drive.
Available today with Backblaze B2, the integration allows teams to mount a B2 bucket through Suite Studios and work with files as if they were stored on a high-performance NAS. Suite streams only the parts of each file an application needs, rather than requiring users to download entire datasets first.
Behind that experience, the data remains in Backblaze B2 as standard S3-compatible objects.
Ready to get started now?
To put Suite S3 Native to work on B2, contact Backblaze Sales or your Backblaze reseller partner. We can help validate your architecture, plan a proof of concept, and evaluate migration support for your existing data.
Your B2 bucket becomes the working file space
An existing Backblaze B2 bucket can now be used directly as a Suite file space. There is no separate storage environment hidden inside Suite and no proprietary segmentation happening in the background.
The relationship between the file system and the bucket remains straightforward:
One file in Suite maps to one object in B2.
The folder structure in Suite matches the structure in the bucket.
Files remain standard, whole objects.
B2 remains the system of record.
Suite provides the high-performance file access layer.
For users, cloud storage behaves more like a shared NAS experience. For IT, the underlying data remains in a storage platform the organization owns and controls.
If your files are already stored in B2 as standard objects, Suite can connect to the bucket and make them available through its mounted drive. There is no need to create another copy, convert the data, or run a separate ingest into Suite.
One dataset, multiple ways to use it
The immediate opportunity is media production, where teams work with large files across editing, media management, transcoding, automation, archive, and distribution.
An editor can open high-resolution media in Adobe Premiere Pro through the Suite drive. At the same time, iconik or another MAM can index the library, Telestream Vantage can process the source files, and automation can respond to new objects written into B2.
Each application works with the same underlying media.
But this is not exclusively a media workflow. The same model has practical applications anywhere teams need to work with large cloud datasets through file-based desktop tools:
Life sciences and biotech: Make genomic sequencing, microscopy, medical imaging, and instrument-generated data accessible to researchers without maintaining full copies at every location.
Geospatial and earth observation: Work with satellite imagery, drone captures, LiDAR scans, and GIS datasets while keeping source files centrally stored.
Engineering and design: Give teams file-based access to CAD assemblies, simulations, 3D models, digital twins, and high-resolution scans.
Research and higher education: Create shared access to large scientific datasets for distributed teams while maintaining a common storage foundation.
These are emerging applications for the architecture rather than packaged Suite solutions today, but the underlying opportunity is clear: Large datasets become much more useful when people and applications can access them without moving them into another storage silo.
Built for active data
Media, scientific data, and geospatial imagery rarely sit still. Files are opened, reviewed, processed, moved, analyzed, and shared throughout their lifecycle.
Backblaze B2 provides always-hot, S3-compatible object storage with straightforward pricing and free egress up to three times average monthly storage, plus unlimited free egress through select CDN and compute partners.
That makes B2 a strong foundation for data that needs to remain active and accessible. Suite adds another way to put that data to work by making a B2 bucket accessible through a high-performance file interface.
Available today, with migration support
Backblaze B2 is available today for Suite S3 Native workflows.
If your data is already in B2, you can use an existing bucket as your Suite file space. If it currently resides in another cloud, on a NAS or SAN, or on tape, Backblaze can help plan and execute the move.
Organizations making a qualifying commitment can receive assisted migration into B2 through our Universal Data Migration program.
Bring the data into the storage platform you want to keep. Let cloud applications access it through S3. Let people access it through a high-performance drive.
One dataset. One storage foundation. Multiple ways to put it to work.
AI agents are getting very good at making things: reports, code builds, images, videos, datasets, customer exports, and backups. But generating a file is only half the job. The agent still needs somewhere durable to put it. That’s where B2 comes in.
Today, we’re introducing the Backblaze B2 MCP Server: an open source server that gives AI agents a safe, standard way to operate cloud object storage.
Introducing the Backblaze B2 MCP Server
Model Context Protocol (MCP) provides a common way for AI agents to discover and use external tools. The Backblaze B2 MCP Server applies that model to Backblaze B2 Cloud Storage, connecting MCP-compatible clients to a focused set of storage operations.
The server is open source and designed so the tools presented to the agent reflect the permissions of the connected B2 application key.
And that last point is important. The MCP server does not invent a new permission model or grant an agent blanket access to your account. If the key can only read from one bucket, the agent’s usable tool set and reach are constrained accordingly. If the key does not permit an operation, the agent cannot use the MCP server to bypass that boundary.
Why launch an MCP server?
Storage has always met developers in two places: the API and the console. Agent tools are becoming a third, and increasingly the one where work starts. Our view is that infrastructure should be available inside the tool someone already has open, at the moment they need it.
That spans a wide range of work: everyday tasks that produce outputs which need to be stored, AI workflows that read and write data as they run, and applications that require storage to handle files. A report or an export has to land somewhere durable. An application built around agents needs somewhere to put user uploads, generated assets, and datasets. Customers have also asked us how their own agents can administer their storage.
MCP is what lets one implementation serve all of it. An MCP server provides these storage tools directly to the AI agents people use for everyday tasks and for coding, so the same credentials, scoping, transfer path, and destructive operation policy apply everywhere your team works. B2 is available inside the tools your teams already have open.
See it in action
Suppose an agent has prepared a customer export. Instead of handing it a general-purpose credential and writing the surrounding storage logic yourself, you could ask:
“Prepare a private destination for this customer export. Keep it for 30 days and give me a secure way to upload it.”
Depending on the application key’s permissions and the server’s policy settings, the agent can:
Create a private bucket or select an existing one the key can access.
Apply lifecycle or retention settings, depending on whether the export should expire automatically or be protected from deletion.
Generate a short-lived upload URL.
Verify that the export arrived.
Return a short-lived download URL to the intended recipient.
For a large export, the bytes move directly to B2 using the short-lived URL; they do not need to pass through the model conversation or the MCP server. That keeps bulk data on the right path and leaves the agent responsible for orchestrating the work, not hauling the payload.
Now imagine a follow-up request: “Delete that export.” The B2 MCP Server can require confirmation before the action proceeds or block destructive operations entirely, depending on how the server is configured. The same principle applies to changes that weaken protection, such as clearing retention or introducing lifecycle rules that schedule deletion.
The result is a useful division of labor: The agent can set up the storage, move the file, and verify the outcome, while the B2 MCP server enforces the connected key’s limits and configured policy.
Built for real storage work
The B2 MCP Server includes up to 40 tools across the B2 Native API, B2’s S3 Compatible API, and purpose-built storage analytics. You do not need to expose all of them to every agent. The available surface adjusts to the connected key and the server’s policy settings.
Manage storage. Create and configure buckets, list and manage objects, define lifecycle rules, work with retention and legal holds, and use Object Lock where the workflow calls for stronger protection.
Move large files directly. Generate short-lived upload and download URLs, or use multipart transfers for large objects, so bulk data stays out of the model and MCP server.
Limit access. Connect a scoped B2 application key so the agent can see and use only the buckets and capabilities it needs. For normal storage work, a non-master key is the right starting point.
Gate destructive actions. Set the destructive-action policy to require confirmation, block the operation, or allow it in a trusted environment. Local use defaults to confirmation; hosted HTTP deployments default to blocking these calls.
Inspect usage. Find storage growth, identify egress leaders, locate the largest files in a bucket, and surface unfinished multipart uploads that may be consuming storage.
Safety starts with the key
An MCP server makes tools available to an agent; it should not make good access controls optional. With B2 MCP, the connected application key remains the first boundary. B2 application keys can be limited by bucket, capability, file prefix, and duration, giving developers a practical way to apply least privilege to agentic workflows.
The server adds another layer around operations that deserve friction. Destructive and protection-weakening actions can require an explicit confirmation or be refused before execution. For hosted deployments, the project includes additional controls and deployment guidance for credential handling, authentication, allowed hosts and origins, rate limits, and logging.
The goal is not to pretend an agent can never make a bad request. It is to give developers clear, enforceable boundaries around what the agent is allowed to do.
Already use B2? Your agents can use it too
If your application data, backups, media, or archives already live in B2, you do not need a separate storage product for agents. The MCP server works with standard B2 application keys and existing buckets.
You can connect an existing key, but in most agentic workflows it is worth creating a narrower key for the job. A reporting agent might need read access to a specific prefix. An export workflow might need permission to write to one private bucket and generate a short-lived download link. A cleanup agent might need list access but no delete capability until a human approves the action.
Try the B2 MCP Server
One-click install (Claude Desktop)
Download b2-mcp.mcpb from the latest release and double-click it. Claude Desktop opens, offers to install the extension, and prompts for your Application Key ID and Application Key (Region and master key optional) — no config file to edit, nothing pasted into the conversation. (If your system hasn’t associated .mcpb files with Claude Desktop yet, open Settings → Extensions and install it from there, or drag the file onto that window.)
Run with npx (any MCP client)
You need three things to get started:
A supported Node.js runtime.
A B2 application key. Use a non-master key and scope it as narrowly as the workflow allows.
An MCP-compatible client.
The fastest way to run the server is with npx:
`npx -y @backblaze-labs/b2-mcp`
For Claude Desktop, add the following block to claude_desktop_config.json, substitute your application key values, and restart the client:
Do not paste the application key into the model conversation. Keep it in the client configuration or your deployment’s secret-management layer.
Then try a deliberately simple first prompt: “List the buckets this key can access.”
For copy-and-paste setup instructions for Cursor, VS Code, Cline, Windsurf, Zed, Continue, Goose, Claude.ai, and hosted deployments, see the client setup guide.
See the B2 MCP Server in action. We’ll set it up, run a complete storage workflow, explain the safety boundaries, and answer your questions.
A safe way for agents to operate storage
Agents need more than somewhere to put files. They need a safe way to operate storage: to prepare the right destination, move data on the right path, verify the outcome, and stop when a request exceeds their permissions or policy.
The Backblaze B2 MCP Server brings those capabilities to the MCP clients developers are already using, while keeping B2 application keys and server-side safeguards in control. Try it with your existing B2 storage, or join the webinar to see the complete workflow.
Broadcast production has spent decades organizing media around files, servers, and the physical limits of the facility. That model is familiar, and it works until a live event creates hours of footage across multiple cameras, editors are distributed, the archive is growing by petabytes, and every copy of every clip becomes another operational and financial problem.
Time Addressable Media Store, or TAMS, offers a different model: Organize media by time, store it in object storage, and let interoperable tools access the same content through an open API. Pair that with affordable, high-performance storage, and the result is a practical path toward cloud-native production without forcing media teams into a single vendor’s ecosystem.
That is where a stack built on Backblaze B2, together with TAMS ecosystem partners LiveWyer, CuttingRoom, and Drastic Technologies, gets interesting.
What is TAMS?
When a live event is producing hours of footage across multiple cameras, editors should not have to wait for files to close before they can start working. TAMS, or Time Addressable Media Store, addresses that problem by organizing media around the timeline rather than individual files.
With TAMS, media is stored as timestamped segments that applications can access by time. A news editor can pull a quote from a press conference while it is still underway. A sports producer can create a highlight from a live game feed. A content team can reuse the same moment for social clips, a longer edit, distribution, and archive without creating a separate proprietary copy for every stage.
TAMS gives ingest systems, browser-based editors, desktop NLEs, MAMs, and archive platforms a common way to work with the same media. The store can run on one cloud, ingest can come from another provider, and editors can use the tools they already know.
The specification grew out of BBC Research & Development’s work on cloud-native media production and was published in 2023. Its purpose was practical: Give different companies a shared interface for building interoperable media workflows instead of recreating isolated storage silos in the cloud.
TAMS is not a replacement for an NLE, MAM, ingest system, or archive. It is the layer that helps those systems work together. In this article, we are focusing on three Backblaze ecosystem partners that demonstrate that approach: LiveWyer, CuttingRoom, and Drastic Technologies.
The solution stack
LiveWyer provides TAMOSS, a Kubernetes-native implementation of the TAMS API. TAMOSS is the store management and API layer. It handles the TAMS structure while orchestrating the underlying media segments stored in Backblaze B2.
CuttingRoom brings an editorial-grade video editing experience into the browser. In a TAMS workflow, editors can begin working with media while a live event is still being captured. They can find a moment on the timeline, create a clip, and assemble a story without waiting for an entire file to close or moving the media into a separate editing silo. The CuttingRoom solution allows real-time collaboration, import and exports from and to market leading MAMs and with the optional ShortCut AI assistant editing, editors can do more in less time.
Drastic Technologies’ NetX platform provides the TAMS-compliant readers and writers that handle both ends of the media flow: ingesting and writing media into TAMS, then reading it back for playback and use in professional applications such as Adobe Premiere and Avid. NetX is a key part of making TAMS flows usable across live ingest, playback, and established desktop production workflows including Adobe Premiere.
With Backblaze B2 providing the S3-compatible storage foundation beneath the workflow.
TAMOSS supplies the TAMS interface. CuttingRoom provides the browser-based editorial experience. Drastic NetX handles the critical ingest, writing, reading, and playback paths. B2 stores the media segments at a price that makes large-scale access practical.
These companies are part of a growing ecosystem of roughly 14 technology providers with publicly identifiable TAMS implementations, products, readers, writers, or integrations. That broader ecosystem includes AWS, Konstrukt, LOGIC media solutions, LucidLink, Mimir, Reuters Imagen, Matrox Video, Mavis, Norsk, Techex, and Zixi, alongside LiveWyer, CuttingRoom, and Drastic Technologies.
This is the broader idea behind an interoperable standard. No single company has to provide every part of the workflow, and customers do not have to replace every system they already own.
Where TAMS fits
The use cases are not limited to national broadcasters.
A news organization could ingest a live press conference, let an editor find a quote while the event is still happening, and publish a short clip before the full recording is finished.
A sports production team could create proxy media for immediate clipping while retaining higher-resolution source material for finishing. This is particularly useful because some high-resolution MOV and MXF workflows are difficult to segment and read while they are still growing.
A regional sports league or smaller event producer could avoid building a large on-premises storage environment and give remote editors access to the same media from wherever they are working.
A corporate video team could record a town hall, create short internal clips, publish social content, and retain the full event in the archive using the same underlying media.
The same approach could support houses of worship, education, government, live entertainment, and creator workflows. The common requirement is quick access to a growing body of media without multiplying copies and handoffs.
What if the editor reviewing a live feed did not need to ask where the file was? What if the answer were simply a time range in a shared store?
Why Backblaze B2 matters
Live video is a storage problem before it is almost anything else. A multi-camera sports event, a continuous news operation, or a large livestream can generate terabytes of content quickly.
Backblaze B2 starts at $6.95 per terabyte per month, with free egress up to three times average monthly storage and no egress fees through many compute and CDN partners. That combination makes it easier to keep large live datasets available for editing, review, distribution, and archive.
A TAMS workflow backed by B2 can look like this:
– Use Drastic NetX to ingest and write live feeds into a TAMS store.
– Segment and index the media as it is captured.
– Let editors begin clipping and assembling stories in CuttingRoom.
– Use NetX readers to play and access the same media from Adobe Premiere or Avid.
– Keep the objects available for near-live production, distribution, and archive.
– Add a MAM where richer search, rights, governance, and catalog workflows are required.
Our deployment test offered one final lesson. Getting media into the store was straightforward. Making the service usable by the rest of the team required attention to the operational details. Open standards reduce lock-in, but production still depends on good deployment practices.
That is a healthy place for the industry to be. The pieces are becoming more modular, the interfaces are becoming more open, and media teams have more freedom to assemble the workflow that fits them.
TAMS gives those tools a common language. TAMOSS makes the store deployable. Drastic NetX handles how media is written into and read from the workflow. CuttingRoom makes the content useful to editors and production teams. And Backblaze B2 provides a scalable storage layer that makes the economics work.
The question is no longer whether live media can be stored in the cloud. It is whether we can make that media available to the right person, in the right tool, at the right moment.
Always-on SSE-B2 brings AES-256 encryption at rest to every new upload and destination copy—with no application changes, additional cost, or performance impact.
Security works best when it doesn’t depend on one more checkbox. Starting September 14, 2026, we’re making server-side encryption the automatic baseline for Backblaze B2 Cloud Storage.
Backblaze B2 will automatically encrypt all newly uploaded and copied object data at rest using Server-Side Encryption with Backblaze-managed keys (SSE-B2) and AES-256. The default applies immediately to new buckets. Existing buckets will receive the default gradually; once enabled for a bucket, newly uploaded and copied objects use SSE-B2 automatically. If an application doesn’t specify an encryption method, B2 handles it automatically.
Here’s the TL;DR: You don’t need to update your application, add an encryption header, or turn on a bucket setting. There is no additional charge for SSE-B2 and no impact on upload or download performance. New uploads are encrypted by default, existing objects keep their current encryption state, and SSE-C remains available when you want to provide your own key for an individual object.
Secure by Default, Without Extra Work
SSE-B2 encrypts object data at rest with AES-256 while Backblaze manages the encryption keys. Until now, customers could choose to enable SSE-B2 for a bucket or request it for an individual upload. With always-on encryption, SSE-B2 becomes the baseline for every new upload and destination copy when SSE-C is not explicitly requested.
That means fewer settings to manage, fewer opportunities for configuration drift, and a stronger security baseline across your storage environment. Teams can meet encryption-at-rest requirements without building another check into every application or deployment process. Server-side encryption cannot be disabled for new writes.
For new buckets, the default applies immediately. Existing buckets receive it gradually; once enabled for a bucket, new uploads and destination copies receive SSE-B2 automatically. Buckets already configured for SSE-B2 remain configured as they are, and requests that explicitly use SSE-C continue to use SSE-C.
What This Means for Your Existing Workflows
The best kind of security improvement is one that doesn’t force you to rebuild what already works. Always-on encryption is a behavioral update, not a new API contract. Existing integrations can keep using the same upload, copy, multipart-upload, and download operations they use today. B2 automatically decrypts SSE-B2 data for authorized reads, so the way you access objects does not change either.
See the Default in Action
The important part of these examples is what is missing: Neither upload explicitly requests SSE-B2. After this update, Backblaze applies it automatically.
S3-Compatible API: Upload Without an Encryption Flag
There is no --server-side-encryption option in the command. B2 still encrypts the new object with SSE-B2. In S3-compatible responses, that effective encryption is represented as AES256.
# Response includes "serverSideEncryption": {"mode": "SSE-B2", "algorithm": "AES256"}
The request does not include X-Bz-Server-Side-Encryption. The response still reports SSE-B2 with AES256 because it is now the effective default.
Using the S3-Compatible API?
Requests that omit encryption headers receive SSE-B2 automatically, reported through the S3-compatible AES256 value. PutObject, CopyObject, and multipart uploads all use the new default for the destination object. Valid SSE-C headers still take precedence.
Using the B2 Native API?
You can continue to omit SSE-B2 fields and headers. New uploads, large-file uploads, and destination copies use SSE-B2 by default. Applications can still explicitly request SSE-B2, but doing so is no longer necessary to receive encryption at rest.
Using an SDK, CLI, Integration, or the Web Console?
Because the protection is applied by B2, tools that already upload to Backblaze B2 benefit automatically. No special encryption flag, SDK upgrade, CLI update, or integration change is required. The Backblaze web consoles will show SSE-B2 or AES256 as the effective bucket default and continue to display the encryption actually used for each object.
SSE-C Is Still Available
Some organizations need direct control over the key used for a particular object. SSE-C continues to support that workflow. When a request includes valid SSE-C headers, Backblaze uses the customer-provided AES-256 key instead of SSE-B2 for that object.
As before, Backblaze does not retain the customer key. Customers using SSE-C are responsible for protecting and retaining their keys; a lost key cannot be recovered by Backblaze. You can also continue to encrypt data on the client side before uploading it. SSE-KMS is not part of this update.
What About Objects Already Stored in B2?
Always-on encryption is not retroactive. Objects already stored in a bucket keep the encryption state they had when they were written. We are not rewriting customer data in the background or changing the encryption metadata of historical objects.
If you want an older unencrypted object to use SSE-B2, upload it again or create a new destination copy. The new object is encrypted using the always-on default. Object-information and download responses continue to describe the encryption actually used for each object.
Why Always-On Encryption Matters
Encryption at rest is a foundational part of modern data protection. Making it automatic helps teams establish a consistent security baseline without adding another deployment step or relying on every application to make the same configuration choice.
It also keeps the developer experience simple. Teams can focus on moving, protecting, and using their data while Backblaze applies the default protection behind the scenes—with no added encryption charge or performance trade-off. That’s the kind of cloud storage experience we want to deliver: secure by design, straightforward to operate, and compatible with the tools customers already use.
Frequently Asked Questions
Do I need to change my application?
No. Applications that omit encryption settings automatically receive SSE-B2 for new uploads and destination copies. Existing request formats remain valid.
Can I disable server-side encryption for new uploads?
No. SSE-B2 is the effective default when SSE-C is not requested. Clearing or deleting an explicit bucket encryption configuration does not create an unencrypted default.
Does this encrypt objects that are already stored?
No. Existing objects retain their original encryption state. Uploading or copying an object again creates a new object that uses the always-on default.
Can I still use my own encryption key?
Yes. Supply the required SSE-C headers when you upload, copy, or access an SSE-C object. SSE-C takes precedence over the SSE-B2 default for that object.
Does always-on encryption cost more or affect performance?
No. SSE-B2 is applied at no additional charge and has no impact on upload or download performance. Normal Backblaze B2 storage and API charges still apply.
Available Starting September 14, 2026
Always-on SSE-B2 is available on September 14, 2026 for new buckets in every Backblaze B2 region. Existing buckets will be enabled gradually. For most customers, there’s nothing to turn on and nothing to migrate: once the default is enabled for a bucket, every new upload and destination copy receives SSE-B2 automatically unless you explicitly request SSE-C.
At NVIDIA’s GTC conference, Adobe’s CTO Ely Greenfield walked the audience through the company’s three-year journey building frontier generative AI models from scratch. And the AI training data pipeline required to keep thousands of GPUs productive.
Along the way, he showed a profiler readout from their early training runs—a visualization of exactly how much time each GPU was spending on actual computation versus sitting idle. It revealed that roughly two-thirds of GPU time was spent simply waiting for data. And that idle time had a price tag.
“If we were putting a million dollars into training,” he told the room, “that was $600,000 we were burning away on GPUs sitting and doing nothing.” In other words, roughly sixty cents of every dollar spent on GPU compute was being wasted.
Greenfield’s team traced the waste to two culprits, neither of which is unique to Adobe: whether data can reach your GPUs fast enough, and whether the work it represents is distributed evenly once it arrives.
One culprit is a storage problem. The other isn’t, but you won’t be able to fix it until you’ve solved the first one.
Culprit #1: Storage and retrieval speed
Adobe’s training data lived in petabytes of distributed cloud storage and had to be shipped out to thousands of GPUs constantly, over standard Ethernet. The dataset itself was enormous and varied—images and video, low-res and high-res, simple formats and expensive codecs, all moving at once. Standard networking, which was built for retrieving individual files on request, wasn’t designed for that kind of sustained, parallel, petabyte-scale movement. It became a massive bottleneck.
Checkpointing compounded the problem. As a safeguard, the training run would periodically write a complete copy of the model back to storage. Most of those checkpoints were never needed again. But writing and reading them still consumed real GPU time, which cost a lot of money whether they were used or not.
How Adobe fixed it
Adobe’s solution had two parts.
First, they replaced standard Ethernet with a high-performance networking fabric designed for the petabyte-scale traffic distributed AI training generates. Now, data could finally move at the pace their GPUs needed.
Second, they changed how they saved checkpoints. Instead of writing one giant file containing the entire model, they began breaking the model into smaller pieces and saving pipeline fragments to many places at once. Saving and loading checkpoints now takes significantly less time than it used to. If a checkpoint ever needs to be reassembled, that’s slightly slower, but it’s a rare event. The savings on every other write happen continuously, across thousands of GPUs, around the clock.
The underlying lesson is that for model training, parallel access and sustained high throughput are baseline requirements. Training data has to be immediately accessible at the pace your GPUs consume it, not tucked away in a storage tier that takes minutes or hours to retrieve.
Culprit #2: The data loader problem
A balanced data loader can only do its job if the data it’s balancing is actually available the moment it’s needed. That makes fast storage a precondition for everything else in the pipeline. But even after fixing the storage and retrieval speed culprit, Adobe still had a problem: the way training data was divided across the cluster meant some GPUs were doing far more work than others.
Their pipeline used a straightforward data-parallelism approach: slice the training data into equal-sized chunks and assign one chunk to each GPU in the cluster. But equal-sized chunks weren’t equal work. Some GPUs got simple, low-resolution assets that processed in seconds; others got large, complex files that took minutes. The fast GPUs finished early and sat idle waiting for the slow ones to catch up. And then all of them waited again while their results were merged into one updated model before the next round could begin.
How Adobe fixed it
Adobe stopped treating all data as equivalent. They custom-built a balanced data loader that understood the processing cost of each asset and distributed work so every GPU finished at roughly the same time. Then they restructured how computation was divided across the cluster to make the merging step dramatically cheaper.
A perfectly balanced data loader still idles if the data it’s waiting on hasn’t arrived yet. This is why storage can’t be an afterthought. The loader optimizes what happens once data is there, but storage determines whether it’s there at all.
And building something like Adobe’s balanced data loader takes real engineering investment, including time spent profiling workloads, testing distribution strategies, and tuning until every GPU finishes at roughly the same pace. Teams still fighting storage bottlenecks rarely get to that work. Their engineers are busy figuring out why GPUs are idle in the first place, not optimizing how work gets distributed once data arrives. Removing the storage bottleneck frees up the engineering time needed to tackle the data loader problem properly.
From 40 to 80 cents
After addressing both culprits, Adobe’s GPUs ran at roughly 80% utilization. After accounting for the coordination overhead inherent to running thousands of machines together, 80% is close to the practical ceiling. That’s the difference between a GPU cluster that’s mostly waiting and one that’s mostly working.
The Storage Side of the Solution
Backblaze B2 Overdrive addresses the storage side of exactly the problem Adobe ran into. B2 is always-hot object storage, with no tiering, no retrieval delays, and no waiting for data to be promoted from a cold tier before training can begin. Training data stays immediately accessible whether it was written an hour ago or six months ago.
But availability alone isn’t enough if data can’t move fast enough to keep up with the cluster. B2 Overdrive adds the throughput layer: at up to 1Tbps, it’s designed to keep petabyte-scale GPU clusters fed continuously, not just handle occasional bursts of traffic. Both layers are S3-compatible, so they drop into existing PyTorch or TensorFlow pipelines without a rewrite. And because egress is free, moving training data between storage and GPU compute—across regions or providers—doesn’t add a cost penalty on top of a performance one.
Checkpointing benefits from the same foundation. Adobe’s solution of breaking the model into fragments and saving them to many places at once only works if the underlying storage is fast and parallel enough to make it pay off. Always-hot, high-throughput storage makes checkpoint writes and recoveries faster across the board, so they cost less GPU time whether they happen rarely or often.
Backblaze can’t write your data loader for you, but it can make sure that once you’ve built one, it isn’t waiting on storage to do its job.
Building generative media applications on object storage: What the strongest projects have in common
Between June 22 and August 3, 2026, 1,314 people entered hundreds of projects into a single brief: build a generative media app on Backblaze B2 object storage, orchestrated through the open-source Genblaze SDK, for a share of a $10,000 prize pool.
Almost every entry could generate an image, a video, or a soundtrack, and generate it well. What separated the strongest was the layer underneath: what gets written down, what can be proved later, and what happens when a file has to be checked, corrected, or locked against deletion.
Here’s a closer look at the five that went furthest, and the parts worth reusing. Every entry is browsable in the hackathon project gallery.
The brief, and why it was narrow on purpose
The brief was narrower than most hackathons get. Submissions couldn’t just be a working demo and a repo. Devpost required teams to explain, in writing, how their app actually used both Backblaze B2 and Genblaze, and to list every provider and model behind it. Judging ran against four criteria: real-world utility, production readiness, meaningful use of B2, and meaningful use of Genblaze.
That last pair is the constraint that did the work. “Meaningful use” rules out the default architecture, where a team generates an asset, drops the bytes in a bucket, and calls that storage. It forces a decision about what the storage layer is actually for. What follows is written the way a technical and creative director would walk five finished pipelines against exactly that rubric: who each app is actually for, whether it holds up past the demo, and how deep the storage and orchestration choices go.
The two primitives
Backblaze B2 is the ground every one of these apps had to build on: S3-compatible object storage, sized for the sheer volume of generated assets, thumbnails, metadata, and provenance records a media pipeline throws off, free to start with 10GB included.
Genblaze, Backblaze’s open-source orchestration SDK, is what feeds it: a unified Pipeline API spanning providers like OpenAI, Google, Runway, Luma, ElevenLabs, and Stability Audio, plus models served through platforms such as GMI Cloud and NVIDIA NIM, so a team can swap providers without rewriting its orchestration. Every run produces a canonical provenance manifest that can be embedded directly into the media file itself (an .mp4, a .png, an .mp3) and persisted to B2 or any S3-compatible store.
The hackathon also partnered with GMI Cloud, giving teams easy access to open-source generative models for image, video, audio, chat, reasoning, and multimodal work, which is why it turns up as a provider more than once below.
Two primitives, six weeks, hundreds of teams, and five very different examples of rigor.
A review room for AI video ads that doesn’t make you wait for the whole render.
firstframe builds a review room for the marketing and creative teams who commission AI-generated video ads: instead of waiting on a full multi-scene render before anyone can react, it streams the first finished scene as a live HLS playlist the moment it’s ready, appending segments as later scenes land. A reviewer starts giving notes while the ad is still being made, not after.
Every generated scene is scored by an actual vision model before a human ever sees it, so obviously broken output gets caught and retried automatically rather than shipped to a reviewer’s inbox. A failover step swaps in a backup model only on a genuine provider error, never on an ordinary slow response, and once a scene clears review its master file and manifest are locked against deletion for thirty days: a guarantee the code proves by trying to delete a locked file and catching the rejection. Automated QA paired with a tamper-evident record of what was approved is what turns a generation pipeline into something a brand could actually sign off on.
On B2, the bucket’s folder structure doubles as a workflow: a scene moves through incoming, running, provenance, approved, and rejected prefixes as it clears review. Once a scene is approved, its master file and manifest get a real thirty-day write-once hold using B2’s Object Lock in Governance mode, and the code proves that isn’t just decorative by trying to delete a locked object by its version ID and catching the rejection B2 throws back. A reviewer’s application key is scoped to the readFiles capability with a name prefix restricting it to the approved folder alone. Four separate lifecycle rules cover the bucket’s different prefixes: stalled uploads in incoming have their multipart parts cancelled after 24 hours, while rejected, in-progress, and approved objects each age out on their own separate timers. The video segments themselves land in B2 as ffmpeg finishes each one, with the playlist rewritten after every segment, which makes B2 a live broadcast target rather than an archive that fills up after the fact. Reads go out as path-style presigned URLs, working around a known issue where virtual-host-style presigning fails on a private B2 bucket. B2’s own Event Notifications, five signed webhook rules, keep the review room in sync in real time, with a fallback to plain polling if an account’s Event Notifications API isn’t enabled. The app also watches B2’s own transaction cap and backs off to local disk instead of crashing when a call gets rejected for exceeding it.
On Genblaze, generation runs through an AgentLoop scored by a ThresholdEvaluator. The judge is a real vision model, an NVIDIA NIM llama-3.2-90b-vision-instruct instance grading the actual rendered keyframes, not a fixed retry count. Two pipeline branches, audio and video, fan into a single compositor node instead of running as a straight chain, a fallback_models failover is wired in and confirmed to trigger only on a genuine model error rather than a timeout, and every run carries two layers of lineage: a shared run id across scenes and loop iterations, plus a second, custom chain id layered on top of that. The team even embedded the manifest directly inside the delivered MP4, so a separate verification command can re-download and re-hash every asset the file claims exists. Along the way they filed three pull requests and an issue against Genblaze itself.
firstframe puts B2’s feature set to work in front of the reviewer. Object Lock in Governance mode, scoped application keys, lifecycle rules, Event Notifications, and presigned URLs are all load-bearing parts of the review workflow, doing visible work on every scene that moves through it. That’s architecture built to be trusted, not just to work.
A campaign generator built to double-check its own storage, re-verifying every asset the moment it’s read back.
beavous is built for the marketers and small commerce teams who need a full paid-social campaign out of a single product photo: not one hero image, but four creative concepts, sixteen cropped aspect ratios for every placement, on-label ad copy, and a portrait video reel, packaged as a verified ZIP pulled straight from B2.
A public API hands off to a private worker behind a task queue, and every campaign is namespaced to an organization so tenants stay isolated from each other. When a generation gets rejected, the app doesn’t start over. It chains a correction onto the original attempt, which is closer to how a real creative review actually works than a one-shot retry.
On B2, keys are organized hierarchically by organization and campaign rather than by content hash, because the product is multi-tenant by design. Every upload and download goes through a presigned URL, and the database never stores a raw link, only an object key and a hash. Every time an asset is read back, beavous re-downloads it and re-hashes the bytes independently, rather than trusting a manifest check alone. B2 is treated as the single, sole system of record for every generated asset: a clean, one-source-of-truth design with nothing else to keep in sync.
On Genblaze, three custom providers handle Gemini image generation, Gemini video, and Veo image-to-video, each with its own tiered pricing registered on the model. The more interesting move is a correction chain: when a generation gets rejected, its manifest becomes the parent of the next attempt, an explicit correction lineage most one-shot generation pipelines skip entirely. Prompts are marked private so the text never lands in the public manifest, only a hashed reference to it does, and before any manifest is trusted as a correction parent it gets independently re-verified, not assumed correct just because it was the app’s own write.
beavous’s answer to “do you trust your own storage” is simple: no, never. Check it again, every time. That’s a slower design than trusting your own write, and a more honest one.
A build system for generative media that can prove its own reuse, recovery, and release integrity, live, against B2.
takegraph is built for teams running a production, not a single generation: the kind of project where a script tweak halfway through shouldn’t mean re-rendering everything from scratch. It treats the whole thing like a software build: a content-addressed dependency graph that, when a spec changes, recomputes fingerprints, rebuilds only what’s actually invalidated, and reuses everything else.
A team can also re-download and re-hash the actual bytes behind any reuse, recovery, or release straight from B2, live, checking integrity themselves instead of trusting a log. That kind of self-auditing separates a pipeline meant to run unattended for months from one built to survive a single demo.
On B2, content-addressed keys use a two-level hash split so directory listings stay fast at scale, B2’s own Event Notifications (HMAC-SHA256-signed webhooks) feed a background process, and a separate reconciler periodically re-checks everything by hand in case a webhook is ever missed, coordinated across workers with a database lock so only one reconciler runs at a time. Unvalidated uploads land in a quarantine prefix backed by a real lifecycle rule that expires it automatically, and a bad key gets rejected outright rather than silently rewritten. Two least-privilege application keys, one for day-to-day work and one for releases, are each scoped to a single bucket, and CORS rules on the work bucket exist specifically to support presigned browser uploads. Verification (re-download, re-hash, prove it) is a feature of the product, not an internal tool.
On Genblaze, takegraph builds a real pipeline around the idea: a dedicated run builder, a content-addressable storage sink, manifests, and observability events tied to every step. The team kept its media-generation side lean, calling straight through the GMI Cloud connector for image and video (one of the hackathon’s partner platforms), and pointed all of its custom engineering at the layer that makes the whole pitch work: the storage and consistency system underneath.
takegraph turns storage verification into the product itself: reuse, recovery, and release integrity are things a user can ask the system to prove, live, rather than take on faith. That’s B2 treated as a system of record in the fullest sense: self-healing, event-driven, and built to survive a missed webhook without anyone noticing.
A comic studio with a provider for every model it needed, and a manifest for every frame it drew.
Ninth is built for indie comic authors and motion-comic creators working on a small budget, who revise a scene a dozen times before it’s right and can’t afford to pay for a fresh generation on every pass. Describe a story, and it writes, draws, casts, and stages it panel by panel on an editable timeline, then bakes the result to an MP4.
An edit doesn’t force a re-generation: assets are pulled from a semantic library whenever something close enough already exists, and everything the AI produces (timing, layer position, camera, bubble placement, even the artwork itself) stays editable in place afterward. That reuse-first design is backed by 126 regression tests and a render path that shares its engine with the live editor, so what a creator previews is exactly what gets exported.
Its B2 layer favors verified durability: flat content-addressed keys and a manifest per run, plus real, working endpoints for audit, restore, and backfill that report exactly what’s on B2 versus what’s only on local disk, and rebuild the difference with a SHA-256 check on every recovered file.
On Genblaze, Ninth wrote seven or eight custom providers, covering nearly every model it reached for: Azure’s image model, Gemini’s aspect ratios, Veo keyframes, Gemini’s video interpolation model, ElevenLabs music, and two separate structured-text providers. Each one exists for the same reason: to keep that artifact inside a pipeline and give it a manifest, so a generated frame always carries a record of the run and the prompt that made it.
Ninth’s mention is for discipline: the project that took “every generated frame should be reproducible and recoverable” most literally, and built the tooling to prove it on demand.
A spatial twin that gives a person’s spoken correction the same provenance as a model’s output.
Spatialize is built for venue and accessibility teams who need to rehearse a step-free route through a space before anyone sets foot in it: it turns a flat floor plan into a voice-navigable spatial twin, extracting validated 3D geometry from the plan image, then answering spoken questions with route guidance grounded in that geometry.
Because the underlying use case is safety-adjacent, nothing the model proposes is trusted outright. Every extracted floor plan, and every voice-driven edit to it, has to pass the same deterministic geometry validator before it’s accepted, so a plausible-looking but wrong route never quietly makes it into a rehearsal. When that validator rejects an attempt, it hands back the exact error, and the next attempt corrects specifically that, not a blind retry.
On B2, Spatialize favors resilience: every read goes through a short-lived, presigned link, and if B2 isn’t configured at all, the app quietly falls back to a local, path-safe store instead of failing to boot. It runs two storage paths side by side (its own hierarchical object store for run and scene state, and a separate Genblaze storage sink dedicated to generated-media provenance), keeping application state and generation history cleanly apart.
Under the hood, an agentic loop drives the floor-plan extraction, evaluated at each attempt by that same deterministic validator rather than an LLM’s opinion. Three custom text-to-speech providers form a genuine fallback ladder: a cloud model first, a lightweight third-party API next, and a self-hosted, zero-credential model as the last resort, so a narration request degrades gracefully rather than failing outright. The standout idea: a voice-driven edit to the scene creates a new version tagged as a human change, with the actual transcript kept as evidence, so every point in the final scene traces back to either a model’s manifest or a person’s own words.
Spatialize’s real achievement is conceptual: it gives a spoken correction the same seriousness as a model’s output, tracing every point in the final scene back to either a manifest or a transcript. That’s provenance thinking applied somewhere most generative pipelines never point it.
Same brief, different rigor
Every winning project found its own discipline. What they share is how many different, equally valid kinds of rigor a small team can bring to the same two primitives in six weeks. firstframe made B2’s write-once guarantee visible to a reviewer in real time. beavous made re-verification a habit instead of an afterthought. takegraph made its storage layer heal itself. Ninth made every one of its seven custom providers answerable to the same manifest. Spatialize made a human correction as provable as a model’s.
None of that shows up until a team stops treating storage and orchestration as plumbing and starts treating them as part of the design. firstframe’s win sits at the intersection of both: the same rigor that scores a generated frame with a vision model also locks the finished one against deletion.
What you can build on
Strip the five projects back and the same handful of moves keep appearing, none of which need a hackathon, a large team, or a novel model:
Object Lock in Governance mode turns “approved” from a database flag into a storage-level fact, and firstframe proves the hold is real by attempting the delete by version ID and catching the rejection B2 returns.
Bucket prefixes (incoming, running, approved, rejected) give you queue semantics without a queue, with a separate lifecycle rule per prefix so stalled multipart uploads and dead rejects expire on their own timers.
Re-download and re-hash on read, the way beavous does, because a non-deterministic pipeline produces a lot of near-identical artifacts and hashing is how you know which one you’re holding.
Event Notifications as the fast path, a periodic reconciler as the source of truth, so a dropped webhook costs you latency instead of correctness.
Content-addressed keys with a two-level hash split keep directory listings fast at scale and make reuse cheap: same fingerprint, same bytes, no second generation to pay for.
Application keys scoped one per role, like a reviewer key limited to the readFiles capability with a name prefix restricting it to the approved folder.
Correction lineage instead of retries: the rejected run’s manifest becomes the parent of the next attempt and carries the specific error forward. beavous and Spatialize arrived at this independently, which suggests it’s the general shape rather than a niche trick.
All of it is available today. B2 starts free with 10GB, and Object Lock, lifecycle rules, Event Notifications, scoped application keys, and presigned URLs are in the API from day one. Genblaze gives you one Pipeline API across OpenAI, Google, Runway, Luma, ElevenLabs, and Stability Audio, plus models served through GMI Cloud and NVIDIA NIM, and a canonical provenance manifest out of every run that embeds straight into the .mp4, .png, or .mp3 you ship.
A good first project is smaller than any of these five. Take a pipeline you already have, write a manifest for every run, persist it to B2, and add one endpoint that re-downloads and re-hashes an asset to prove the manifest is honest. That’s a weekend of work, and everything above is a variation on it. Genblaze is open source, and three of the pull requests behind firstframe are already in it.
For more ideas, the full project gallery has every entry from the hackathon, and there’s a lot in there beyond the five covered here.
Since April 2013, Backblaze has published the daily health readings of every hard drive running in our data centers. Model, serial number, failure flag, and dozens of Self-Monitoring, Analysis, and Reporting Technology (SMART) attributes, collected into a CSV for each day, released publicly every quarter, for free. We built Drive Stats as a mechanism to understand our own fleet, then published almost on a whim—so much so that the original idea is credited to two Brians. What happened next was an exciting surprise.
More than 227 papers and articles have cited Drive Stats as a primary dataset since 2018. Researchers have trained transformer architectures, long short-term memory (LSTM) networks, survival models, and gradient-boosted ensembles on it. The dataset that started as an internal reliability tool has become one of the most-cited open benchmarks in hard drive failure prediction research.
What makes Drive Stats so valuable?
Drive Stats reflects a live, continuously operating commercial fleet of drives: different manufacturers, different models, different capacities, all spinning in production Storage Pods under real workload conditions. That combination of scale and heterogeneity is rare, and it is exactly what makes the dataset especially useful to researchers.
For storage engineers and data scientists, the dataset checks every important box: real-world origin, a long time horizon, labeled failures, an open license, and an active maintainer that publishes new data each quarter. Here are a few other specifics worth understanding before diving into the research:
Download access: The full quarterly archive is available for free on the Backblaze Drive Stats page under the MIT License.
Open license: Backblaze asks three things of anyone who uses the data: that they cite Backblaze as the source, they accept responsibility for how the data is used, and they do not resell it.
SMART attributes: Each daily snapshot includes raw and normalized values for more than 70 different SMART attributes per drive. We define a drive failure in our dataset based on a few metrics, which we talk about in previousreports, as well as articles dedicated to parsing the program.
Scope and coverage: We began publishing quarterly hard drive data in 2013. The current dataset spans more than a decade of operation and covers hundreds of thousands of individual drives across manufacturers including Seagate, HGST, Western Digital, and Toshiba. Each year, we also compile data related to annualized failure rates (AFR) and lifetime failure rates across all manufacturers. Lifetime failure rates indicate the probability that a drive will fail over the course of its lifetime, while AFR indicates the probability a drive will fail during a year of operation. Rates are expressed as a percentage. Data related to lifetime failure excludes drive manufacturers with less than 500 units deployed, and all drives must have 100,000 active drive days to be included in the lifetime data set. The 2025 annual report recorded an annualized failure rate (AFR) of 1.36% across the fleet, down slightly from 1.57% in 2024, reflecting multiple factors (average drive age, technology improvements, drive size increases, cost per gigabyte, and market demand).
Most importantly: the economics of drives, and the measures people take to keep them spinning within a data center, are fundamentally different than in a consumer use case. In some ways, it’s the perfect test—the drives are always on, and we run them until they give up the ghost. In others, it’s a bit deceptive—most people don’t have alerts set up to monitor drive health in their home environments.
Of course, many do. Data is important, and for those who schedule weekly maintenance for your home networks: we love it, we’re here for it, and us too.
Academic research built on Drive Stats
The papers below represent a cross-section of research that uses Drive Stats as a primary dataset. Each represents a meaningfully different approach to the same core problem: predicting when a hard drive will fail, with enough lead time to act on it.
TFBEST: Dual-Aspect Transformer With Learnable Positional Encoding for Failure Prediction
Experiments on Seagate hard disk drive (HDD) data led the authors to propose a novel transformer architecture for predicting failures in hard drives that significantly outperformed prior state-of-the-art remaining useful life methods on the Drive Stats benchmark.
Their proposed architecture—the Temporal-Fusion Bi-Encoder Self-attention Transformer—is an encoder-decoder model trained on the full 10-year Drive Stats corpus (from 2013 to the time of article). Rather than classifying drives as failed or healthy within a fixed horizon, TFBEST predicts a sequence of days-to-failure, giving operators a window, rather than a binary alarm. The paper also introduces a confidence-margin statistic that manufacturers can use to set replacement thresholds with quantified uncertainty.
Large-Scale End-of-Life Prediction of Hard Disks in Distributed Datacenters
The authors presented a long short-term memory (LSTM) model that used understanding gleaned from Drive Stats to aid in predicting an output sequence of the number of days remaining before the possible failure of a disk. The LSTM posted a root mean square error of 0.83 during training, and 0.86 during testing across the full 10-year corpus, and generalized competitively across multiple Seagate model families.
The core architecture was an encoder-decoder LSTM network: the encoder processed a window of historical SMART readings for a given drive; the decoder produced a multistep output sequence representing the predicted days-to-failure. The model was trained and validated on all Drive Stats data available at the time, roughly 35GB, covering Seagate drive models with significant failure populations.
Leveraging Survival Analysis in Cost-Aware Deepnet for Efficient Hard Drive Failure Prediction
To address the significant imbalance of real-world datasets used for drive-failure detection—the relatively small number of failures when compared to the number of drives operating normally—the authors relied on the SMART attributes found in Drive Stats to uncover new insights into drive health and failure.
They used a dual-track approach: a deep-learning track for failure prediction and a survival-analysis track for identifying which attributes most strongly govern time-to-failure. Together, the two tracks provided both operational predictions and mechanistic insights useful for data-center management strategy.
Examining the Impact of Critical Attributes on Hard Drive Failure Times: Multi-State Models for Left-Truncated and Right-Censored Semi-Competing Risks Data
Authors: Jordan L. Oakley, Matthew Forshaw, Pete Philipson, Kevin J. Wilson
Many hard-drive failure prediction papers ask a binary question: Will this drive fail in the next N days? This paper asked a more nuanced statistical question: How do intermediate critical states defined by deteriorating SMART attributes affect the time distribution of eventual failure?
Oakley and colleagues first defined critical attributes and critical states using Drive Stats SMART readings, and then fit multistate survival models to the resulting semicompeting risks structure. These risks arise because a drive can move from healthy to critical (nonterminal) before failing (terminal), but failure can also occur without a detectable prior critical state. The multistate framework handled both pathways in a single coherent model.
The key contribution was a set of dynamic predictions of conditional survival probability that updated as the observed state of a drive changed – so operators got a live risk estimate, not a static score. Experiments on Drive Stats data confirmed that drives entering critical states are substantially more likely to fail.
AI/ML Models and Projects Built on Drive Stats
Academic papers are one signal that a dataset has earned its place in a field. Practitioners building things with it are another. A growing body of work, including open-source projects on platforms like GitHub, helps translate academic research into practical, runnable code, and provides additional confirmation of Drive Stats as a standard benchmark for the field.
The project aimed to create a binary classification model using machine-learning algorithms to predict the probability of drive failures based on SMART data, along with other features such as brand and storage capacity. It applied three methods: random forest, XGBoost, and a combined ensemble to Drive Stats SMART attribute data.
Large-Scale End-of-Life Prediction of Hard Disks in Distributed Datacenters
For practitioners building their own Drive Stats pipelines, this is one of the few public examples that addresses the full stack data ingestion, feature engineering, class imbalance, and sequence modeling, rather than demonstrating a model on a precleaned subset. Its combination of XGBoost for feature selection and LSTM for sequence prediction serves as a practical template for anyone working with raw quarterly CSV files.
Beyond the model architecture described in the academic paper section above, this project is notable for its engineering approach to handling Drive Stats at scale. The team built a preprocessing pipeline using PostgreSQL to ingest, filter, and join the quarterly files; used XGBoost across the full SMART attribute set; and applied interpolation to fill gaps, before feeding sequences to the encoder-decoder LSTM.
Are There Manufacturer Differences in Hard-Drive Reliability?
Contributor: Christoph Siemroth, Yeomyung Park
Venue: IEEE Transactions on Cloud Computing
Researchers used Backblaze’s large data-center dataset to compare failure rates across four manufacturers (HGST, Seagate, Toshiba, and Western Digital). Duration regression models controlled for drive age, capacity, and form-factor, and the findings concluded that HGST drives fail least often (about 42% of Seagate’s failure rate. However, WD drives outperformed Seagate but fared worse than HGST. Toshiba’s failure rate is similar to Seagate’s.
The study revealed a significant reliability gap between HGST and Seagate, doubling the financial burden for large-scale operators related to replacement-related labor and other costs. Drive failure analytics highlighted in the study can be used by large-scale operators to forecast future costs, informing procurement decisions.
Drive Stats research at a glance
Paper / Project
Authors
Venue / Platform
What It Predicted / Built
TFBEST: Dual-Aspect Transformer With Learnable Positional Encoding for Failure Prediction
Mohapatra, Sengupta
arXiv (2309.02641)
A novel, high-performing transformer architecture for predicting hard-drive failures
Large-Scale End-of-Life Prediction of Hard Disks in Distributed Datacenters
Mohapatra, Coursey, Sengupta
IEEE
An LSTM helps to predict the number of days to a given disk’s failure to a high accuracy level
Leveraging Survival Analysis in Cost-Aware Deepnet for Efficient Hard Drive Failure Prediction
Ahmed, Green II
Neural Computing and Applications, Vol. 37
Operational predictions and mechanistic insights for data-center management strategy
Examining the Impact of Critical Attributes on Hard Drive Failure Times
Oakley, Forshaw, Philipson, Wilson
Applied Stochastic Models in Business and Industry, Vol. 40, Issue 3
Confirmation that drives entering critical states defined by deteriorating SMART attributes are substantially more likely to fail
HDD Failure Prediction Using Machine Learning
warc0s
GitHub
A binary classification model using machine-learning algorithms to predict the probability of drive failures
Large-Scale End-of-Life Prediction of Hard Disks in Distributed Datacenters
rohanmohapatra
GitHub
A practical template for practitioners working with raw quarterly CSV files to build their own prediction pipelines
Are There Manufacturer Differences in Hard-Drive Reliability?
Siemroth, Christoph Park, Yeomyung
IEEE
A comparison of hard-drive reliability across four manufacturers, using data regression models.
The case for open data
The breadth of research is a direct result of open datasets. These citations occur because the data was consistently available every quarter for more than a decade—and it helps that we built a community of similarly interested people, too.
For research communities, open datasets function the way open-source libraries do: they create a shared foundation that everyone can build on and compare against. Drive Stats has earned that role in hard drive failure prediction by showing up reliably for over 13 years. A few things make open data particularly useful:
Ecosystem reach. Drive Stats doesn’t exist in isolation: We publish it on Hugging Face, where it sits alongside hundreds of thousands of open datasets, across domains from natural language processing to genomics. Kaggle hosts it alongside tens of thousands of community notebooks and kernels.
Reproducibility. Drive Stats is public, permanently archived, and available for download. A paper published today cannot recreate historical data. There’s not really a corollary in a field where most real-world fleet data is proprietary and inaccessible—but we’d love people to join us.
Research velocity. When data is freely available, there’s no need to spend months negotiating access agreements. You simply download Drive Stats, read the schema documentation, and start building. The papers mentioned in this article collectively span transformer architectures, survival models, deep neural networks, and gradient boosting, all on the same dataset. You can’t necessarily call it a direct comparison, but it does make one thing clear: hardware is central to the cloud conversation.
Sign up for the Drive Stats newsletter
The same data that powers academic research also powers our own reliability reporting: The annualized failure rates, SMART attribute analysis, and transparency have made Drive Stats a standard in the field for more than a decade. And that data keeps coming, with a new release every quarter, since 2013.
If you’re working on failure prediction, predictive maintenance, or just want a real-world labeled dataset for benchmarking, this is the one researchers keep reaching for.
Backblaze Drive Stats is a publicly available dataset of daily hard drive health snapshots from our data centers. Published quarterly since 2013, it includes Self-Monitoring, Analysis, and Reporting Technology (SMART) attribute readings; failure labels; and model information for hundreds of thousands of drives. The data is free to download from the Backblaze Drive Stats page.
Has Drive Stats been used in academic research?
Yes. More than 227 papers and articles have cited Drive Stats as a source since 2018. Researchers have used it to develop and test hard drive failure prediction models, survival analysis frameworks, and deep learning architectures across venues including IEEE, Springer, Wiley, and arXiv.
Which AI/ML models were trained on the Backblaze dataset?
Researchers have trained a wide range of models on Drive Stats data, including long short-term memory networks, transformer architectures, 1D convolutional neural networks, gradient-boosted trees, survival analysis models, and ensemble methods.
Is the Backblaze Drive Stats dataset on Hugging Face?
We publish Drive Stats on Hugging Face at huggingface.co/datasets/backblaze/Drive_Stats. The repository contains over 388 million records and grows by more than 240,000 records per day. It is append-only, meaning daily snapshots are never updated or deleted once written, making it particularly useful for reproducible research.
Why do researchers use open hard drive datasets?
Open datasets like Drive Stats allow researchers to benchmark models against consistent real-world data, reproduce published results, and build on prior work without access to proprietary fleet data. Because Drive Stats reflects a heterogeneous, production-scale environment rather than a lab setting, it provides a uniquely credible benchmark for evaluating failure prediction methods.
How many times has Drive Stats been cited in research?
More than 227 papers and articles have cited Drive Stats since 2018. The actual number continues to grow as researchers publish new work on hard drive reliability, predictive maintenance, and artificial intelligence/machine learning (AI/ML) model benchmarking.
At GTC this year, Jensen Huang put a number on a problem that most enterprise AI teams already feel but struggle to articulate: about 90% of what gets generated every year is unstructured data. This includes PDFs, emails, video, contracts, support tickets, and voice recordings.
Until recently, that data was, in his words, almost entirely useless. You could store it or search it by keyword, but machines couldn’t read it, understand what it meant, or draw any connections between it and other content.
GenAI has changed that. RAG pipelines, vector databases, and embedding workflows give machines a way to process unstructured content, comprehend its meaning, and synthesize information across the entire enterprise.
The problem is that these tools put a completely different set of demands on storage than anything that came before them. And most enterprise storage wasn’t built for it.
The access pattern no one planned for
Traditional enterprise storage assumes that data gets written and then occasionally retrieved. The architecture for it was built with hierarchical file systems and tiered storage (hot archives for data that gets accessed regularly, cold archives for anything that hasn’t been touched in a while). It worked well for decades, until RAG pipelines broke it.
A RAG pipeline works by reading your documents and converting them into a format the AI can search. But that conversion process is not a one-time event. It has to be run repeatedly as you test, adjust, and update. Every adjustment means re-reading the same content, re-processing it, and re-writing the results back to storage.
For example, the pipeline breaks documents into chunks because the AI can only search effectively when content is divided into manageable pieces. The size of those chunks directly affects how well the AI answers questions. Too large, and the AI retrieves too much irrelevant content. Too small, and it loses context.
Whenever you have to update your underlying documents, the pipeline has to re-read and re-process everything affected by the change. The same is true when upgrading to a newer AI model, because the new model produces different representations of the same content and requires everything to be re-converted.
While the pipeline is reading, it’s also saving converted content, updated search indices, and checkpoints. And what it saves is tiny. Embeddings, vector chunks, and metadata objects are often just a few kilobytes each, but a production RAG pipeline generates millions of them. Legacy storage treats every save operation the same regardless of file size, so saving a million tiny files costs nearly as much as saving a million large ones.
Tiered storage exacerbates this even more. These systems judge which data is still needed and which can be moved to cheaper, slower storage based on how recently something was accessed. But a RAG pipeline might go quiet for weeks between runs and then suddenly need everything at once. Or it might re-index documents on a schedule that the storage system doesn’t recognize as regular access. Either way, the tiered system sees cold data and moves it to a slower tier. When the pipeline needs that data back, it waits and pays a retrieval fee before it can proceed. That cost and delay compounds across millions of objects and dozens of pipeline runs.
The governance problem hiding inside your index
When a RAG pipeline indexes documents into a vector database, it takes a snapshot of your data at that moment in time. The embeddings it generates reflect the content of those documents as they existed when the pipeline ran. When the original documents are updated or changed, the snapshot doesn’t change with them. The vector index keeps pointing to the old version, and the AI keeps retrieving it and presenting it as current fact.
To a user, that looks like hallucination. The model is confidently citing a document that no longer says what the model thinks it says. But the failure isn’t happening inside the model; it’s happening at the storage layer. Specifically, in the gap between when source documents change and when the index gets updated.
Most enterprises running RAG pipelines today have no systematic way to close that gap. Document management systems aren’t built to notify downstream AI pipelines when content changes. Vector databases aren’t built to automatically invalidate and re-index affected embeddings. The result is an AI system that’s architecturally incapable of knowing when its knowledge has gone stale, so it presents outdated information with the same confidence as current information.
What GenAI storage actually requires
Closing the gap between what RAG pipelines demand and what legacy storage delivers requires three things:
Sustained high throughput. RAG pipelines generate continuous, mixed traffic at every stage of the process—ingesting documents, processing them, writing the results to an index, and querying that index—often all running simultaneously. Storage must be able to move data in and out fast enough to match the speed at which the pipeline generates requests, and sustain that speed across the entire duration of a run, not just handle short bursts.
Always-hot architecture with no tiering. Every document needs to be immediately accessible regardless of when it was last touched. This is not just for pipeline performance, but also because slow re-indexing is what produces stale outputs. When source documents change, the pipeline needs to re-index immediately. Storage that puts documents behind retrieval delays or tiering penalties widens the window in which the AI is working from outdated information and presenting it as fact.
Free data movement. RAG workflows span multiple GPU providers, MLOps platforms, and inference environments across multiple regions. Storage that charges egress fees for every transfer turns architecture decisions into cost calculations and discourages the experimentation that gets AI systems from prototype to production.
The storage layer that doesn’t get in the way
Backblaze B2 Overdrive is built around exactly these requirements. It is always-hot object storage with no tiering, no retrieval delays, and no waiting for data to be promoted before a pipeline can run. Every document is always available, regardless of how recently it was written, which means when the pipeline needs to re-index, storage never slows it down.
At up to 1Tbps sustained throughput, it keeps high-volume RAG pipelines fed continuously through the constant mixed traffic of reads and writes they generate. Because egress is free, teams can move data between storage and compute across regions and providers without a cost penalty. And S3 compatibility lets B2 Overdrive drop into existing LangChain, LlamaIndex, and vector database pipelines without rewrites.
Ninety percent of enterprise data is sitting in formats that, until recently, machines couldn’t do anything useful with. The tools to unlock it now exist. How well they perform and what they cost to run depends largely on the storage underneath them.
Organizations rarely struggle with a lack of storage options. More often, they struggle with determining which solution best fits the way their data is created, accessed, and protected: backup versus cloud storage.
That’s especially true when evaluating backup and cloud storage solutions.
The terms are often used interchangeably, but backup and cloud storage are designed to solve different problems. Understanding those differences can help you build a more effective data protection strategy—whether you’re protecting a personal laptop, a growing media archive, employee endpoints, or critical business data.
At Backblaze, Computer Backup and B2 Cloud Storage serve distinct purposes. For some customers, one solution is the clear choice. For others, the strongest approach combines both.
Before comparing features, it’s helpful to start with a few foundational questions.
The answers often reveal whether you’re primarily trying to protect a computer, store data in the cloud, or address both needs at the same time.
When the goal is protecting a computer
For many individuals and businesses, the most important data still lives on laptops, desktops, and attached external drives.
A photographer may keep active projects on a workstation. A consultant may store client files locally. A small business may rely on employee laptops as the primary location where work is created and managed.
In these situations, the primary concern isn’t cloud infrastructure. It’s protecting the device where the work happens.
That’s where Backblaze Computer Backup fits.
Computer Backup is designed to automatically protect data stored on a Mac or Windows computer, including connected external hard drives (but not NAS devices). Once installed, it runs continuously in the background, backing up files without requiring users to manually manage folders, storage allocations, or backup schedules. For organizations looking to protect NAS data, B2 Cloud Storage can serve as a backup destination through a variety of supported third-party backup and sync tools.
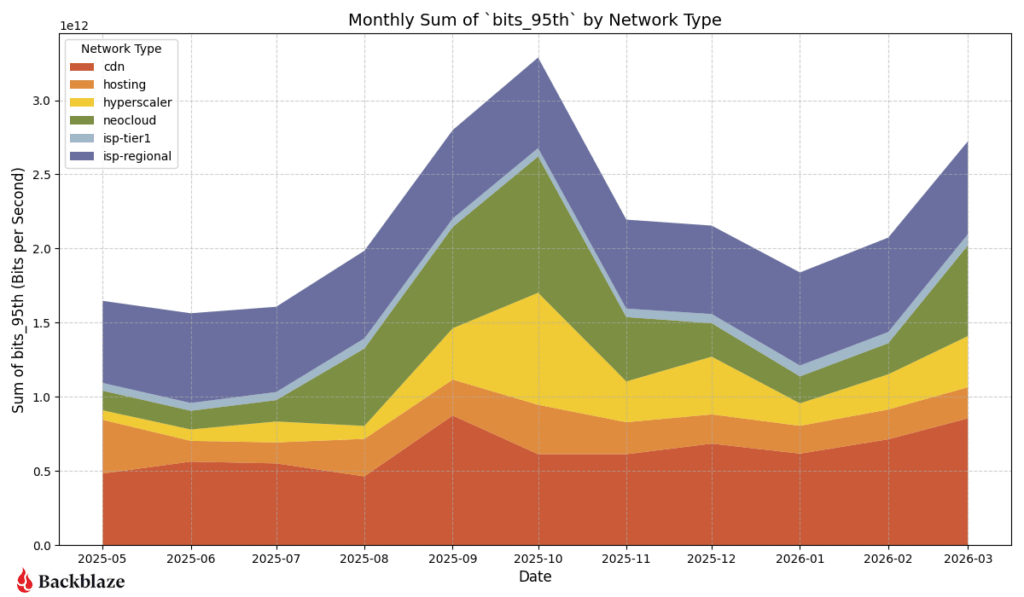
The value becomes clear when something goes wrong:
A laptop is stolen.
A hard drive fails.
Files are accidentally deleted.
A ransomware attack impacts local data.
A computer needs to be restored after a hardware issue.
In each case, the goal is recovery.
Computer Backup is often a good fit when:
Your most important data lives on a computer.
You want automatic, continuous protection.
You need to recover from device loss, hardware failure, or accidental deletion.
You want a solution that requires minimal administration.
Your primary concern is protecting endpoints.
For many professionals, families, and small businesses, those requirements align closely with their day-to-day reality.
When the goal is storing and managing data in the cloud
As organizations grow, data often becomes less tied to individual devices.
Files are shared across teams. Backup software protects servers and NAS devices. Applications generate and consume data continuously. Data needs to remain accessible and manageable independent of the original device, whether that’s for long-term retention, team access, application workflows, or infrastructure backups.
At that point, the challenge shifts from protecting a computer to managing data itself.
That’s where Backblaze B2 Cloud Storage comes in.
Unlike endpoint backup, cloud object storage is designed to store data independently of any single device. Data can be uploaded, accessed, managed, shared, and integrated into workflows across users, systems, and applications.
Organizations use B2 Cloud Storage for a wide range of use cases, including:
In these environments, accessibility, scalability, and integration often matter just as much as protection.
B2 Cloud Storage is often a good fit when:
Data needs to exist independently of a specific computer.
Multiple users or systems require access.
You need API-based access and automation.
You use third-party backup software that requires cloud object storage.
You need centralized storage for growing datasets.
You are building applications or data-driven workflows.
The focus isn’t on protecting a device. It’s on providing a durable, accessible home for data.
Understanding the data lifecycle
One reason organizations often use both backup and cloud storage is that data requirements change over time.
Consider a video production team.
While a project is actively being edited, the files may live on a workstation and several external drives. During that phase, protecting the editing environment is critical.
Once the project is complete, however, the priorities often change. The team may need to retain the content for future revisions, client requests, or compliance purposes. The files are no longer active, but they still need to remain available.
The same pattern appears across industries.
Architectural firms retain project files after construction is complete. Marketing teams archive campaign assets. Businesses preserve records for operational or regulatory reasons.
Not all data serves the same purpose throughout its lifecycle.
Active data often benefits from continuous endpoint protection, particularly when it lives on laptops, workstations, or attached drives. As that data ages, becomes shared across teams, or moves into long-term retention, cloud storage often becomes a more appropriate solution.
This is one reason many organizations use both Computer Backup and B2 Cloud Storage. The two solutions address different stages of the data lifecycle rather than competing for the same role.
When your storage requirements change
A common misconception is that organizations eventually “graduate” from backup to cloud storage. In reality, most environments become more complex over time, adding new requirements rather than replacing existing ones. As data volumes grow, teams collaborate across more systems, and retention needs increase, organizations often find themselves adding cloud storage to support those evolving demands. The shift isn’t typically about moving away from backup—it’s about addressing new use cases that emerge as data becomes more distributed, accessible, and valuable to the business. Common signs that additional cloud storage may make sense include:
Your data is no longer centered around one device
When multiple people need access to the same information, storing everything on a single workstation becomes limiting.
You’re building long-term archives
Completed projects, historical records, and large media libraries often benefit from dedicated cloud storage.
You’re adding automation and integrations
Applications, backup platforms, and workflows frequently require API-accessible storage.
You’re managing more than endpoints
As NAS devices, servers, and infrastructure become part of the environment, storage requirements often extend beyond individual computers.
In these scenarios, cloud storage isn’t replacing endpoint backup. It’s addressing new requirements.
The blind spot many cloud storage users discover
The reverse scenario is also common. An organization adopts cloud storage and establishes a centralized repository for important data, only to discover that important risks still exist at the endpoint level. An employee may accidentally delete a local project folder, lose a laptop, or experience a workstation failure before files have been synchronized elsewhere. Cloud storage protects the data stored in cloud storage, but it does not automatically protect every device where work is created. This is one reason endpoint backup remains an important part of many modern data protection strategies. The risks are different, and each solution is designed to address a different recovery scenario.
Why many organizations use both computer backup and cloud storage
One of the most persistent myths in data protection is that a single tool should solve every challenge. In practice, resilient environments are typically built in layers, with different solutions addressing different risks and recovery scenarios. Employee laptops may be protected with Computer Backup, while a NAS backs up to B2 Cloud Storage. Completed projects may be archived in the cloud while active work remains protected on local devices. Together, these layers create a more comprehensive approach to protecting data throughout its lifecycle.
Example: Creative teams
For creative teams, active projects often live on editing workstations and attached storage where they are constantly being updated. Computer Backup helps protect that work in progress, while completed projects can be moved to B2 Cloud Storage for long-term retention, future revisions, or client requests. This approach allows teams to safeguard current work without keeping every finished project on production systems.
Example: Growing businesses
As businesses grow, their data often becomes distributed across employee devices, shared storage, and business applications. Computer Backup can help protect employee endpoints where work is created, while B2 Cloud Storage provides a centralized location for shared assets, backups, and archives. Together, they support both day-to-day operations and longer-term data retention needs.
Example: IT and infrastructure teams
IT teams frequently manage a mix of endpoints, servers, NAS devices, and other business systems. In these environments, B2 Cloud Storage often serves as a destination for infrastructure backups, while Computer Backup protects employee devices that may not be covered by server or storage backup workflows. Rather than competing with one another, the two solutions often work together as part of a broader data protection strategy.
A quick comparison
Question
Computer Backup
B2 Cloud Storage
Is the primary goal protecting a computer?
Yes
No
Is it designed to protect endpoint data automatically?
Yes
No
Is the data primarily tied to a specific device?
Yes
Not necessarily
Is it designed for shared access across users, systems, or applications?
No
Yes
Is API access a core feature?
No
Yes
Can it serve as a destination for third-party backup tools?
No
Yes
Is the primary goal storing and managing cloud-resident data?
No
Yes
Choosing the right solution
The decision ultimately comes down to what you’re trying to protect and how your data is used.
If your primary concern is recovering files from a lost, stolen, damaged, or compromised computer, Computer Backup is likely the right starting point.
If you need scalable cloud storage for archives, applications, infrastructure backups, or shared datasets, B2 Cloud Storage is likely the better fit.
And if your environment includes both endpoints and cloud-resident data—as many organizations do—you may benefit from using both.
The most effective data protection strategies rarely rely on a single layer. They account for where data is created, where it lives, and how it needs to be recovered.
Understanding those requirements is often the first step toward choosing the right solution.
Extensive news coverage and analyst reports on AI missing productivity and ROI targets mean that AI failure is something of a hot topic. There’s no arguing that some AI initiatives are misguided, including replacing entire specialist teams with AI. For others, the issue actually lies with data knowledge and readiness–Gartner predicts that through 2026, organizations will abandon 60% of AI projects unsupported by AI-ready data, and S&P Global recently highlighted the importance of ingesting previously overlooked or unknown data to discover interdependencies in risk management.
The pressure to move at the perceived speed of AI makes it easy to skip or rush important prep work. Now that major AI pilots have been up and running, supplementing or sometimes entirely replacing select business functions with mixed results, this exposes an already known problem among AI experts: implementing AI too quickly and ignoring the importance of keeping human experts in the loop increases your threshold for error. This is especially prevalent for both internal AI tools that are meant to augment key roles, and customer-facing AI applications that are supposed to increase accessibility to an outcome, such as generating a lifelike video based on natural language prompts.
What’s causing this? It’s not just the LLMs–it’s the data. Now that human experts are more aware of what AI can get wrong, we’re going back to basics to help you get it right. This starts at the very beginning: curating, ingesting, and storing data using infrastructure that’s actually designed for moving data quickly, and without financial penalty.
Data ingest is the process of any type of data being added to a designated collection destination, whether that’s a specific file folder, database, or object storage bucket. For a lot of applications, data ingest is frequent or nearly constant–busy e-commerce sites with a constant flow of customer transactions and feedback, live video feeds, and combining real-time data sources like pairing security footage with physical building security sensors. This is called streaming ingestion–and streaming ingestion being the foundation of data collection for various types of AI is one of the key reasons why storage is an AI infrastructure problem that often flies under the radar until there’s a serious problem.
Streaming ingestion requires constant low-latency access to the data storage repository to prevent data upload lags and errors.
Streaming ingestion for video and other large files requires high rate limits and high-throughput networking capabilities to optimize upload times, especially when an application requires a file to be ready for processing in seconds/minutes instead of hours/days.
Running out of storage capacity is not an option for model performance, and for compliance and auditing purposes–streaming ingestion requires constant access to storage that is as close to infinite as possible.
Automation from the start
In addition to the files themselves, setting up a highly effective AI data pipeline involves building automation from the very beginning to immediately allocate files to the right bucket using taxonomy and collect and store file metadata to begin data aggregation critical for future labeling and processing.
Why taxonomy is critical for AI
The file itself is the data source. Navigating your dataset starts with implementing a taxonomy that makes your dataset highly searchable as your data grows from a few thousand for your first round of training to millions for an AI application operating in production.
Taxonomy is essentially your file storage structure, or how files are automatically “nested” and relationships between files are built immediately upon ingest. When you’re just getting started, developing your taxonomy helps you stay organized and ready to go searching for a specific file when your coworker doesn’t believe what the data is saying. When you’re working in established teams, implementing a new taxonomy or showing that you understand the importance of following an established taxonomy builds a contract of understanding between you and your data engineering or ML teams. (AKA, changing taxonomy mid-project is a big undertaking with ripple effects, and should not be taken lightly.)
A simple example taxonomy for ingesting raw files can look like this:
/<source>/<modality>/<status>/<date>/filename
Taxonomy should also reflect what the data is actually doing or will do, not just the file type and data source. The goal is to make every object self-describing at write time, so downstream training pipelines can filter, version, and partition without touching the data itself.
Partition by date/time at the prefix level so you can use time-range queries and lifecycle rules without scanning everything
Include modality (video, audio, image, text) as a top-level segment so cross-modal datasets stay logically separated but co-located in the same bucket
Use a UUID or content hash as the filename — never rely on source filenames, which are inconsistent and collision-prone at scale
Use B2 bucket policies or object tagging rules to reject objects written to non-conforming prefixes
Maintain a human-readable taxonomy manifest (taxonomy.json at bucket root) that documents each top-level prefix and its schema
For video specifically, consider a separate prefix segment for resolution or codec: …/video/4k/h264/… — this pays off quickly when training jobs need to filter by input spec
Retain all the metadata
Write metadata as object tags and custom headers at ingest using per-object user-defined metadata at PUT, such as:
This way, the metadata travels with the object and is always returned on HEAD requests without a separate lookup.
But to build out a rich dataset, you will need even more metadata in the form of sidecar metadata files. Retain annotations, bounding boxes, ground-truth labels, licensing info, and consent flag metadata by creating a sidecar JSON with a .meta.json suffix. For the warehouse camera video example listed above, you would end up with two files that look like this:
Enable object versioning on training buckets. If a labeling pipeline updates an annotation, it should write a new version (or a new sidecar) rather than overwriting — training reproducibility depends on knowing which metadata was present at the time a dataset was compiled.
Expose metadata to training pipelines via a manifest
Rather than having training jobs scan bucket prefixes directly, generate a manifest file (JSONL or Parquet) at the end of each ingest batch that enumerates every object key + its full metadata. Tools like PyTorch’s WebDataset and HuggingFace datasets can load directly from these manifests, and it decouples the training job from needing object storage credentials for discovery.
Deciding on storage while evaluating data
To summarize, this is why choosing your storage destination based on your current (or, if you’re already undergoing a data management transformation, future-state) scenario is critical:
Ingest type: Does your storage provide enough network bandwidth to capture the correct type of data in real time (especially for video?)
Data type: Will large files potentially incur large upfront costs with upload fees?
Data processing workflow: Does your storage have capacity headroom for file multiplication during processing, and does the cost structure allow this to happen without potentially draining infrastructure budgets?
Even with Backblaze B2’s hot storage at cold storage pricing, it may be beneficial for you to tier your storage based on your ingestion type, and how frequently the data will be accessed for training.
Batch ingestion is better suited for mid to lower performance storage, as this is typically used for historical datasets or a set schedule of pre-determined data updates, such as jobs pulling from relational databases or CSV uploads once a day or once per week.
Streaming ingestion is well-suited for hot storage to support a continuous stream of real-time (or near-real-time) data processing, such as from social media feeds and high-volume e-commerce AI helper agents.
Hybrid ingestion uses a combination of batch and streaming ingestion to handle both historical and real-time data requirements for AI models.
Surprise retrieval penalties for model training can happen even while building out your MVP or proof of concept–so avoid a storage headache and start building your pipeline at data ingest with Backblaze B2 $6.95 per TB/month. Create an account to get started with 10GB for free, or contact our storage experts for assistance with migrations and more.
Looking for more info on data ingest? Watch the on-demand webinar that dives into more details about data ingest with Backblaze’s Director of Applied AI Jeronimo De Leon.
Welcome to the Q2 2026 Network Stats report. While we’ve been tracking trends since December 2023, this is the third quarter since we operationalized the dataset and re-launched the series, allowing ourselves to make direct, quarter-over-quarter comparisons. Why? Because AI workloads were changing traffic patterns across Backblaze’s network, and reshaping the internet.
With three quarters of historical data now available, we’re moving beyond measuring traffic volumes. We’ve been able to spot trends and start drawing conclusions—how predictable or unpredictable those workloads really are, and what that means for infrastructure that supports the next generation of AI applications.
Check out past Network Stats reports
If you’re interested in some of the trends we’ve spotted in previous reports, you can review the past reports here: Q1 2026 Q4 2025 Q3 2025
Previous analysis has been based on the amount of network traffic in bits flowing across in or out of our network, the number of bits and participants per TCP session (our coined “magnitude” metric), and regional geographic trends. In this report, you’ll find charts and heatmaps for the metrics that we’ve been reporting on over the past year, but we’re also going to use statistical analysis to answer a practical question: What kinds of traffic patterns do AI workloads create, and how should infrastructure evolve to support them?
Traffic from neocloud and hyperscaler networks are proving to be very dynamic in nature, and that’s what we’re going to explore in this quarterly report: variance.
Join the webinar
Want to hear more? Join Brent Nowak, Manager, Network Engineering, and Stephanie Doyle, Sr. Manager, Market Intelligence and Keeper of Stats, live on Tuesday, July 28, 2026 at 11:30 a.m. PT / 2:30 p.m. ET to walk through the data and spot the latest trends.
Can’t make it live? Register anyway and we’ll send you the recording.
Why look at variance?
Variance is a deep topic to explore, which involves modeling our traffic patterns against a known baseline. To analyze variance, we built a new time-series dataset using 10-minute traffic samples and modeled traffic behavior against statistical baselines. This lets us distinguish stable, predictable traffic from highly volatile workloads that demand different infrastructure planning.
I refreshed my statistics knowledge, created a new database to hold a timeseries dataset, and spent a few nights experimenting with the SciPy Python library in order to not only produce pretty graphs, but to generate a signal for us to interpret.
The types of questions that we’re interested in answering from the variance signals that affect our business include:
How quickly are AI workloads changing capacity requirements?
Which traffic patterns require different network architecture? And does our current architecture support what we’re growth modeling into the future?
Which signals represent lasting trends versus temporary spikes?
These are big questions! And exciting ones as Backblaze looks to support today and tomorrow’s workflows.
With that, let’s refresh our existing charts with this quarter’s data before diving into the new analysis on variance.
Summer heat-up
The stacked area graph below shows total traffic by network type over time updated with the most current data.
Total traffic by network type.
CDN traffic: New baseline of activity with a 66% increase from last year.
Hosting traffic: The hosting category (the light orange layer right above CDN) has remained incredibly rigid. Unlike neocloud or hyperscalers, which expand and contract elastically, hosting traffic has maintained a nearly identical bandwidth footprint for over a year.
Hyperscaler traffic: Hyperscaler traffic also followed the neocloud pattern, with the lowest amount of activity in January and remaining steady into June. Internal data sources show new workloads across all of the major hyperscalers in the past quarter.
Neocloud traffic: After a low point of activity in January, activity increased rapidly into March and has remained high until June. Internal telemetry shows that not only the amount of neocloud traffic increased in Q1 into Q2, but the number of neoclouds that we are interacting with has increased.
ISP-regional traffic: This was the dominant driver of the massive traffic spike in October 2025. While it dropped significantly into January 2026, it has aggressively rebounded through Q2 2026 and is currently the largest single driver of volume alongside neocloud.
Migration traffic: This traffic includes one way migrations into our environment, primarily serviced by partners such as Flexify.IO. We have migrations running all the time, but we can visually see large amounts around November 2025 and March of 2026.
Over the entire one-year graph range, Backblaze’s total platform traffic experienced volatility, peaking in October 2025 before seeing a multi-tier contraction down to a January 2026 winter baseline. Following this, in both Q1 and Q2 of 2026 we’ve observed an increase of activity led by a rebound in ISP-regional and AI-focused neocloud traffic. An additional standout is CDN traffic, which achieved a permanent and substantial new activity baseline, growing roughly 66% year-over-year.
Heatmaps: How and where data moves
To better understand our network activity, we isolated variables like region and types of provider. Here are the standard definitions we use each report:
Total traffic volume: Where did we send and receive the most traffic?
Magnitude: Where were the data transfers with the most bits per unique IP address?
Uniqueness: What does the number of distinct IP addresses look like?
Quick terminology refresher
Regions US-West: Our largest and longest-running region US-East: Region with the most observed proximity to neocloud infrastructure CA-East: Our newest region in Canada. EU-Central: Our EU region.
Network Types CDN: Networks that use Backblaze as an origin store for content delivery. Hosting: Traditional hosting providers that runs workloads like physical or virtual servers for web, database, or application tasks. Hyperscaler: Large, traditional cloud providers. ISP-regional: Local or regional ISPs; think of these as the “last mile” paths as these networks are very close to customer equipment and efficient. ISP Tier1: National or international ISPs that carry our traffic long distances. Neocloud: AI-focused compute networks.
Heatmap #1: Where did we send and receive the most traffic?
ISP-regional traffic is a hotspot for US-West, as expected. This region has the largest internet exchange (IX) and server footprint behind it. Neocloud traffic remains concentrated in the US-East, but for this quarter traffic increased in the US-West and EU-Central regions. Another standout this quarter is more hyperscaler activity in EU-Central than the previous quarter.
Total number of bits transferred across our regions to each network type for Q2 2026.
Heatmap #2: Where were the data transfers with the most magnitude (bits per IP address)?
Another metric we record is bits per IP or what we term “magnitude.” This combination of the amount of traffic transferred with how many actors are involved per network is a good proxy to measure how heavy or impactful individual data flows are. In short:
High volume, many IPs: Easier to distribute and load-balance across infrastructure. And many source and destination pairs means that we can traffic engineer at the WAN layer, sending some traffic over one provider and some over another.
High volume, few IPs: More difficult, but more interesting, from a NetEng perspective.
Traffic magnitude is currently a driver of decisions for capacity and growth plans. Our US-East region continues to have a high concentration of high bandwidth transfers between a small number of hosts. New for this quarter is an uptick in traffic magnitude in our EU-Central region.
This could be an indication of more geographic spread of AI related workflows as for every quarter that we’ve reported on the metric value, we have seen more diversity into US-West and EU-Central outside of the concentration in US-East. We will continue to watch this trend.
Magnitude transferred across our regions to each network type for Q2 2026.
Heatmap #3: How many unique addresses do we interact with?
Not every graph or heatmap has to show something dramatic. Sometimes it’s good to see exactly what you expect quarter over quarter in a data series. This is especially true for our uniqueness metric, measuring the number of distinct IP addresses per network time.
We interact with the most number of parties out of our US-West region. It’s the most mature and serves a large amount of ISP-regional consumers, so the consistency of the uniqueness metric is a good sanity check on our dataset.
US-West shows the highest overall uniqueness, driven by its larger number of data centers and mix of workloads.
Neocloud traffic, by contrast, tends to involve fewer, more persistent endpoints, consistent with AI pipelines that rely on stable, long-standing connections between storage and compute.
Communication uniqueness across our regions to each network type for Q2 2026.
Neocloud and hyperscaler traffic vs predictive patterns
This next set of charts shows a deeper dive into the metrics associated with neocloud and hyperscalers over time. The contrast between a more “traditional” workload (e.g., CDN, hosting, and ISP regional traffic) and emerging trends with neoclouds and hyperscalers is the easiest place to see the shift in network traffic profiles. The latter represents bursty, high magnitude traffic that reshapes conversations around network planning.
Chart #1: What’s the magnitude of neocloud and hyperscaler traffic over time?
Hyperscaler and neocloud network magnitude May 2025 – May 2026.
Following a highly concentrated, low-magnitude baseline for both categories in January and February 2026, Q1 closed with a dramatic March surge where several individual neocloud networks spiked massively.
Moving into Q2 2026 (April through June), while the absolute highest neocloud peaks compressed slightly downward compared to that March anomaly, the overall volume of high-magnitude neocloud workflows multiplied significantly, resulting in a much denser cluster of active endpoints staying consistently high quarter-over-quarter.
Hyperscaler endpoints experienced a steady and noticeable upward move over the course of Q2, with multiple data points breaking out of their typical floor by May and June.
Ultimately, neocloud retained its dominant, high-magnitude presence across both Q1 and Q2 quarters, while hyperscalers saw a distinct and steady escalation in individual workload sizes.
Heatmap #1 and #2: How dynamic are neocloud and hyperscaler traffic patterns?
Neocloud related traffic continues to show strong concentrations in our US-East region with recent growth March into June. Hyperscaler traffic is the most variable when we compare it to last quarter’s heatmap. There is a new, more distributed concentration across all our three largest regions—US-East, US-West, and EU-Central.
Together with the trends we’ve reported over the past year, these results suggest AI workloads on the Backblaze network are becoming geographically more distributed rather than remaining concentrated in a single region. Note the caveat: it’s possible, even probable, that there’s a macro trend about geographical dispersion of AI data, but it’s important also that Backblaze has become increasingly known as a trusted infrastructure provider specifically in this space.
Layer on the fact that AI workloads can be reflective of fewer players with more data (see also: magnitude or elephant workflows), and what you have is difficulty understanding whether this is a macro trend, or Backblaze specific. We’ll keep our eyes on the data as it develops.
Neocloud monthly traffic totals by region for May 2025–June 2026.
Hyperscaler monthly traffic totals by region for May 2025–June 2026.
Heatmap #3, #4, and #5: How dynamic are CDN, hosting, and ISP-regional traffic patterns?
We’re grouping CDN, hosting, and ISP regional types together because they represent a “steady-state” for us as network operators. These patterns are predictable, spread out over time, and generally do not change month-to-month.
For Q2, we saw the concentration of CDN in US-West remain steady with traffic growth in our US-East region. Hosting traffic is showing a new pattern, with more activity in our EU-Central region starting in April into June.
CDN monthly traffic totals by region from May 2025–June 2026.
Hosting monthly traffic totals by region for March 2025–June 2026.
ISP-regional monthly traffic totals by region for March 2025–June 2026.
Variance study methodology
For our new variance study we needed more granular traffic sampling data than aggregated weekly or monthly totals. Ten minute sample data gave us a balance between sampling fidelity, data warehousing storage, and query time when iterating on the project idea.
Here’s a sample of anonymized data in one region, for one hour, for one ASN (network), with ingress and egress 95th bitrate percentage values:
Anonymized Timeseries Sample Example
datetime
region
asn
ingress
egress
2026-05-01T00:00:00
us-east
asn-number
4408643576.86
72810025561.08
2026-05-01T00:10:00
us-east
asn-number
4202884722.26
72153643081.09
2026-05-01T00:20:00
us-east
asn-number
4282470297.97
72840197796.70
2026-05-01T00:30:00
us-east
asn-number
4462602109.34
74194149854.89
2026-05-01T00:40:00
us-east
asn-number
4011477298.04
73431072317.13
2026-05-01T00:50:00
us-east
asn-number
3919542094.52
71051545108.21
Understanding the use of variance
Raw traffic metrics (total gigabits per second) tell us how much data is moving. Variance tells us how consistently it moves.
Stable traffic is easier to plan for. Highly variable traffic requires more flexible network design and additional capacity planning—it reflects the bursty nature of AI training and inference workflows, where compute clusters can scale rapidly and move enormous datasets over short periods.
Here’s how to read the analysis:
The shape of the bell curves (right column): A very tall, narrow peak indicates low variance. This means the traffic behaves predictably and stays clustered close to its baseline average. A short, wide, flattened curve indicates high variance, meaning the traffic is highly volatile, subject to massive sudden swings, and much harder to provision for.
The interplay of ingress vs. egress (left column): By overlaying both metrics, we can immediately spot structural imbalances. For instance, if one direction has a sharp spike (low variance) while the other is flat and wide (high variance), it signals that asymmetric network events are dominating that infrastructure type.
Below is a sampling of network data in one point in our network over the month of May 2026, with the traffic pattern graphed on the left side and variance on the right side. Immediately we can see different groupings of patterns. For readability and grouping, we’ve separated the types of networks into two categories: the dramatic and the reliable.
Bringing the drama: Hyperscaler and neoclouds
AI infrastructure behaves differently than traditional internet infrastructure. The following comparisons illustrate why.
Hyperscaler and neocloud traffic and distribution variability.
So, what can we learn from this? Let’s examine it by network type.
Hyperscaler: High egress volatility with balanced ingress
Ingress traffic remains tightly controlled around the baseline (sharp dashed peak). However, egress traffic (solid line) shows a flattened, high-variance spread.
The time-series chart reveals constant, jagged fluctuations between 50 Gbps and 150 Gbps, indicating highly bursty customer data retrieval patterns throughout the month.
Neocloud: Synchronized, moderate volatility
Both ingress and egress display structurally similar, moderately wide bell curves. This reflects a well-proportioned network footprint where data-in and data-out scale together.
The time series demonstrates sustained high baseline volumes (Total traffic consistently tracking between 200 Gbps and 350 Gbps) with continuous business-hour cyclical wave patterns.
As network operators we’re using this type of real-world data to help drive our connectivity footprint decisions. Large, bursty traffic patterns are best served by PNI network connections. PNIs allow us to isolate workflows to a distinct physical egress/ingress path in our network, which enables us to be able to more easily route, load-balance, and support these higher performance profiles. That translates into more predictable performance for customers running bandwidth-intensive AI workloads.
We have a high interest in connectivity to partners in our US-East location, as it is located in the Ashburn-Reston datacenter corridor near a lot of existing datacenter campuses. This one again reinforces the notion that geography plays an important role in where entities are placing their data and compute engines rather than the nondescript “cloud”.
If you’re interested in learning more about the geography of neocloud traffic, visit the Q1 2026 report and review the “Where in the world is the neocloud?” section.
Let’s switch over to our three other major network types that we also want to profile for capacity, performance, and scalability considerations.
Bringing the predictability: CDN, hosting, and ISPs
CDN, Hosting, and ISP-Regional traffic and distribution variability.
CDN: Extreme ingress stability vs. massive egress spread
The ingress curve is a razor-thin needle at 0 Gbps variance, proving inbound management traffic is perfectly flat. Conversely, the egress curve is completely flattened across the entire -50 to +50 Gbps spectrum.
This is textbook CDN behavior: steady, quiet ingest lines paired with massive, erratic client-side distribution demands peaking near 600Gbps.
Hosting: Highly predictable footprint with asymmetric egress stability
Inbound traffic displays a slightly wider variance profile, while outbound traffic (egress) forms a remarkably sharp, low-variance peak.
The time series shows a tight, rhythmic diurnal cycle for egress down near 25Gbps, while ingress experiences a steady climb over the course of May, rising from a 75Gbps baseline up past 125Gbps.
Regional consumer traffic demonstrates an ultra-low variance spike on egress, maintaining a very steady floor near 75Gbps. Ingress traffic carries slightly higher variance but remains highly constrained to predictable diurnal rhythms.
This represents localized residential/commercial end-user ingress cycles, peaking consistently between 400 and 500 Gbps every single day.
Signals in the noise
This far into Network Stats, the biggest takeaway isn’t simply that there is more traffic because of AI. It’s that AI traffic has different—and still emerging—patterns compared with traditional cloud workloads. It’s more bursty, more geographically concentrated, and less predictable. Understanding those patterns helps us decide where to add capacity, when to upgrade interconnects, and how to design a network that can support tomorrow’s AI applications—not just today’s.
As our dataset continues to grow, we’ll keep refining these models and sharing what we learn. Each quarter gives us a clearer picture of how AI infrastructure is evolving, and how cloud storage networks must evolve alongside it. Let us know what resonates, what questions you have, and what patterns you’re seeing in the comments section.
And, if you want to stay connected to this and other kinds of technical reporting from Backblaze, check out our Developer Newsletter.
You’ve done the storage evaluation. The per-terabyte price is right. The durability numbers check out. Compliance boxes are ticked. And still, the cloud migration project hasn’t been approved.
That’s not a coincidence.
The cloud storage industry has spent years competing on what happens after you’re already locked in: performance, redundancy, features. Almost nobody competes on what it costs to get there—or what it costs to leave.
Migration friction isn’t an oversight. For most hyperscalers, it’s a business model.
Why cloud migration projects stall before they start
The business case for cloud storage usually looks solid on paper. Lower per-terabyte costs. Less hardware to maintain. A path off aging tape libraries and overloaded NAS environments.
Then someone runs the actual migration math.
Egress fees from the current provider. Data transfer charges. Migration software licenses. Professional services. Tape digitization. Internal engineering hours. Project coordination overhead. For a large dataset, those costs can erase years of projected storage savings before a single byte moves.
Teams spend months building an approval-ready business case, only to find the upfront migration cost makes the model unworkable. The project stalls. Infrastructure the organization already knows is unsustainable stays in place. Modernization gets pushed to next quarter.
This is where most cloud vendors win. The storage decision becomes moot if the organization can never afford to move.
How egress fees trap organizations with their current provider
By the time most IT teams discover what cloud egress fees actually cost, they’re already mid-negotiation with a new provider.
The pricing model is deliberately asymmetric: getting data in is cheap, often free. Moving it out is where providers charge—and for multi-petabyte environments, those charges can run to hundreds of thousands of dollars before a migration has even started. Technically, the organization owns its data. Financially, moving it is a different question.
This reframes the evaluation in a way that favors incumbents. The question stops being which platform best fits long-term needs and becomes whether the organization can afford to leave at all. Once you’re in a major cloud platform with a large archive, exit costs are a structural retention mechanism.
Ask any prospective provider, early: what does it cost to leave? If they’re vague, that’s the answer.
How long does a cloud data migration actually take?
Cost gets scrutinized. Time usually doesn’t—until a migration is already underway and slipping.
A large-scale migration means inventorying data and metadata, evaluating and procuring tooling, coordinating across vendors, monitoring transfer jobs, validating integrity at the destination, and troubleshooting the inevitable edge cases. For multi-petabyte environments, self-managed projects routinely stretch from months into years.
Every quarter that drags on is a quarter the organization is paying to maintain infrastructure it’s already committed to replacing, while its engineering team runs a file-moving operation instead of working on anything strategic. The total cost of a slow migration almost always exceeds the initial estimate—and almost nobody builds that into the business case upfront.
What actually goes wrong during cloud data migration
Migration risk tends to be underestimated until something breaks.
The core questions—will files transfer without corruption, will metadata survive intact, will dependent applications keep working—are harder to answer than they look for LTO tape archives that haven’t been accessed in years, NAS and SAN environments with proprietary metadata structures, media archives with irreplaceable assets, regulated content with chain-of-custody requirements, and datasets large enough that verification at scale is its own engineering problem.
The cost of getting this wrong isn’t just the migration itself. Data loss, integrity gaps, or application failures discovered post-migration can be significantly more expensive than any egress fee. Validation and verification need to be designed into the plan before transfers start, not bolted on after something fails.
Why most cloud providers leave migration to you
Infrastructure teams evaluating cloud storage aren’t looking for a transfer tool. They want infrastructure modernized without burning their engineering team on a multi-year internal project. Predictable costs. A path to cloud that doesn’t require standing up a program management office just to move data.
The standard provider response is documentation and an onboarding checklist. After that, you’re largely on your own.
This isn’t an accident. Selling storage is straightforward. Owning migration means taking on cost, risk, and operational complexity that most providers would rather leave with the customer. The economics of the business favor making entry easy and exit expensive, with as little friction to growth as possible in between.
Providers that treat migration as their problem to solve are a different category. They’re betting that making it genuinely easier to get to their platform is worth more than one-time migration revenue—because a customer who gets there successfully tends to stay.
How Backblaze Universal Data Migration works
We built Universal Data Migration because we kept seeing the same thing: organizations that had already decided to move to Backblaze B2 getting stuck on the migration itself. The technology decision was made. The budget was approved. The project just couldn’t get started.
The program moves data from virtually any source—AWS S3, Microsoft Azure Blob, Google Cloud Storage, Wasabi, NAS and SAN, file servers, LTO tape across all generations, physical hard drives, legacy archives—with Backblaze managing the process rather than handing the customer a tool and a runbook.
The migration cost doesn’t have to be a reason the project stalls. That’s the point.
Before you sign a cloud storage contract, ask these two questions
The storage evaluation isn’t complete until you know what it costs to get there and what it costs to leave.
Most providers make the second number hard to find. If you have to dig for egress pricing, or if a sales rep answers the exit question with “we’d work with you on that,” build the worst-case number into your model before signing anything.
The right provider won’t make you ask. They’ll make migration part of the conversation from the start—because they’re confident enough in their platform to compete on the full picture, not just the monthly storage line.
Have a migration project that keeps getting pushed?Talk to our team about what it would actually take to move your environment to B2.
On April 7, 2026, Anthropic announced a model so capable they refused to release it publicly. Claude Mythos, their most advanced frontier AI, was deemed too dangerous for open access because of one thing: it can hack.
Anthropic locked Claude Mythos behind Project Glasswing, a vetted partner program initially restricted to roughly 50 organizations—AWS, Microsoft, Google, Apple, Cisco, CrowdStrike, and others—to use the model for defensive work before adversaries could develop equivalent capability. By June, that program had expanded to more than 200 organizations across 15 countries, including operators of power grids, water systems, hospitals, and telecommunications infrastructure.
Then, on June 9, Anthropic released Fable 5—the first public version of a Mythos-class model—equipped with safeguards that reroute higher-risk queries to less-capable models. The same day, it released Claude Mythos 5 directly to vetted Glasswing partners. Later in June, after a brief US government export review, the Commerce Department confirmed that “appropriate safeguards are in place” and permitted Anthropic to redeploy Mythos 5 to trusted cyber defenders.
But here’s the part that should be on every IT leader’s radar: Anthropic itself now projects that other AI companies will have Mythos-class models within six to 12 months, and those companies may not ship with equivalent safeguards.
GPT-5.5, released three weeks later, didn’t wait. OpenAI shipped it with expanded cybersecurity capabilities and its own controlled-access program—also designed for defense, also eventually available to people with different intentions.
The AI arms race in cybersecurity isn’t coming. It’s here.
Ransomware 5.0 Doesn’t Need a Skilled Operator
For most of its history, ransomware required a human being at the keyboard: someone doing reconnaissance, identifying targets, crafting phishing lures, moving laterally through a network. Skilled attackers commanded significant ransoms. Amateur operators made rookie mistakes.
That dynamic is collapsing.
Ransomware now appears in 48% of all breach chains, according to the Verizon 2026 Data Breach Investigations Report—up from 44% the year prior. Active ransomware groups jumped 49% year over year. Over 250 new operators entered the market in just the last six months, many of them low-skill actors using generative AI to craft personalized phishing campaigns 60% faster than was possible before. AI-assisted lateral movement was present in over 65% of recent cases.
The Verizon 2026 DBIR also marks a shift in how attackers get in the door: for the first time, exploiting unpatched software vulnerabilities has overtaken stolen credentials as the number one initial access vector, now responsible for 31% of breaches. That’s not a coincidence in a world where AI can scan codebases for exploitable flaws at machine speed.
IBM’s 2026 X-Force Threat Index confirmed that “collapsing barriers to entry” are letting even low-volume operators run campaigns that overwhelm defenders. The average cost of a data breach in the US hit $10.22 million—an all-time record.
Trend Micro’s 2026 security predictions describe what they call “Ransomware 5.0”: a model where AI handles reconnaissance, vulnerability scanning, lateral movement, and even ransom negotiation autonomously, without a human operator directing any of it.
If you’re still designing your security posture around slowing down a skilled human attacker, you’re fighting the last war.
The Thing Nobody Wants to Say Out Loud
Here’s where I’m going to say something a little uncomfortable: the cybersecurity industry has been selling you detection for years when what you actually needed was recovery.
Detection is important. Don’t get me wrong. But detection-centric security assumes you catch the attack before it fully executes. In an era where AI compresses the attack timeline, exploit chains run at machine speed, and hundreds of new ransomware groups just showed up with AI-powered toolkits, detection alone isn’t a resilience strategy. It’s a bet.
The UK Government’s AI Security Institute tested Claude Mythos extensively and confirmed it cannot reliably execute attacks against organizations with well-hardened defenses. That’s genuinely good news. But it raises an obvious follow-up question: how many organizations actually have well-hardened defenses? A 2025 report found that over 45% of discovered security vulnerabilities in large organizations go unpatched after 12 months. Many critical infrastructure operators still run end-of-life software.
The honest answer is: most organizations are not that hardened. And even the ones that are will face a more capable threat next year than they face today.
This is why immutable backups aren’t just a box to check; they’re the safeguard that functions even when everything else fails. If an attacker encrypts your production environment before detection fires, the question isn’t “how did that happen?” It’s “how fast can you recover?”
What Claude Mythos Actually Changes (And What It Doesn’t)
It’s worth separating signal from noise here, because the coverage of Claude Mythos has ranged from measured to apocalyptic.
What Mythos changes: the technical barrier for sophisticated attacks. Vulnerabilities that previously required elite researchers to discover and weaponize can now be found and chained faster. Anthropic’s own red team found that Mythos could identify and exploit a previously unknown FreeBSD remote code execution vulnerability—fully autonomously, no human involved after the initial prompt. Across all Project Glasswing partners, Mythos has now surfaced more than 10,000 high- or critical-severity security flaws in production codebases. That means the window between vulnerability disclosure and active exploitation, already dangerously short, gets shorter. It also means less-skilled threat actors get access to capabilities that used to require significant expertise.
What Mythos doesn’t change: the fundamental anatomy of a ransomware attack. Attackers still need initial access. The Verizon 2026 DBIR confirms they’re still relying on unpatched software, stolen credentials, and phishing as entry points just finding and exploiting them faster. Once inside, they still need to move laterally, identify high-value data, and execute the encryption sequence. The Centre for Emerging Technology and Security at the Alan Turing Institute made this point clearly: more sophisticated ransomware attacks that rely on stolen credentials, social engineering, or already-compromised accounts are “far less likely to be affected” by Mythos-class models on either side.
That matters for how you defend. Hardening access controls, enforcing MFA, patching aggressively, segmenting your environment, and maintaining clean, immutable backups are not glamorous. They are not AI-powered. But they address the attack anatomy that AI tools, offensive or defensive, haven’t fundamentally changed.
The Recovery Imperative
Strengthening cyber fundamentals, in practice, means one thing above all else: knowing that when something gets through, you can recover without paying a ransom.
Immutability. Backups that can’t be encrypted or deleted by ransomware, even by a compromised admin credential. This isn’t optional anymore. If your backups live in the same environment as your production data and share the same access credentials, they aren’t backups; they’re part of your blast radius. Backblaze B2 Object Lock is S3-compatible, so if your team is already running Veeam, Commvault, MSP360, or Nutanix, you’re not replacing your backup stack. You’re giving it an immutable target that ransomware can’t touch.
Air-gap or off-site isolation. Object Lock, WORM storage, and geographically separate backup targets all put meaningful distance between your recovery point and an active attack. When AI tools can chain dozens of steps in a corporate network attack simulation autonomously, “isolated backups” means genuinely isolated, not just a separate folder. Version history matters here too: the ability to roll back to a known pre-attack state, not just the most recent snapshot, is what separates a clean recovery from discovering your restore point was already compromised.
Recovery time that matches the threat. AI-accelerated attacks mean recovery has to be fast. A backup strategy built around 72-hour RTOs made sense in a different threat environment. In 2026, breach costs approaching $10.22 million in the US, the question your leadership should be asking is: how long does it actually take us to restore from a clean state? Cold storage tiers that require hours of retrieval before a restore can even begin are a liability when the clock is running. Backblaze B2 is hot storage: your data is available immediately after detection, with no retrieval queue to wait on.
A Practical Checklist for IT Leaders Right Now
The Claude Mythos announcement, the Fable 5 public release, and GPT-5.5’s expanded cybersecurity capabilities are a forcing function. Not because Mythos-class capability is in attackers’ hands today, but because the direction of travel is confirmed, the timeline is compressed, and the question is no longer whether equivalent offensive tools will proliferate, only when.
A few things worth doing before that happens:
Audit your backup environment’s blast radius. Can ransomware that has compromised your production environment also reach your backups? If yes, fix that first.
Test your recovery time. Not just that backups exist, but how long an actual restore takes from your most recent clean snapshot. If you don’t know the number, you don’t have a recovery plan. You have a filing system. Backblaze gives you 3x your stored data in free egress each month, which removes the cost barrier that causes most teams to skip DR testing entirely. Run the restore. Know the number.
Pressure-test your identity controls. Credential abuse and phishing remain the dominant entry vectors. MFA, compromised credential monitoring, and least-privilege access aren’t new ideas, but they’re still the fastest path to closing the doors AI-powered attacks walk through.
Patch faster. The Verizon 2026 DBIR found exploited vulnerabilities are now the leading breach entry point. The median time organizations take to fix a known flaw is 55 days. AI-assisted attackers don’t wait 55 days.
Layer your defenses, but anchor to recovery. Perimeter protection, endpoint detection, vulnerability scanning: these all matter. But they’re all designed to catch something before it executes. Immutable backups are what you rely on when something executes anyway.
Revisit your RTO and RPO against today’s breach costs. The math has changed. A $10.22 million average US breach cost changes the calculus on what it’s worth spending on faster, more resilient recovery infrastructure.
The Last Thing
Anthropic made a decision that deserves credit: they looked at what Claude Mythos could do and chose not to hand it to the world on day one. Project Glasswing is a serious attempt to use the model’s capabilities on the right side of this fight, and the coordinated disclosure of thousands of vulnerabilities to the organizations responsible for patching them is meaningful defensive work.
But the history of powerful technology is not “we invented it and kept it safe.” It’s “we invented it, others reproduced it, and everyone had to adapt.” The 6-to-12-month window for equivalent capability to reach adversarial hands isn’t fearmongering; it’s Anthropic’s own forecast. Other AI companies are building toward the same capability threshold right now, and not all of them will ship with the same safeguards.
The organizations that come through this transition will be the ones that took recovery seriously before they needed it. Not because detection failed, but because recovery is the one safeguard that works regardless of what the attacker is running.
Backblaze B2 with Object Lock puts immutable, air-gapped backup storage within reach of organizations that can’t afford hyperscaler pricing (which, as it turns out, is most of them). Start a free trial or talk to our team about building a ransomware-resilient backup architecture before the threat landscape shifts again.
Every computer vision model is a reflection of the data it was trained on. The precision of the labels, the consistency across annotators, the coverage of edge cases. Get the data right and the model performs. Get it wrong and no amount of architecture or compute will compensate.
AI-assisted annotation tools have made it possible to label at a speed and scale that was unthinkable a few years ago. Teams that used to spend weeks on manual labeling now generate annotations automatically and refine them. That acceleration opens up real opportunity, but it also raises the bar for the infrastructure underneath the annotation pipeline. The architecture needs to keep pace with the volume of data now moving through it.
We have spent the last decade building AI workflows and one pattern shows up consistently: the teams that treat annotation as infrastructure from day one outperform the ones that bolt it on later. The difference is not just tooling. It is the architectural decisions underneath, particularly around storage, that determine whether an annotation operation scales or stalls.
Annotation within the ML pipeline
A production ML pipeline spans data ingestion, preprocessing, training, serving, and monitoring. Annotation sits within the data layer, but it is the stage where several consequential storage decisions converge: how raw data is stored, who can access it, how long it is retained, and how it flows between labeling, training, and evaluation. Getting storage right at this layer strengthens every stage downstream.
Data gravity. A single autonomous driving project can produce terabytes of camera and LiDAR data before a single label is applied. This data needs to live somewhere durable and accessible before, during, and after annotation. It rarely moves once it lands.
Collaboration. Labeling teams may be internal, external, or a mix. Quality reviewers need the same data access as annotators. The data layer has to support concurrent access across roles and geographies without creating bottlenecks or redundant copies.
Lifecycle persistence. Labeled datasets are reused across training runs, refined as models improve, and versioned as labeling standards evolve. Storage needs to retain raw data alongside annotations for months or years.
Regulatory constraints. In healthcare, automotive, and defense, access controls around training data are subject to compliance requirements. Encryption, scoped credentials, and auditability are non-negotiable.
The teams that design for these requirements upfront build data operations that scale cleanly across the entire pipeline.
CVAT as the annotation layer
CVAT (Computer Vision Annotation Tool) started as an internal tool at Intel in 2017, was open sourced in 2018, and spun out as CVAT.ai Corporation in 2022. Millions of users use it today, and for good reason.
Annotation breadth. CVAT covers the full range of label types: bounding boxes, polygons, polylines, keypoints, skeletons, cuboids, brush-based masks, and tags. It handles images, video, and 3D point clouds natively, so teams working across object detection, segmentation, and pose estimation stay on one platform instead of stitching separate tools together.
AI-assisted labeling. Beyond SAM 3 and YOLO, CVAT supports custom models through its AI Agents framework, which lets teams plug their own inference endpoints directly into the labeling workflow. For video, SAM 2-powered tracking propagates annotations across frames. The shift from manual annotation to review-and-correct workflows is where the real throughput gains happen.
Deployment flexibility. CVAT ships in three editions: Community (free, self-hosted), Online (managed SaaS), and Enterprise (on-premises with SSO, RBAC, and audit logging). You can start hosted and move to self-hosted as data governance needs evolve.
Pipeline integration. CVAT exposes a REST API with a Python SDK and CLI, so annotation tasks can be created, populated, and exported programmatically. For teams building CI/CD-style retraining loops, this is what makes CVAT a pipeline component rather than a standalone manual step.
Backblaze B2: The storage layer that compounds
Annotation tools get the attention, but the storage layer is where the architecture compounds over time. CVAT supports native cloud storage integration through S3-compatible buckets, and Backblaze B2 fits directly into that connector. Configure your B2 endpoint, bucket name, and application key credentials, and CVAT treats it as native cloud storage.
This architecture decouples compute from storage. CVAT handles annotation logic while B2 owns durability and access, and you can scale, migrate, or replace either independently. Because B2 is S3-compatible, other stages of the ML pipeline, from training scripts to data validation to orchestration, access the same data directly from the same bucket CVAT writes to. No intermediate exports. No dataset copies drifting out of sync.
Retention is where the storage decision pays off most. Annotation datasets have long lifecycles, and footprints accumulate fast across concurrent projects. B2’s storage economics let teams hold large datasets across the full model development lifecycle without cost becoming the limiting factor. This is especially relevant for video-heavy projects and multi-sensor datasets where raw data runs into tens of terabytes.
Access control matters too. B2 application keys can be scoped to individual buckets or file prefixes with granular permissions and optional expiration, so access boundaries stay clean across annotators, labeling services, and downstream training pipelines. The CVAT integration guide for Backblaze B2 walks through the full setup, and the CVAT cloud storage documentation covers access permissions, manifest files, and endpoint routing.
Building the pipeline that scales into what’s next
The teams building the best computer vision models are not just choosing better algorithms. They are investing in the annotation infrastructure that feeds those algorithms: the right labeling platform, the right storage architecture, and the right cost structure to sustain it all as data grows.
This becomes even more critical as the field moves toward world models. NVIDIA’s Cosmos platform has already been downloaded over two million times. World Labs launched Marble for commercial 3D world generation. DeepMind’s Genie 3 produces interactive 3D environments in real time. Yann LeCun left Meta to start AMI Labs with the explicit goal of building AI systems that understand physics, not just predict text. These systems need training data that goes far beyond today’s labeled images: synchronized multi-sensor captures, physics-aware video, dense 3D point cloud annotations. The data volumes and annotation complexity will dwarf what most teams work with today, and the infrastructure underneath will need to handle it.
The annotation pipeline you build now is the one that will carry you into that future. Both layers are worth getting right early.
Ransomware and other disruptive attacks rarely succeed because of a single catastrophic failure. More often, they succeed because a system was designed for availability and scale, but not for persistent, adaptive adversaries testing for weak points from the outside.
For infrastructure and architecture leaders, that creates a practical challenge: how do you build systems that remain performant, cost-efficient, and operable while also standing up to attackers who are probing your environment for opportunities through traffic abuse, credential attacks, vulnerability exploitation, and social engineering?
The answer is not a single tool or framework. It is an architectural mindset: assume adversaries exist, assume controls will be tested, and design systems that continue operating safely under pressure.
Security starts with architecture, not alerts
One of the most common mistakes organizations make is treating security as something layered onto infrastructure after it is built. In practice, resilience comes from decisions made much earlier:
How traffic is handled under stress.
How systems and services are segmented.
How identity and access are enforced.
How quickly vulnerabilities are surfaced and validated.
How failure is contained when something goes wrong.
This is what separates reactive security from resilient architecture. The strongest environments are not the ones with the most dashboards; they are the ones built so that no single weakness can easily cascade into a broader incident.
Designing the perimeter to buy time, not perfection
Even in a world shaped by zero trust, the perimeter still matters, especially for availability.
Large-scale traffic floods, automated scanning, and API abuse are often the opening move. These events may not be the full attack, but they can create noise, consume resources, and open the door for more targeted follow-on activity. Infrastructure teams need defenses that can:
Absorb unexpected traffic without cascading failures
Distinguish abusive patterns from legitimate use
Prevent noisy attacks from turning into operational incidents
These defenses can never provide perfect prevention; cybercriminals can attack with too much sophistication and velocity. Rather, the goal is resilience. Good perimeter design buys time, preserves service availability, and prevents external pressure from becoming internal disruption.
Modern environments change too quickly for occasional reviews to be enough.
Attackers do not work on quarterly schedules, and neither should defensive programs. A stronger model is continuous vulnerability discovery: using multiple signals to understand what is exposed, what is exploitable, and what actually matters.
That can include a mix of:
Threat intelligence on active exploitation trends
External research programs such as bug bounties
Regular penetration testing
Internal testing and automated vulnerability scanning
Each of these presents different types of risk. Together, they reduce blind spots and help teams prioritize fixes based on real-world likelihood and impact, not just severity scores on paper.
Limiting blast radius is an architectural responsibility
A useful security question is not only “How do we stop every attack?” but also “What happens if one control fails?”
That shift changes how teams think about system design. It places greater emphasis on:
Hardening critical systems
Enforcing strict access controls
Separating environments and services
Reducing unnecessary trust relationships
Containing failure before it spreads
This is where architecture has an outsized role. Detection matters, but containment matters just as much. Systems built with clear boundaries are easier to defend and easier to recover operationally when incidents happen.
Identity is part of infrastructure
Many attacks do not begin with sophisticated exploits. They begin with compromised credentials, reused passwords, phishing, or other attempts to gain access through people rather than code.
That is why identity should be treated as a core infrastructure layer, not a separate administrative concern.
Strong identity practices often include:
Long, high-entropy passwords
Multi-factor authentication
Checks for compromised credentials
Clear access policies tied to real job needs
These controls reflect a simple truth: humans are part of the system. Security controls need to be strong enough to resist abuse and usable enough to work at scale.
Security as a system, not a checklist
No single control creates resilience on its own.
What matters is how controls reinforce one another: how traffic protections support availability, how vulnerability discovery informs remediation, how segmentation reduces impact, and how identity controls protect critical paths.
For infrastructure and architecture leaders, the takeaway is straightforward: the most resilient systems are not built on assumptions of safety. They are built on the expectation that adversaries will look for openings and that defenses need to hold up under real pressure.
That is why security works best as an architectural decision, not just an operational one.
A practical Backblaze perspective
At Backblaze, this is the lens we use when thinking about protection against bad actors: not as a single feature or isolated control, but as a layered systems problem that spans network protections, vulnerability discovery, access controls, and operational resilience. The important point is not any one safeguard in isolation. It is the way those safeguards work together so that a single weakness is less likely to become a customer-impacting event.
Download the ebook on building an affordable, resilient disaster recovery strategy that matters when ransomware strikes.
Welcome to our second quarterly Network Stats report covering Q1 of 2026. Along with Drive Stats and Performance Stats, Network Stats pulls back the curtain on real-world infrastructure data, particularly how network-level analytics reflect emerging AI industry trends and usage patterns.
Get more Network Stats (and the details of the dataset)
If you are curious about what metrics we’re recording and how we classify data in this series, check out the details outlined in our Q3 2025 Network Stats and Q4 2025 Network Stats report.
One of the roles of the Network Engineering (NetEng) team at Backblaze is to monitor how traffic moves into, out of, and across our platform—not just day-to-day, but over time as customer behavior and industry dynamics evolve. Right now, few forces are reshaping networks faster than AI.
With the launch of B2 Overdrive in April 2025, we built a direct, high-performance path between our storage layers and neoclouds where processing, inference, and modeling take place. It has given us a front-row seat to the impact of AI and how network behavior is changing with it. This quarter, in addition to our regular data analysis, we’ve added some geographic heatmaps to understand where and how data is moving.
Join us live for the webinar
Join us live for the Q1 2026 Network Stats webinarMonday, May 4, 2026 at 11:30 a.m. PT / 2:30 p.m. PT. We’ll explore where AI traffic concentrates, how high-magnitude data flows behave, and what early indicators suggest about the future of AI-native infrastructure design.
Can’t make it live, or reading this article after-the-fact? Sign up anyway and catch the recording on demand.
AI: The elephant in the room
AI workflows don’t just need a place to store data, they need to be able to move it quickly, easily, and nearly constantly for short bursts. Large, multi-petabyte datasets are ingested, transformed, exported for training, pulled back for evaluation, and periodically refreshed as models evolve.
Backblaze plays a key role at both ends of that lifecycle. We serve as a durable storage layer for the initial data ingestion, and as the high-throughput source feeding model training, evaluation, and validation to whatever best neocloud is suitable at the moment. Once that model has been trained, it needs to be stored, served, and periodically retrained, where we serve as the storage medium.
From a network perspective, this represents a meaningful shift from diffuse, internet-style traffic patterns to large, high-bandwidth flows between a smaller set of endpoints typical of AI-centric infrastructure.
Trends and spring renewal
The defining theme of the quarter is “winter freeze” as we observed what looks to be a quiet period of Neocloud and hyperscaler traffic over the winter months with an uptick in March.
The stacked area graph below shows total traffic by network type over time updated with the most current data. Hosting and internet service provider (ISP) traffic stayed largely within historical norms reflecting steady-state usage patterns. Three slices stand out this quarter:
CDN traffic: Increase in CDN traffic over the winter months.
Neocloud traffic: After the October 2025 peak, we saw a decline in neocloud traffic heading into January. The winter months were a low volume period with an upward trend observed February into March 2026.
Hyperscaler traffic: Hyperscaler traffic also followed the Neocloud pattern of a low period during winter with an upward trend in March 2026.
Monthly view of all bits transferred to each network type (2025-05 to current)
With more than three quarters of data at our disposal, we can now start to see some trends over time. What do we think is happening?
This could be an indication of the human element where the business cycle has a lot of downtime in the winter months—all of our code, infrastructure, computing jobs, and new innovations involve people somewhere along the chain and we all (hopefully) tend to take more time off in the winter months.
Another hypothesis is that our numbers only show bits transferred over our network links over time. If a large dataset has been stored with us, there may not need to be an update to the large stored dataset for a number of months as code and models are refined, and then suddenly a large amount of new data makes its way over our network links. Perhaps a combination of both—human and training lifecycle?
We’ll be tracking these metrics and updating in future reports, so this high-level view of network traffic segmented by network type will be interesting to watch.
Chart overview
Now let’s take a deep dive into our data and answer these questions:
Quarter over quarter heatmaps: How and where data moves
To better understand our network activity, we isolated variables like region and types of provider. Let’s look at the following dimensions:
Total traffic volume: Where did we send and receive the most traffic?
Magnitude: Where were the data transfers with the most bits per unique IP address?
Uniqueness: What does the number of distinct IP addresses look like?
Quick terminology refresher
Regions
US-West: Our largest and longest-running region
US-East: Region with the most observed proximity to neocloud infrastructure
CA-East: Our newest region in Canada.
Network Types
CDN: Networks that use Backblaze as an origin store for content delivery
Hosting: Traditional hosting providers that runs workloads like physical or virtual servers for web, database, or application tasks
Hyperscaler: Large, traditional cloud providers
ISP Regional: Local or regional ISPs, think of these as the “last mile” paths as these networks are very close to customer equipment and efficient
ISP Tier1: National or international ISPs that carry our traffic long distances
Neocloud: AI -focused compute networks
Heatmap #1: Where did we send and receive the most traffic?
US-West ISP-Regional traffic continues to be a hotspot on the heatmap, as expected. This region has the largest footprint behind it and connections to internet exchanges (IX). This quarter, with a lull in neocloud and hyperscaler traffic over the winter period, we saw an increase in traffic to our CDN partners. The amount of traffic to CDN networks in the US-West, US-East, and EU-Central regions all increased quarter over quarter.
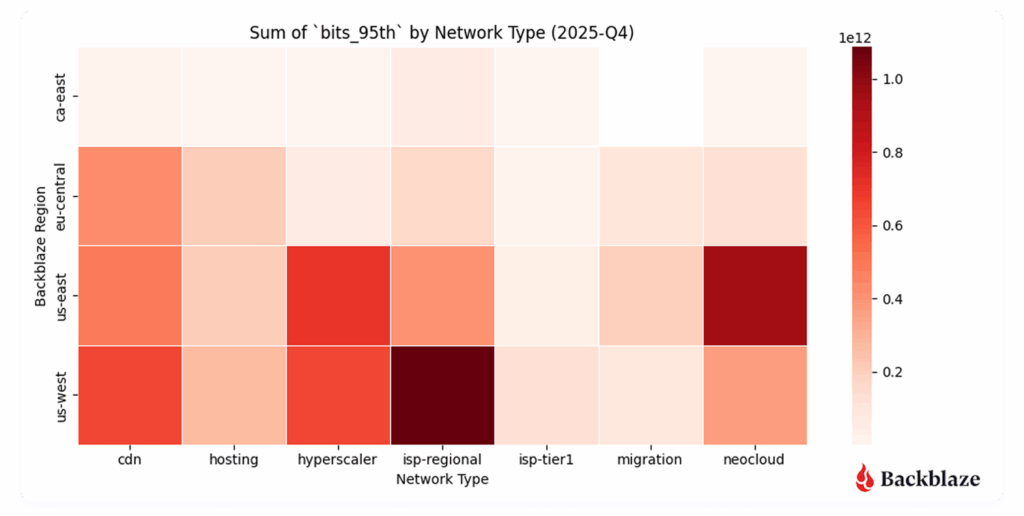
Total number of bits transferred across our regions to each network type for Q1 2026.
Total number of bits transferred across our regions to each network type in Q4 2025.
Heatmap #2: Where were the data transfers with the most magnitude (bits per IP address)?
Another metric we record is bits per IP or what we term “magnitude.” This combination of the amount of traffic transferred with how many actors are involved per network is a good proxy to measure how heavy or impactful individual data flows are. In short:
High volume, many IPs: Easier to distribute and load-balance across infrastructure. And many source and destination pairs means that we can traffic engineer at the WAN layer, sending some traffic over one provider and some over another.
High volume, few IPs: More difficult, but more interesting, from a NetEng perspective.
Despite the total amount of traffic decreasing over the winter months for neocloud traffic, the magnitude of neocloud transfers still remains high. This speaks to the nature of the traffic pattern—when a GPU/compute cluster is ingesting or producing data, it does so at a high bitrate with just a few number of unique endpoints talking to each other.
As expected, the concentration of our magnitude metric is high for our US-East cluster, with an uptick in concentration in US-West and EU-Central. Where specifically is this new concentration in these regions? Spoiler: We explore neocloud traffic later in the report with geographical data!
Magnitude transferred across our regions to each network type for Q1 2026.
Magnitude transferred across our regions to each network type for Q4 2025.
As with last quarter, we see a high concentration of neoclouds in US-East, but our new heatmap also shows a rising activity in US-West and EU-Central. We also see more distribution in other use cases.
Heatmap #3: How many unique addresses do we interact with?
Uniqueness—measured by the number of distinct IP addresses per network type—adds another dimension to the story. Unsurprisingly, the quarter over quarter heatmap looks almost identical. This is expected with our US-West region being the most mature and serving a large amount of ISP Regional consumers and is a good sanity check on our dataset.
US-West shows the highest overall uniqueness, driven by its larger number of data centers and mix of workloads.
Neocloud traffic, by contrast, tends to involve fewer, more persistent endpoints, consistent with AI pipelines that rely on stable, long-standing connections between storage and compute.
This is where we can clearly see those AI networking elephant flows showing up in the data.
Communication uniqueness across our regions to each network type for Q1 2026.
Communication uniqueness across our regions to each network type for Q4 2025.
Summary: Seasonal change in traffic flows
With a lull in bits transferred as noted in our top level graph, we can see what other networks by percentage took over. CDN traffic increased from around 20% to 32% of our total traffic, localized ISP regional traffic also increased 21.5% to 27.8%. Neocloud and hyperscaler traffic reduced from 36.4% in Q4 2025 to 25.5% in Q1 2026.
Quarter over quarter data
We’re tracking our usual metrics here, and we gave you both this quarter and last quarter’s charts so you can easily spot potential trends.
First let’s take a look at where all our traffic goes from a global perspective with an updated view of last quarter.
A Sankey diagram of all ingress and egress traffic grouped by type of network for Q1 2026.
A Sankey diagram of all ingress and egress traffic grouped by type of network for Q4 2025.
Next, let’s take a look at the geography of our network traffic. As we’ve already seen in previous heatmaps, data gravity is concentrating traffic into specific locations.
Where in the world is the neocloud?
New for March 2026, we’ve added geographic information to our dataset, allowing us to take a look at the concentration of traffic based on network types. We’re taking a look into the following locational slices:
Countries
Countries excluding the United States
U.S. states
Heatmap #1: What countries show the highest concentration of traffic by network type?
Neocloud, hyperscaler, and CDN traffic in our dataset all show high concentrations in the United States. Is this due to our US-West and US-East regions being the largest of our deployments or is it related to how certain traffic types are present in the emerging AI market? A quick search shows that the U.S. contains around 40-45% of all data centers globally, so it’s likely the sheer deployment size and scope of US sites aligns with what we’re seeing at the network level.
Total number of bits transferred by network type to countries from March 2026.
That said, excluding outliers can show us additional geographic trends, which leads to our next heatmap.
Heatmap #2: If we exclude the U.S., what countries show the highest concentration of traffic by network type?
Since the United States numbers highly skew the heatmap concentration, below is a heatmap without the US to give us better fidelity on ex-US datapoints. Interesting to note that we deliver a large amount of traffic to CDN entities in the Netherlands. This is due in part to our connectivity to AMS-IX (Amsterdam Internet Exchange).
The network posture of Europe differs from the United States to where local IX networks are preferred over larger Tier1 ISP networks for transit (politically, cost, and preference wise). Second up is Singapore for CDN content and hosting activity in Germany. The next standout is a concentration of neocloud related activity in Finland, Brazil, France, and Canada.
Total number of bits transferred by network type to countries, excluding the United States, from March 2026.
Heatmap #3: What U.S. States show the highest concentration of traffic by network type?
If we dive into just the U.S. States, we can see the heavily weighted concentration of neocloud traffic to and from California. Hyperscaler activity matching up with our expectations as California and Virginia (specifically the Ashburn and Reston corridor) have a high concentration of partner networks. CDN traffic for us concentrates more for Backblaze specifically since the US-West region is our largest cluster footprint and longest running sites, so naturally the data being served out of these sites is more long-lived content lifecycle wise.
Total number of bits transferred by network type to US States from March 2026.
These insights into data geography help us understand, plan, and modify our growth trajectory. I say “help,” because we’re also discovering that neocloud and hyperscaler activity is very bursty and has a high magnitude of traffic flow below. From a planning perspective, understanding whether those bursts translate to a higher baseline for increased demand—and how to support bursts when they happen—is a different conversation than the predictable network trends of years past.
Neocloud and hyperscaler traffic vs predictive patterns
This quarter we’re sharing a deeper dive into the metrics associated with neocloud and hyperscalers over time. These two traffic types are driving innovation at Backblaze and are interesting to share to the larger industry. While CDN, hosting, and ISP regional traffic patterns are easy for us to model and account for as we manage our network infrastructure, neocloud and hyperscalers growth profiling are a challenge! As we said above, they are bursty and have a high magnitude (bits per associated IP address).
And, in the spirit of that conversation, we have several new views to share:
Neocloud and hyperscaler magnitude (bits per IP address) over time
Heatmaps over time
Neocloud
Hyperscaler
CDN
Hosting
ISP regional
Chart #1: What’s the magnitude of neocloud and hyperscaler traffic over time?
Matching our earlier charts, we saw a burst of activity from August to December of last year with a resurgence of high magnitude neocloud traffic in March of 2026.
Magnitude of neocloud and hyperscaler related traffic over time.
Heatmap #1 and #2: How dynamic are neocloud and hyperscaler traffic patterns?
Neocloud and hyperscaler traffic patterns are the most impactful to our operations due to the magnitude of their data flows. Below is a more detailed look at these concentrations over time, with a burst of activity from August to November for Neoclouds, a quiet period over the winter months, and a pickup again in March.
As expected our US-East region remains a hotspot of Neocloud related activity. One standout from this analysis is that the Neocloud activity in March is more spread out over our US-West, US-East, and EU-Central regions. It will be interesting to see if this spread grows or contracts over time.
Neocloud monthly traffic totals by region for May 2025–March 2026.
Over the winter months, there was a noticeable decrease in activity for hyperscale related traffic, most notable in January, but when compared to neocloud traffic, the month-over-month traffic patterns remained strongly visible in our US-East region.
Hyperscaler monthly traffic totals by region for May 2025–March 2026.
Heatmap #3, #4, and #5: How dynamic are CDN, hosting, and ISP regional traffic patterns?
We’re grouping CDN, hosting, and ISP regional types together because they represent a “steady-state” for us as network operators. These patterns are predictable, spread out over time, and generally do not change month-to-month. We do see visible bursts of traffic, like with a heavy blue tile for CDN in September and a few areas of hosting related traffic in May and October of 2025, but overall these are less impactful to our operations because the magnitude (bits per unique IP address) is lower—many sources are talking to many destinations, which as operators is easy to load balance.
CDN monthly traffic totals by region from May 2025–March 2026.
Hosting monthly traffic totals by region for March 2025–May 2026.
ISP Regional monthly traffic totals by region for March 2025–May 2026.
The most striking example of this predictability is, unsurprisingly, ISP regional traffic. This represents your more consumer driven workflows and use cases.
Neocloud business cycle and geography
We can draw a conclusion from all these charts: neocloud and hyperscaler are both different traffic patterns and far more dynamic than CDN, hosting, and ISP regional traffic. For our Network Engineering group, this means we have two different stylistic approaches towards managing our network.
First, when planning for the neocloud and hyperscaler traffic, our solutions entail adding large amounts of additional bandwidth in increments of 100G and often 400G ports to handle burst rates, ensuring that our inter-switch links inside our datacenter can also handle bursts of traffic, and reaching out to select partners to establish private network-to-network interface (PNI) connections where appropriate for zero-settlement transit.
Our steady state growth patterns stem from CDN, hosting, and ISP regional traffic with easy to model growth curves. Looking over monthly numbers indicates a clear pattern for us, and that’s easy to plan for.
The last factor that we’re placing more emphasis on is the geographical location of our network interconnections. We’re seeing a high concentration of demand located in the United States, specifically in regions like California, Virginia, Illinois, and Georgia.
With more datapoints, we can clearly see the magnitude of the neocloud and hyperscaler transfers when compared to other network types. As above, it’s a bit early to claim concrete quarter over quarter patterns, but we’ll keep monitoring and updating the dataset.
What’s next?
Anything specific you want to see? Let us know in the comments or reach out to the Network Stats team. Or, keep up-to-date with the latest technical content with our Developer Newsletter.
NAB Show 2026 wrapped up last week in Las Vegas, and we left with something special in hand: the NAB Show Product of the Year Award in the Cloud Computing and Storage category—this time for Backblaze B2 Neo.
It’s a meaningful recognition, and one that reflects where we see the media and AI infrastructure market heading. Here’s a look at what the recognition means, and why B2 Neo matters.
What this recognition means
Winning the NAB Product of the Year Award reflects something we genuinely believe: that storage infrastructure is a foundational capability for modern media and AI platforms, not an afterthought or a separate vendor relationship to manage.
The NAB Show brings together the best of the media and entertainment industry, and having B2 Neo recognized in this context—among platforms solving real, production-scale problems across streaming, OTT, AI-driven media processing, and large-scale content delivery—is meaningful validation that the approach resonates.
B2 Neo launched in February 2026 and is already supporting production workloads including AI training pipelines, high-performance computing environments, and large-scale media delivery. The response from platform providers has reinforced what we know: organizations want to offer integrated, high-performance storage without building it from scratch, and they want the economics to make sense.
What is B2 Neo?
B2 Neo is a high-performance, S3-compatible cloud object storage solution purpose-built for platforms running data-intensive media and AI workloads. But describing it simply as “cloud storage” undersells the point.
The key distinction: B2 Neo is a white-label service. Rather than selling storage directly to end users, B2 Neo enables platform providers—like media workflow vendors—to offer fully integrated storage under their own brand. Partners launch their own storage service with custom endpoints, pricing, and user experiences, without having to build or operate the underlying infrastructure themselves.
The result is that platforms can go from “we don’t offer storage” to “we have a native, high-performance storage tier” in weeks rather than years, with none of the capital investment or engineering overhead that building it in-house would require.
Why it was built
The problem B2 Neo addresses has been growing for years, but it’s become acute as streaming, OTT, and AI-driven media workflows scale up.
Compute has gotten fast, distributed, and relatively affordable. GPU clusters, edge networks, and CDNs can all handle increasingly complex workloads. But storage has often lagged behind—fragmented across providers, expensive to move data in and out of, and either too costly or too operationally burdensome to build in-house.
The consequence is real: GPU clusters sit idle waiting on data. Streaming pipelines bottleneck on access speeds. Media organizations duplicate content across storage systems because no single layer integrates cleanly into the rest of the stack.
B2 Neo was designed to remove that bottleneck. It delivers up to 1Tbps of throughput to ensure that compute resources—GPU clusters, streaming systems, edge delivery networks—are never waiting on storage. It combines that performance with Backblaze’s 17+ years of operational experience at exabyte scale, and wraps it in an API-first architecture that plugs directly into partner platforms.
How it works
From a technical standpoint, B2 Neo delivers high aggregate throughput using cost-efficient, disk-based infrastructure with strategically deployed flash layers—a write-through cache design that captures the performance benefits of flash without the cost and scalability limitations that come with an all-flash architecture at the multi-petabyte scale that media and AI workloads require.
For workloads where throughput matters as much as latency—moving large video files, training AI models, serving content at scale—this approach is particularly effective. It allows platforms to maintain a centralized data repository and efficiently deliver data to compute providers, edge networks, and CDNs without duplicating data across storage systems.
API-driven provisioning lets partners programmatically create and manage storage accounts, permissions, and billing within their existing systems. Whether a partner is running an OTT platform, a media asset management system, or an AI training pipeline, B2 Neo integrates as a native extension of that environment rather than an external dependency to work around.
Included egress and free API calls round out the picture, eliminating the usage-based fees that typically make storage decisions financially complicated.
What’s next
This is a product that will keep evolving alongside the media and AI infrastructure landscape. We’re working closely with early partners to expand B2 Neo’s capabilities—performance, integration depth, provisioning flexibility—and we’ll have more to share as those conversations develop.
If you’re building or operating a platform that would benefit from embedded, high-performance storage, we’d love to talk. Reach out to our team to learn more about what a B2 Neo partnership looks like.
Bandwidth purchased for data center connectivity surged by nearly 330% between 2020 and 2024, driven primarily by AI workloads. And in 2024, just 10 buyers accounted for nearly 62% of all purchases, according to Zayo’s Bandwidth Report. That concentration is a structural feature of how AI moves data.
Every training run that pulls data from Backblaze storage to a neocloud passes through our network, and our telemetry captures what those flows look like in real time. Our Q4 2025 Network Stats report covers a full quarter of that data. It shows AI workloads producing a distinct network signature: sustained, high-volume transfers between a small number of endpoints, with infrastructure requirements specific enough to be worth examining in detail.
This piece walks through what that signature looks like and what it means for the infrastructure decisions teams are making right now.
The AI model lifecycle and how it moves data
AI model development is a cycle. Large datasets are ingested and consolidated, exported to compute for training, pulled back for evaluation, then pushed out again as models are refined, retrained, and updated with new data. Each stage requires moving substantial volumes of data between storage and compute, repeatedly, over the life of a model.
That structure produces a specific kind of network traffic. AI training moves petabyte-scale data between storage and compute nodes in sustained, long-lived flows—what network engineers call elephant flows—with training jobs running for hours or days under continuous network load. Add frequent checkpointing, model updates, and periodic data refreshes, and the result is traffic that is high in volume and persistent across the entire training run.
This shows up clearly in the Q4 2025 Network Stats data. Neocloud traffic spiked sharply from July through November, peaking in October, then settled into a higher baseline heading into the new year. One interpretation of that shape is the AI lifecycle playing out across a concentration of large training cycles: ingestion, training egress, then a new steady state as stored models get served and periodically retrained. As we accumulate more quarters of data across a broader customer mix, we’ll be better positioned to distinguish that pattern from seasonal budget cycles or customer-specific factors.
Backblaze network traffic for Q4 2025.
Also visible in the Q4 data is where this traffic is going. Cloud-to-cloud traffic grew from 36.2% to 49.6% quarter-over-quarter, with hyperscaler destinations rising from 3.5% to 18%. As the report notes, it’s too early to call these statistically significant trends; the dataset reflects Backblaze’s specific customer mix and covers a single quarter. The direction is consistent with how AI teams operate in practice: moving workloads across neoclouds and hyperscalers depending on price, availability, and job requirements. The storage layer is what persists across those compute environments, which has direct implications for how it needs to be designed.
What elephant flows require from a network
Traditional cloud infrastructure is designed around a specific traffic profile: many clients, many sessions, many discrete transactions. Routing, load balancing, and edge capacity are all optimized for that pattern, distributing load broadly and handling high volumes of short-lived connections efficiently.
Elephant flows don’t fit that profile. AI training establishes persistent, high-volume connections between client and storage that sustain continuous data movement for hours or days at a time. These connections are stickier than typical cloud traffic, particularly on peered networks, and the strain they produce is concentrated rather than distributed—showing up primarily at the edge, where routers handle sustained throughput at scale. Most traditional cloud infrastructure wasn’t provisioned for that kind of sustained pressure at the edge, because most workloads don’t produce it. Internal to the network, depending on a myriad of things—object size, concurrent threads, hardware, internal routing logic—your network path being sticky doesn’t reduce the number of I/O operations for servers, and often that becomes one of the biggest bottlenecks.
The stakes make this consequential. Training the most advanced models now costs hundreds of millions of dollars, according to Epoch AI—though we also know this is a new technology, and therefore likely the compute will get more efficient over time. That said, the storage is still storage: Data has to live somewhere.
Infrastructure that can’t sustain throughput under continuous load doesn’t just slow training down; it adds cost to every run. The practical answer is building throughput capacity at the connection points between storage infrastructure and the internet or peer network, sized for sustained flows rather than peak bursts.
That’s what AI-grade storage infrastructure is designed around: sustained throughput to a small number of destinations, at 100Gbps to 1Tbps per transfer for the largest AI workflows. Achieving that in practice means rethinking how a network is designed, routed, and scaled. We’ve written separately about what that looked like for Backblaze’s own infrastructure. Latency matters here for a specific reason: on long-distance transfers, higher latency directly limits achievable sustained throughput, which is one reason why geographic proximity to compute infrastructure affects real-world performance.
The Q4 Network Stats heatmaps show this pattern from two angles. The magnitude heatmap, measuring bits transferred per unique IP address, shows high-magnitude neocloud flows clustering clearly in regions serving AI-heavy compute endpoints. The uniqueness heatmap shows neocloud traffic involving fewer, more persistent endpoints than CDN or ISP traffic, consistent with AI pipelines that rely on stable, long-standing connections between storage and compute.
The geography of AI infrastructure
The heatmaps show where AI traffic concentrates geographically today. Neocloud activity in the Q4 dataset clusters in Chicago, Dallas-Houston, Denver, New York, the Northern Virginia Reston/Ashburn corridor, and Atlanta, with a clear skew toward the East Coast. This reflects where AI compute infrastructure was built first and remains densest. Keeping latency low between storage and compute is a prerequisite for sustaining the high throughput rates AI workflows require, and that constraint has historically made East Coast proximity an advantage.
Magnitude transferred across our regions to each network type in Q4 2025.
That concentration is consistent with broader infrastructure dynamics. AI training workloads are driving demand for regions with available power, fiber density, and compute infrastructure, and power constraints in preferred markets are already forcing operators to explore secondary locations and invest in custom power infrastructure. Demand in markets outside traditional data center hubs is growing rapidly as a result: Metro bandwidth in Memphis grew from 0.3 terabits to 13.2 terabits between 2023 and 2024. On the flip side, building out cabling to those traditionally under-utilized locations is expensive, often adding thousands of dollars per month to data center economics. High-capacity interconnects are central to making those secondary locations viable; without them, the compute investment is stranded.
The scale of what’s being built reflects the trajectory of the workload. AI training infrastructure is projected to grow at a 22% compound annual growth rate (CAGR) through 2030, reaching more than 60GW of capacity, while inference infrastructure is expected to grow faster still at 35% CAGR, reaching more than 90GW, according to McKinsey. Training and inference have different geographic requirements: training tolerates latency and can sit in power-rich remote locations, while inference needs to be close to users, which means the buildout will be distributed across both dense metro markets and secondary locations connected by high-capacity fiber.
Backblaze’s own infrastructure decisions reflect this pattern directly. The East Coast concentration drove the decision to double Backblaze’s US-East footprint. At 100Gbps and above, proximity to where AI compute is actually running is a determining factor in storage performance.
What AI-ready storage infrastructure actually means
Storage has traditionally been sized for capacity and evaluated on cost per terabyte. AI workflows change the calculus. When a training run is pulling petabytes of data from object storage to flash storage at sustained 100Gbps rates, the storage layer is as much a performance determinant as the compute layer. A storage system that can’t sustain those throughput rates creates a bottleneck that no amount of GPU capacity can compensate for.
Throughput capability is one requirement. Portability is the other. The multi-cloud behavior visible in the Q4 data reflects how AI teams actually operate: moving workloads to whichever compute provider offers the best price-performance for a given job. Storage that is tightly coupled to one cloud provider is structurally incompatible with that workflow. Data that can’t move freely across cloud environments becomes a constraint on the model development process.
This is the infrastructure problem Backblaze B2 Overdrive is designed to address. By building a direct, high-performance path between Backblaze’s storage layer and the neoclouds where AI processing takes place, it provides the sustained throughput that training workflows require alongside the portability to move data as compute requirements change. The connections between Backblaze and neocloud endpoints visible in the Q4 heatmaps represent that architecture in practice.
The point extends beyond any single product. As AI workloads become a larger share of overall data center activity, the criteria for evaluating storage infrastructure are shifting. Capacity and cost per terabyte remain relevant, but sustained throughput capability, interoperability with compute providers, and network proximity to AI infrastructure are becoming equally important factors. Teams that treat storage as a passive component in AI pipeline design are likely to find it becomes the active constraint.
Early signal, long trend
The Q4 2025 Network Stats data is one quarter of observations from one storage provider’s network. The patterns it shows—high-magnitude flows to a small number of endpoints, East Coast geographic concentration, rising cloud-to-cloud traffic, a higher baseline heading into the new year—are consistent with what the broader industry understands about how AI moves data. What’s new is that they’re visible in real network telemetry rather than modeled projections.
We’ll be watching how neocloud traffic concentration evolves regionally, how the training-to-inference ratio shifts as inference infrastructure scales, and whether the cloud-to-cloud growth visible this quarter continues.
The full dataset, methodology, and visualizations are in the Q4 2025 Network Stats report. For background on how we classify and measure network traffic, the Q3 2025 report covers the dataset in detail, and you can follow the whole series here.
Modern media workflows don’t run on storage alone. They run on ecosystems—tightly integrated stacks of tools that ingest, process, analyze, move, review, and distribute content at scale. The companies we partner with aren’t just integrating with Backblaze; they’re building on it to solve real, specific problems that media teams face every day: archives that are impossible to search, file transfers that collapse over distance, review cycles that slow production to a crawl, compliance workflows that can’t keep up with library growth.
At NAB Show 2026, we’re bringing ten of those partners into booth N1259 to share what they’ve built. But the stories they’re telling aren’t just for Las Vegas—they’re for any media team trying to understand what a modern, cost-efficient, deeply integrated workflow actually looks like in practice.
Here’s a look at each partner, the problem they solve, and why it matters.
Imaginario AI: From Archive to Action
Presenter: Jose Puga, CEO and Co-Founder, Imaginario AI
Most video archives are passive. Content sits in storage, cataloged by someone who had time to do it years ago, effectively invisible to the people who could use it today. Imaginario AI flips that model.
Jose Puga’s session, “From Archive to Action: How AI Is Turning Your Video Library Into a Revenue Engine,” frames the shift from passive storage and cataloging to intelligent systems that actively surface, repurpose, and monetize content. The talk covers how marketing teams can accelerate campaigns, post-production teams can shortcut assembly, and compliance workflows can move from reactive to automated.
Imaginario is a multimodal video agentic platform that understands video in a human-like way—recognizing sounds, speech, and visual scenes without requiring time-based metadata. The platform is trusted by Warner Bros. Discovery, Sony Music, and Universal Pictures, and has won back-to-back IBC Best of Show honors in 2024 and 2025.
The Backblaze integration means content stays where it lives—no migration, no friction. As Jose puts it: “Backblaze provides our clients a scalable, reliable cloud layer that eliminates the friction of manual data transfers. Our native integration saves video teams dozens of hours by keeping content on Backblaze while unlocking high-speed AI analysis, retrieval, and repurposing in media and entertainment.”
Suite Studios: S3 Native File Streaming
Presenter: Jay Maxwell, Co-Founder & CPO, Suite Studios
Remote and distributed production teams have wrestled with the same problem for years: How do you collaborate on large media files when your team is spread across the globe? Suite’s answer is S3 Native File Streaming on Backblaze B2. The stack makes working with cloud object storage all-around easier, enabling teams to read and write data as standard objects without copying, syncing, or transferring.
Jay Maxwell’s session explores how global teams can instantly access and collaborate on large media files from anywhere—eliminating delays and accelerating production timelines. No syncing, no waiting, no workarounds. Just files that behave the way you need them to, wherever your team happens to be.
TwelveLabs: Unlocking Archive Value with Video AI
Presenter: Jordan Woods, Senior Solutions Architect, TwelveLabs
There’s a pattern across media organizations of all sizes: years of valuable archived content sitting effectively invisible because manual cataloging doesn’t scale. TwelveLabs makes that content searchable and monetizable.
Jordan Woods’ session, “Unlocking Archive Value with TwelveLabs Video Intelligence,” shows how pairing Backblaze’s cost-efficient storage with TwelveLabs’ video AI gives organizations a practical path to turn dormant archives into searchable, monetizable assets.
As Danny Nicolopoulos, Head of Strategic Partnerships at TwelveLabs, explains: “Media companies are sitting on years of valuable archived content that’s effectively invisible because manual cataloging doesn’t scale. Pairing Backblaze’s cost-efficient storage with TwelveLabs’ video AI gives organizations a practical path to turn those dormant archives into searchable, monetizable assets.”
Tillered: Full Speed Cloud Storage Over Any Distance
Presenters: Davey Goode, Founder & Stephen Ceci, Commercial Lead, Tillered
Physics is an undefeated opponent. Move data over long distances and throughput drops—no matter how fast your storage is or how much bandwidth you have. Tillered is built to remove that distance penalty.
The session, “Backblaze B2 Accelerate with Tillered: Full Speed Cloud Storage Over Any Distance,” demonstrates how the B2 Accelerate product brings Tillered’s acceleration technology to Backblaze B2, with transfers up to 34x faster as a result. No simulations—just live transfers with real results, showing what it looks like when enterprises can move data across any distance without adding bandwidth or changing workflows.
Davey Goode founded Tillered after repeatedly running into the same issue building large-scale connectivity infrastructure: No matter how much bandwidth was available, performance collapsed over distance. This session is the solution he built.
Telestream UP.Review: Decide Faster
Presenter: Sebastian Manemann, Senior Director of Product Management, Telestream
Capture, storage, and distribution have gotten faster. Review hasn’t kept up. Proxies, downloads, duplicated files—the approval workflow often undoes the speed gains made everywhere else in the pipeline.
Sebastian Manemann’s session, “Decide Faster: Real-Time Review, QC, and Delivery with Telestream UP.Review and Backblaze B2,” demos how Telestream UP.Review enables real-time, high-resolution playback and QC directly on media stored in Backblaze B2 without moving or duplicating files.
By keeping content in Backblaze as the central storage layer, teams can review instantly, validate quality, and move to delivery faster—all while maintaining a single source of truth across the workflow. As Sebastian frames it: “When you eliminate duplication and review directly from storage, you don’t just move faster—you operate smarter.”
Qencode + Sardius: A Multi-Vendor M&E Workflow in Practice
Presenters: Murad Mordukhay, CEO, Qencode, and Jason Shore & Ari Burt, Sardius Media
This one is different from the others—it’s not a product demo; it’s a case study. Sardius Media rebuilt their media pipeline around a race model: Multiple storage providers write in parallel, and the fastest result wins.
The session breaks down how Backblaze wins approximately 80% of those races, with Qencode orchestrating the encoding layer across the pipeline. It covers what the production data actually shows, and what Sardius would do differently if they were designing the workflow from scratch today.
Qencode uses machine learning to reduce file sizes by an average of 60% without sacrificing quality. Their CEO, Murad Mordukhay, sums up the partnership plainly: “The best partnerships are when two companies solve different halves of the same problem. Backblaze handles storage with the kind of reliability and transparency that perfectly aligns with how we think about transcoding. No surprises, no lock-in, just infrastructure that earns trust by performing every single day.”
Media workflows break down not just because of bad tools, but because of coordination failures between good ones. Files don’t sync. Teams duplicate work. Availability lags behind where content actually needs to be.
Christoph Jurkuhn’s session, “The Hidden Layer: Orchestrating Media Across the Stack with HiScale and Backblaze,” shows in a live demo how HiScale orchestrates media movement across distributed environments while Backblaze B2 provides the durable, scalable storage layer underneath. Files move, sync, and become available across teams and tools without delays, duplication, or manual intervention.
“Backblaze is built for straightforward, cost-efficient storage and HiScale builds on top of that to orchestrate and process your media. It’s a natural fit for modern media workflows.”
Iconik: Control Your Content
Presenter: Jeremy Strootman, Media Workflow Consultant, Iconik
At a certain scale, the problem isn’t creating content; it’s controlling it. Files get lost, search slows to a crawl, and archives become liabilities instead of assets.
Jeremy Strootman’s session, “Control Your Content: Turning Media Chaos into Operational Advantage,” demos how Iconik and Backblaze B2 give teams operational control over their media: making content instantly searchable, accessible, and reusable across the entire workflow.
With a foundational background in storage and archiving, Jeremy has spent over two decades helping content creators maximize efficiency and productivity across the entire media lifecycle, from ingest to archive. His perspective: “Backblaze gives us the scalable foundation; Iconik gives teams control over how that content is actually used.”
ToolsOnAir: Modern Broadcast Workflows on Backblaze
Presenter: Peter Steiner, Chief Business Officer, ToolsOnAir
Peter Steiner’s session, “Record, Store, Play: Modern Broadcast Workflows on Backblaze,” brings ToolsOnAir’s deep broadcast expertise to bear on what it looks like to build a complete ingest-to-playout workflow with Backblaze B2 as the storage foundation.
ToolsOnAir has been building Apple-based broadcast solutions for over a decade, with deployments across broadcast, ingest, and storage workflows worldwide. This session is for anyone running live or near-live operations who wants to understand what a modern, cloud-native broadcast stack actually looks like in practice.
The final session tackles a problem that’s only growing: As video libraries scale into the billions of assets, compliance workflows built for smaller operations don’t hold.
Ethan Steininger’s session, “What You Miss Can Cost You: AI-Powered Media Compliance at Scale on Mixpeek and Backblaze B2,” shows how Mixpeek’s multimodal AI infrastructure platform transforms unstructured content—video, images, audio, and documents—into searchable, programmable assets through a unified API.
Before founding Mixpeek, Ethan led search at MongoDB, and today Mixpeek powers enterprise workflows across media, adtech, healthcare, and brand safety, with core technology spanning feature extraction, multimodal retrieval, and a custom-built distributed vector store engineered for billion-scale workloads.
The Bigger Picture
Ten companies, one through-line: storage that integrates cleanly across the entire media stack changes what’s possible. As I put it in my article for Post Perspective:
What we are seeing is a broader realization that infrastructure decisions directly shape how teams build and operate. When pricing models penalize access or iteration, teams naturally limit how often they experiment or how much data they retain. That has a direct impact on product velocity and long-term value creation.
Backblaze didn’t have to react to this shift; it’s how we have always approached the market. Our cost model removes barriers like egress and transaction fees so teams can operate freely. That allows media organizations to focus on where value is actually created—whether that is content, audience engagement, or new AI-driven capabilities—while still maintaining craft excellence.
When your foundation is cost-efficient, S3-compatible, and built for reliability at scale, every tool in the ecosystem above it gets to do its best work. That’s what we mean when we talk about “building the future of media workflows”—not just that Backblaze stores your files, but that it enables the ecosystem built on top of it.
Join Us at NAB Show 2026
We’d love to show you around. Whether you want to catch one of the in-booth presentations, sit down for a workflow consultation, or talk through your specific storage and integration challenges, our team will be on-site all week.
OpenClaw crossed 250,000 GitHub stars in 60 days, surpassing React’s decade-long record to become the most-starred software project on GitHub. At GTC 2026, NVIDIA CEO Jensen Huang declared it “the operating system for personal AI” and told the room: “For the CEOs, the question is, what’s your OpenClaw strategy?”
At NVIDIA’s Hack for Impact hackathon at GTC, I built and watched engineers build autonomous agents on NemoClaw, OpenClaw, and Nemotron. Wildfire detection ingesting NASA satellite data. Crime pattern analysis across police jurisdictions. Energy grid anomaly forecasting.
The same architectural question surfaced in every project: agents that collect and generate data at scale need a deliberate strategy for archiving, retaining, and surfacing that data. Without one, agent-produced artifacts become dark data, generated but inaccessible, unversioned, and invisible to the rest of the organization. That question only gets more consequential in production.
Beyond NemoClaw’s runtime governance: Architecting for data persistence
NVIDIA’s NemoClaw wraps OpenClaw with security through OpenShell, a runtime that sandboxes each agent at the kernel level. Network requests, file access, and inference calls are governed by declarative YAML policy, enforced outside the agent’s process so the agent itself can never override them.
OpenClaw agents create workspace files (SOUL.md, USER.md, IDENTITY.md) that define the agent’s personality, preferences, and behavioral context. Inside a NemoClaw sandbox, this state lives in a Kubernetes Persistent Volume Claim inside an embedded K3s cluster, and the community is already asking for better backup and restore workflows on the NemoClaw GitHub repo.
At fleet scale, with dozens of agents each maintaining persistent memory, conversation history, and skill artifacts, a durable storage layer beneath the runtime is what keeps agent state from becoming disposable. What that layer looks like depends on the type of data your agents produce.
The agentic data layer
Two categories of data define the storage requirements for autonomous agents.
Operational artifacts
Autonomous agents generate reports, analyses, transformed datasets, alerts, and increasingly, multimodal outputs like processed video, audio, and images. Inside NemoClaw’s sandbox, filesystem access is confined to /sandbox and /tmp, both ephemeral by design.
Cloud storage decouples the artifact from the runtime, enables scoped access via URLs, and plugs into every major orchestration framework. Bucket-level permissions and scoped application keys extend governance into the storage layer, so each agent or agent class gets write access only to its designated output path.
Lineage matters here too: Each artifact should trace back to which agent, model, inputs, and policy produced it. Our GTC project, FireWatch, used Backblaze B2 exactly this way, uploading wildfire risk reports with a bucket-scoped key, generating shareable URLs, and embedding them directly in stakeholder alert emails.
State and compliance data
Agent memory, skill artifacts, and audit logs from policy decisions all require durable, long-term retention. NemoClaw’s privacy router splits inference between local and cloud models based on policy, generating routing metadata that compliance teams will want to retain and query. Cloud storage brings high durability, append-only immutability for audit trails, and lifecycle policies for tiered retention as data ages.
We built an open source OpenClaw plugin (openclaw-b2-backup) around this: Encrypted snapshots of agent config, memory, and sessions pushed to B2 on a daily cron, before compaction events, and on gateway shutdown. Three fields to configure, rollback from chat, one-command migration to a new machine.
The agent landscape is expanding. The storage pattern is consistent.
The open-source, autonomous AI agent ecosystem now spans at least 16 variants, each optimized for a different deployment context: NanoClaw for container-isolated security, ZeroClaw for edge deployment in a 3.4MB Rust binary, IronClaw for regulated industries through Trusted Execution Environments, managed platforms like ClawCloud and Maxclaw, and Qwen-Agent from Alibaba for the Chinese developer ecosystem.
Whether self-hosted or managed, all of them produce artifacts that need to persist beyond the runtime. Teams building autonomous agents for their organizations will need durable output sharing, state backup, and cross-agent data access regardless of which runtime they choose.
What enterprise AI leaders should build toward
Architect your agent data orchestration on cloud storage. As organizations scale from initial agent deployments to multi-team production workloads, data volume grows with every agent added, every week they run, and every modality they process. Agents gather, generate, and transform data continuously. Cloud storage gives you a durable layer for managing that lifecycle: ingestion and collection, versioned outputs, long-term archival, lifecycle policies for retention, and portability across agent platforms as your organization’s runtime choices evolve. Establishing this now, while the ecosystem is still forming, is the strategic move.
Automate agent state backup as part of your deployment standard. Agents building context across customer data, internal systems, and team workflows for weeks carry real operational value. Automated workspace snapshots protect that investment, create a disaster recovery path, and enable migration across environments.
Design for lineage and audit from day one. Policy decisions, tool invocations, inference routing, and multimodal processing chains all generate metadata. For enterprises operating under SOC 2, HIPAA, or GDPR, storing lineage and audit data alongside your artifacts in cloud storage means your compliance posture is ready before the audit, not after.
NemoClaw brought governance to the agentic stack. If your organization is deploying autonomous agents today, data orchestration and lineage are your next architectural decisions. Get them right early, and your agents scale with durable state, shareable outputs, and auditable history from day one.
To provide the best experiences, we use technologies like cookies to store and/or access device information. Consenting to these technologies will allow us to process data such as browsing behavior or unique IDs on this site. Not consenting or withdrawing consent, may adversely affect certain features and functions.
Functional
Always active
The technical storage or access is strictly necessary for the legitimate purpose of enabling the use of a specific service explicitly requested by the subscriber or user, or for the sole purpose of carrying out the transmission of a communication over an electronic communications network.
Preferences
The technical storage or access is necessary for the legitimate purpose of storing preferences that are not requested by the subscriber or user.
Statistics
The technical storage or access that is used exclusively for statistical purposes.The technical storage or access that is used exclusively for anonymous statistical purposes. Without a subpoena, voluntary compliance on the part of your Internet Service Provider, or additional records from a third party, information stored or retrieved for this purpose alone cannot usually be used to identify you.
Marketing
The technical storage or access is required to create user profiles to send advertising, or to track the user on a website or across several websites for similar marketing purposes.