All posts by Reekunj Parmar

Optimizing Apache HBase availability on Amazon EMR, Part 2: Diagnose and tune compaction

Post Syndicated from Reekunj Parmar original https://aws.amazon.com/blogs/big-data/optimizing-apache-hbase-availability-on-amazon-emr-part-2-diagnose-and-tune-compaction/

This post shows you how to diagnose and tune compaction in Apache HBase on Amazon EMR. Compaction is the background process that merges store files. When it competes with your workload during peak hours, you can see higher read and write latency, write stalls, and RegionTooBusyException errors. Amazon EMR on Amazon Simple Storage Service (Amazon S3), you can also see more 503 Slow Down responses when you increase your cluster’s request rate.

This is the second post in a two-part series on operating Apache HBase on Amazon EMR:

  • Part 1 covers the three-level troubleshooting model and three availability issues: an HBase coordinator that doesn’t finish initializing, a RegionServer that stops unexpectedly, and HBase regions that stay in transition (RIT).
  • Part 2 (this post) covers performance: how to confirm that compaction is the cause, which parameters to tune first, and when to contact AWS Support.

This post covers the following:

  • How compaction affects performance.
  • How to confirm whether compaction is causing the latency.
  • The compaction parameters to tune, their defaults, and what each one does.
  • Practices that reduce compaction work.
  • When to stop and contact AWS Support, and what to bring to a support case.

This post doesn’t cover the following:

  • Coordinator startup, RegionServers that stop unexpectedly, and regions in transition, which are covered in Part 1 of this series.
  • Compaction algorithm internals or writing custom compaction policies.
  • Schema design and row key distribution (the Practices that reduce compaction work section covers how they affect compaction).

This post is for operations teams, data engineers, HBase administrators, and site reliability engineers (SREs) who see recurring latency spikes, write stalls, RegionTooBusyException errors, or high Amazon S3 request rates during compaction on HBase on Amazon EMR.

Terminology

Apache HBase names the process that coordinates the cluster HMaster, and Amazon EMR runs it on the primary node. This post refers to it as the HBase coordinator. Names that contain master, such as the hbase-master service and the hbase-hbase-master-*.log log files, appear only in commands and log output, where you need the exact name.

In HBase, a region is a range of rows in a table, and a RegionServer is the process that serves regions. Neither is related to an AWS Region.

Prerequisites

  • Read Part 1 of this series, in particular the Three levels of troubleshooting and Quick reference sections.
  • Confirm that you have access to the HBase web UI (coordinator on port 16010, RegionServer on port 16030).
  • Confirm that you have SSH access to the primary and core nodes.
  • Know whether your cluster uses Hadoop Distributed File System (HDFS) or Amazon S3 as its storage mode, and how to apply configuration changes through the hbase-site classification in Amazon EMR. For storage-mode specifics, see HBase on Amazon S3.
  • Be familiar with minor and major compaction in HBase.

How compaction affects performance

By default, HBase runs a major compaction roughly every seven days and uses a jitter factor of 0.5 to spread the start times so that HBase regions don’t all compact at once. For guidance specific to Amazon EMR, see the HBase best practices in the Amazon EMR best practices guide.

Major compaction reads and rewrites all store files in a region. It improves read performance and removes deleted and expired cells, but when it runs during peak hours it competes with client requests and can increase latency. Tuning compaction means controlling when major compaction runs and how much I/O it uses.

Compaction decision flow

Before you change any parameters, use the following decision flow to identify the cause.
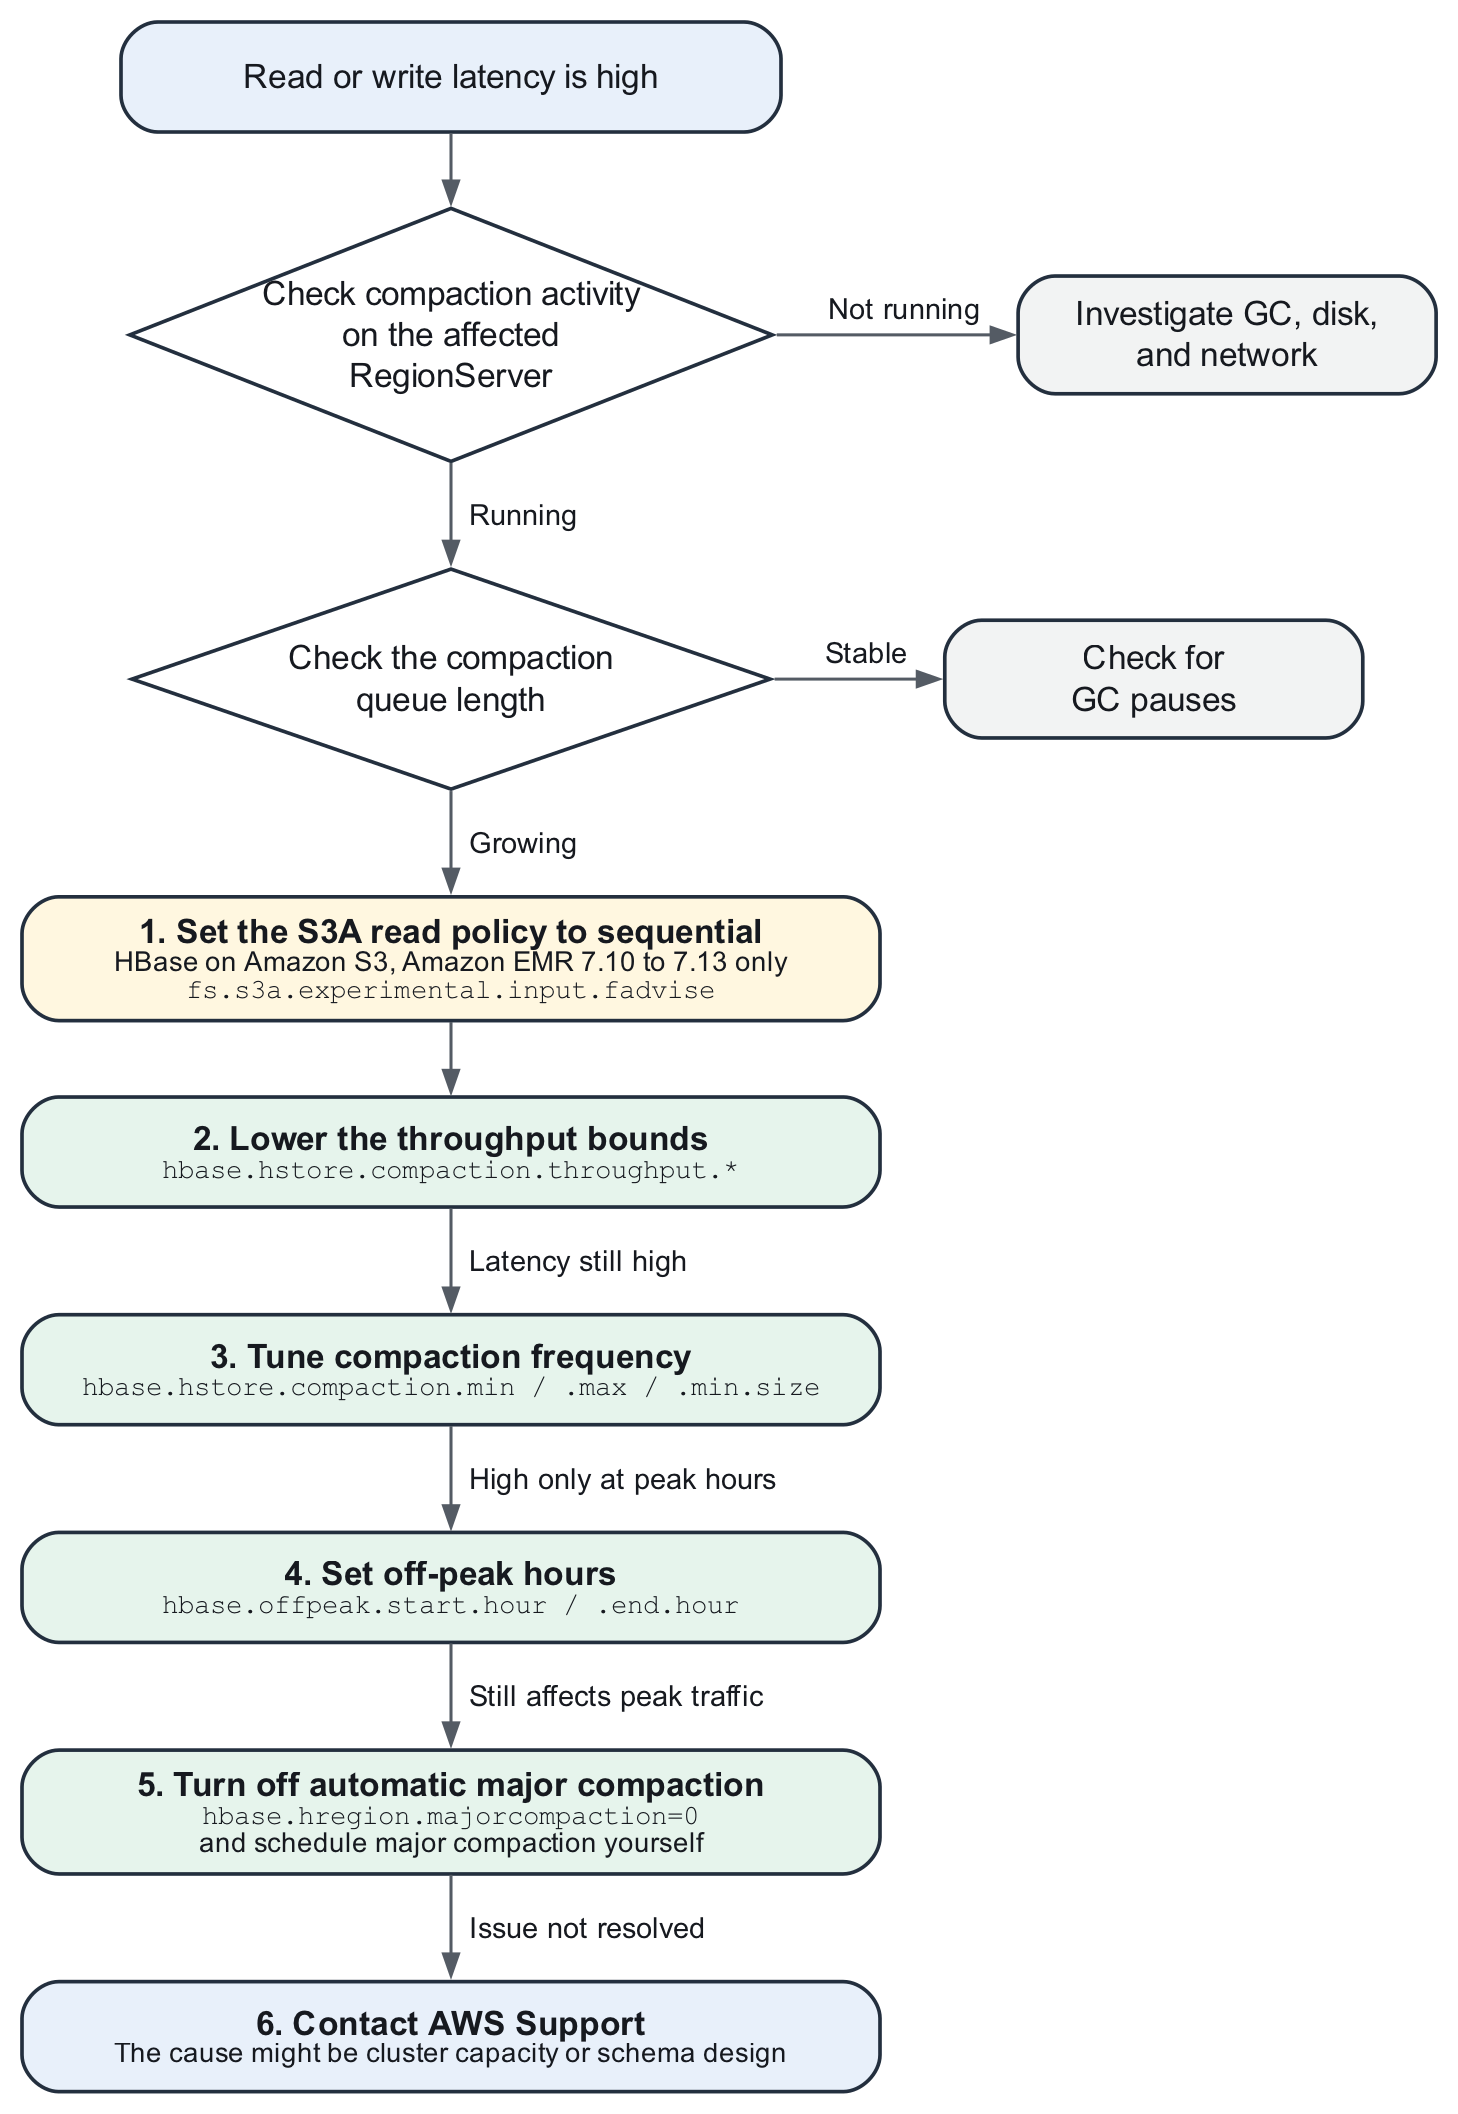
Compaction decision flow diagram showing how to confirm compaction pressure and the six tuning steps to work through in order

Figure 1: Compaction decision flow

The flow has the following steps:

  • If latency is high, check whether compaction is running on the affected RegionServer. If it isn’t, investigate garbage collection (GC), disk, and network instead.
  • If compaction is running, check whether the compaction queue is growing. If it isn’t, check for GC pauses.
  • If compaction is running and the queue is growing, work through the following steps in order:
    1. On HBase on Amazon S3 with Amazon EMR 7.10 to 7.13, set the S3A read policy to sequential before you change any compaction parameter. See Step 3 in Diagnose compaction pressure.
    2. Lower the throughput bounds (hbase.hstore.compaction.throughput.*) to reduce the I/O that compaction takes from client requests. The queue can grow while the limit is lower. HBase removes the limit when any store reaches hbase.hstore.blockingStoreFiles, so the limit doesn’t keep a store at the blocking threshold.
    3. If latency is still high, tune compaction frequency (hbase.hstore.compaction.min, hbase.hstore.compaction.max, and hbase.hstore.compaction.min.size).
    4. If latency is high only during peak hours, set off-peak hours (hbase.offpeak.start.hour and hbase.offpeak.end.hour) so that more compaction work runs outside them.
    5. If compaction still affects peak traffic, turn off automatic major compaction (hbase.hregion.majorcompaction=0) and schedule it yourself.
    6. If none of these steps resolves the issue, contact AWS Support. The cause might be cluster capacity or schema design.

Note: Changing the previous configuration requires EMR HBase Restart. For reconfiguration behavior, refer to Reconfiguration behaviors in the Amazon EMR Management Guide.

Signs of compaction pressure

The following symptoms indicate compaction pressure. They don’t all appear at once. Start with the first two, because you can confirm them in the HBase web UI:

  • Read and write latency rises on some RegionServers but not others. The affected set changes over time as different regions reach their compaction window.
  • The compaction queue length on the affected RegionServer keeps increasing.
  • Long-running reads (report generation, Apache Spark table scans) pause and then resume.
  • Clients receive RegionTooBusyException, call timeouts, or retries. The RegionServer log shows Region is too busy due to exceeding memstore size limit warnings for the same regions.
  • Writes stall periodically. When a store reaches hbase.hstore.blockingStoreFiles store files, HBase delays MemStore flushes until compaction reduces the count, for up to hbase.hstore.blockingWaitTime (90 seconds by default). If the MemStore exceeds hbase.hregion.memstore.flush.size multiplied by hbase.hregion.memstore.block.multiplier in the meantime, HBase blocks updates to the region.
  • On HBase on Amazon S3, more requests return 503 Slow Down when the request rate from your cluster to an Amazon S3 prefix is high. These responses ask your cluster to reduce its request rate. Compaction reads and rewrites store files in Amazon S3, so it adds to that rate.
  • On Amazon EMR 7.10 to 7.13 with HBase on Amazon S3, compactions, scans, and bulk loads run slower than expected and the number of HFiles keeps increasing. See Step 3 in Diagnose compaction pressure.
  • The pattern recurs on a weekly rhythm, which matches the default seven-day major compaction interval.

Diagnose compaction pressure

Work through the following steps in order. Step 1 uses the HBase web UI (Level 1). Steps 2 and 3 use logs, operating system tools, and configuration files (Level 2). None of these checks change the cluster.

Step 1 (Level 1): Check the HBase web UI

  • In the HBase web UI, sort RegionServers by request count and by store file count to find the outliers. A server with a much higher store file count might be running, or waiting for, a compaction.
  • On the RegionServer web UI of an affected server, check the compaction queue length and store file count per region. A queue that keeps growing means compaction can’t keep up with your write volume, so add capacity or tune your configuration.
  • Check the BlockCache hit rate. A lower hit rate also increases latency. On HBase on Amazon S3, RegionServers cache reads in the BlockCache (memory) and the BucketCache (local disk). A cache miss reads the store file from Amazon S3, which has higher latency than a local read. If the hit rate dropped when compaction started, compaction might be replacing frequently read data in the cache.

Step 2 (Level 2): Check the logs and the operating system

Confirm that compaction is running, and on which HBase regions:

grep -E "Starting compaction|Completed (major )?compaction|too many store files" \
/var/log/hbase/hbase-hbase-regionserver-*.log | tail -40

Rule out GC as the cause, because heavy compaction and heap pressure look the same to clients:

grep -E "JvmPauseMonitor|Detected pause in JVM" \
/var/log/hbase/hbase-hbase-regionserver-*.log | tail -20

Check CPU, memory, and disk usage on the host:

free -m                  # check free memory
top -b -n1 | head -20    # CPU
df -h                    # disk capacity

Use the canary tool to measure read latency per HBase region. The tool writes its results to the console and to /var/log/hbase/hbase.log. Save the output as a baseline to compare against after each change:

sudo -u hbase hbase canary my_table

Check the store file layout of the table to see whether it has many small files (from frequent flushes) or a few large ones. Store files are under the HBase root directory, which is in HDFS or Amazon S3, depending on your storage mode. On HBase on Amazon S3 with Amazon EMR 7.4 and later, HBase tracks the store files it reads in a meta file in each store directory instead of relying on directory listings, so use the store file count in the RegionServer web UI as the count of active files:

grep -A1 hbase.rootdir /etc/hbase/conf/hbase-site.xml   # find the HBase root directory
sudo -u hbase hbase hfile -f <hbase.rootdir>/data/default/my_table/<region>/<cf>/<hfile> -m -s

Step 3 (Level 2): Check the S3A read policy (Amazon EMR 7.10 to 7.13)

Starting with Amazon EMR 7.10, HBase on Amazon S3 uses the S3A file system client, and fs.s3a.experimental.input.fadvise defaults to normal. In this mode, S3A can switch to a random read policy even when HBase continues to read sequentially, which slows compactions, scans, and bulk loads. Use the recommended setting for Amazon EMR 7.10, 7.11, 7.12, and 7.13. The symptoms are similar to compaction pressure: slow compactions, an increasing number of HFiles, and blocked flushes that return RegionTooBusyException.

Check the release label and the current setting:

aws emr describe-cluster --cluster-id <cluster-id> --query 'Cluster.ReleaseLabel'
grep -A1 fs.s3a.experimental.input.fadvise /etc/hbase/conf/hbase-site.xml

If the release is 7.10 to 7.13 and the property isn’t set, or is set to normal, set it to sequential in the hbase-site classification before you tune compaction. Changing the setting requires a restart, so it’s a Level 3 action:

[
    {
        "Classification": "hbase-site",
        "Properties": {
            "fs.s3a.experimental.input.fadvise": "sequential"
        }
    }
]

Apply the setting to hbase-site.xml on all nodes, then restart the HBase coordinator and RegionServer processes. Setting the property on individual commands instead doesn’t improve compaction and scan performance. For more information, see HBase on Amazon S3 in the Amazon EMR Release Guide.

Compaction tuning parameters

The following table lists the compaction parameters that this post covers. Apply changes through the hbase-site configuration classification in Amazon EMR. Changing these parameters is a Level 3 action. Change one parameter at a time and compare the results with the canary baseline from Step 2, because several of these parameters interact.

Note: The Amazon EMR column lists defaults from the HBase on Amazon S3 documentation. Where a default isn’t listed there, check the effective value in /etc/hbase/conf/hbase-site.xml on your cluster, and verify component versions on the Amazon EMR release components page. For example, hbase.hstore.blockingStoreFiles is 16 in Apache HBase 2.x, but Amazon EMR sets it to 10 for HBase on Amazon S3.

Parameter What it does Apache HBase 2.x default Amazon EMR default (HBase on Amazon S3)
hbase.hstore.compaction.throughput.higher.bound Upper limit on compaction throughput per RegionServer when store file pressure is high. 104857600 (100 MB/s) Not listed
hbase.hstore.compaction.throughput.lower.bound Lower limit on compaction throughput per RegionServer when store file pressure is low. 52428800 (50 MB/s) Not listed
hbase.hstore.compaction.min Minimum number of eligible store files before a minor compaction runs. If it isn’t set, HBase uses hbase.hstore.compactionThreshold. 3 Not listed
hbase.hstore.compaction.max Maximum number of store files included in a single minor compaction. 10 Not listed
hbase.hstore.compaction.min.size HBase always considers store files smaller than this size eligible for minor compaction. 134217728 (128 MB) Not listed
hbase.hstore.compaction.ratio Size ratio that decides which larger files are included in a minor compaction. 1.2 Not listed
hbase.hstore.blockingStoreFiles Number of store files in a store at which HBase delays MemStore flushes, for up to hbase.hstore.blockingWaitTime (90 seconds), until compaction reduces the count. 16 10
hbase.hregion.memstore.flush.size MemStore size, in bytes, at which HBase flushes to a new store file. 134217728 (128 MB) 134217728 (128 MB)
hbase.hregion.memstore.block.multiplier HBase blocks updates when a MemStore exceeds the product of hbase.hregion.memstore.flush.size and this value. 4 4
hbase.hregion.max.filesize Region size at which HBase splits the region. 10737418240 (10 GB) 10737418240 (10 GB)
hbase.offpeak.start.hour hbase.offpeak.end.hour Off-peak window (hours 0–23). During this window, the larger hbase.hstore.compaction.ratio.offpeak (default 5.0) applies, and compaction throughput isn’t limited unless you set hbase.hstore.compaction.throughput.offpeak. -1 (no off-peak window) Not listed
hbase.hregion.majorcompaction Time between automatic major compactions, in milliseconds. 0 turns off automatic major compaction. 604800000 (7 days) Not listed
hbase.hregion.majorcompaction.jitter HBase uses this value to spread major compaction start times so that Regions do n’t all compact at once. 0.5 Not listed
hbase.bucketcache.size Local disk space, in MB, on each RegionServer for the BucketCache (instance store and Amazon Elastic Block Store (Amazon EBS) volumes). Not set 8,192 MB
fs.s3a.experimental.input.fadvise S3A read policy for HBase on Amazon S3. See Step 3 in Diagnose compaction pressure. Not applicable normal (7.10 and later)

Warning: If you turn off automatic major compaction (hbase.hregion.majorcompaction=0), you are responsible for scheduling it. Minor compactions still merge store files, but delete markers and deleted cells stay in store files until a major compaction runs. This slows reads and delays reclaiming storage. If you turn it off:

  • Schedule major_compact yourself, per table, in a maintenance window. Run it on the primary cluster only, because read-replica clusters must not run manual compactions. On Amazon EMR releases earlier than 7.4.0, also turn off compaction on the read-replica cluster (hbase.regionserver.compaction.enabled=false). From 7.4.0, store file tracking makes this unnecessary.
  • Alarm when the store file count of any store approaches hbase.hstore.blockingStoreFiles (for example, at 80 percent of that value), so that you notice if the schedule slips before writes are delayed.

Use the following HBase shell commands to run a major compaction and check its progress:

hbase> major_compact 'my_table'
hbase> major_compact 'my_table', 'cf1'   # a single column family
hbase> compaction_state 'my_table'       # check progress

Practices that reduce compaction work

Tuning limits the effect of compaction on your workload. The following practices reduce how much compaction work the cluster has to do:

  • Limit region size and the number of regions per RegionServer. Large regions make major compaction expensive, because major compaction rewrites every store file in the region. HBase splits a region when it reaches hbase.hregion.max.filesize (10737418240 bytes, or 10 GB, by default on HBase on Amazon S3). Pre-split tables where you can predict the key distribution, using the SPLITS option of the HBase shell create command or the RegionSplitter tool.
  • Fix hotspotting at the row key. A row key that concentrates writes on one region (sequential timestamps, monotonically increasing IDs) produces frequent flushes and repeated compaction on a single RegionServer. To spread writes across HBase regions, salt, hash, or reverse the key.
  • Reduce small flushes. Many small MemStore flushes create many small store files, which increases compaction work. Compare the MemStore flush size (hbase.hregion.memstore.flush.size) with your write pattern. If regions flush every few seconds, the flush size might be too small, or the RegionServer might be under memory pressure. On HBase on Amazon S3, consider increasing hbase.hregion.memstore.flush.size and hbase.hregion.memstore.block.multiplier. This increases the time between compactions, but it also increases replication lag if you use a read-replica cluster. Make sure that the RegionServer heap can hold the larger MemStores.
  • Size the BucketCache on HBase on Amazon S3. The BucketCache stores reads on the local instance store and Amazon EBS volumes of each RegionServer. The more of your dataset it holds, the fewer reads go to Amazon S3, so compaction competes less with client reads. Increase hbase.bucketcache.size (default 8,192 MB) and choose an instance type with enough instance storage. See HBase on Amazon S3 and the Amazon S3 best practices in the Amazon EMR best practices guide.
  • Use multiple primary nodes. On an Amazon EMR cluster with multiple primary nodes, the HBase coordinator keeps running if one primary node in your cluster stops, so region assignment and split procedures continue. See Plan and configure primary nodes.
  • Alarm on compaction metrics. Set alarms on compaction queue length and store file count per region, which increase as compaction falls behind. Also alarm on Java virtual machine (JVM) pause frequency and the number of stopped RegionServers. For the metrics that are available, see the observability guidance in the Amazon EMR best practices guide.

When to stop and contact AWS Support

Some repair actions change cluster metadata and are difficult to reverse. Stop and open a case with AWS Support when any of the following is true:

  • HBCK2 bypass or setRegionState is your next step. Both can leave procedures or regions in an inconsistent state that you then must correct, and bypass might require a coordinator restart to release locks. AWS Support can validate your diagnosis and confirm the command before you run it.
  • Your next step is to delete znodes. Removing /hbase children discards state that HBase keeps in ZooKeeper, such as the location of hbase:meta, RegionServer registrations, and, on Amazon EMR, store file tracking data. This makes the problem harder to resolve. Don’t delete znodes as a first step.
  • A procedure is stuck and you cannot identify why from the logs. If three thread dumps and the coordinator log have not explained what is holding the procedure, AWS Support can help identify the cause.
  • Several RegionServers stop at the same time. Look for a cause on your cluster that the RegionServers share, such as the network configuration between cluster nodes, the ZooKeeper ensemble, or HDFS.
  • You have tuned compaction parameters twice and latency has not improved. The cause might be schema design, row key distribution, or cluster capacity, and further tuning can hide it without resolving it.
  • The stack trace contains exceptions that you don’t recognize. If the error doesn’t appear in this post or the Apache HBase Reference Guide, it might be an Apache HBase issue that is fixed in a later release. Check the Amazon EMR Release Guide and the Apache HBase JIRA before debugging further.

What to bring to the support case

Collect the following information before you open the case:

Artifact How to get it
Coordinator log extract (first ERROR plus 100 lines of context) Run grep -n -m1 "ERROR" /var/log/hbase/hbase-hbase-master-*.log, then sed -n 'X,+100p' from that line number
RegionServer log extract from the affected server Run the same commands on the affected core node against /var/log/hbase/hbase-hbase-regionserver-*.log
Thread dumps (3, taken 30 seconds apart) from the affected JVM Find the process ID with sudo jps -l, then run sudo -u hbase jstack -l <PID> three times, 30 seconds apart
Stuck procedure identifiers list_procedures in the HBase shell, or the Procedures and Locks page in the HBase web UI
Encoded region names involved From the HBCK Report tab or the Regions in Transition list
Amazon EMR release and HBase version aws emr describe-cluster --cluster-id <cluster-id> --query 'Cluster.ReleaseLabel' for the release, and sudo -u hbase hbase version for the HBase version
Storage mode and S3A read policy grep -A1 -E "hbase.rootdir\|fs.s3a.experimental.input.fadvise" /etc/hbase/conf/hbase-site.xml
Timeline: when it started, what changed Amazon CloudWatch metrics, cluster events in the Amazon EMR console, and any configuration changes or scaling actions
Compaction metrics: queue length, store file count, duration of recent compactions The RegionServer web UI, or the Completed compaction and Completed major compaction log lines, which include how long each compaction took
Any configuration changes you have already made List the parameters you changed and their before and after values

Providing this information up front reduces the number of follow-up requests from AWS Support.

Quick reference: Compaction log signatures

Search for the first occurrence of each signature in the following table, which shows when the condition started. Unless the table says otherwise, the signatures appear in the RegionServer log. For example:

grep -m1 -n "too many store files" /var/log/hbase/hbase-hbase-regionserver-*.log
Signature Meaning
too many store files A store reached the blocking threshold. HBase is delaying MemStore flushes until compaction reduces the number of store files.
RegionTooBusyException A MemStore exceeded hbase.hregion.memstore.flush.size multiplied by hbase.hregion.memstore.block.multiplier, for example because flushes are delayed by too many store files. The RegionServer logs Region is too busy due to exceeding memstore size limit, and clients receive the exception.
Completed major compaction A major compaction finished on that store. A major compaction that rewrote every file also shows (all).
Completed compaction A minor compaction finished. The line includes the number of files, the resulting store size, and how long the compaction took. Use it to establish a baseline.
Detected pause in JVM / JvmPauseMonitor A GC pause. Compare its timestamp with the compaction start time to see which came first.
SlowDown Amazon S3 returned HTTP 503 with the error code SlowDown, which asks your cluster to reduce its request rate to a prefix. Compaction adds to the request rate on HBase on Amazon S3.
ServerCrashProcedure Appears in the coordinator log (hbase-hbase-master-*.log). HBase is reassigning the regions of a RegionServer that stopped. Check whether a GC pause during heavy compaction caused it to stop.
Finished flush of A MemStore flush completed and wrote a new store file. Many of these lines in a short period mean frequent small flushes, which increase compaction work.

Conclusion and next steps

In this post, you learned how to confirm whether compaction is causing latency on HBase on Amazon EMR, and how to tune it, starting with the least invasive change.

For coordinator startup, RegionServers that stop unexpectedly, and regions in transition, see Part 1 of this series.

Next steps

  • Add the triage flow from both posts to your team’s runbook, with your own alarm names, dashboards, and on-call procedures.
  • Set up the alarms described in Practices that reduce compaction work.
  • Stage the HBCK2 jar for your HBase version on the cluster now, so that it’s ready before you need it.
  • Record a compaction baseline. Run grep -E "Completed (major )?compaction" across a week of RegionServer logs to learn the normal duration and frequency for your tables, so that you can recognize unusual behavior.
  • Review the guidance in the HBase best practices and troubleshooting sections of the Amazon EMR best practices guide.
About the authors

Reekunj Parmar

Reekunj Parmar

Reekunj is a Senior Technical Account Manager at Amazon Web Services, focused on Data Analytics. He works with customers to design and architect solutions based on Analytics services in their enterprise cloud environments. With more than 10 years of experience in Analytics, Reekunj helps organizations build secure, resilient architectures.

Ishan Sharma

Ishan Sharma

Ishan is a Cloud Support Engineer at Amazon Web Services and an Amazon EMR subject matter expert. He specializes in helping enterprise customers troubleshoot, optimize, and architect solutions across Amazon EMR and big data technologies. Ishan works closely with organizations to design and operate reliable, high-performance data processing workloads in the cloud.

Ram Nethi

Ram Nethi

Ram is a Senior Solutions Architect at Amazon Web Services, specializing in generative AI, agentic AI architectures, big data, cloud migrations, and application modernization. He guides enterprise and strategic customers across industry domains from legacy environments to production-ready AI workloads on AWS, designing scalable solutions that span infrastructure, DevOps automation, cybersecurity, and end-to-end cloud-native architectures.

Optimizing Apache HBase availability on Amazon EMR, Part 1: Coordinator startup, RegionServer recovery, and regions in transition

Post Syndicated from Reekunj Parmar original https://aws.amazon.com/blogs/big-data/optimizing-apache-hbase-availability-on-amazon-emr-part-1-coordinator-startup-regionserver-recovery-and-regions-in-transition/

Running Apache HBase on Amazon EMR gives you a scalable, high-performance NoSQL store, and following well-understood operational patterns can help improve availability. The most common availability conditions each leave a reliable signature. With the right process, you can more efficiently identify the cause and restore the cluster to full health.

This post gives you that repeatable process for three situations you are most likely to meet: an HBase coordinator that is slow to finish initializing, a RegionServer that leaves the cluster, and regions that stay in transition longer than expected. For each one, you learn which web UI pages, commands, and log messages point you to the cause, and which actions can help resolve it.

This is the first post in a two-part series on operating Apache HBase on Amazon EMR.

  • Part 1 (this post) covers the triage framework and availability topics: an HBase coordinator that is slow to start, a RegionServer that leaves the cluster, and AWS Regions that stay in transition (RIT).
  • Part 2 covers performance: diagnosing and tuning compaction, the parameters worth changing, and knowing when to engage AWS Support.

What this post covers:

  • How to restore an HBase coordinator that is slow to start or finish initializing.
  • How to recover a RegionServer that stopped or won’t rejoin the cluster.
  • How to resolve regions that stay in transition (RIT).
  • The tools to diagnose each situation, and when each tool is the right one to reach for.

What this post doesn’t cover:

  • Performance tuning during major compaction (see Part 2).
  • Cluster sizing, schema and row key design, or capacity planning.
  • Backup, restore, snapshot, and disaster recovery procedures.
  • Security configuration such as Kerberos, encryption, and authorization.

This post is written for operations teams, data engineers, HBase administrators, site reliability engineers (SREs), and support engineers. These are the people who operate HBase clusters on Amazon EMR and want a repeatable process for keeping them healthy.

If you’re evaluating whether to run HBase on Amazon EMR, or designing a new cluster, start with the Apache HBase on Amazon EMR documentation and the Amazon EMR best practices guide instead.

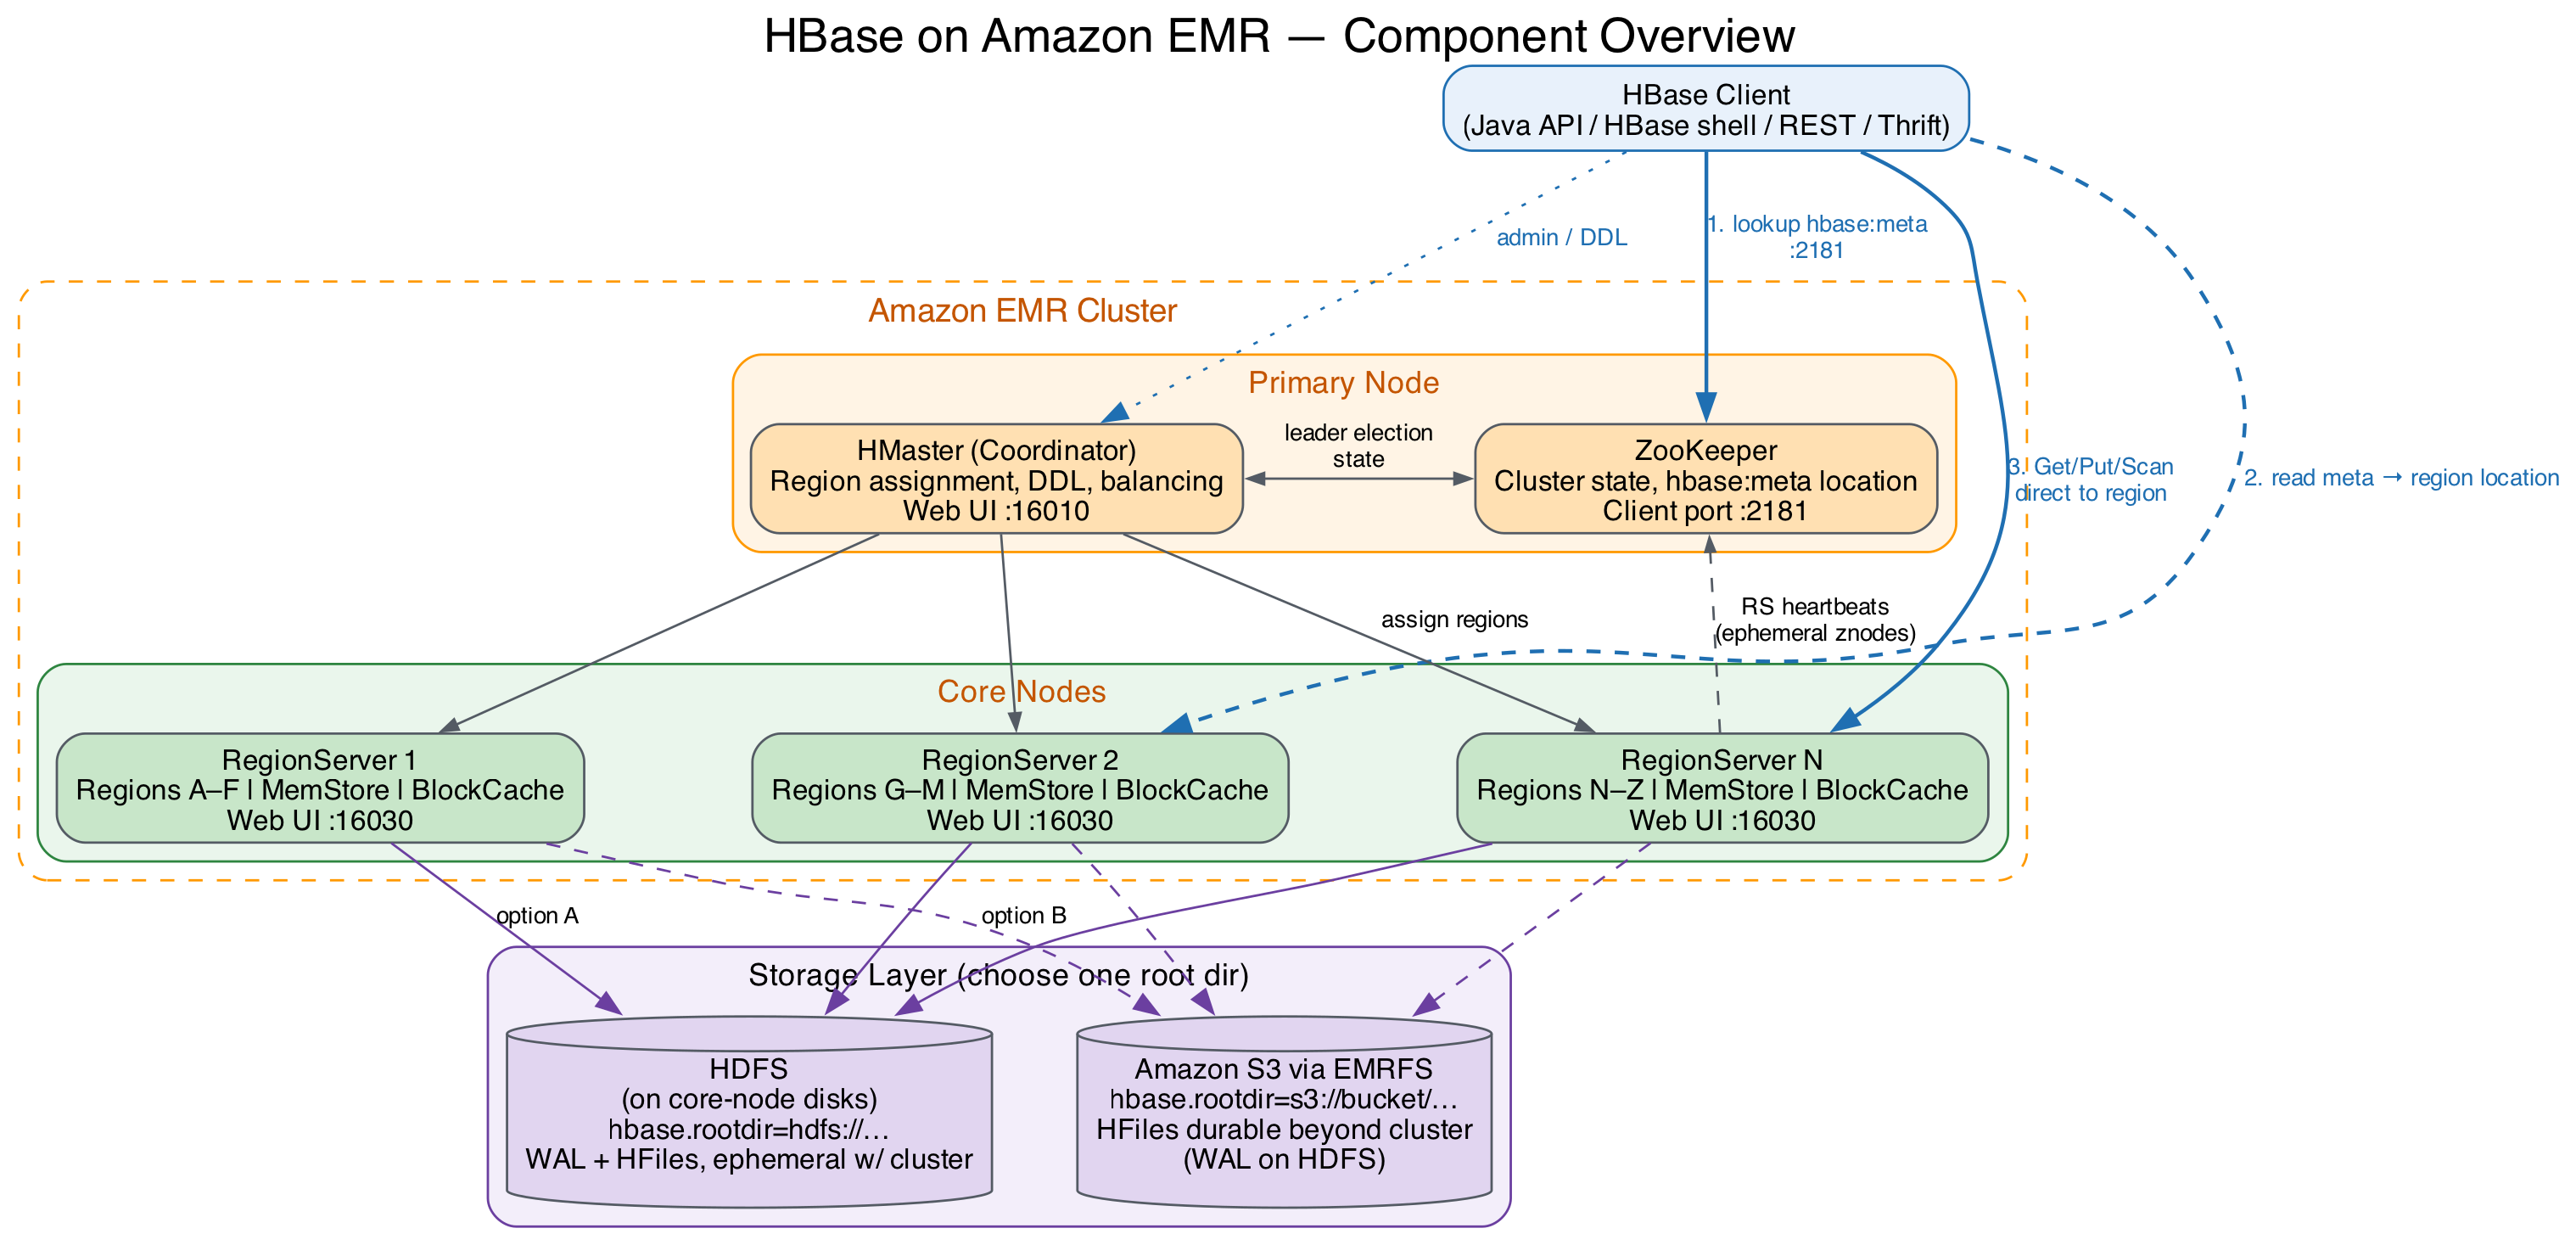
Port reference for HBase on Amazon EMR showing the HMaster, RegionServer, and ZooKeeper ports

Figure 1: HBase on Amazon EMR port reference, where 16010 is the HMaster (coordinator) web UI, 16030 is the RegionServer web UI, and 2181 is the ZooKeeper client port

Terminology

Apache HBase names the process that coordinates the cluster HMaster, and Amazon EMR runs it on the primary node. This post refers to it as the HBase coordinator. Names that contain master, such as the hbase-master service and the hbase-hbase-master-*.log log files, appear only in commands and log output, where you need the exact name.

In HBase, a Region is a range of rows in a table, and a RegionServer is the process that serves regions. Neither is related to an AWS Region.

Prerequisites

Before you begin, make sure you have the following access in place:

  • HBase web UI (coordinator on port 16010, RegionServer on port 16030): shows live RegionServers, failed RegionServers, and regions in transition. Reach it through an SSH tunnel or the Amazon EMR persistent application user interfaces.
  • SSH access to the primary and core nodes: needed for logs, the HBase shell, and every Level 2 and Level 3 step. See Connect to the primary node using SSH.
  • Read access to /var/log and the Amazon S3 log URI: covers coordinator, RegionServer, ZooKeeper, and Hadoop Distributed File System (HDFS) logs. The Amazon Simple Storage Service (Amazon S3) copy matters when a node has been replaced.
  • Permission to run the HBase shell as the hbase user: use sudo -u hbase hbase shell to keep file ownership consistent.

This post assumes you are familiar with the following:

  • Amazon EMR architecture (primary, core, and task nodes).
  • HBase components (the coordinator process, RegionServers, ZooKeeper, write-ahead log (WAL), MemStore, HFiles, and the hbase:meta table).
  • Your storage mode (HDFS or Amazon S3).
  • Common Linux command line tools.

Before you start, confirm your Amazon EMR release and storage mode:

grep -A2 "hbase.rootdir" /etc/hbase/conf/hbase-site.xml

An s3:// or s3a:// value means you are running HBase on Amazon S3. Log paths, default values, and the correct repair tool all depend on your release and storage mode.

Three levels of troubleshooting

Start with the checks that need the least access, and move to the next level only if you need more information.

  • Level 1 (read-only checks): Web UI, shell commands, and console events. Safe to run anytime, with no cluster impact.
  • Level 2 (intermediate diagnostics): Log analysis, process inspection, and disk and memory checks. Still non-destructive, but requires SSH access.
  • Level 3 (advanced intervention): Thread dumps, heap analysis, and HBCK2 repairs. These can change cluster state, so take a snapshot first and change one thing at a time.
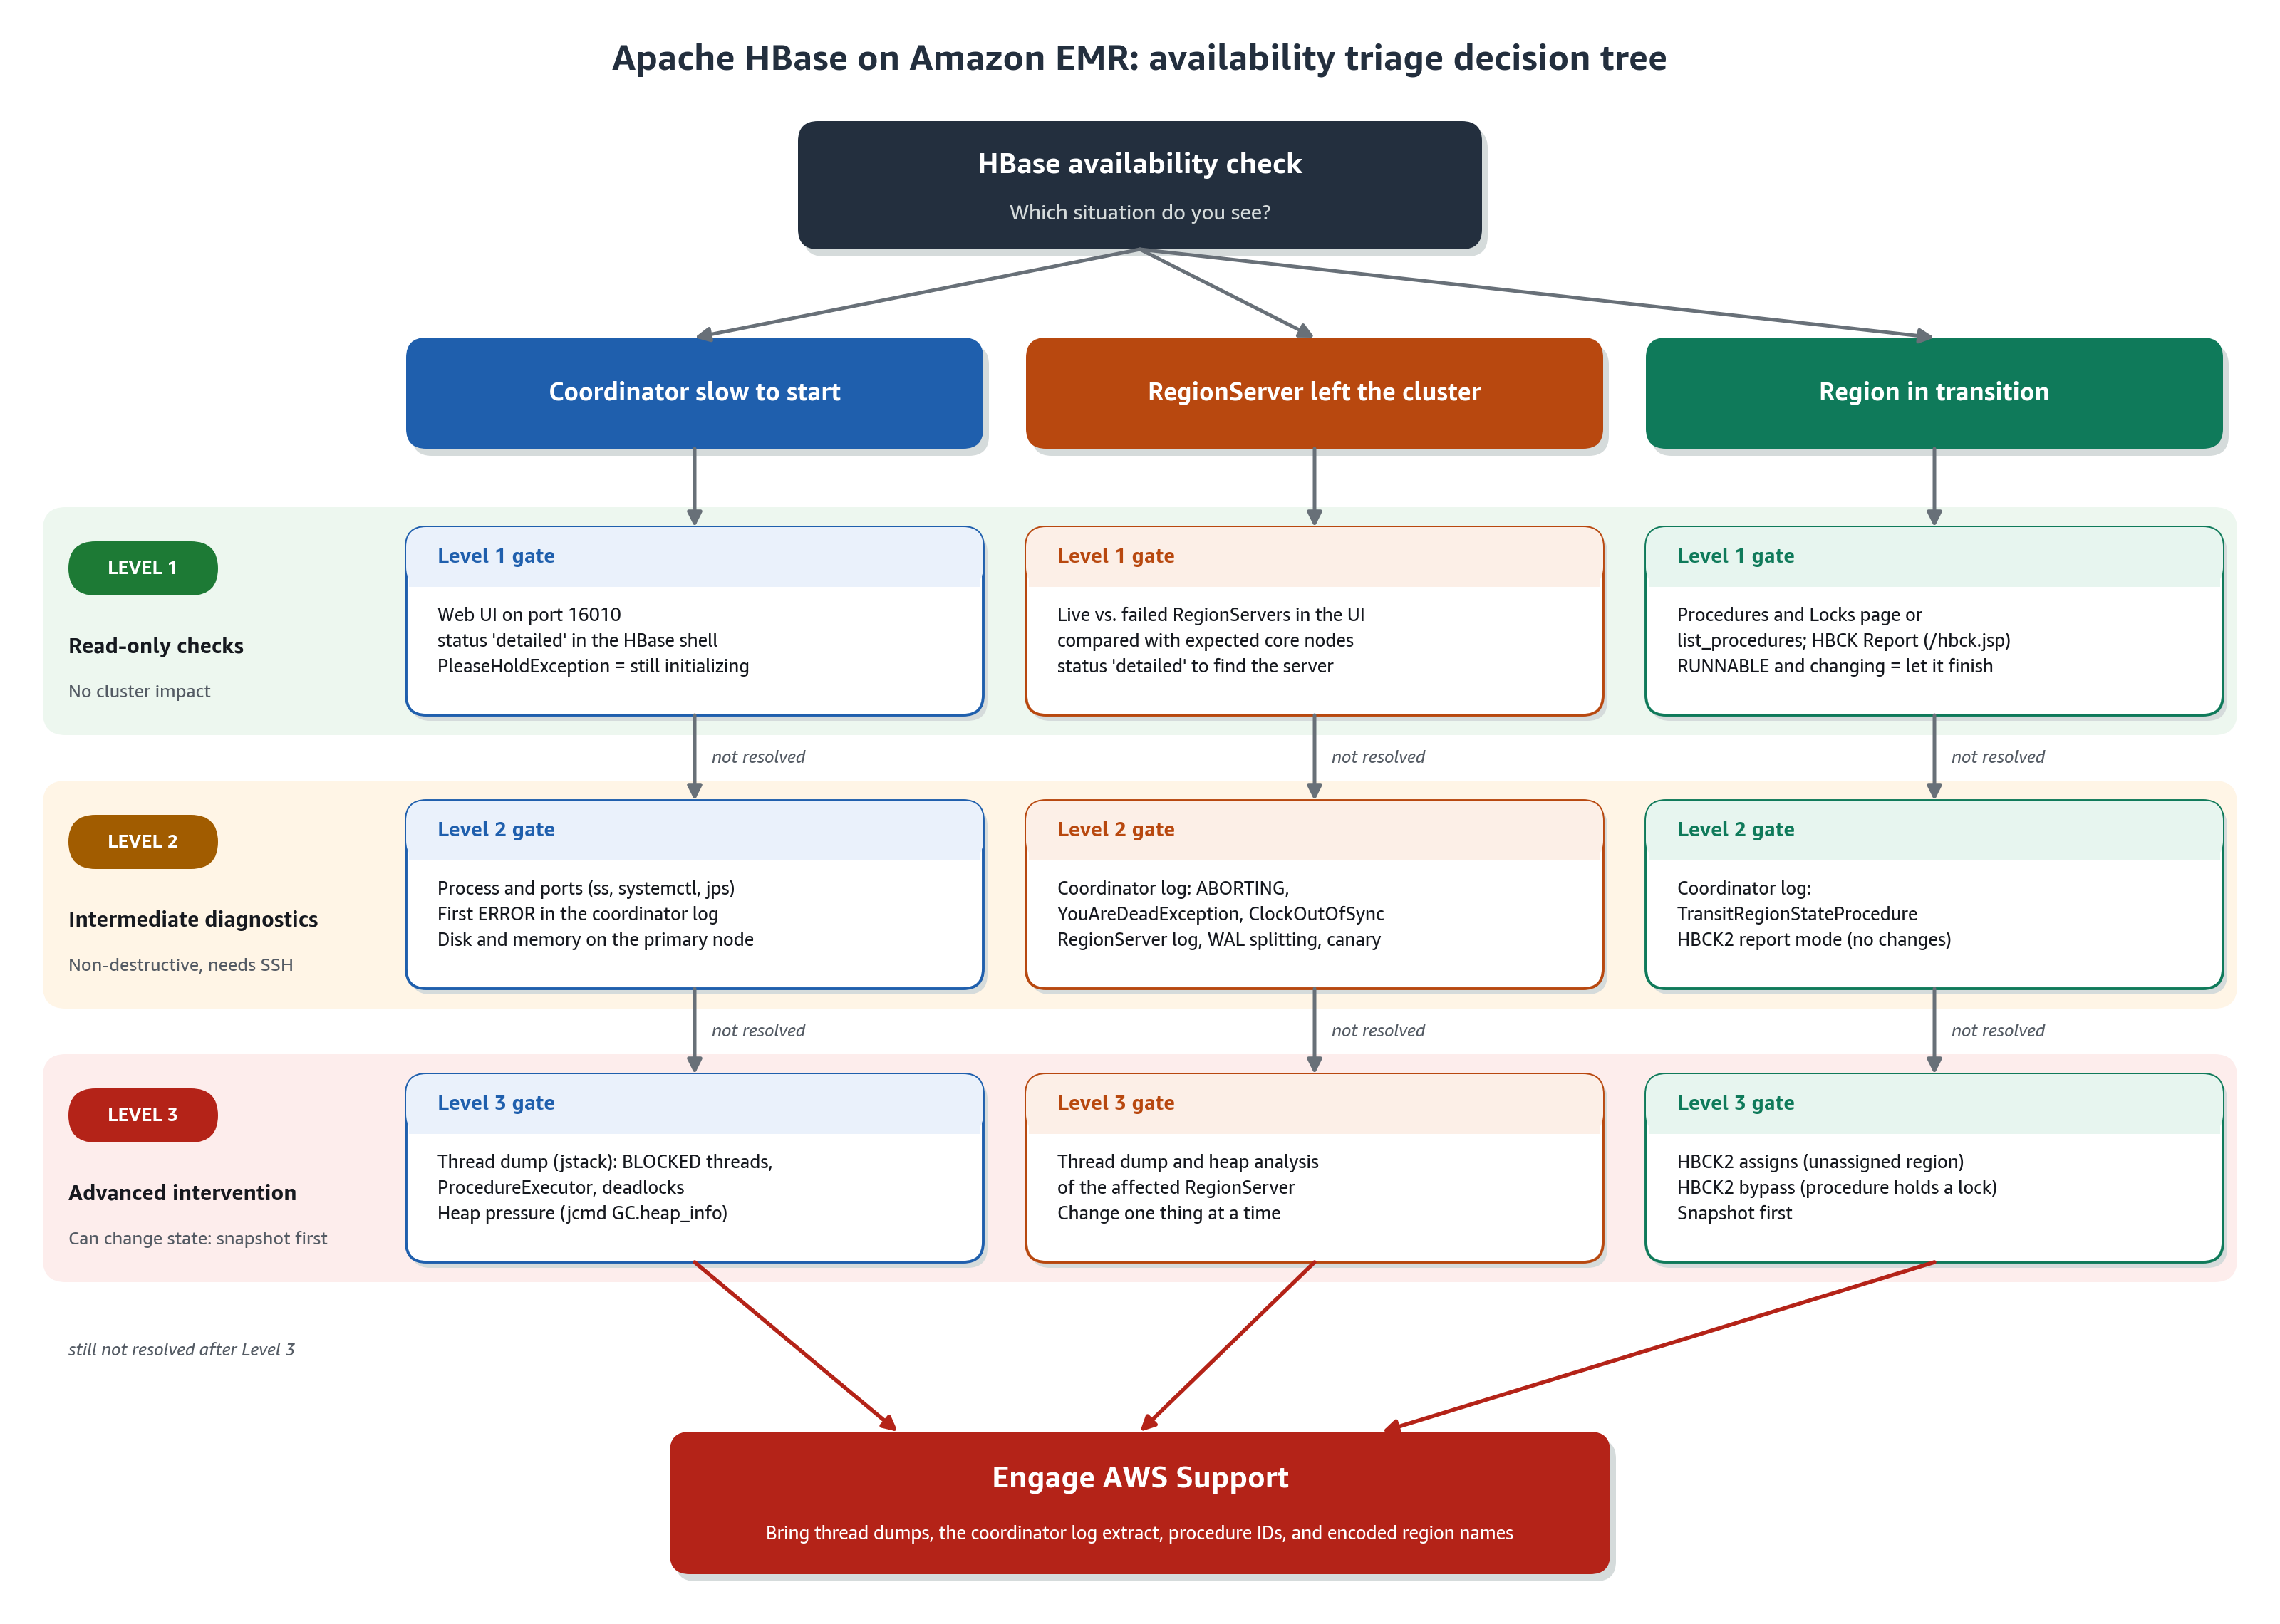
HBase availability triage decision tree branching into three situations, each passing through Level 1, Level 2, and Level 3 gates

Figure 2: HBase availability triage decision tree, where each of the three situations flows through a Level 1 read-only gate, a Level 2 diagnostics gate, and a Level 3 intervention gate before you engage AWS Support

Restore an HBase coordinator that is slow to start

The HBase coordinator runs on the Amazon EMR primary node and handles region assignments, RegionServer health monitoring, and failover. While the coordinator in your HBase cluster initializes, your RegionServers keep serving the regions they already host, so your clients can continue to read from and write to those regions. Until the coordinator finishes initializing, your HBase cluster can’t start new work, such as reassigning regions or recovering from a RegionServer loss. You also can’t run administrative operations such as creating a table. Your goal is to bring it to a fully initialized state quickly.

A coordinator that is slow to finish starting usually points to one of these areas: HDFS, the Java virtual machine (JVM), ZooKeeper, Amazon S3 throttling, or a known Apache HBase behavior already addressed in a later release.

Step 1 (Level 1): Confirm the current state

These checks are read-only.

  • Check the HBase web UI on port 16010. If it loads, the coordinator process is running. A coordinator that is running but reports Initializing for a long time usually means the coordinator cannot assign hbase:meta. You troubleshoot this situation differently from one where the coordinator is not running at all.
  • Check cluster status from the shell:
    sudo -u hbase hbase shell
    hbase> status 'simple'
    hbase> status 'detailed'

    If this returns a PleaseHoldException, the coordinator is running but has not finished initializing. If no coordinator is found, go to Level 2.

  • Identify the active coordinator (on a cluster with multiple primary nodes):
    sudo -u hbase hbase zkcli get /hbase/master

  • Review cluster events and the Amazon EMR console. Note when the coordinator stopped responding, and whether an instance event, scaling action, or configuration change lines up with it.

Step 2 (Level 2): Check the process, ports, and resources

This helps you tell “the coordinator is not running” apart from “I cannot reach the coordinator”:

sudo ss -lntp | grep -E "16000|16010|2181"

# Amazon EMR 6.x and 7.x (systemd)
sudo systemctl status hbase-master
sudo journalctl -u hbase-master --since "1 hour ago" | tail -50

# Confirm the JVM exists
sudo jps -l | grep -i master

A process ID (PID) that changes each time you check tells you the coordinator is restarting repeatedly. That is a useful signal, because the explanation sits at the end of each log cycle.

  • Find the first error in the coordinator log (hbase-hbase-master-*.log):
    grep -n -E "ERROR|FATAL|WARN" /var/log/hbase/hbase-hbase-master-*.log | head -40

  • Check resources. A full disk on the primary node often causes this problem, so check disk usage early:
    df -h / /mnt /emr
    free -m
    top -b -n1 | head -20

  • Search for known log signatures. See the Quick reference table at the end of this post.

Log locations (see View Amazon EMR log files):

  • HBase logs are in /var/log/hbase/.
  • ZooKeeper logs in /var/log/zookeeper/.
  • HDFS logs in /var/log/hadoop-hdfs/.
  • Archived copies are in /mnt/var/log/ and in the Amazon S3 log URI under <cluster-id>/node/<instance-id>/applications/hbase/.

Confirm the paths with ls /var/log on your cluster, because they have varied across releases.

Step 3 (Level 3): Inspect a coordinator that is running but not yet progressing

When the coordinator is running but has not yet made progress, and the log hasn’t pointed you to a cause, SSH into the primary node for a deeper look.

  • Take a thread dump of the coordinator. Capture the process ID first:
    COORD_PID=$(sudo jps -l | grep -i master | awk '{print $1}')
    sudo -u hbase jstack -l "$COORD_PID" > /tmp/hbase-coordinator-jstack-$(date +%s).txt

    Look for BLOCKED threads, threads named ProcedureExecutor, and any deadlock section.

  • Check heap pressure:
    # Check heap usage without pausing the JVM; confirms whether memory pressure is destabilizing the coordinator
    sudo -u hbase jcmd "$COORD_PID" GC.heap_info
    
    # Capture a full heap dump for offline analysis; use only when GC pressure is confirmed.
    # Pauses the JVM while the file is written.
    sudo -u hbase jmap -dump:format=b,file=/tmp/hbase-coordinator-heap-$(date +%s).hprof "$COORD_PID"

Heap dumps are expensive. A full heap dump with jmap -dump pauses the JVM for as long as it takes to write the file. The jmap -histo:live command also pauses the JVM, because the :live option forces a full garbage collection before it builds the histogram. On a large coordinator heap, that pause can be noticeable, so treat jmap -histo:live as a Level 3 action. The jcmd GC.heap_info check shown earlier doesn’t pause the JVM.

HDFS and the NameNode

In HDFS storage mode, the coordinator doesn’t finish initializing until HDFS is fully available:

hdfs dfsadmin -safemode get
hdfs dfsadmin -report | head -20
hdfs fsck /user/hbase -files -blocks | tail -40

Check the NameNode logs in /var/log/hadoop-hdfs/. On clusters with multiple primary nodes, also check the standby NameNode. Check the DataNodes for missing blocks or full disks as well.

Log signatures to look for include SafeModeException, BlockMissingException, cannot obtain block length for LocatedBlock, and NoRouteToHostException. Resolve HDFS first, then restart the coordinator.

JVM and garbage collection

The coordinator runs as a JVM, so garbage collection (GC) pauses can cause it to lose its ZooKeeper session and trigger a failover:

grep -E "JvmPauseMonitor|Detected pause in JVM" /var/log/hbase/hbase-hbase-master-*.log | tail -20

Occasional sub-second pauses are normal. Repeated multi-second pauses are what to address. If the heap is undersized, raise the coordinator heap through the hbase-env configuration classification, and review the GC log configuration in /etc/hbase/conf/hbase-env.sh. Treat repeated failovers caused by pauses as a capacity signal.

ZooKeeper

HBase uses Apache ZooKeeper for coordinator election, RegionServer registration, and startup coordination, so a ZooKeeper condition often affects several components at once:

grep -E "SessionExpired|ConnectionLoss|KeeperErrorCode|Client session timed out|has no quorum" \
/var/log/hbase/hbase-hbase-master-*.log /var/log/zookeeper/*.out | tail -30

Inspect the HBase znodes if needed:

sudo -u hbase hbase zkcli ls /hbase
sudo -u hbase hbase zkcli ls /hbase/rs

Resolve the ZooKeeper condition before you restart the coordinator.

Warning: Don’t delete HBase znodes. Removing /hbase or its children can discard the region assignment state that HBase needs in order to recover, which makes recovery significantly harder. Engage AWS Support if you need help with the HBase ZooKeeper state.

Amazon S3 request throttling

This section applies to HBase on Amazon S3 only. If the coordinator log shows the following, Amazon S3 is throttling your requests:

java.io.IOException: Slow Down (Service: Amazon S3; Status Code: 503; Error Code: 503 Slow Down)

Step 1: Confirm it is throttling by counting occurrences rather than reacting to a single line:

grep -c "Slow Down" /var/log/hbase/hbase-hbase-master-*.log
grep -E "503 Slow Down|500 Internal Error|AmazonS3Exception" \
/var/log/hbase/hbase-hbase-*.log | awk '{print $1, $2}' | uniq -c | tail -20

Step 2: Increase the EMRFS retry limit. By default, EMRFS uses an exponential backoff strategy and retries Amazon S3 requests up to 15 times. Raise the limit through the emrfs-site configuration classification:

[
  {
    "Classification": "emrfs-site",
    "Properties": {
      "fs.s3.maxRetries": "30"
    }
  }
]

For large clusters, you can instead turn on the additive-increase/multiplicative-decrease (AIMD) retry strategy. It’s supported on Amazon EMR releases 6.4.0 and later, and it adapts the request rate based on recent successful requests. For details on both strategies, see Retry Amazon S3 requests with EMRFS. A higher retry limit helps during short periods of throttling. If throttling is continuous, additional retries convert errors into latency, so also reduce the request rate as described in Step 3.

Step 3: Reduce or spread the request rate. Lower compaction pressure (covered in Part 2 of this series). Make sure the local block cache is working so that reads don’t go to Amazon S3 unnecessarily, and spread load across prefixes. See Resolve HTTP 503 “Slow Down” AmazonS3Exception in Amazon EMR and Best practices design patterns: optimizing Amazon S3 performance.

Check whether a later release includes a fix

Before you begin a deep investigation, check whether your symptom is a known bug already fixed in a later release. Read the “Changes, enhancements, and resolved issues” section of the Amazon EMR release guide for releases after yours. Then search for the exact exception in the Apache HBase JIRA. Search for the exception class and the stack trace, because many different causes can produce the same symptom.

Keep RegionServers healthy and recover them quickly

RegionServers host the regions that serve client reads and writes. If a RegionServer leaves your cluster, you are responsible for confirming that the HBase coordinator on your primary node moved that server’s regions to your remaining RegionServers, finding out why the server left, and taking steps to prevent a repeat. Read the coordinator log before the RegionServer log, because the coordinator records why it marked the server as gone, and that is the most direct path to the root cause.

Recover a RegionServer that stopped or won’t rejoin the cluster

Step 1 (Level 1): In the HBase web UI, compare the live and failed RegionServer lists against the number of core nodes you expect. Run status 'detailed' to see which server stopped reporting, so you know exactly where to focus.

Step 2 (Level 2): Read the coordinator log first:

grep -E "ABORTING|YouAreDeadException|ClockOutOfSyncException|ServerCrashProcedure|expired" \
/var/log/hbase/hbase-hbase-master-*.log | tail -40

A RegionServer writes ABORTING to its log when it shuts itself down after a fatal error. A YouAreDeadException means the ZooKeeper session expired, usually because of a GC pause. A ClockOutOfSyncException means there is time skew between nodes, so check the time service.

Then read that server’s own log on the core node:

grep -E "ERROR|FATAL|ABORTING|Detected pause in JVM" \
/var/log/hbase/hbase-hbase-regionserver-*.log | tail -40

In HDFS mode, check the DataNode for missing blocks or failed volumes. Check the node itself:

df -h
free -m

Check WAL splitting progress. Slow WAL splitting can make recovery appear to stall after a RegionServer is lost:

grep -E "SplitWALManager|SplitLogManager|WALSplitter|Error splitting" \
/var/log/hbase/hbase-hbase-master-*.log | tail -30

Use the canary tool to confirm which tables and regions are affected, instead of inferring it from client errors:

sudo -u hbase hbase canary            # one read per region, all tables
sudo -u hbase hbase canary my_table   # narrow to one table

The canary tool writes its results to the console, including each region that it couldn’t read, and saves a log of the results to /var/log/hbase/hbase.log.

Resolve regions that stay in transition (RIT)

A region enters transition state when your HBase cluster opens, closes, splits, or merges the region. HBase typically completes these transitions in seconds as part of normal cluster operations. If a region stays in transition for more than a few minutes, it is worth a closer look. One of these situations typically explains it:

  • A split was in progress when the RegionServer restarted.
  • A ZooKeeper session change occurred partway through.
  • The RegionServer JVM paused for GC, so the transition didn’t complete.
  • A coordinator failover happened during the transition.

Work through the following steps in order.

Step 1 (Level 1): Confirm it is still in transition. Check the UI and note the region, the duration, and the owning procedure from the Procedures and Locks page, or run list_procedures. If the procedure is RUNNABLE and its state changes between checks, let it finish.

Step 2 (Level 2): Find what is blocking it:

grep -E "RegionStateNode|TransitRegionStateProcedure|Unexpected state|holding-pattern" \
/var/log/hbase/hbase-hbase-master-*.log | tail -40

Inspect and report region and meta inconsistencies

If the region is still in transition, inspect and report inconsistencies before you attempt any repair.

Step 1 (Level 1): Confirm without changing anything. Open the HBCK Report tab in the HBase web UI (HBase 2.1.6 and later, at /hbck.jsp). Check the Regions in Transition list and the Procedures and Locks page. Confirm the table state:

hbase> describe 'my_table'
hbase> list_procedures

Step 2 (Level 2): Report the inconsistency. For Amazon EMR 6.x and 7.x (HBase 2.x), use HBCK2 in report mode through bin/hbase with the -j option.

Note: The HBCK2 jar path and version shown in the following commands are examples. Before you run these commands, verify the actual jar location and version on your cluster with find / -name "hbase-hbck2*.jar" 2>/dev/null.

# Report only: does not change anything
sudo -u hbase hbase hbck -j /usr/lib/hbase-operator-tools/hbase-hbck2-1.2.0.jar \
reportMissingRegionsInMeta default:my_table

sudo -u hbase hbase hbck -j /usr/lib/hbase-operator-tools/hbase-hbck2-1.2.0.jar \
extraRegionsInMeta default:my_table

For Amazon EMR 5.x (HBase 1.x), use sudo -u hbase hbase hbck -details to report state. Don’t run HBCK1 repair commands against Amazon EMR 6.x or 7.x clusters. HBCK1’s write facility (-fix) has been removed, and its assessments of an HBase 2.x cluster are inaccurate because it doesn’t understand the internal workings of HBase 2.x.

Step 3 (Level 3): Apply a targeted fix. If a region is unassigned, use HBCK2 assigns. If a procedure is holding a lock, use HBCK2 bypass. Take a snapshot first, and change one thing at a time.

Step 4 (Level 3): Escalate. If clearing znodes looks like the answer, open a case with AWS Support instead. Have your thread dumps, coordinator log extract, procedure IDs, and encoded region names ready.

Quick reference: Log signatures

Search for the first occurrence of a signature. The first error usually identifies the cause:

grep -m1 -n "Detected pause in JVM" /var/log/hbase/hbase-hbase-master-*.log
Log signature What it means Where to look next
SafeModeException HDFS is in safe mode Resolve HDFS. Check the NameNode logs
BlockMissingException Missing HDFS blocks Run hdfs fsck. Check the DataNodes
SessionExpired / ConnectionLoss ZooKeeper session lost Check the ZooKeeper logs and GC pauses
YouAreDeadException The RegionServer’s ZooKeeper session expired GC pause or network partition
ClockOutOfSyncException Time skew between nodes Check the Network Time Protocol (NTP) or time service
503 Slow Down Amazon S3 request throttling Increase EMRFS retries. Spread prefixes
JvmPauseMonitor / Detected pause in JVM GC pause Check heap sizing. Review the GC logs
PleaseHoldException The coordinator has not finished initializing Wait. Check whether hbase:meta can be assigned

Conclusion

In this post, you learned a repeatable way to keep Apache HBase on Amazon EMR highly available by resolving three common situations: a coordinator that is slow to initialize, a RegionServer that leaves the cluster, and regions that stay in transition. Start with the read-only Level 1 checks, use Level 2 log analysis to confirm the cause, and reach for the Level 3 tools only after you’ve confirmed it. Take a snapshot first and make one change at a time.

Part 2 of this series covers slow reads and writes caused by compaction: how to confirm that compaction is the cause, which parameters to tune first, and when to contact AWS Support.

Next steps:

  • Read Part 2 of this series for compaction tuning and guidance on when to contact AWS Support.
  • Review the HBase guidance in the Amazon EMR best practices guide.


About the authors

Reekunj Parmar

Reekunj Parmar

Reekunj is a Senior Technical Account Manager at Amazon Web Services, focused on Data Analytics. He works with customers to design and architect solutions based on Analytics services in their enterprise cloud environments. With more than 10 years of experience in Analytics, Reekunj helps organizations build secure, resilient architectures.

Ishan Sharma

Ishan Sharma

Ishan is a Cloud Support Engineer at Amazon Web Services and an Amazon EMR subject matter expert. He specializes in helping enterprise customers troubleshoot, optimize, and architect solutions across Amazon EMR and big data technologies. Ishan works closely with organizations to design and operate reliable, high-performance data processing workloads in the cloud.

Ram Nethi

Ram Nethi

Ram is a Senior Solutions Architect at Amazon Web Services, specializing in generative AI, agentic AI architectures, big data, cloud migrations, and application modernization. He guides enterprise and strategic customers across industry domains from legacy environments to production-ready AI workloads on AWS, designing scalable solutions that span infrastructure, DevOps automation, cybersecurity, and end-to-end cloud-native architectures.