Post Syndicated from Sahitya Pandiri original https://aws.amazon.com/blogs/big-data/send-personalized-email-reports-with-amazon-quicksight/
Amazon QuickSight now supports personalization of email reports by user, which allows you to send customized snapshots of data in either PDF or image formats. This allows you to create a single dashboard that you can configure to load with different defaults for each user, providing a customized view of the dashboard in both email and interactive formats. In this post, we walk you through how to roll out customized daily, weekly, or monthly reports for thousands of users – without any servers to set up or manage.
Solution overview
QuickSight supports personalized emails via row-level or column-level security, or dynamic defaults for parameters. You can use row-level or column-level security when you want to restrict data available on dashboards by user, and only present data that they are authorized to see. Dynamic defaults, on the other hand, allow users to access all the data but make sure that each user gets a personalized view without data restrictions if they wish to browse other views of the data.
When used with emails, both models allow you to provide personalized email reports for each user. Dynamic defaults, however, also allow you to handle conditional rendering of visuals using parameter settings that allow you to personalize dashboards and email reports by the user by showing and hiding visuals as needed.
Let’s start with the following example dashboard, which shows sales insights and trends across different segments, categories, and states for any given date.

This dashboard is built with the new free-form layout that allows you to build pixel-perfect dashboards. You can define visual placement with X and Y coordinates, define height and width of visuals at the pixel level, and overlay visuals if needed. In addition to flexible visual placements, you can also set background, borders on visuals and filter controls. To learn more about building dashboards with free-form layouts, see Create stunning, pixel perfect dashboards with the new free-form layout mode in Amazon QuickSight.
Personalizing your dashboard
You can further customize this view for your readers so it always shows insights relevant to them on the dashboard, email reports, and the PDF attached to the email.
To personalize the dashboard, create a data table with dynamic default rules similar to the following table. In this table, you need to have the following columns: UserID for QuickSight usernames of dashboard readers, followed by one column each for parameters to set defaults to. For example, after we apply the following dynamic defaults dataset to our sample dashboard, when Ben Brown with username [email protected] accesses the dashboard, it shows business metrics for the Strategic segment within Aluminium category and Washington state.

To apply this dynamic default table to the dashboard, complete the following steps:
- Create a dataset with your dynamic default table on QuickSight.
This can be a SPICE or direct query dataset depending on where the rules are and how frequently the rules are updated. If rules are maintained in your backend source tables and updated often, create a direct query dataset. If the rules are uploaded from a flat file or are maintained in your backend source tables but not updated often, you can keep them in SPICE and schedule a refresh if needed.
- Add the dynamic default dataset to the analysis.

- Navigate to the analysis you want to set default rules on.
- In the navigation pane, choose Parameters.
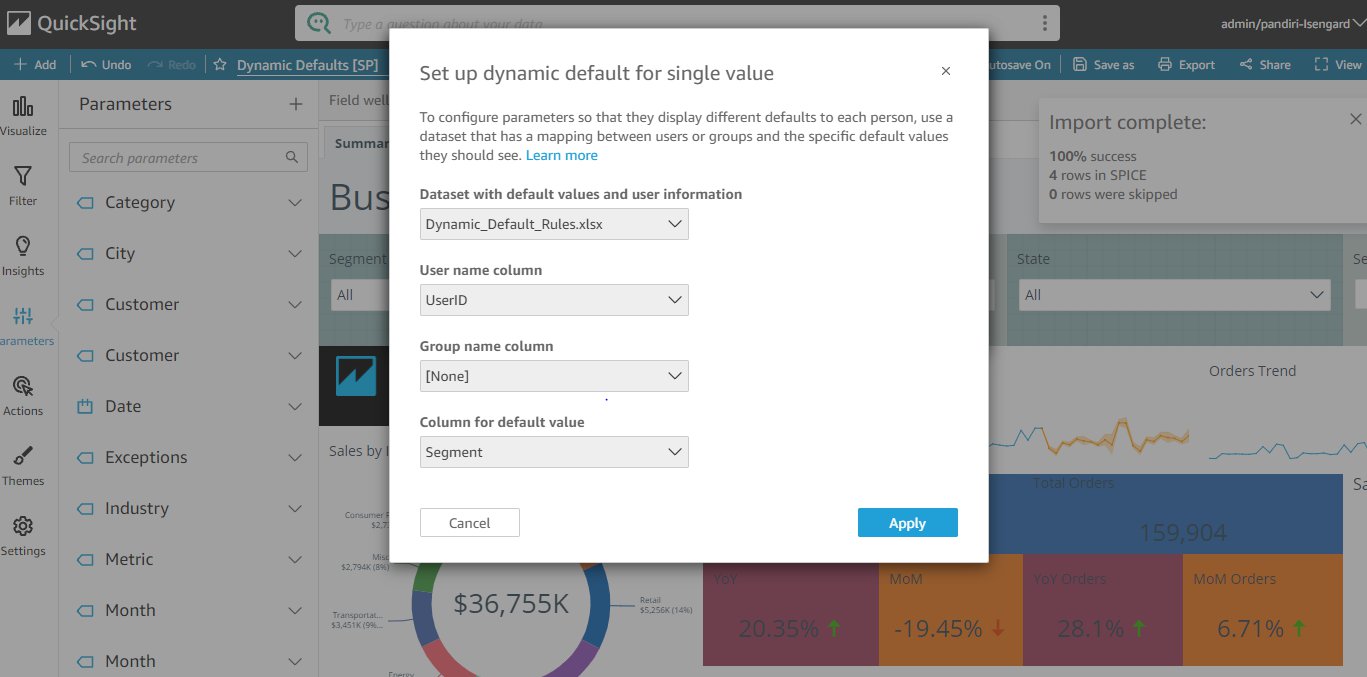
- Choose the parameter you want to set defaults on and choose Set a dynamic default.

- Configure dynamic defaults by choosing the rules dataset, and mapping the user name, group name, and default columns to those from the dataset.


You can set dynamic defaults for individual users and also user groups.
- Repeat these steps for all parameters you want to set dynamic defaults on.
You can also add these parameters within titles and subtitles for a personalized view so readers know what fields the dashboard is filtered by.
Show and hide visuals
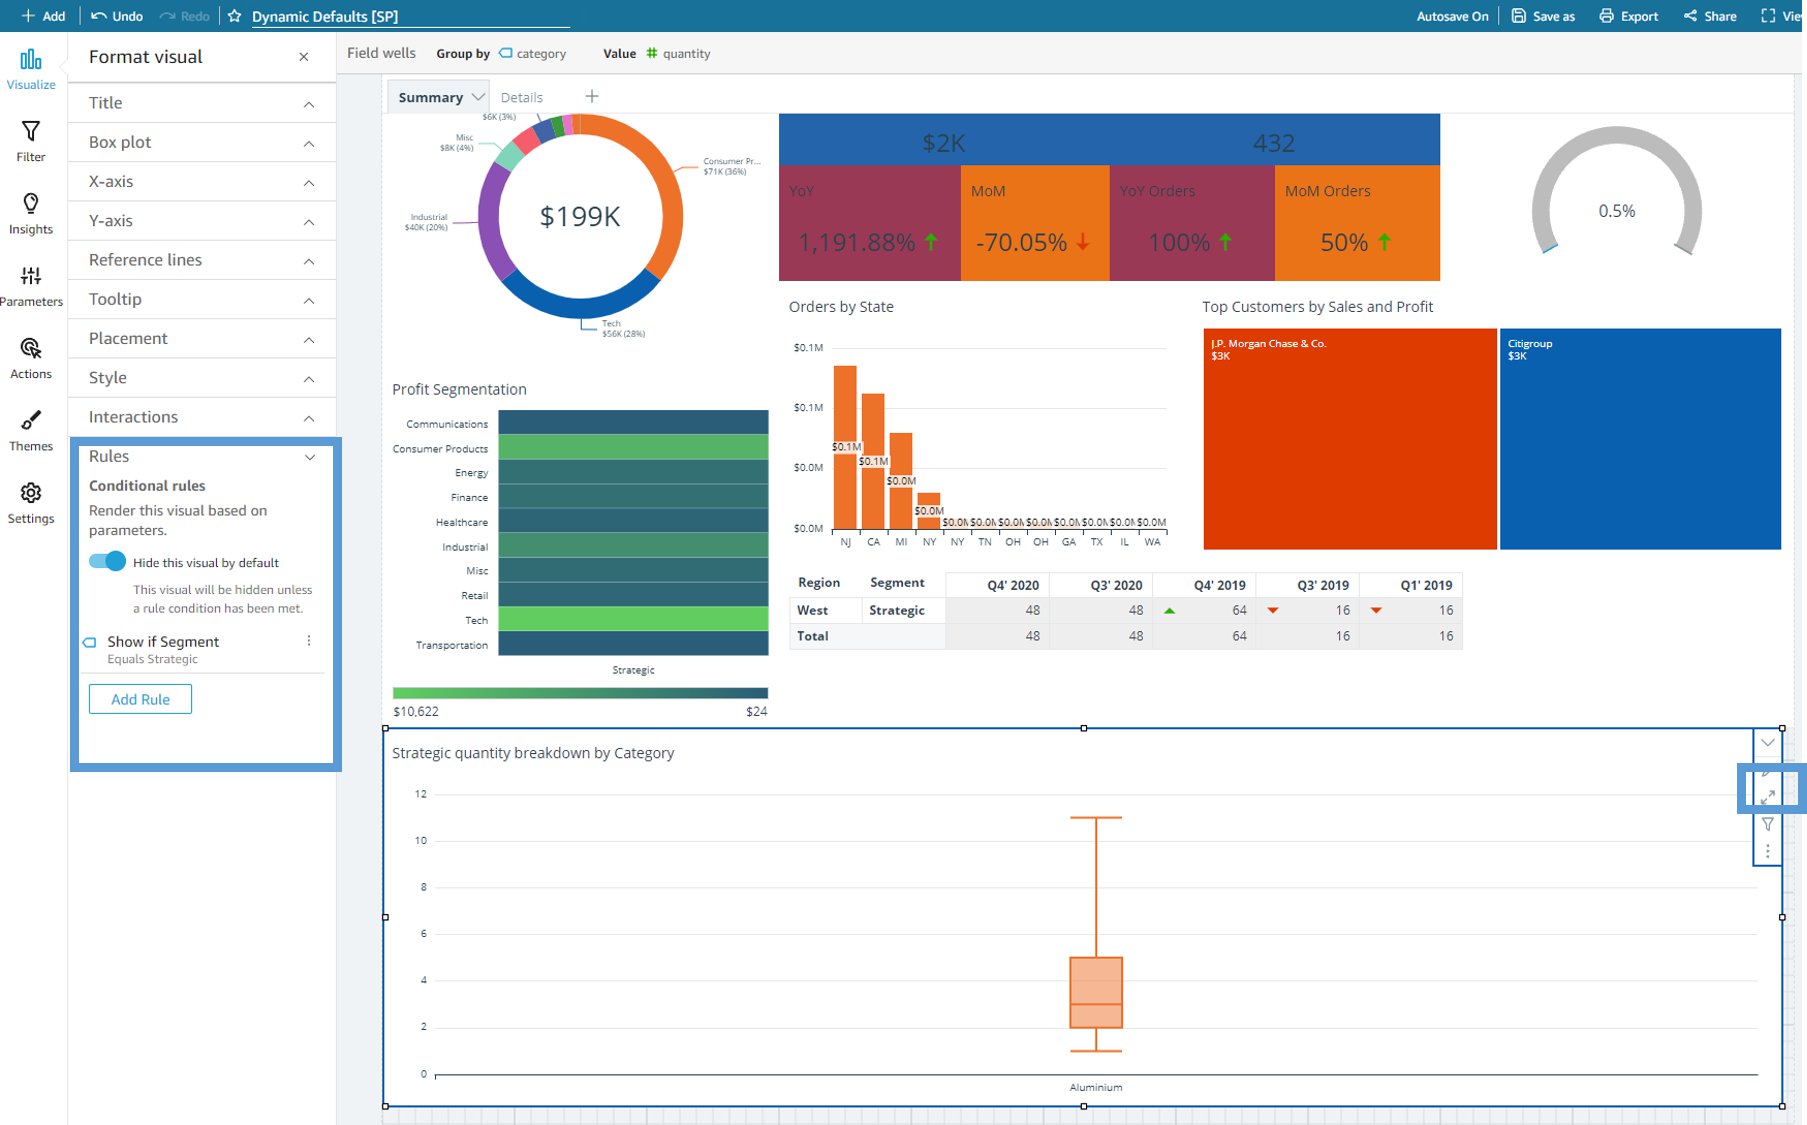
Additionally, you can conditionally show and hide visuals based on parameter values. You can use this in many creative ways, such as changing the visual type based on the parameter selected. For example, selecting Strategic as the segment could show a box plot of order quantity range grouped by Category. If you set the segment to SMB, you can replace the box plot with a different chart type. To conditionally show and hide visuals, complete the following steps:
- Create the visual you want to conditionally show and hide on the analysis.
- Click the pencil icon to edit the visual’s settings.
- Expand Rules and turn Hide this visual by default on.
In the following dashboard, the box plot is hidden by default, and is configured to show only when the segment parameter is set to Strategic.
- Similarly, create a scatter plot and configure the dashboard to hide this visual by default and only show when the segment parameter is set to
SMB. - Overlap this visual with the box plot visual so that either visual shows within this placement depending on the segment selected.


Publish and schedule email reports
Finally, publish the dashboard and share with all your readers, and schedule an email report and also configure to attach dashboard PDF to the report.
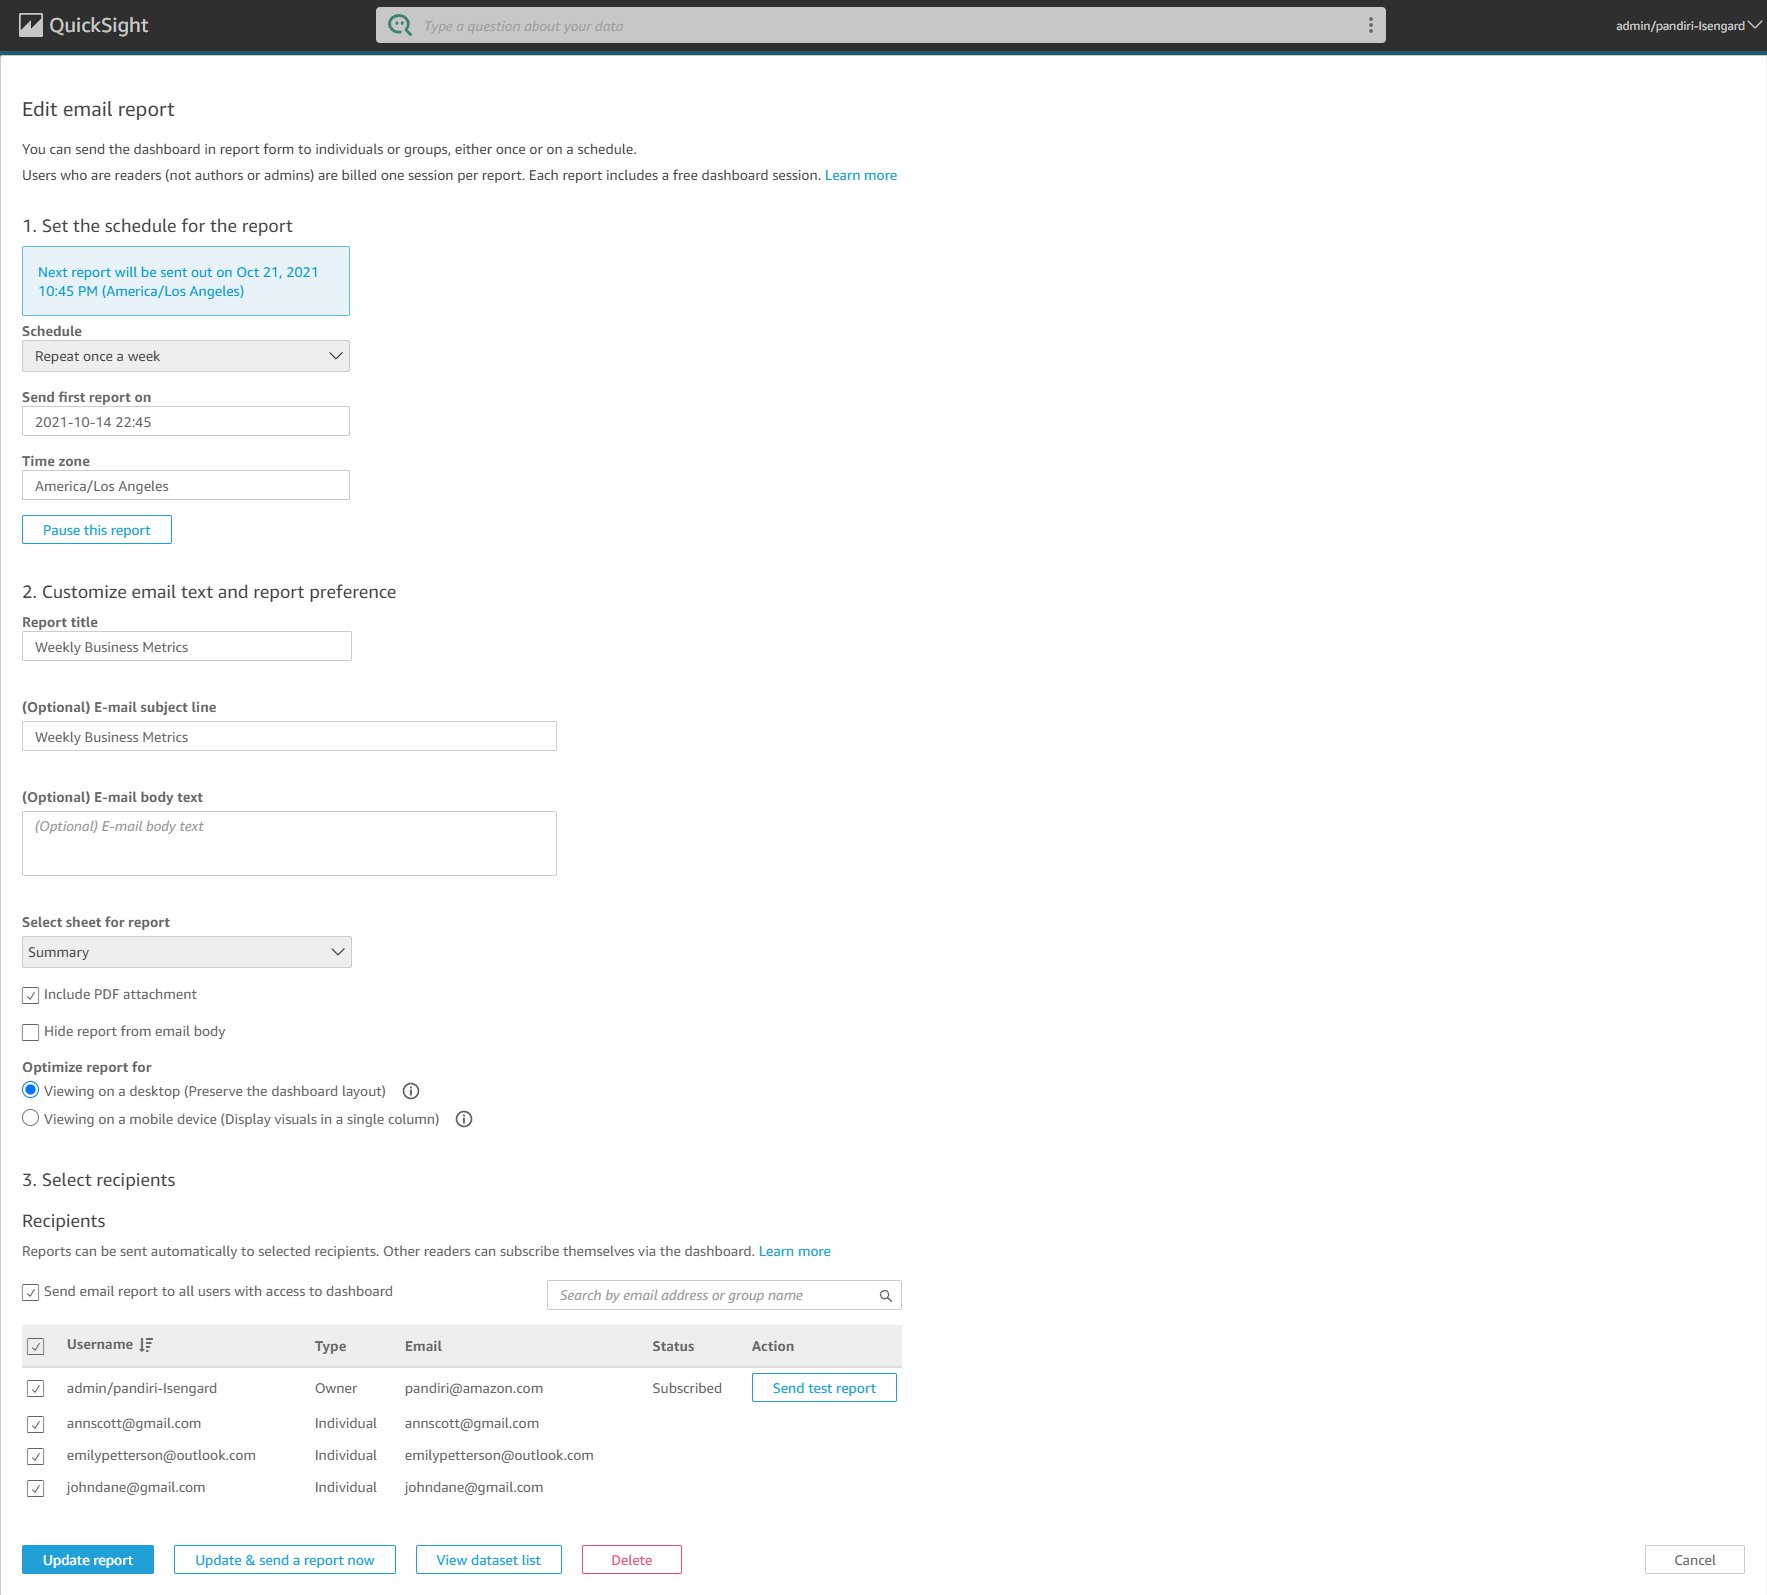
Readers now receive different views of the same dashboard, personalized to them, and showing metrics on the business sectors they care about.
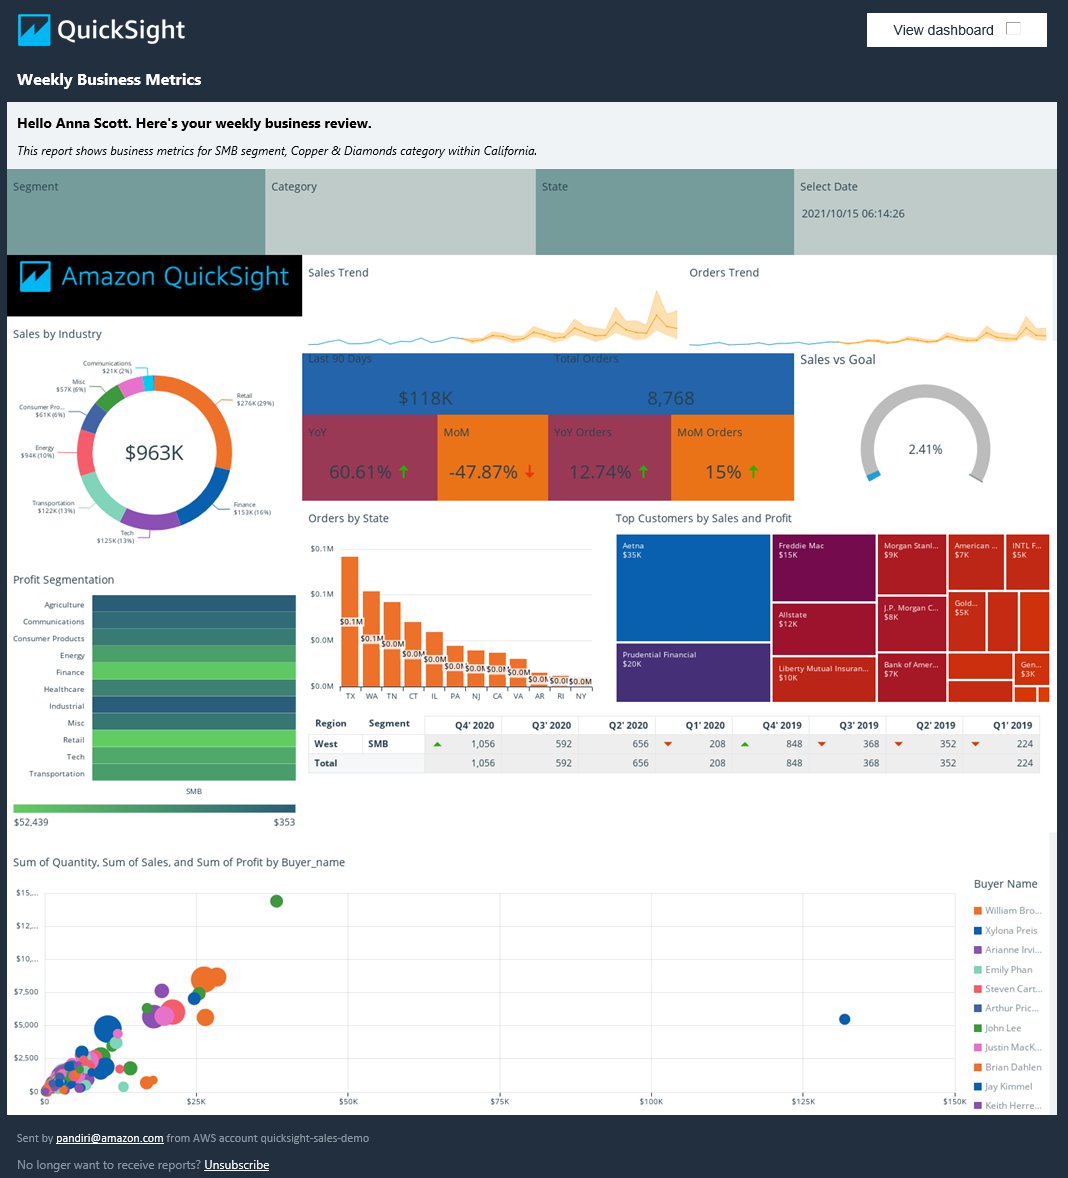
For our example dashboard, Ben Brown receives an email report with business metrics for the Strategic segment and Aluminum category within Washington.

Anna Scott receives an email report of the same dashboard with for the SMB segment, Copper & Diamond category, and California state.
Conclusion
With the support for dynamic defaults on email reports, free form layout, and condition rendering of visuals, QuickSight allows you to build and deliver custom dashboards with personalized insights with end-users, directly to their email inboxes.
Learn more about other core capabilities such as Natural Language Querying with QuickSight Q and Embedded Analytics here.
About the Author
 Sahitya Pandiri is a technical program manager with Amazon Web Services.