Post Syndicated from Sumitha AP original https://aws.amazon.com/blogs/big-data/use-analyticsiq-with-amazon-quicksight-to-gain-insights-for-your-business/
Decisions are made every day in your organization that impact your business. Making the right decision at the right moment can deeply impact your organization’s growth and your customers. Likewise, having the right data and tools that generate insights into the data can empower your organization’s leaders to make the right decisions.
In the healthcare industry where decisions directly impact an individual’s wellness, having the right data to generate the right insight into the individual experience through the lens of social determinants of health can greatly improve health outcomes and save lives. Understanding the unique social situations of the individuals they serve, from access to transportation, technology to economic, food security and more, allows healthcare providers to address disparities and give all their patients an equal opportunity to achieve their desired level of health.
For example, let’s say a healthcare organization or government agency wants to better understand the factors that affect public health in order to improve the quality of life for various ethnic groups, based on data.
In this post, we show you how to use AnalyticsIQ datasets and Amazon QuickSight to generate valuable insights that could improve your organization’s decision-making. we use the AnalyticsIQ Social Determinants of Health Sample Data dataset to gain insights into the relationship between ethnicity and health, as well as how the social determinants impact the health and wellness of individuals.
Solution overview
The following architecture diagram outlines the components of this solution:
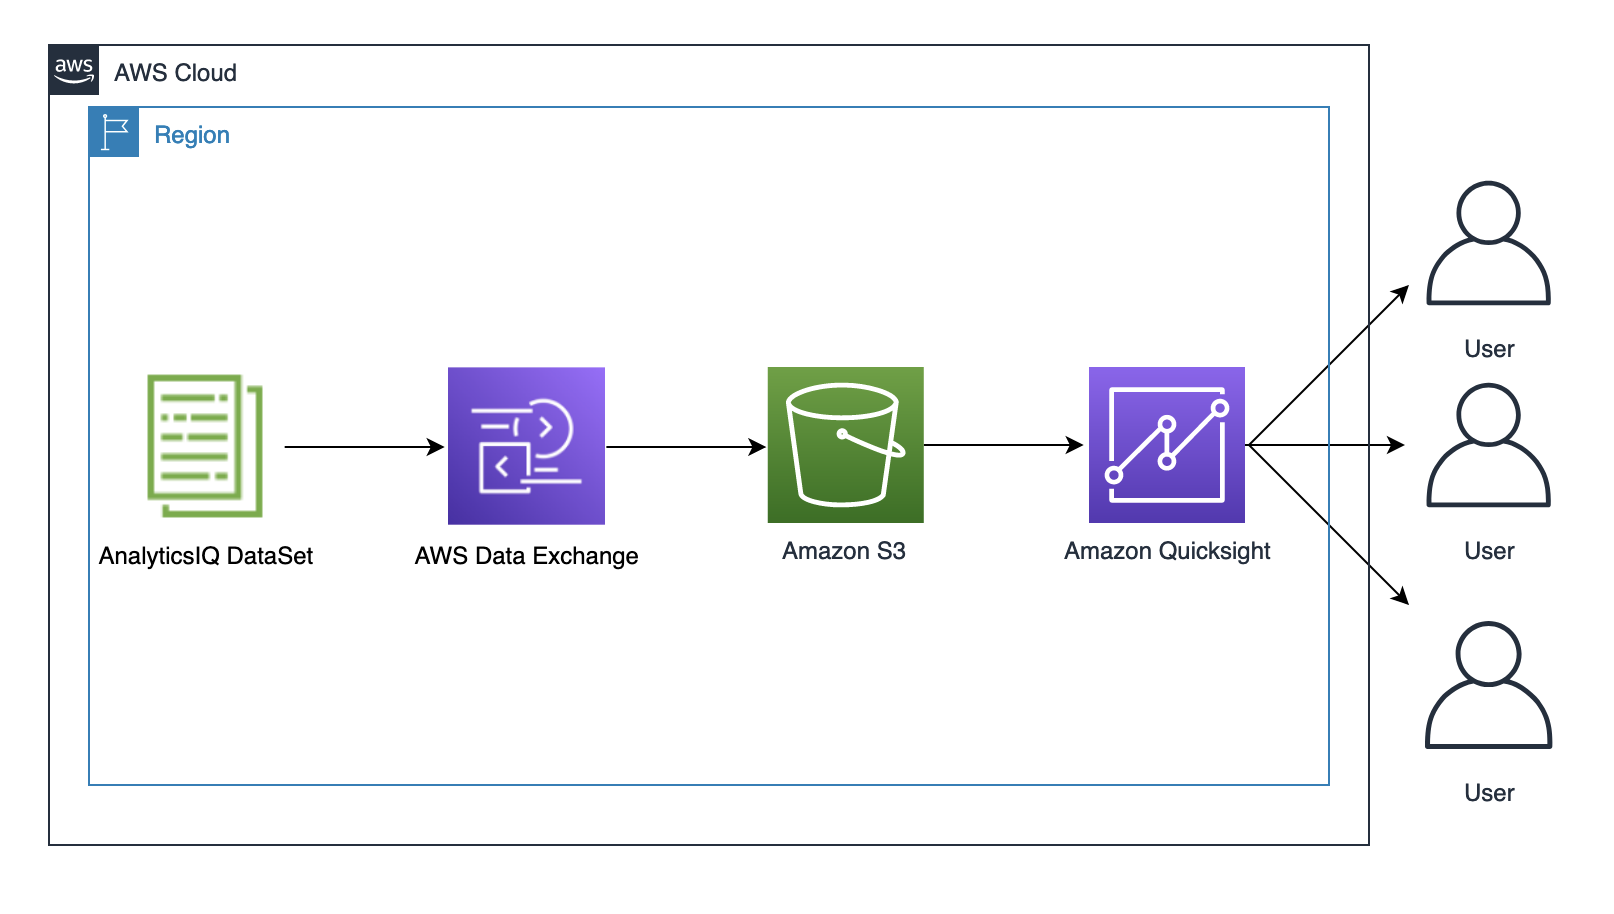
The solution consists of the following components:
- The AnalyticsIQ Social Determinants of Health Sample Data dataset to demonstrate an example of the impact of social determinants on health and wellness. This dataset is listed as AnalyticsIQ in the Extended Provider Program.
- AWS Data Exchange to subscribe to the sample AnalyticsIQ dataset from AWS Marketplace.
- An Amazon Simple Storage Service bucket to store the AnalyticsIQ sample dataset.
- QuickSight enterprise edition to generate visualizations using the sample dataset.
To implement the solution, you complete the following high-level steps:
- Export the dataset to an S3 bucket.
- Sign up for a QuickSight subscription.
- Create a QuickSight dataset.
- Create visualizations in QuickSight.
Prerequisites
To run this solution, you must have an AWS account. If you don’t already have one, you can create one.
Export the dataset to an S3 bucket
To start working with your dataset, you must subscribe to the dataset and then export the data to an S3 bucket. Complete the following steps:
- If you don’t already have a bucket, navigate to the Amazon S3 console, and choose Create bucket.
- Give a unique name for your bucket.
Make sure that you create the bucket in the us-east-1 Region.
- To subscribe to the sample dataset, follow this link. On the AWS Data Exchange console, choose Continue to subscribe.
- On the Complete subscription page, choose Subscribe.
- For Select Amazon S3 bucket folder destination, choose your S3 bucket.
The subscription process can take up to 2 minutes to complete.
- On the AWS Data Exchange Console, under My subscriptions in the navigation pane, choose Entitled Data.
- Under Products, expand Social Determinants of Health Sample Data – Offline, and choose the AnalyticsIQ sample dataset.
- On the Revisions tab, select the revision and choose Export to Amazon S3.

- Enter the name of the S3 bucket you created for this dataset.
- Leave the other options as default.
- Choose Export.

You can view the dataset in your S3 bucket under the prefix Sample-Data.
Sign up for a QuickSight subscription
To sign up for a QuickSight subscription, complete the following steps:
- On the AWS Management Console, open QuickSight.
- Choose Sign up for QuickSight and choose Enterprise.
- For QuickSight account name, enter a unique name.
- Enter a valid email.
- Under Allow access and autodiscovery for these resources, select Amazon S3 and choose Select S3 buckets.

- Choose the S3 bucket that you created earlier, and choose Finish.
- After your QuickSight account is created, choose Go to QuickSight account.

Create a QuickSight dataset
To create your dataset, complete the following steps:
- Using a local text editor, create a JSON file. Copy the following content and replace the placeholder with the name of the bucket that you created earlier:
- On the QuickSight console, choose New data set on the Datasets page.
- Choose S3.
- For DataSource, enter a name.
- Choose Upload and upload the JSON file.
- Choose Connect.
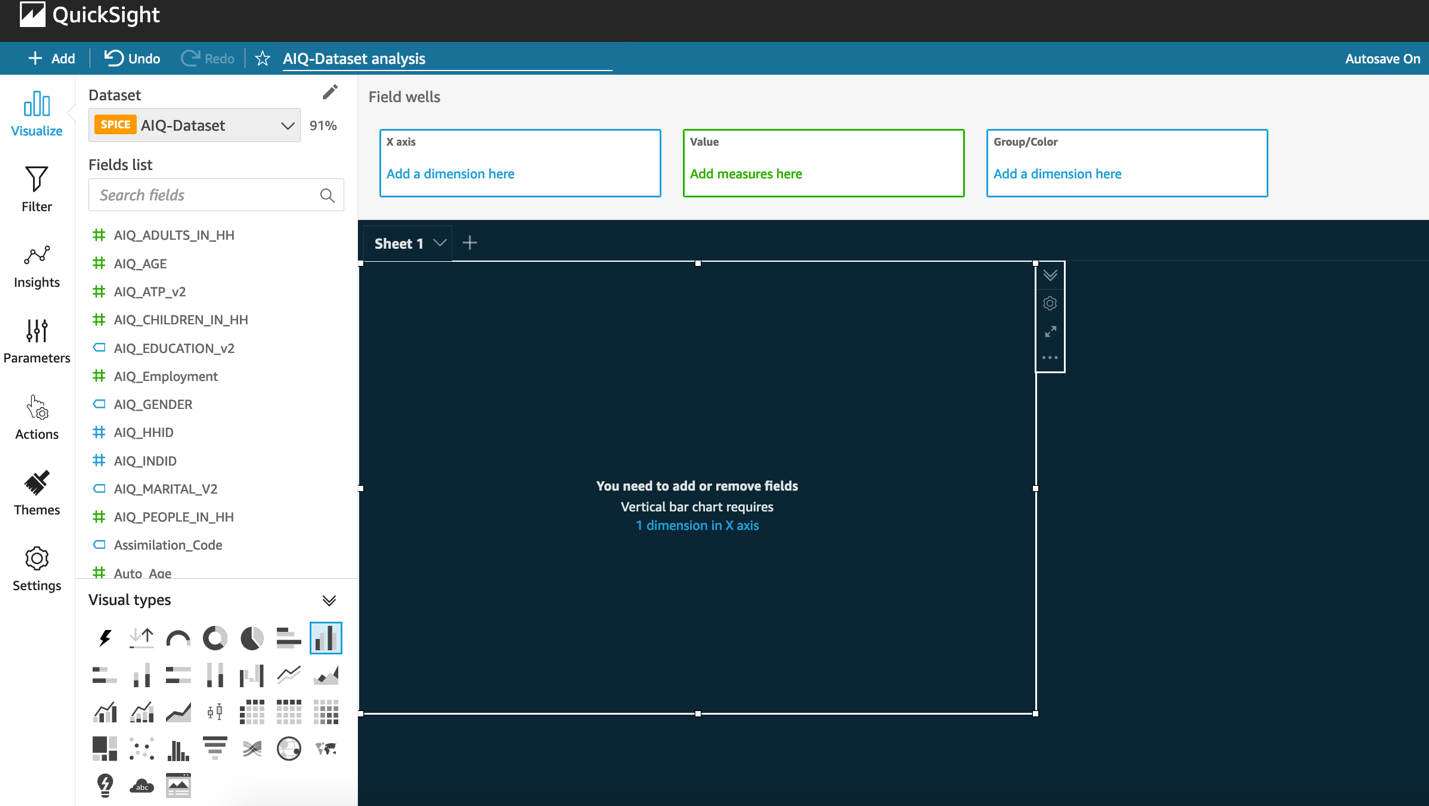
- Choose Visualize.
The following screenshot shows your imported sample data:

Create visualizations in QuickSight
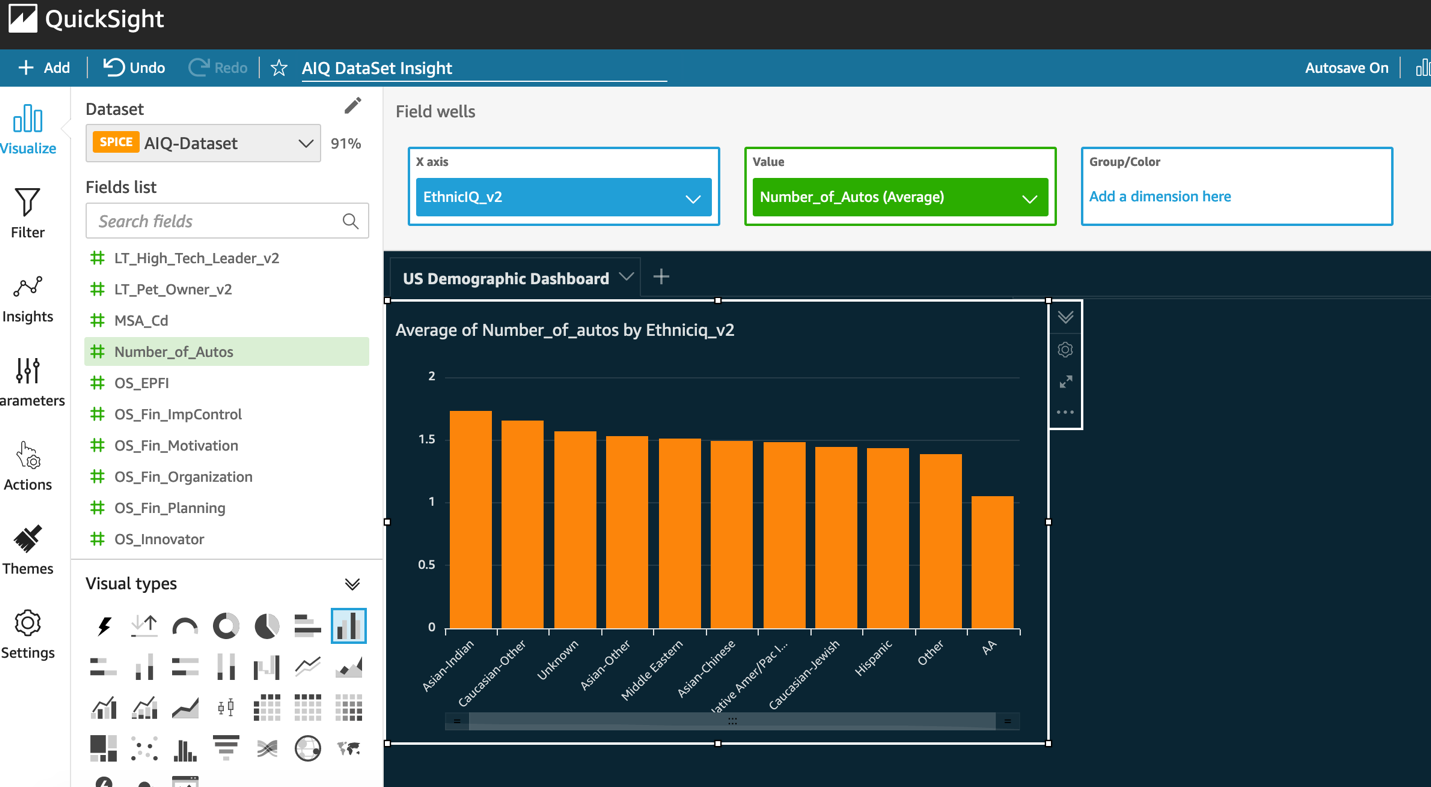
Let’s visualize the average number of cars by various ethnic groups. For more information about the fields, refer to the Key Data Points section on the AWS Marketplace listing.
- Choose the sheet and choose the vertical bar chart under Visual types.

- From the Fields list, drag EthnicIQ_v2 to X axis and Number_of_Autos to Value.
- Choose Aggregate as Average.

Now you can create a visualization for urgent care visits by ethnic groups.
- Choose +Add, and choose Add Visual.
- Choose a pivot table under Visual types.
- From the Fields list, drag EthinicIQ_v2 to Rows and HW_Urgent_Care_Visits_SC to Values.
- Choose Aggregate as Average.
- Choose the HW_Urgent_Care_Visits_SC field in the pivot table, and choose Sort descending.


Similarly, you can add more visualizations as shown in the following images.


From these visualizations created from sample data, you can see that a person’s use of healthcare services reduces when they have less access to transportation. The AA ethnic group has fewer cars compared to the other groups. The wellness score for the AA group is low when compared to the others. Transportation barriers could be a major factor here. Job satisfaction also contributes to wellness levels. Furthermore, the sample data indicates that the Hispanic community has the highest likelihood of recent urgent care visits. Does this mean these groups aren’t getting enough preventative care, leading to more urgent care visits?
Sleep and job satisfaction play a critical role in affecting stress levels, as well as overall health. This would be a critical factor for people who work shifts. What measures can be taken to increase the sleep quality for that set of people?
These are just few of the innumerable valuable analyses that you can create from the AnalyticsIQ Social Determinants of Health Sample Data dataset. These insights are valuable for various groups of people, such as health professionals, preventative care, employee care, scientists, and governments, to empower communities and help build better public health and social determinant solutions.
Clean up
To avoid incurring ongoing charges, complete the following steps to clean up your resources:
- On the QuickSight console, on the Analyses page, choose the details icon on the analysis you created, and choose Delete.
- On the QuickSight start page, on the Datasets page, choose the dataset that you created earlier, then choose Delete Data Set.
- On the Amazon S3 console, on the Buckets page, select the option next to the name of your bucket, and then choose Delete at the top of the page.
- Confirm that you want to delete the bucket by entering the bucket name into the text field, then choose Delete bucket.
Conclusion
In this post, we showed you how you can use the AnalyticsIQ Social Determinants of Health Sample Data dataset to gain insights into society’s health and wellness. We also showed you how you can generate easy-to-understand visualizations using QuickSight. Amazon QuickSight allows dashboards to be shared with 1000s of users without any servers, and with pay-per-session pricing. QuickSight dashboards can also be easily embedded in SaaS applications or corporate portals for sharing insights with all users. You can explore the AnalyticsIQ dataset more on the AWS Data Exchange console. For queries related to the AnalyticsIQ dataset, you can reach out directly to the support team at [email protected].To learn more about the features of QuickSight, refer to Amazon QuickSight Features.
About the Author
 Sumitha AP is an AWS Solutions Architect based in Washington DC. She works with SMB customers to help them design secure, scalable, reliable and cost effective solutions in the AWS cloud.