Post Syndicated from Venkata Moparthi original https://aws.amazon.com/blogs/devops/save-cost-and-improve-lambda-application-performance-with-proactive-insights-from-amazon-devops-guru/
AWS customers, regardless of size and market segment, constantly seek to improve application performance while reducing operational costs. Today, Amazon DevOps Guru generates proactive insights that enable you to reduce the cost and improve the performance of your AWS Lambda application. By proactively analyzing your application and making these cost-saving and/or performance-improving recommendations, DevOps Guru frees up your operations team to focus on other value-adding activities.
DevOps Guru is a machine learning (ML)-powered service that helps you effectively monitor your application by ingesting application metrics, learning your application’s behavior over time, and then detecting operational anomalies. Once an anomaly is detected, DevOps Guru generates insights that include specific recommendations of how to fix the underlying problem.
To make sure that AWS customers remain ahead of potential issues, DevOps Guru detects some applications issues proactively and provides recommendations that let customers correct them before customer-impacting events actually occur. These Proactive Insights are created by analyzing operational data and application metrics with ML algorithms that can identify early signals that are linked with future operational issues.
In this post, we’ll review a scenario in which the provisioned concurrency capacity for a Lambda function was set too low. This put the customer at risk of dropped requests (throttling), which degrade application performance and deliver poor user experience during traffic spikes.
Prerequisites
In the scenario under review, we have an account with DevOps Guru set up to monitor a Lambda-based application stack. Enabling DevOps Guru and setting it up to monitor a Lambda function is straightforward, and you can refer to this post to see how this is done. For the Lambda function in this account, we have set the provisioned concurrency set too low. This Lambda documentation page covers how to estimate the appropriate concurrency levels for your function.
Architecture Overview
The reference architecture for our scenario can be seen in the following image.
In this simple serverless architecture, the Lambda-based application vends the metrics to Amazon CloudWatch. Then, DevOps Guru ingests the metrics from CloudWatch for analysis.

By default, DevOps Guru ingests vended metrics via CloudWatch at no cost to customers.
Baselining
The first time that you enable and configure DevOps Guru to monitor resources, it starts baselining your resources to determine your application’s normal behavior. Unlike rule-based alarming systems, DevOps Guru utilizes dynamic thresholds that are controlled by ML algorithms and calibrated to the specifics of your application to reduce noise. For a simple serverless stack, baselining can be completed in two hours. However, in a production environment baselining can take up to 24-hours depending upon the number of resources being monitored. After initial baselining, analysis becomes continuous and baselining is no longer required.
Proactive Insight Generation
Once baselining is complete, DevOps Guru analyzes the baselined operational and generates insights where present. These insights can be found on the Insights page of the DevOps Guru console. To view the available insights, navigate to Insights, and select the Proactive Insights or Reactive Insights. In this scenario, we’re reviewing a Proactive Insight.
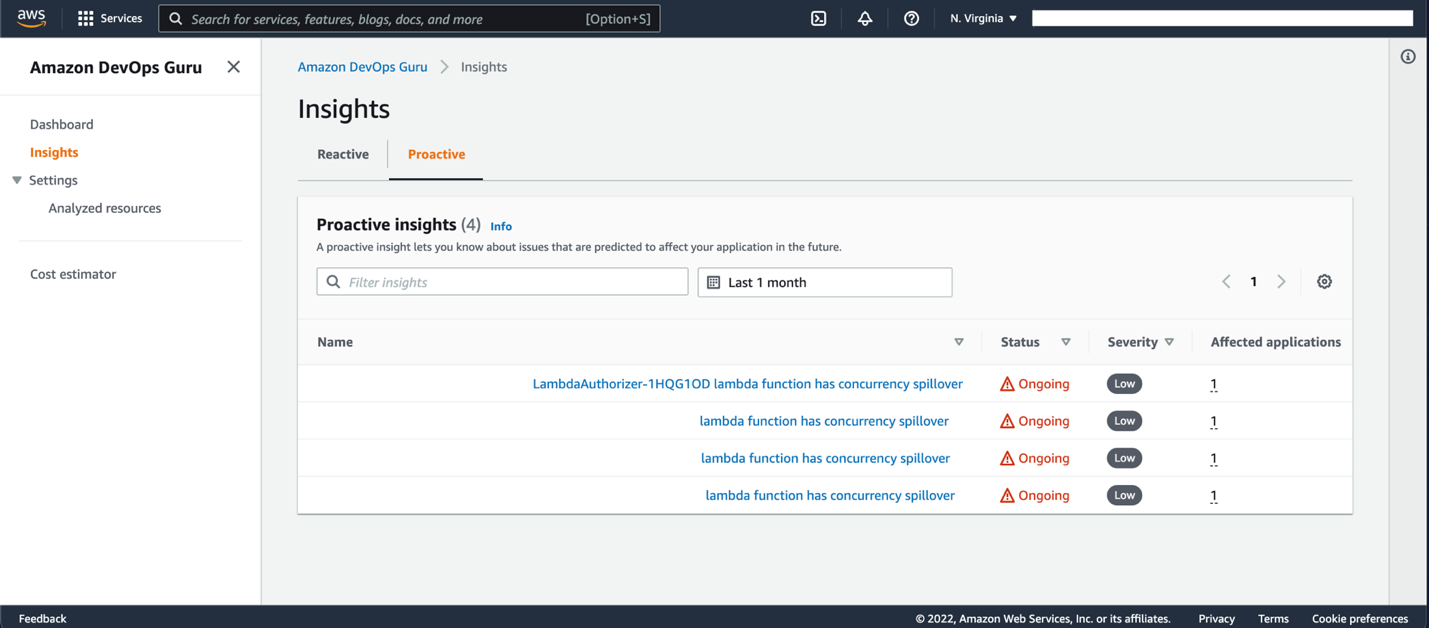
On this tab, note that the LambdaAuthorizer -1HQG1OD function has a concurrency spillover invocation. For a given Lambda function, concurrency spillover is invoked when the number of concurrent requests reaches the provisioned concurrency limit. When this occurs, Lambda either begins to run on unreserved concurrency (leading to cold starts) or rejects additional incoming requests, depending on your function scaling configuration.
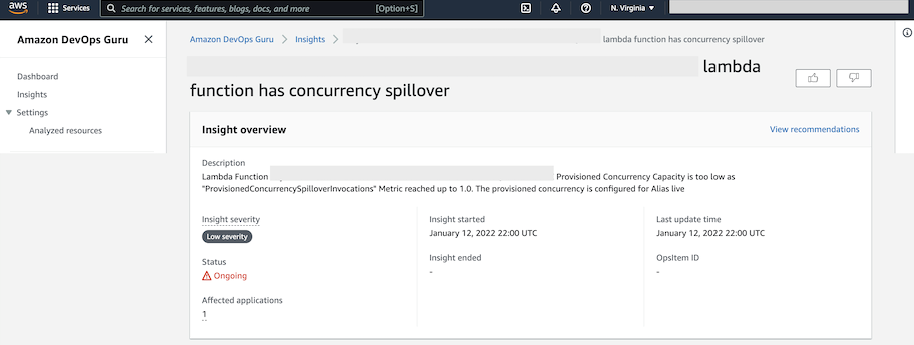
By selecting the relevant insight from the list, we open the insight detail page. The insight overview card provides an overview of the insight, with high-level information such as insight description, severity, status, and the number of affected applications as shown in the following screenshot.
The metrics card presents a graph plotted against time. In this case, provisioned concurrency invocation, which toggles from 0 to 1 when concurrency spillover occurs, was triggered because the Lambda function received more concurrent requests than were provisioned for.

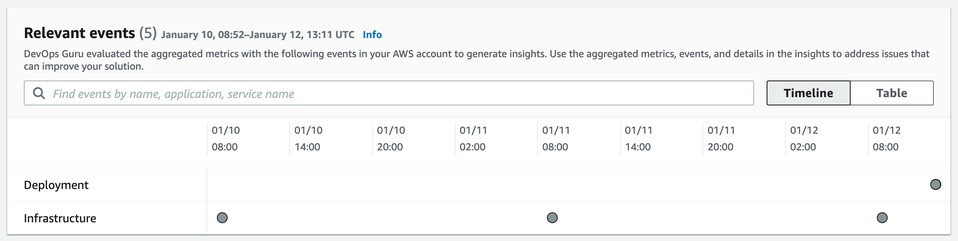
The relevant events card is useful in situations where more than one application is affected, or when the initial event triggers additional events. This card plots all of the events from different related applications on a time axis. Therefore, we can pinpoint which event triggered the chain of events.
Recommendations
The recommendation section of the insight page provides specific and actionable guidance on what actions customers should take to fix the underlying cause of the issue. In this case, DevOps Guru recommends that the customer set the provisioned concurrency to 264 to keep the utilization balanced at 65%. Providing such specific guidance takes away any ambiguity and significantly reduces troubleshooting time.

Other Lambda-related Proactive Insights
While this scenario alerts customers to an issue that impacts application performance, DevOps Guru also provides alerts for cost-optimization issues. Some additional cost and performance-related issues that DevOps Guru identifies include:
- Lambda Provisioned with No Autoscaling, which is triggered when autoscaling isn’t enabled, thereby putting the application at risk of degraded performance when requests are throttled during a traffic spike.
- Low Lambda Provision Concurrency Utilization, which is triggered when provisioned concurrency is consistently higher than required, driving unnecessary cloud spend.
- Over-provisioned Amazon DynamoDB Stream Shards, which is triggered when provisioned Amazon DynamoDB stream shards is consistently higher than required, driving unnecessary cloud spend.
DevOps Guru continues to expand its library of proactive insight use cases to deliver cost and performance improvements continuously to AWS customers.
Conclusion
As seen in the example above, DevOps Guru can proactively detect issues with your Lambda applications, tie these issues to related events, and provide precise remedial actions using its pre-trained ML models. As a customer, you can start leveraging these capabilities to improve the performance of your Lambda applications by simply enabling DevOps Guru—a process that requires minimal configuration and no previous ML expertise.
Start using DevOps Guru to monitor your Lambda Applications today!