Post Syndicated from Chris McPeek original https://aws.amazon.com/blogs/compute/enriching-and-customizing-notifications-with-amazon-eventbridge-pipes/
This blog post authored by Elie Elmalem, Associate Scale Solutions Architect
When implementing event-driven architectures, customers frequently need to enrich their incoming events with additional information to make them more valuable for downstream consumers. Traditionally, customers using Amazon EventBridge would accomplish this by writing AWS Lambda functions to augment their events with supplementary data. However, this approach requires writing and maintaining custom code, adding complexity to their event processing pipeline.
Amazon EventBridge Pipes simplifies this process by providing a streamlined, managed service for event enrichment without the need to write and manage custom Lambda functions. This blog post demonstrates how you can use EventBridge Pipes’ built-in data enrichment capabilities to dynamically enhance your events with additional context and customer-specific details, making event processing more efficient and easier to maintain.
Amazon EventBridge Pipes
Amazon EventBridge creates a direct connection between sources and targets. Using an EventBridge bus helps you route and fan-out events to services in a pub/sub pattern. EventBridge Pipes on the other hand help you with point-to-point service integrations patterns. What sets it apart from the traditional event bus/rule pattern is its data transformation and enrichment support.
When defining an EventBridge Pipes, you specify the source and the target of the pipe. Pipes support a variety of sources and targets. Between the source and target, EventBridge Pipes supports filtering and enrichment. The filtering enables you to select and process a targeted subset of events. Enrichment allows you to enhance data by adding missing information before sending it to a target. For instance, if an event lacks necessary information, it ensures the target can properly consume the event. Enriching data can be very powerful, as it makes it possible to enhance a generic event and transform it. EventBridge Pipes support enrichment using Lambda functions, AWS Step Functions, Amazon API Gateway and EventBridge API destinations. More details about these concepts can be found in the Amazon EventBridge Pipes concepts documentation.

Figure 1: Representation of EventBridge Pipes showing filter and enrichment steps
This blog post will use the enrichment step of the pipe to create custom notifications.
Overview
To illustrate the functionality, this post uses a use case from a clothing retailer. Businesses such as this retailer want to keep their loyal customers engaged. Often, they rely on bulk promotional emails which lack personalization. In this use case, the retailer wants to send targeted promotion codes. As soon as the 10th order is placed, the code is sent via email or SMS to their customer.
Without EventBridge Pipes, this would be implemented using EventBridge to respond to the order event. All the events are sent to a custom Lambda function to process it. If the order meets the right conditions, the Lambda function sends a notification with the discount code to the customer using Amazon Simple Notification Service (Amazon SNS).

Figure 2: Traditional approach using EventBridge
While this architecture works, it requires you to maintain the integration code as well as the data enriching logic within the Lambda function as the function needs to extract the necessary information from the events and manage routing to SNS. As more microservices follow the same pattern, the code becomes more complex. This can lead to longer execution times along with higher cost and greater maintenance effort.
Simplifying using Amazon EventBridge Pipes
Amazon EventBridge Pipes can be used to simplify the previous implementation by handling the enrichment and integration between services. Amazon EventBridge Pipes take care of sending the event to your configured enrichment step and then routes the enriched event to the target. If the chosen method is a Lambda function, it leaves the function code to only focus on enrichment logic. It eliminates the need for code to extract the necessary fields from the event and to send notifications.

Figure 3: Solution architecture using EventBridge Pipes
As the event comes into the pipe, the enrichment step triggers a Lambda function, which will check eligibility and returns the message to route to SNS. If the customer is not eligible for a discount code, it returns an order confirmed message with the data retrieved from the original order event. If the customer is eligible for a discount, the message also contains the discount code.
This is the architecture for the updated flow:
- A customer orders a new item. The order is sent to a Simple Queue Service (SQS) Orders queue.
- The new message on the Orders queue triggers the EventBridge Pipes.
- The pipe triggers an AWS Lambda function to enrich the data.
- The functions checks if the customer is eligible for a discount code against an Amazon DynamoDB table. The table contains the number of times each customer has ordered.
- The Lambda function returns the custom message that will be sent to the customer, either with or without the discount code.
- The message is routed to an SNS topic by the EventBridge Pipe
- Customer receives the notification via its preferred subscription method.
Building the updated flow
To build the updated flow, I have chosen to use the AWS Cloud Development Kit (CDK) in Python. You can use the code given here to deploy it into your account. The code can also be found on GitHub.
Note: This sample code is for testing purposes only and is not intended to be used in a production account.
For this solution, you need the following prerequisites:
- The AWS Command Line Interface (CLI) installed and configured for use.
- An Identity and Access Management (IAM) role or user with enough permissions to create an IAM policy, DynamoDB table, SQS queue, SNS topic, Lambda Function and EventBridge Pipes.
- AWS CDK
- Python version 3.9 or above, with pip and virtual virtualenv.
Once the prerequisites are met, set up a new Python CDK project in an empty directory:
Then, activate the virtual environment and install the CDK’s dependencies:
The cdk init command creates a blog_code folder. The GitHub repository contains the code for the blog_code_stack.py file inside the blog_code folder.
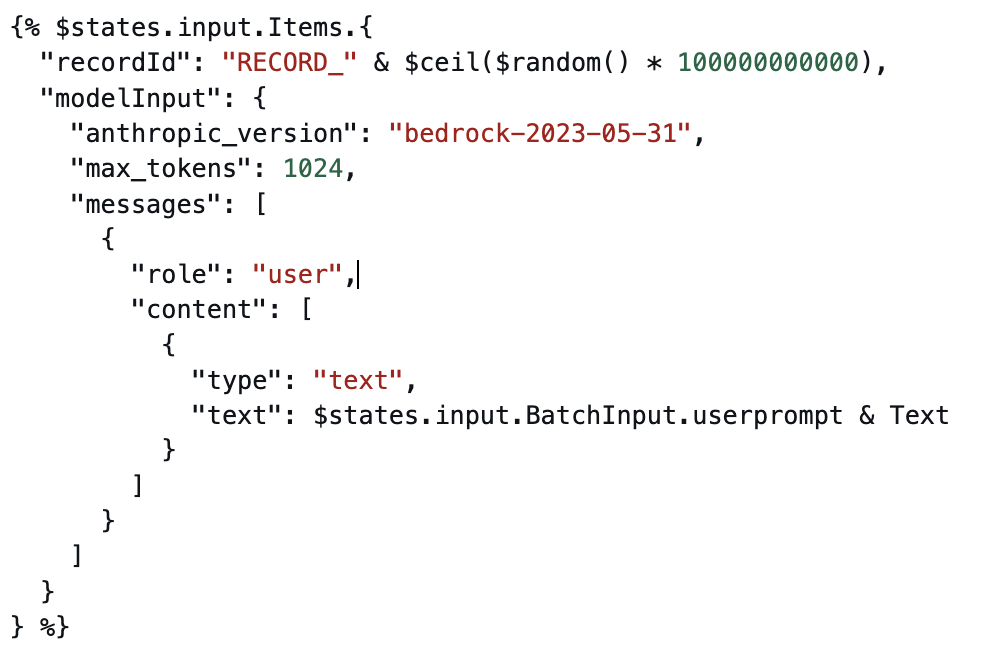
Then, within the blog_code folder, create a new folder called lambda. Inside this new folder, create a file called index.py. This file will contain the code for the enrichment lambda function. Once again, this code can be found in the GitHub repository. Here is a section of the Lambda code:
def lambda_handler(event, context):

    message = json.loads(event[0]['body'])

    id = message['id']
    order_content = message['order_content']

    nmb_orders = get_number_of_orders(id)

    # Calculate orders left
    orders_left = MAX_ORDERS - nmb_orders

    # Update the DynamoDB table with the new number of orders
    if nmb_orders == MAX_ORDERS:
        update_table(id, 0)
    else:
        update_table(id, nmb_orders)

    if orders_left == 0:
        return [f"Thank you for your order of {order_content}. You have earned a 10% discount code on your next order: XA5GT2SF"]
    else:
        # Return the confirmation message
        return [f"Thank you for your order of {order_content}. This is your confirmation message! Only {orders_left} orders left until a 10% discount!"]
The Lambda function works in the following way:
- It receives an event from the EventBridge Pipe which consists of the order and the ID of the user who made the order
- It gets the number of orders that the user has already placed by calling a GetItem command on the DynamoDB table.
- It calculates how many orders are left before the user gets the discount code.
- It updates the DynamoDB table with the new number of orders to account for the one that was just placed.
- If the user has placed the right number of orders, it returns a confirmation message with the discount code. Otherwise, it notifies the user of the number of orders that still need to be placed to get the discount.
Now, deploy the CDK stack into your account. Make sure that you are in the root directory of your project:
Once the stack has finished deploying, you will find an EventBridge pipe visible on the console by going to the EventBridge service page and clicking on Pipes in the left panel.
Testing the solution
To test the solution, you must first set up a subscription to the SNS topic to receive notifications. It is recommended to set up email notifications for simplicity and testing purposes. To do so, follow the instructions on the Amazon SNS documentation for the topic with name TargetTopic. When the subscription is set up, don’t forget to check your email inbox and confirm the subscription.
Once notifications are set up, visit the DynamoDB console page. You need to manually add an entry to the eligibility table to mimic a real environment:
- Click on Tables in the left panel
- Select the EligibilityTable table.
- Click Explore table items then Create item
- Enter an id with a value of 01.
- Click Add new attribute and select String.
- Under attribute name, enter orders, and under value enter 8.
- Click Create item.
The Items returned table should look like the following. This assumes that the customer has already place 8 orders.

Figure 4: Items returned table after adding a new item
Now, visit the SQS console page. You will need to send a message to the queue to mimic new orders being placed.
- Click on the queue called SourceQueue.
- Click Send and receive messages.
- Under message body, paste in the following message and click Send message:
{
    "order_content": "large shirt",
    "id": "01",
    "username": "johndoe01",
    "transaction_time": "10:04:00"
  }
After a few minutes, you should receive an email confirming your order, as your order message is considered to be the 9th order. Send the message again to place a 10th order and you should receive your discount code!

Figure 5: Email received with a discount code
Cleanup
To delete the resources in your account, run the following command in the root directory of your project:
cdk destroy
Conclusion
This blog post showed how Amazon EventBridge Pipes and its enrichment feature can help you create tailored notifications. First, it discussed how it could be implemented using EventBridge and then presented a simplified implementation using EventBridge Pipes.
For more information on common patterns for EventBridge Pipes, you can check out Implementing architectural patterns with Amazon EventBridge Pipes.
For more serverless learning resources, visit Serverless Land. To find more patterns, go directly to the Serverless Patterns Collection.