Post Syndicated from Rajeshkumar Karuppaswamy original https://aws.amazon.com/blogs/big-data/enable-self-service-visual-data-integration-and-analysis-for-fund-performance-using-aws-glue-studio-and-amazon-quicksight/
IMM (Institutional Money Market) is a mutual fund that invests in highly liquid instruments, cash, and cash equivalents. IMM funds are large financial intermediaries that are crucial to financial stability in the US. Due to its criticality, IMM funds are highly regulated under the security laws, notably Rule 2a-7, Which states that during market stress, fund managers can impose a liquidity fee up to 2% or redemption gates (a delay in processing redemption) if the fund’s weekly liquid assets drop below 30% of its total assets. The liquidity fees and gates allow money market funds to stop heavy redemption in times of market volatility.
Traditional banks use legacy systems and rely on monolithic architectures. Typically, data and business logic is tightly coupled on the same mainframe machines. It’s hard for analysts and fund managers to perform self-service and gather real-time analytics from these legacy systems. They work on the previous nightly report and struggle to keep up with market fluctuations. The slightest modification to the reports on these legacy systems involves vast costs, time, and significant dependency on the software development team. Due to these limitations, analysts and fund managers can’t respond effectively to market trends and face a tremendous challenge in adhering to the regulatory requirements of monitoring the market volatility.
Over the last few years, many banks have adopted the cloud. Banks have migrated their legacy workloads to reduce cost, improve their competitive advantage, and address competition from FinTech and startups. As part of the cloud strategy, many mainframe applications got re-platformed or re-architected to a more efficient database platform. However, many opportunities exist in modernizing the application. One such option is to enable self-service to run real-time analytics. AWS offers various services that help such use cases. In this post, we demonstrate how to analyze fund performance visually using AWS Glue Studio and QuickSight in a self-service fashion.
The aim of the post is to assist operations analysts and fund managers to self-service their data analysis needs without previous coding experience. This post demonstrates how AWS Glue Studio reduces the software development team’s dependency and helps analysts and fund managers perform near-real-time analytics. This post also illustrates how to build visualizations and quickly get business insights using Amazon QuickSight.
Solution overview
Most banks record their daily trading transactions activity in relational database systems. A relational database keeps the ledger of daily transactions that involves many buys and sells of IMM funds. We use the mock trades data and a simulated Morningstar data feed to demonstrate our use case.
The following sample Amazon Relational Database Service (Amazon RDS) instance records daily IMM trades, and Morningstar market data gets stored in Amazon Simple Storage Service (Amazon S3). With AWS Glue Studio, analysts and fund managers can analyze the IMM trades in near-real time and compare them with market observations from Morningstar. They can then review the data in Amazon Athena, and use QuickSight to visualize and further analyze the trade patterns and market trends.
This near-real time and self-service enables fund managers quickly respond to the market volatility and apply fees or gates on IMM funds to comply with Rule 2a-7 regulatory requirements.
The following diagram illustrates the solution architecture.

Provision resources with AWS CloudFormation
To create your resources for this use case, we deploy an AWS CloudFormation template. Complete the following steps:
- Choose Launch Stack (
in us-east-1):

- Choose Next three times to reach the Review step.
- Select I acknowledge that AWS CloudFormation might create IAM resources.
- Choose Create stack.
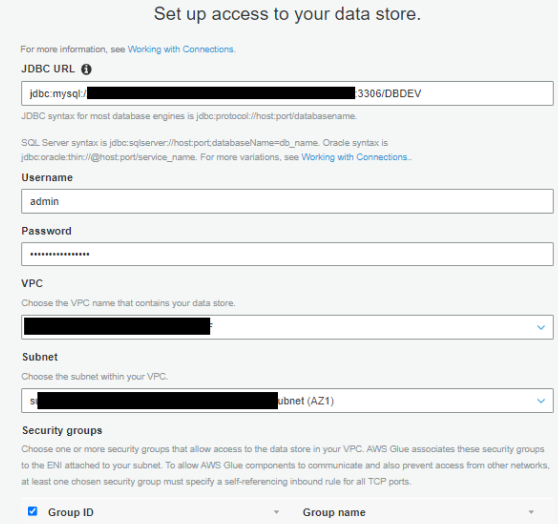
Create an AWS Glue connection
You create an AWS Glue connection to access the MySQL database created by the CloudFormation template. An AWS Glue crawler uses the connection in the next step.
- On the AWS Glue console, under Databases in the navigation pane, choose Connections.
- Choose Add connection.

- For Connection name, enter
Trade-Analysis. - For Connection type¸ choose JDBC.
- Choose Next.

- For JDBC URL, enter your URL.
To connect to an Amazon RDS for MySQL data store with a DBDEV database, use the following code:For more details, see AWS Glue connection properties. Refer to the CloudFormation
fund-analysisstack Outputs tab to get the Amazon RDS ARN.The next step requires you to first retrieve your MySQL database user name and password via AWS Secrets Manager.
- On the Secrets Manager console, choose Secrets in the navigation pane.
- Choose the
secret rds-secret-fund-analysis. - Choose Retrieve secret value to get the user name and password.
- Return to the connection configuration and enter the user name and password.
- For VPC, choose the VPC ending with
fund-analysis. - For Subnet and Security groups, choose the values ending with
fund-analysis.

- Choose Next and Finish to complete the connection setup.
- Select the connection you created and choose Test Connection.
- For IAM role, choose the role
AWSGlueServiceRole-Studio.


For more details about using AWS Identity and Access Management (IAM), refer to Setting up for AWS Glue Studio.

Create and run AWS Glue crawlers
In this step, you create two crawlers. The crawlers connect to a data store, determine the schema for your data, and then create metadata tables in your AWS Glue Data Catalog.
Crawl MySQL data stores
The first crawler creates metadata for the MySQL data stores. Complete the following steps:
- On the AWS Glue console, choose Crawlers in the navigation pane.
- Choose Add crawler.
- For Crawler name, enter
Trades Crawlers. - Choose Next.
- For Crawler source type, choose Data stores.
- For Repeat crawls of S3 data stores, choose Crawl all folders.
- Choose Next.
- For Choose a data store, choose JDBC.
- For Connection, choose Trade-Analysis.
- For Include path, enter the MySQL database name (
DBDEV). - Choose Next.

- For Add another data store, choose No.
- Choose Next.
- For the IAM role to access the data stores, choose the role
AWSGlueServiceRole-Studio. - For Frequency, choose Run on demand.
- Choose Add database.

- For Database name, enter
trade_analysis_db. - Choose Create.
- Choose Next.
- Review all the steps and choose Finish to create your crawler.
- Select the
Trades Crawlerscrawler and choose Run crawler to get the metadata.


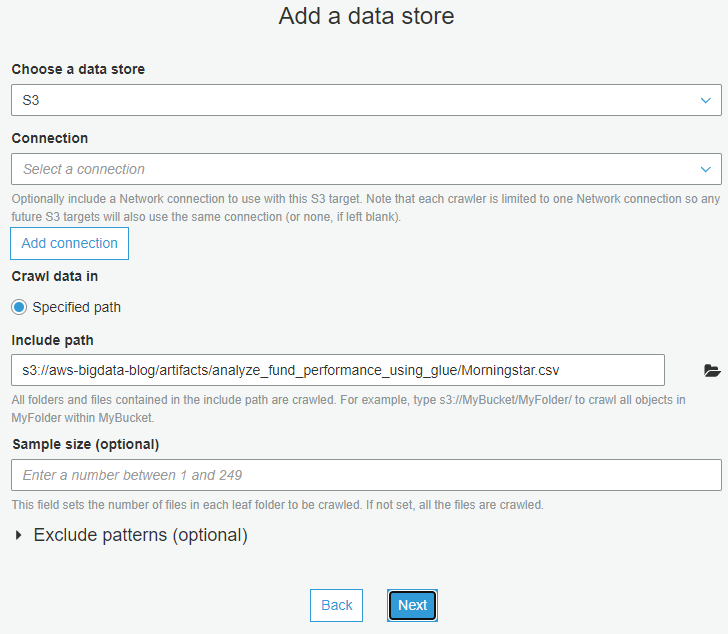
Crawl Amazon S3 data stores
Now you configure a crawler to create metadata for the Amazon S3 data stores.
- On the AWS Glue console, choose Crawlers in the navigation pane.
- Choose Add crawler.
- For Crawler name, enter
Ratings. - Choose Next.
- For Crawler source type, choose Data stores.
- For Repeat crawls of S3 data stores, choose Crawl all folders.
- Choose Next.
- For Choose a data store, choose S3.
- For Connection, choose Trade-Analysis.
- For Include path, enter
s3://aws-bigdata-blog/artifacts/analyze_fund_performance_using_glue/Morningstar.csv. - Choose Next.

- For Add another data store, choose No.
- Choose Next.
- For the IAM role to access the data stores, choose the role
AWSGlueServiceRole-Studio. - For Frequency, choose Run on demand.
- Choose Add database.
- For Database name, enter
trade_analysis_db. - Review all the steps and choose Finish to create your crawler.
- Select the
Ratingscrawler and choose Run crawler to get the metadata.
Review crawler output
To review the output of your two crawlers, navigate to the Databases page on the AWS Glue console.
You can review the database trade_analysis_db created in previous steps and the contents of the metadata tables.

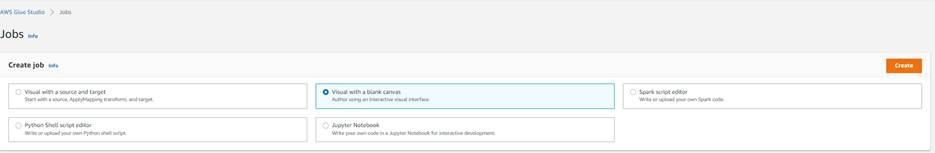
Create a job using AWS Glue Studio
A job is the AWS Glue component that allows the implementation of business logic to transform data as part of the extract, transform, and load (ETL) process. For more information, see Adding jobs in AWS Glue.
To create an AWS Glue job using AWS Glue Studio, complete the following steps:
- On the AWS Glue console, in the navigation pane, choose AWS Glue Studio.
- Choose Create and manage jobs.
- Choose View jobs.
AWS Glue Studio supports different sources. For this post, you use two AWS Glue tables as data sources and one S3 bucket as the destination. - In the Create job section, select Visual with a blank canvas.
- Choose Create.

This takes you to the visual editor to create an AWS Glue job. - Change the job name from
Untitled JobtoTrade-Analysis-Job.
You now have an AWS Glue job ready to filter, join, and aggregate data from two different sources.
Add two data sources
For this post, you use two AWS Glue tables as data sources: Trades and Ratings, which you created earlier.
- On the AWS Glue Studio console, on the Source menu, choose MySQL.

- On the Node properties tab, for Name, enter Trades.
- For Node type, choose MySQL.

- On the Data Source properties – MySQL tab, for Database, choose
trade_analysis_db. - For Table, choose
dbdev_mft_actvitity.
Before adding the second data source to the analysis job, be sure that the node you just created isn’t selected. - On the Source menu, choose Amazon S3.
- On the Node properties tab, for Name, enter
Ratings. - For Node type, choose Amazon S3.

- On the Data Source properties – S3 tab, for Database, choose
trade_analysis_db. - For Table, choose
morning_star_csv.
You now have two AWS Glue tables as the data sources for the AWS Glue job.The Data preview tab helps you sample your data without having to save or run the job. The preview runs each transform in your job so you can test and debug your transformations. - Choose the
Ratingsnode and on the Data preview tab, choose Start data preview session.

- Choose the
AWSGlueServiceRole-StudioIAM role and choose Confirm to sample the data.


Data previews are available for each source, target, and transform node in the visual editor, so you can verify the results step by step for other nodes.
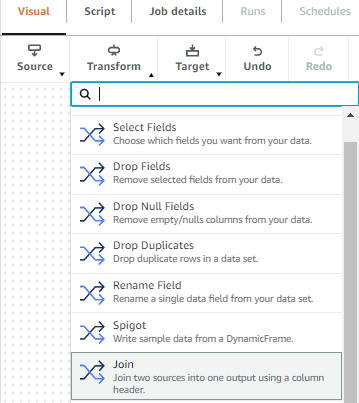
Join two tables
A transform is the AWS Glue Studio component were the data is modified. You have the option of using different transforms that are part of this service or custom code. To add transforms, complete the following steps:
- On the Transform menu, choose Join.

- On the Node properties tab, for Name, enter
trades and ratings join. - For Node type, choose Join.
- For Node parents, choose the
TradesandRatingsdata sources.

- On the Transform tab, for Join type, choose Outer join.
- Choose the common column between the tables to establish the connection.
- For Join conditions, choose symbol from the
Tradestable andmor_rating_fund_symbolfrom theRatingstable.


Add a target
Before adding the target to store the result, be sure that the node you just created isn’t selected. To add the target, complete the following steps:
- On the Target menu, choose Amazon S3.

- On the Node properties tab, for Name, enter
trades ratings merged. - For Node type, choose Amazon S3 for writing outputs.
- For Node parents, choose
trades and ratings join.

- On the Data target properties – S3 tab, for Format, choose Parquet.
- For Compression type, choose None.
- For S3 target location, enter
s3://glue-studio-blog- {Your Account ID as a 12-digit number}/. - For Data catalog update options, select Create a table in the Data Catalog and on subsequent runs, update the schema and add new partitions.
- For Database, choose
trade-analysis-db. - For Table name, enter
tradesratingsmerged.


Configure the job
When the logic behind the job is complete, you must set the parameters for the job run. In this section, you configure the job by selecting components such as the IAM role and the AWS Glue version you use to run the job.
- Choose the Job details tab.

- For Job bookmark, choose Disable.
- For Number of retries, optionally enter
0.

- Choose Save.

- When the job is saved, choose Run.


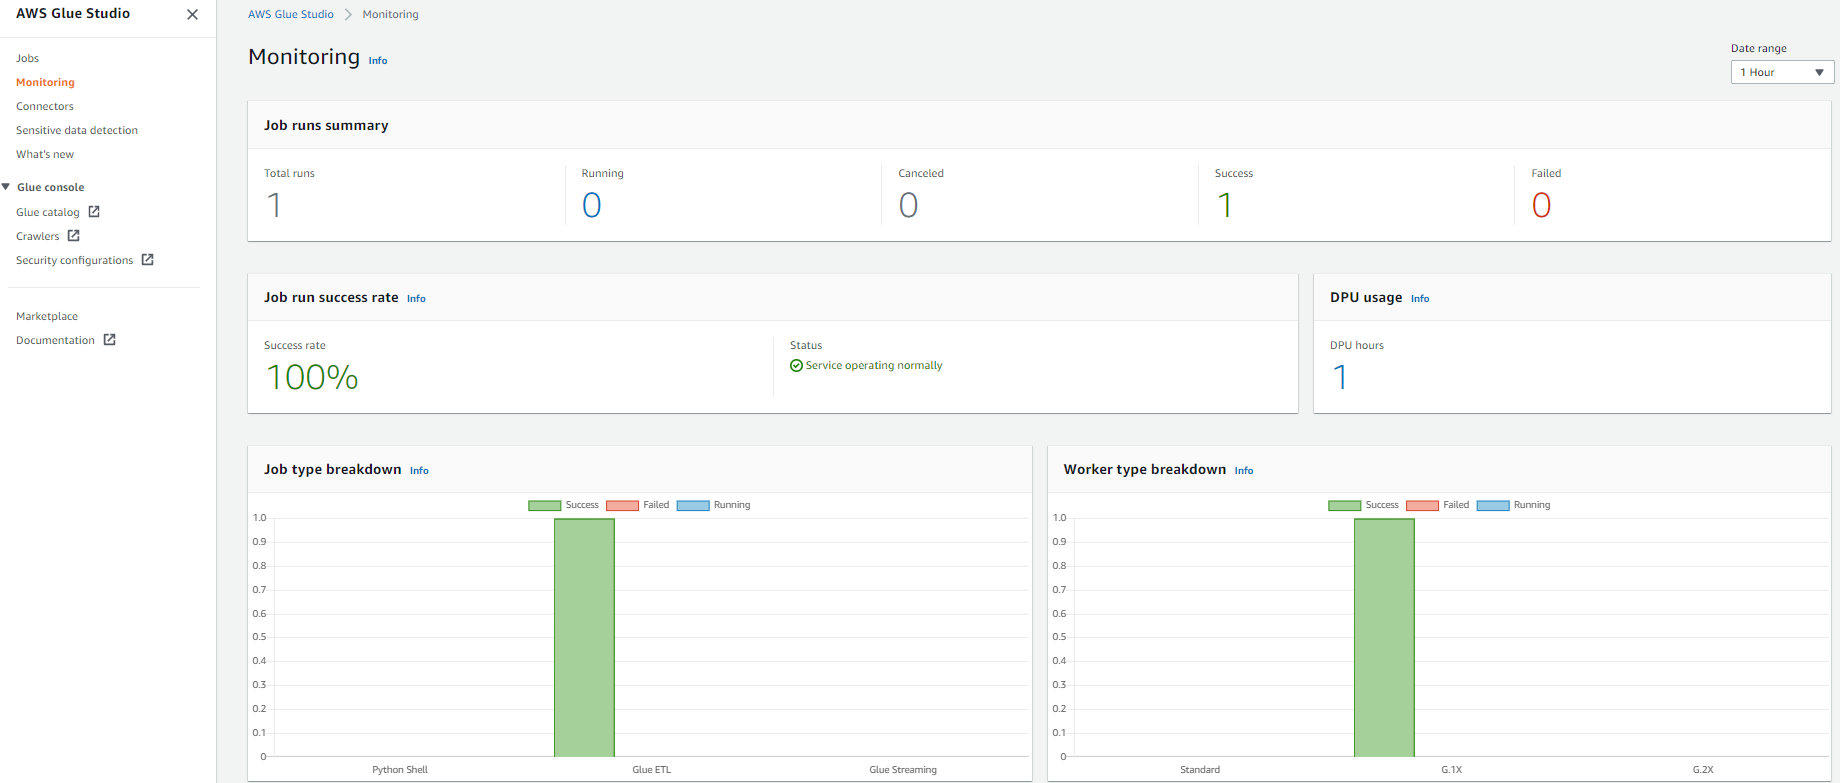
Monitor the job
AWS Glue Studio offers a job monitoring dashboard that provides comprehensive information about your jobs. You can get job statistics and see detailed information about the job and the job status when running.
- In the AWS Glue Studio navigation pane, choose Monitoring.
- Change the date range to 1 hour using the Date range selector to get the recently submitted job.
The Job runs summary section displays the current state of the job run. The status of the job could be Running, Canceled, Success, or Failed.The Job run success rate section provides the estimated DPU usage for jobs, and gives you a summary of the performance of the job. Job type breakdown and Worker type breakdown contain additional information about the job.

- For get more details about the job run, choose View run details.


Review the results using Athena
To view the data in Athena, complete the following steps:
- Navigate to the Athena console, where you can see the database and tables created by your crawlers.

If you haven’t used Athena in this account before, a message appears instructing you to set a query result location.

- Choose Settings, Manage, Browse S3, and select any bucket that you created.
- Choose Save and return to the editor to continue.
- In the Data section, expand Tables to see the tables you created with the AWS Glue crawlers.
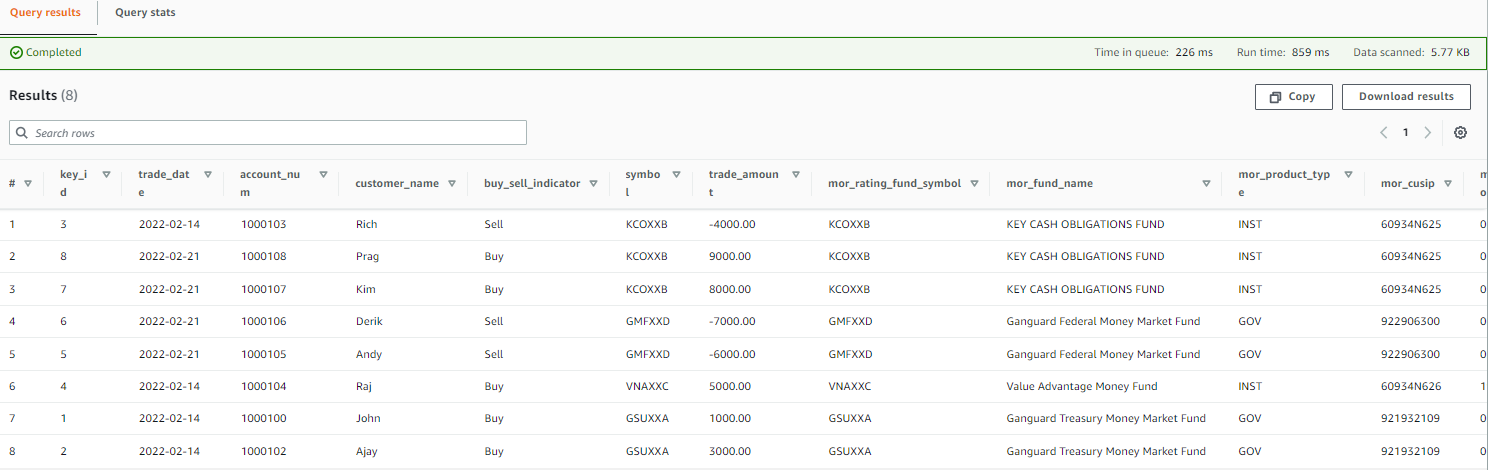
- Choose the options menu (three dots) next to one of the tables and choose Preview Table.


The following screenshot shows an example of the data.
Create a QuickSight dashboard and visualizations
To set up QuickSight for the first time, sign up for a QuickSight subscription and allow connections to Athena.
To create a dashboard in QuickSight based on the AWS Glue Data Catalog tables you created, complete the following steps:
- On the QuickSight console, choose Datasets in the navigation pane.
- Choose New dataset.

- Create a new QuickSight dataset called Fund-Analysis with Athena as the data source.

- In the Choose your table section, choose
AwsDataCatlogfor Catalog and choosetrade_analysis_dbfor Database. - For Tables, select the
tradesratingmergedtable to visualize. - Choose Select.

- Import the data into SPICE.
SPICE is an in-memory engine that QuickSight uses to perform advanced calculations and improve performance. Importing the data into SPICE can save time and money. When using SPICE, you can refresh your datasets both fully or incrementally. As of this writing, you can schedule incremental refreshes up to every 15 minutes. For more information, refer to Refreshing SPICE data. For near-real-time analysis, select Directly query your data instead. - Choose Visualize.

After you create the dataset, you can view it and edit its properties. For this post, leave the properties unchanged. - To analyze the market performance from the Morningstar file, choose the clustered bar combo chart under Visual types.
- Drag
Fund_Symbolfrom Fields list to X-axis. - Drag
Ratingsto Y-axis and Lines. - Choose the default title choose Edit title to change the title to “Market Analysis.”
The following QuickSight dashboard was created using a custom theme, which is why the colors may appear different than yours.

- To display the Morningstar details in tabular form, add a visual to create additional graphs.

- Choose the table visual under Visual types.
- Drag
Fund SymbolandFund Namesto Group by. - Drag
Ratings,Historical Earnings, andLT Earningsto Value.

In QuickSight, up until this point, you analyzed the market performance reported by Morningstar. Let’s analyze the near-real-time daily trade activities. - Add a visual to create additional graphs.
- Choose the clustered bar combo chart under Visual types.
- Drag
Fund_Symbolfrom Fields list to X-axis andTrade Amountto Y-axis. - Choose the default title choose Edit title to change the title to “Daily Transactions.”

- To display the daily trades in tabular form, add a visual to create additional graphs.
- Drag
Trade Date,Customer Name,Fund Name,Fund Symbol, andBuy/Sellto Group by. - Drag
Trade Amountto Value.


The following screenshot shows a complete dashboard. This compares the market observation reported in the street against the daily trades happening in the bank.

In the Market Analysis section of the dashboard, GMFXXD funds were performing well based on the previous night’s feed from Morningstar. However, the Daily Transactions section of the dashboard shows that customers were selling their positions from the funds. Relying only on the previous nightly batch report will mislead the fund managers or operation analyst to act.
Near-real-time analytics using AWS Glue Studio and QuickSight can enable fund managers and analysts to self-serve and impose fees or gates on those IMM funds.
Clean up
To avoid incurring future charges and to clean up unused roles and policies, delete the resources you created: the CloudFormation stack, S3 bucket, and AWS Glue job.
Conclusion
In this post, you learned how to use AWS Glue Studio to analyze data from different sources with no previous coding experience and how to build visualizations and get business insights using QuickSight. You can use AWS Glue Studio and QuickSight to speed up the analytics process and allow different personas to transform data with no development experience.
For more information about AWS Glue Studio, see the AWS Glue Studio User Guide. For information about QuickSight, refer to the Amazon QuickSight User Guide.
About the authors
 Rajeshkumar Karuppaswamy is a Customer Solutions Manager at AWS. In this role, Rajeshkumar works with AWS Customers to drive Cloud strategy, provides thought leadership to accelerate businesses achieve speed, agility, and drive innovation. His areas of interests are AI & ML, analytics, and data engineering.
 Richa Kaul is a Senior Leader in Customer Solutions serving Financial Services customers. She is based out of New York. She has extensive experience in large scale cloud transformation, employee excellence, and next generation digital solutions. She and her team focus on optimizing value of cloud by building performant, resilient and agile solutions. Richa enjoys multi sports like triathlons, music, and learning about new technologies.
 Noritaka Sekiyama is a Principal Big Data Architect on the AWS Glue team. He is responsible for building software artifacts to help customers. This summer, he enjoyed goldfish scooping with his children.