Post Syndicated from Louis Hourcade original https://aws.amazon.com/blogs/big-data/build-a-data-storytelling-application-with-amazon-redshift-serverless-and-toucan/
This post was co-written with Django Bouchez, Solution Engineer at Toucan.
Business intelligence (BI) with dashboards, reports, and analytics remains one of the most popular use cases for data and analytics. It provides business analysts and managers with a visualization of the business’s past and current state, helping leaders make strategic decisions that dictate the future. However, customers continue to ask for better ways to tell stories with their data, and therefore increase the adoption rate of their BI tools.
Most BI tools on the market provide an exhaustive set of customization options to build data visualizations. It might appear as a good idea, but ultimately burdens business analysts that need to navigate through endless possibilities before building a report. Analysts are not graphic designers, and a poorly designed data visualization can hide the insight it’s intended to convey, or even mislead the viewer. To realize more value from your data, you should focus on building data visualizations that tell stories, and are easily understandable by your audience. This is where guided analytics helps. Instead of presenting unlimited options for customization, it intentionally limits choice by enforcing design best practices. The simplicity of a guided experience enables business analysts to spend more time generating actual insight rather than worrying about how to present them.
This post illustrates the concept of guided analytics and shows you how you can build a data storytelling application with Amazon Redshift Serverless and Toucan, an AWS Partner. Toucan natively integrates with Redshift Serverless, which enables you to deploy a scalable data stack in minutes without the need to manage any infrastructure component.
Amazon Redshift is a fully managed cloud data warehouse service that enables you to analyze large amounts of structured and semi-structured data. Amazon Redshift can scale from a few gigabytes to a petabyte-scale data warehouse, and AWS recently announced the global availability of Redshift Serverless, making it one of the best options for storing data and running ad hoc analytics in a scalable and cost-efficient way.
With Redshift Serverless, you can get insights on your data by running standalone SQL queries or by using data visualizations tools such as Amazon QuickSight, Toucan, or other third-party options without having to manage your data warehouse infrastructure.
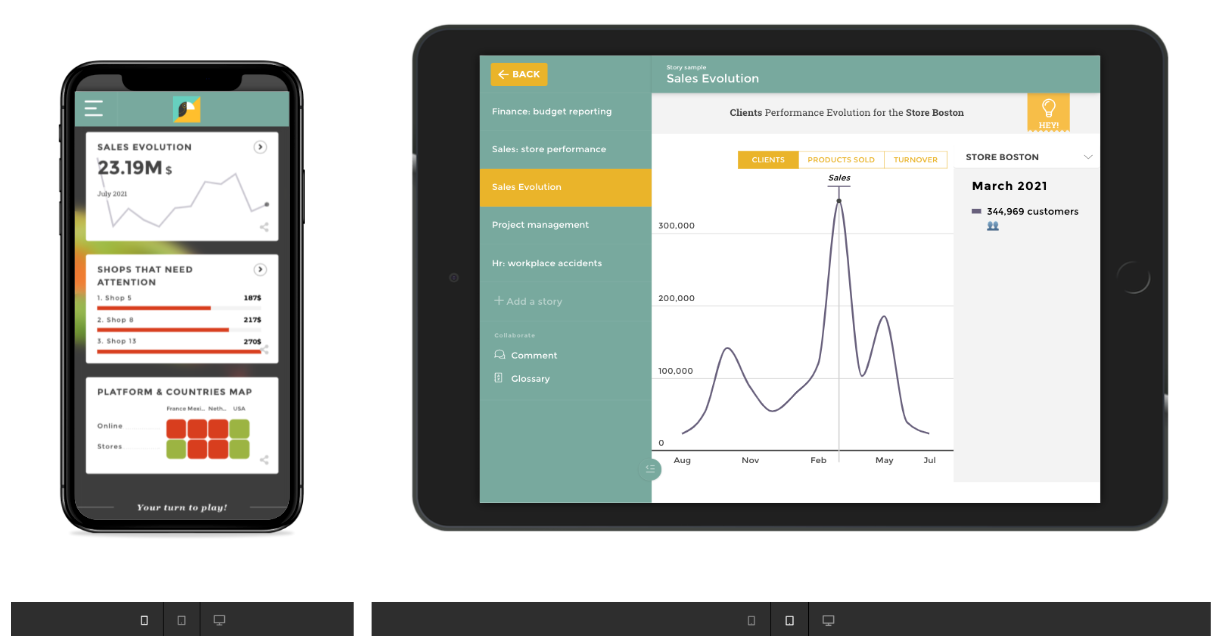
Toucan is a cloud-based guided analytics platform built with one goal in mind: reduce the complexity of bringing data insights to business users. For this purpose, Toucan provides a no-code and comprehensive user experience at every stage of the data storytelling application, which includes data connection, building the visualization, and distribution on any device.
If you’re in a hurry and want to see what you can do with this integration, check out Shark attacks visualization with AWS & Toucan, where Redshift Serverless and Toucan help in understanding the evolution of shark attacks in the world.
Overview of solution
There are many BI tools in the market, each providing an ever-increasing set of capabilities and customization options to differentiate from the competition. Paradoxically, this doesn’t seem to increase the adoption rate of BI tools in enterprises. With more complex tools, data owners spend time building fancy visuals, and tend to add as much information as possible in their dashboards instead of providing a clear and simple message to business users.
In this post, we illustrate the concept of guided analytics by putting ourselves in the shoes of a data engineer that needs to communicate stories to business users with data visualizations. This fictional data engineer has to create dashboards to understand how shark attacks evolved in the last 120 years. After loading the shark attacks dataset in Redshift Serverless, we guide you in using Toucan to build stories that provide a better understanding of shark attacks through time. With Toucan, you can natively connect to datasets in Redshift Serverless, transform the data with a no-code interface, build storytelling visuals, and publish them for business users. The shark attacks visualization example illustrates what you can achieve by following instructions in this post.
Additionally, we have recorded a video tutorial that explains how to connect Toucan with Redshift Serverless and start building charts.
Solution architecture
The following diagram depicts the architecture of our solution.
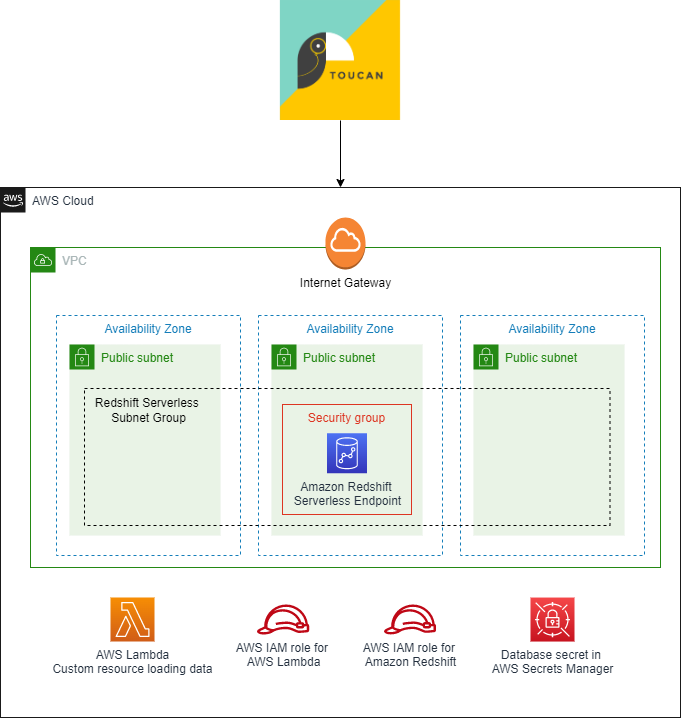
We use an AWS CloudFormation stack to deploy all the resources you need in your AWS account:
- Networking components – This includes a VPC, three public subnets, an internet gateway, and a security group to host the Redshift Serverless endpoint. In this post, we use public subnets to facilitate data access from external sources such as Toucan instances. In this case, the data in Redshift Serverless is still protected by the security group that restricts incoming traffic, and by the database credentials. For a production workload, it is recommended to keep traffic in the Amazon network. For that, you can set the Redshift Serverless endpoints in private subnets, and deploy Toucan in your AWS account through the AWS Marketplace.
- Redshift Serverless components – This includes a Redshift Serverless namespace and workgroup. The Redshift Serverless workspace is publicly accessible to facilitate the connection from Toucan instances. The database name and the administrator user name are defined as parameters when deploying the CloudFormation stack, and the administrator password is created in AWS Secrets Manager. In this post, we use database credentials to connect to Redshift Serverless, but Toucan also supports connection with AWS credentials and AWS Identity and Access Management (IAM) profiles.
- Custom resources – The CloudFormation stack includes a custom resource, which is an AWS Lambda function that loads shark attacks data automatically in your Redshift Serverless database when the CloudFormation stack is created.
- IAM roles and permissions – Finally, the CloudFormation stack includes all IAM roles associated with services previously mentioned to interact with other AWS resources in your account.
In the following sections, we provide all the instructions to connect Toucan with your data in Redshift Serverless, and guide you to build your data storytelling application.
Sample dataset
In this post, we use a custom dataset that lists all known shark attacks in the world, starting from 1900. You don’t have to import the data yourself; we use the Amazon Redshift COPY command to load the data when deploying the CloudFormation stack. The COPY command is one the fastest and most scalable methods to load data into Amazon Redshift. For more information, refer to Using a COPY command to load data.
The dataset contains 4,900 records with the following columns:
- Date
- Year
- Decade
- Century
- Type
- Zone_Type
- Zone
- Country
- Activity
- Sex
- Age
- Fatal
- Time
- Species
- href (a PDF link with the description of the context)
- Case_Number
Prerequisites
For this solution, you should have the following prerequisites:
- An AWS account. If you don’t have one already, see the instructions in Sign Up for AWS.
- An IAM user or role with permissions on AWS resources used in this solution.
- A Toucan free trial to build the data storytelling application.
Set up the AWS resources
You can launch the CloudFormation stack in any Region where Redshift Serverless is available.
- Choose Launch Stack to start creating the required AWS resources for this post:
![]()
- Specify the database name in Redshift Serverless (default is
dev). - Specify the administrator user name (default is
admin).
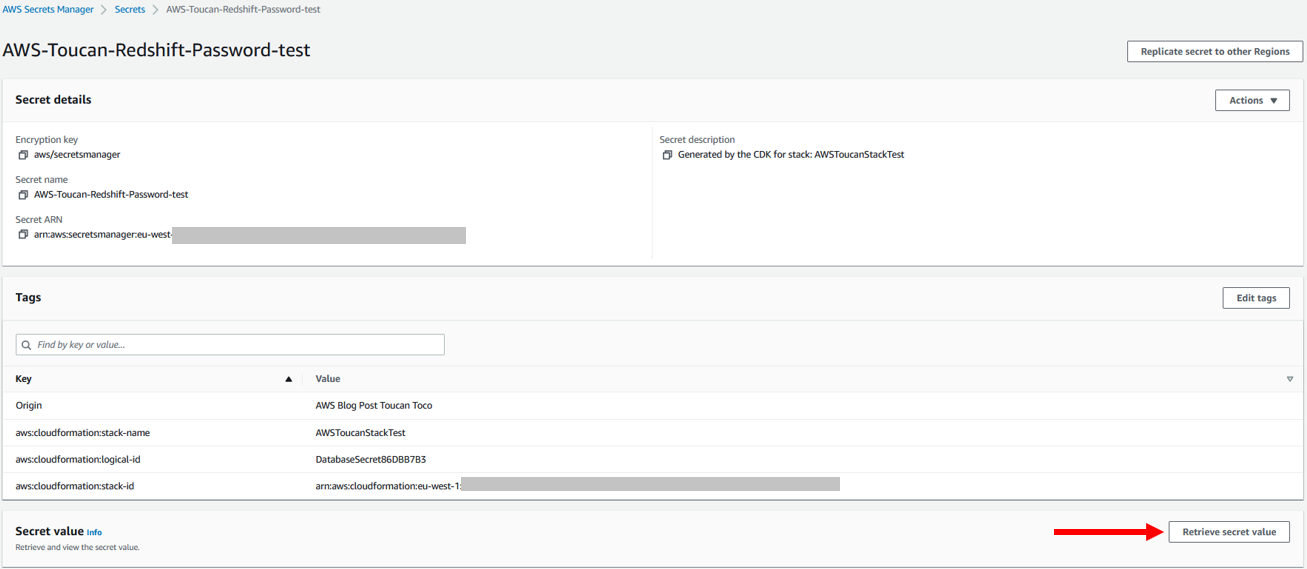
You don’t have to specify the database administrator password because it’s created in Secrets Manager by the CloudFormation stack. The secret’s name is AWS-Toucan-Redshift-Password. We use the secret value in subsequent steps.
Test the deployment
The CloudFormation stack takes a few minutes to deploy. When it’s complete, you can confirm the resources were created. To access your data, you need to get the Redshift Serverless database credentials.
- On the Outputs tab for the CloudFormation stack, note the name of the Secrets Manager secret.

- On the Secrets Manager console, navigate to the Amazon Redshift database secret and choose Retrieve secret value to get the database administrator user name and password.
- To make sure your Redshift Serverless database is available and contains the shark attacks dataset, open the Redshift Serverless workgroup on the Amazon Redshift console and choose Query data to access the query editor.
- Also note the Redshift Serverless endpoint, which you need to connect with Toucan.

- In the Amazon Redshift query editor, run the following SQL query to view the shark attacks data:
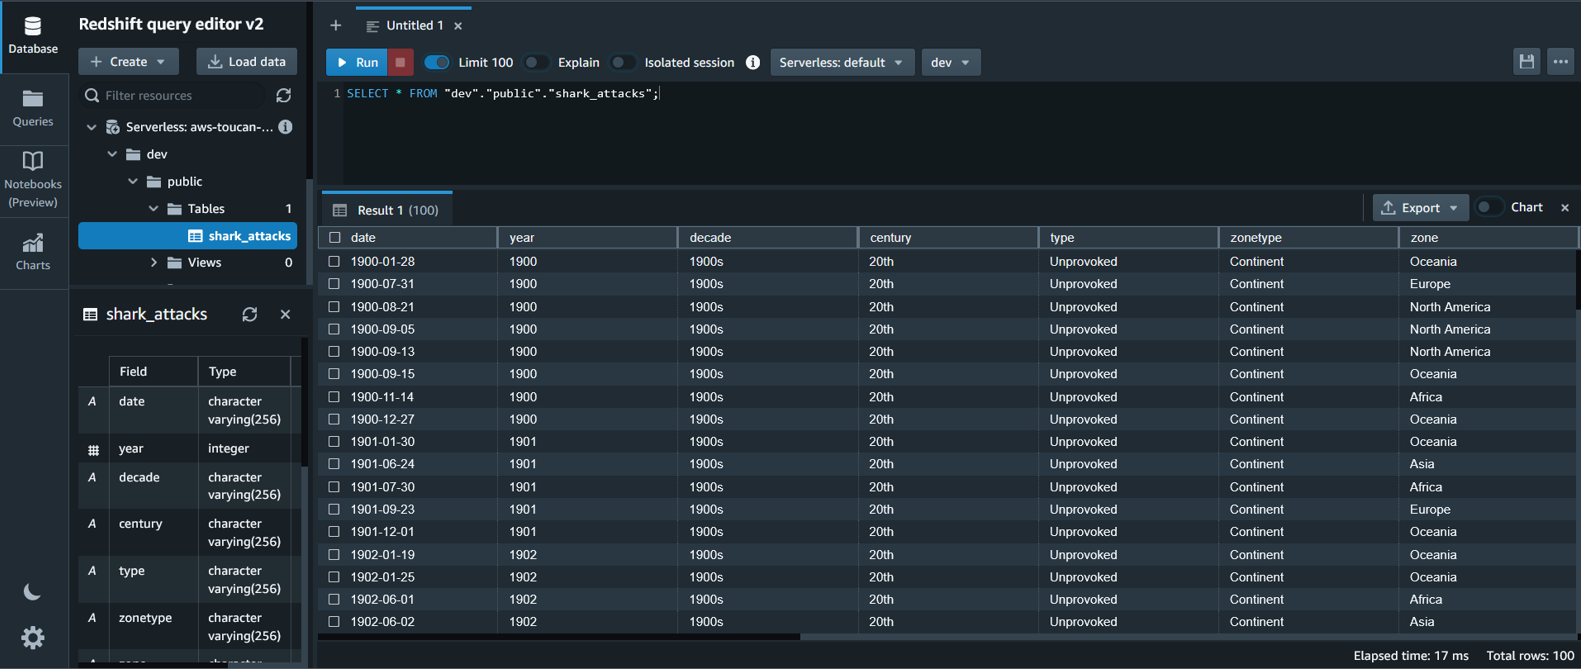
Note that you need to change the name of the database in the SQL query if you change the default value when launching the CloudFormation stack.
You have configured Redshift Serverless in your AWS account and uploaded the shark attacks dataset. Now it’s time to use this data by building a storytelling application.
Launch your Toucan free trial
The first step is to access Toucan platform through the Toucan free trial.
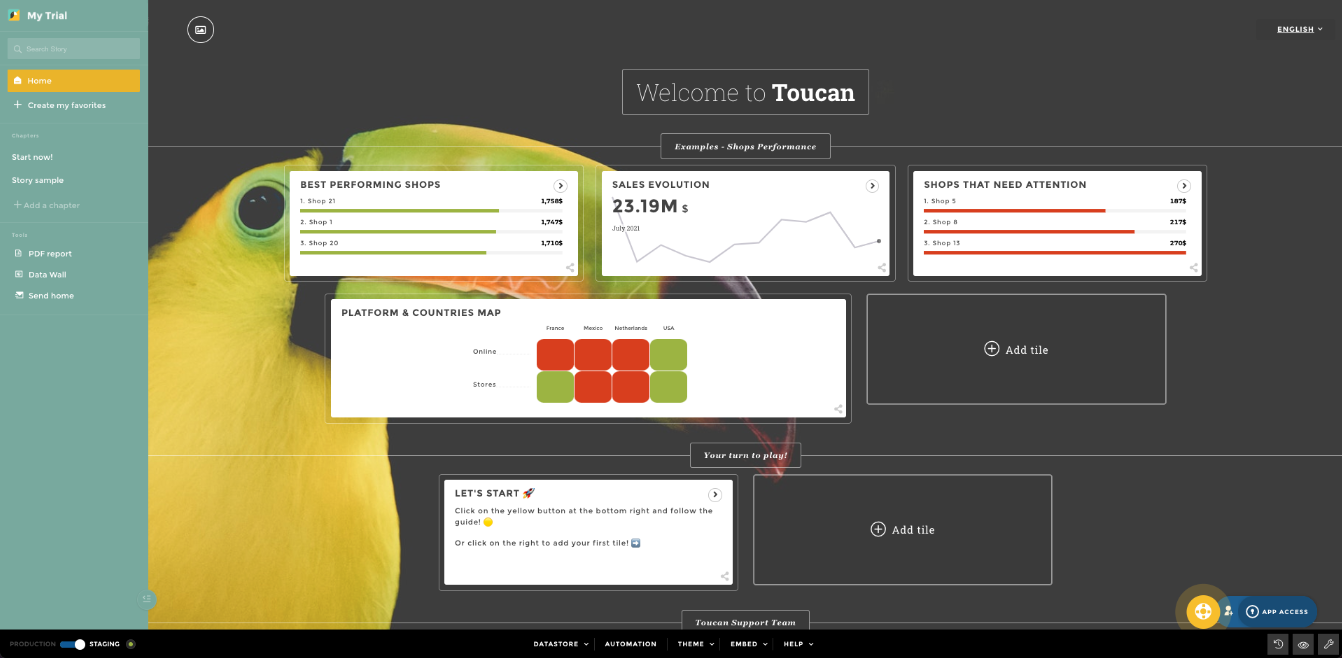
Fill the form and complete the signup steps. You then arrive in the Storytelling Studio, in Staging mode. Feel free to explore what has been already created.
Connect Redshift Serverless with Toucan
To connect Redshift Serverless and Toucan, complete the following steps:
- Choose Datastore at the bottom of the Toucan Storytelling Studio.
- Choose Connectors.
Toucan is natively integrated with Redshift Serverless with AnyConnect.
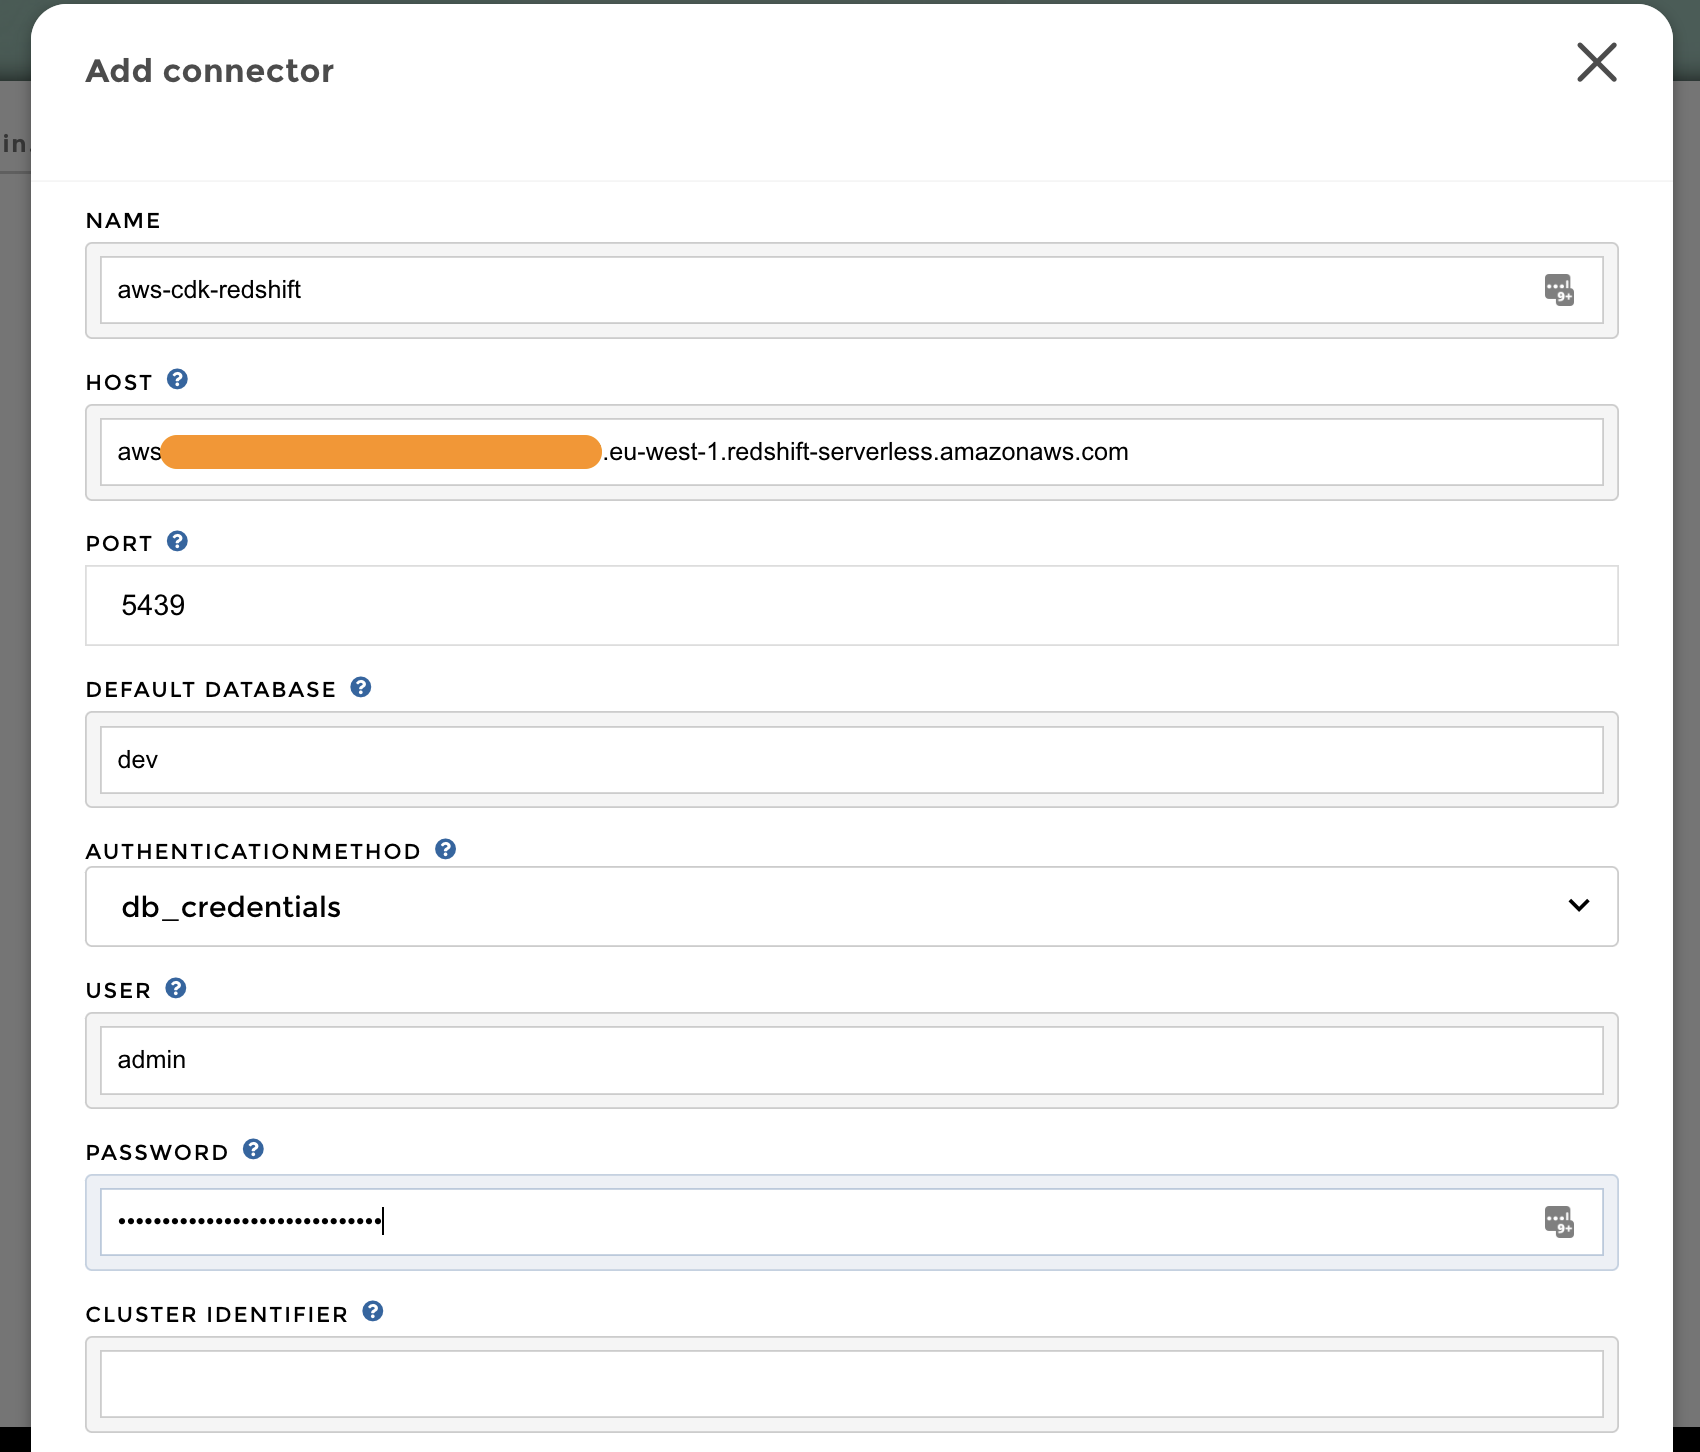
- Search for the Amazon Redshift connector, and complete the form with the following information:
- Name – The name of the connector in Toucan.
- Host – Your Redshift Serverless endpoint.
- Port – The listening port of your Amazon Redshift database (5439).
- Default Database – The name of the database to connect to (dev by default, unless edited in the CloudFormation stack parameters).
- Authentication Method – The authentication mechanism to connect to Redshift Serverless. In this case, we use database credentials.
- User – The user name to use for authentication with Redshift Serverless (admin by default, unless edited in the CloudFormation stack parameters).
- Password – The password to use for authentication with Redshift Serverless (you should retrieve it from Secrets Manager; the secret’s name is
AWS-Toucan-Redshift-Password).
Create a live query
You are now connected to Redshift Serverless. Complete the following steps to create a query:
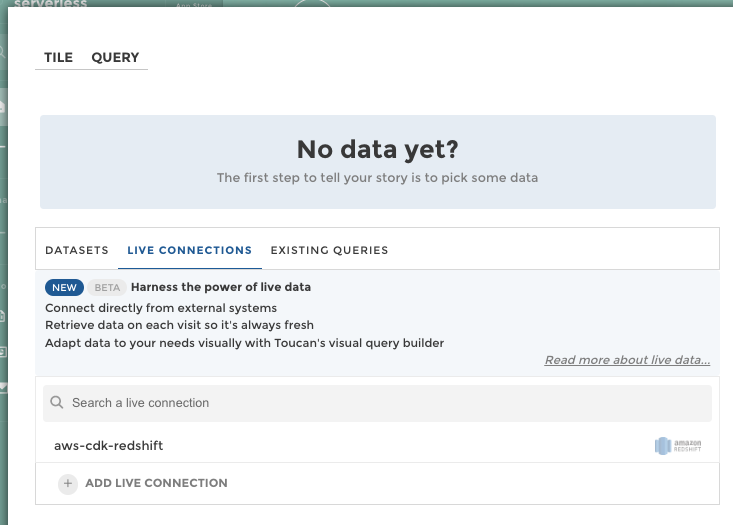
- On the home page, choose Add tile to create a new visualization.

- Choose the Live Connections tab, then choose the Amazon Redshift connector you created in the previous step.
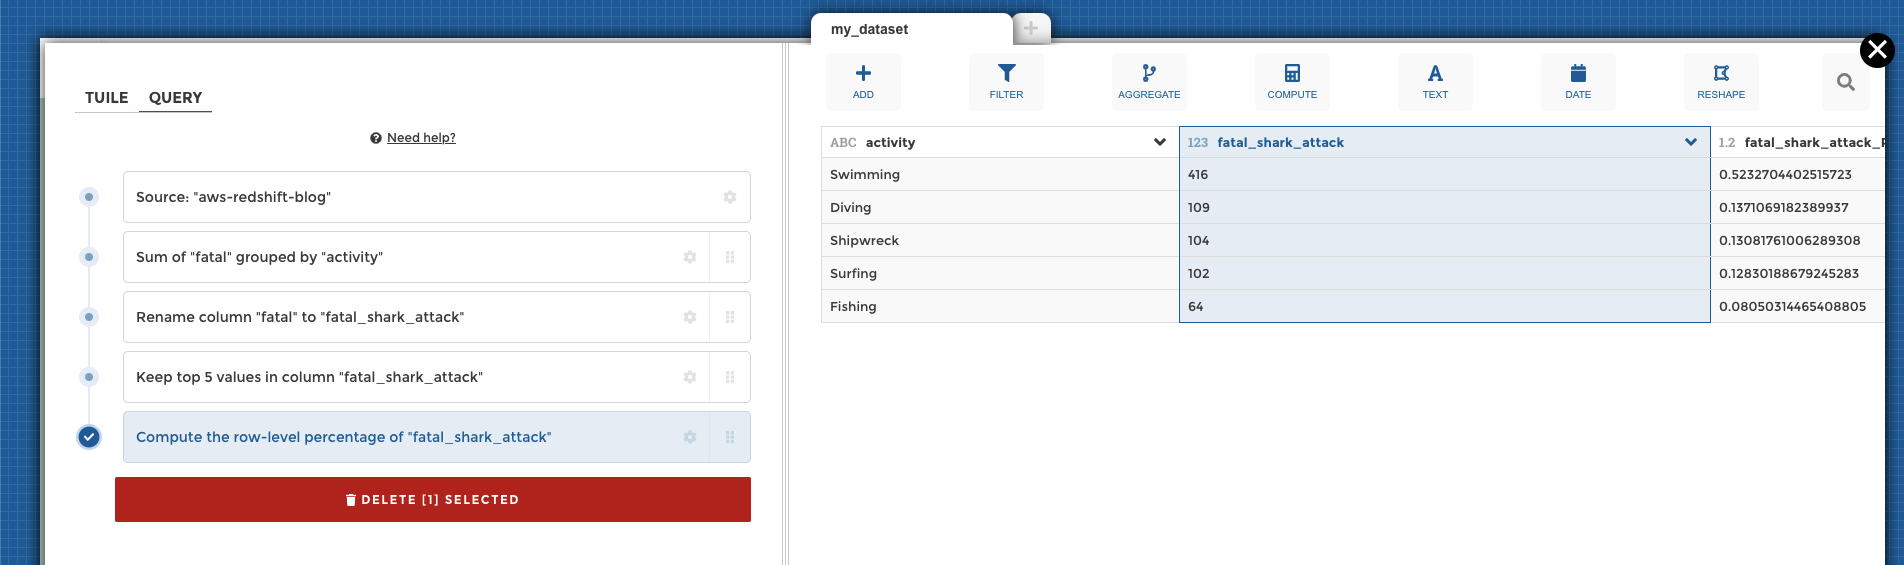
The Toucan trial guides you in building your first live query, in which you can transform your data without writing code using the Toucan YouPrep module.
For instance, as shown in the following screenshot, you can use this no-code interface to compute the sum of fatal shark attacks by activities, get the top five, and calculate the percentage of the total.
Build your first chart
When your data is ready, choose the Tile tab and complete the form that helps you build charts.
For example, you can configure a leaderboard of the five most dangerous activities, and add a highlight for activities with more than 100 attacks.
Choose Save Changes to save your work and go back to the home page.

Publish and share your work
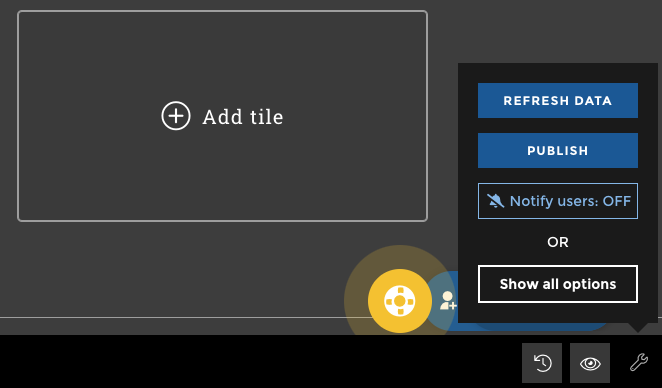
Until this stage, you have been working in working in Staging mode. To make your work available to everyone, you need to publish it into Production.
On the bottom right of the home page, choose the eye icon to preview your work by putting yourself in the shoes of your future end-users. You can then choose Publish to make your work available to all.
Toucan also offers multiple embedding options to make your charts easier for end-users to access, such as mobile and tablet.
Following these steps, you connected to Redshift Serverless, transformed the data with the Toucan no-code interface, and built data visualizations for business end-users. The Toucan trial guides you in every stage of this process to help you get started.
Redshift Serverless and Toucan guided analytics provide an efficient approach to increase the adoption rate of BI tools by decreasing infrastructure work for data engineers, and by simplifying dashboard understanding for business end-users. This post only covered a small part of what Redshift Serverless and Toucan offer, so feel free to explore other functionalities in the Amazon Redshift Serverless documentation and Toucan documentation.
Clean up
Some of the resources deployed in this post through the CloudFormation template incur costs as long as they’re in use. Be sure to remove the resources and clean up your work when you’re finished in order to avoid unnecessary cost.
On the CloudFormation console, choose Delete stack to remove all resources.
Conclusion
This post showed you how to set up an end-to-end architecture for guided analytics with Redshift Serverless and Toucan.
This solution benefits from the scalability of Redshift Serverless, which enables you to store, transform, and expose data in a cost-efficient way, and without any infrastructure to manage. Redshift Serverless natively integrates with Toucan, a guided analytics tool designed to be used by everyone, on any device.
Guided analytics focuses on communicating stories through data reports. By setting intentional constraints on customization options, Toucan makes it easy for data owners to build meaningful dashboards with a clear and concise message for end-users. It works for both your internal and external customers, on an unlimited number of use cases.
Try it now with our CloudFormation template and a free Toucan trial!
About the Authors
 Louis Hourcade is a Data Scientist in the AWS Professional Services team. He works with AWS customer across various industries to accelerate their business outcomes with innovative technologies. In his spare time he enjoys running, climbing big rocks, and surfing (not so big) waves.
 Benjamin Menuet is a Data Architect with AWS Professional Services. He helps customers develop big data and analytics solutions to accelerate their business outcomes. Outside of work, Benjamin is a trail runner and has finished some mythic races like the UTMB.
 Xavier Naunay is a Data Architect with AWS Professional Services. He is part of the AWS ProServe team, helping enterprise customers solve complex problems using AWS services. In his free time, he is either traveling or learning about technology and other cultures.
 Django Bouchez is a Solution Engineer at Toucan. He works alongside the Sales team to provide support on technical and functional validation and proof, and is also helping R&D demo new features with Cloud Partners like AWS. Outside of work, Django is a homebrewer and practices scuba diving and sport climbing.