Post Syndicated from Stephanie Doyle original https://www.backblaze.com/blog/backblaze-drive-stats-for-q1-2026/

Long time readers: I must start with a mea culpa that this article was not released on our traditional May the Fourth (or thereabouts) report date. Please know I missed making the many and sundry Star Wars puns as much as (I’m sure) you missed hearing them—so, I’ll probably slip a few in, just because.
That said, there was good reason for the delay. We were diligently investigating a disturbance in the force. (See? We’re back!) We’ll get into the details after we dig into the numbers, but here’s the teaser: this quarter, we observed something unusual in the data that wasn’t entirely a failure trend. It did, however, prompt us to revisit and validate the assumptions behind our Drive Stats analysis before publishing.
Sign up for the Drive Stats webinar
Ready to dive deeper into the data? Tune in Wednesday, July 15, 2026 at 12:00 noon PT, as Sr. Market Intelligence Manager, Stephanie Doyle, and Sr. Product Marketing Manager, Laquie Campbell review the trends.
Q1 2026 Hard drive failure rates
As of the end of Q1 2026, Backblaze was monitoring 345,662 drives used to store data. For our evaluation, we removed from consideration 3,907 boot drives and 492 hard drives, as they did not meet the criteria to be included. We’ll discuss the criteria we used in the next section of this report. Removing these drives leaves us with 341,263 hard drives to analyze. The table below shows the annualized failure rates for Q1 2026 for this collection of drives.
Backblaze Hard Drive Failure Rates for Q1 2026
Reporting period January 1, 2026–March 31, 2026 inclusive
Drive models with drive count > 100 and drive days > 10,000 as of March 31, 2026 in Q1 2026.
| MFG | Model | Size (TB) | Drive Count | Avg. Age (Months) | Drive Days | Drive Failures | AFR (%) |
|---|---|---|---|---|---|---|---|
| HGST | HUH728080ALE600 | 8 | 1,026 | 87.8 | 3,252,052 | 125 | 1.4 |
| HGST | HUH721212ALE600 | 12 | 2,608 | 74.5 | 6,115,413 | 104 | 0.62 |
| HGST | HUH721212ALE604 | 12 | 13,277 | 55 | 24,018,962 | 1,114 | 1.69 |
| HGST | HUH721212ALN604 | 12 | 9,780 | 77.4 | 26,914,795 | 1,678 | 2.28 |
| Seagate | ST8000DM002 | 8 | 8,910 | 105.5 | 33,115,836 | 1,380 | 1.52 |
| Seagate | ST8000NM0055 | 8 | 13,232 | 94.6 | 45,131,414 | 2,404 | 1.94 |
| Seagate | ST10000NM0086 | 10 | 981 | 89.9 | 3,566,716 | 306 | 3.13 |
| Seagate | ST12000NM0007 | 12 | 983 | 31.6 | 37,325,724 | 2,297 | 2.25 |
| Seagate | ST12000NM0008 | 12 | 18,650 | 67.2 | 43,012,820 | 2,466 | 2.09 |
| Seagate | ST12000NM000J | 12 | 1,087 | 18.6 | 632,857 | 22 | 1.27 |
| Seagate | ST12000NM001G | 12 | 13,216 | 59.5 | 25,106,715 | 679 | 0.99 |
| Seagate | ST14000NM001G | 14 | 10,519 | 58.4 | 20,025,909 | 756 | 1.38 |
| Seagate | ST14000NM0138 | 14 | 1,251 | 53.8 | 2,767,654 | 438 | 5.78 |
| Seagate | ST16000NM001G | 16 | 34,729 | 40.7 | 44,065,062 | 820 | 0.68 |
| Seagate | ST24000NM002H | 24 | 9,605 | 9.3 | 2,779,100 | 220 | 2.89 |
| Toshiba | MG07ACA14TA | 14 | 37,263 | 62.6 | 75,018,084 | 2,114 | 1.03 |
| Toshiba | MG07ACA14TEY | 14 | 996 | 38.4 | 1,235,801 | 58 | 1.71 |
| Toshiba | MG08ACA16TA | 16 | 40,036 | 30.4 | 37,906,446 | 1,113 | 1.07 |
| Toshiba | MG08ACA16TE | 16 | 6,264 | 47.6 | 9,544,691 | 325 | 1.24 |
| Toshiba | MG08ACA16TEY | 16 | 4,885 | 49.4 | 8,035,780 | 519 | 2.36 |
| Toshiba | MG09ACA16TE | 16 | 506 | 6.5 | 101,383 | 4 | 1.44 |
| Toshiba | MG10ACA20TE | 20 | 20,451 | 11.5 | 7,206,903 | 137 | 0.69 |
| Toshiba | MG11ACA24TE | 24 | 7,203 | 4 | 869,474 | 10 | 0.42 |
| WDC | WUH721414ALE6L4 | 14 | 8,640 | 60.6 | 16,344,031 | 231 | 0.52 |
| WDC | WUH721816ALE6L0 | 16 | 2,994 | 50 | 4,665,417 | 133 | 1.04 |
| WDC | WUH721816ALE6L4 | 16 | 26,801 | 34.4 | 28,463,214 | 394 | 0.51 |
| WDC | WUH722222ALE6L4 | 22 | 45,638 | 16.1 | 22,472,050 | 360 | 0.58 |
| WDC | WUH722626ALE6L4 | 26 | 3,604 | 2.5 | 274,161 | 5 | 0.67 |
| Totals | 529,968,464 | 20,212 | 1.39 |
Note and observations
- The quarterly AFR is 1.24%. This is up from last quarter, but down from the previous year.
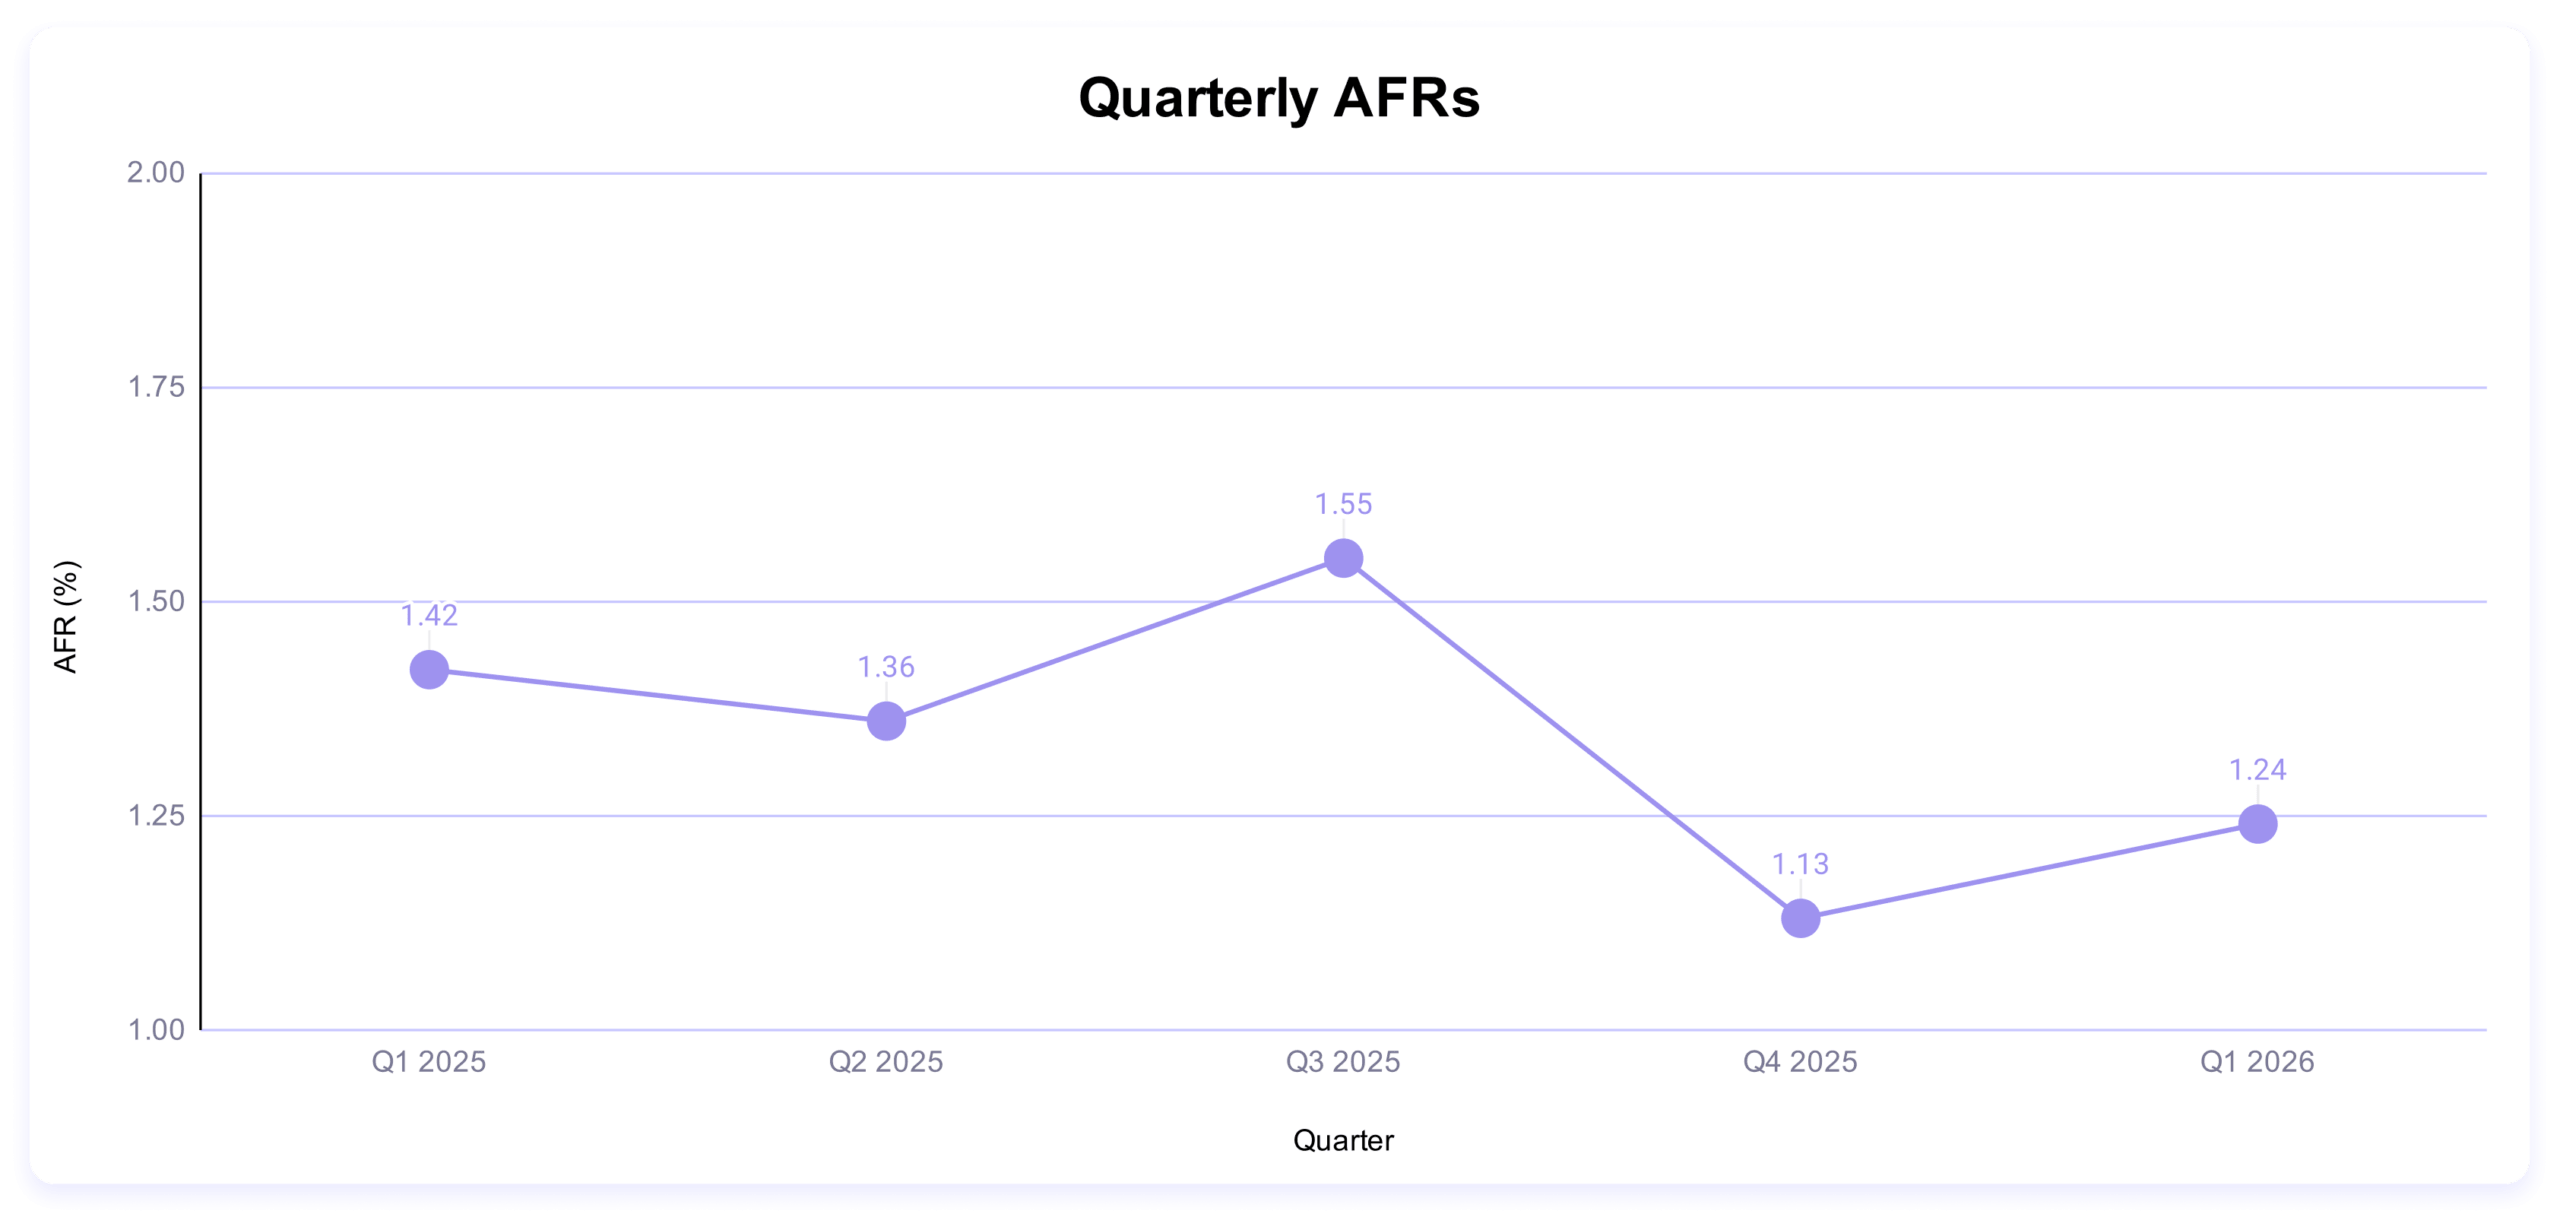
- No new drive models this quarter. That’s not unheard of, but it’s pretty rare. In the last eight quarters, we’ve had new drives six times.
- The investment in higher capacity drives continues. We deployed 10,220 drives last quarter, and 9,404 of those drives had a capacity of more than 20TB. While these drives are still fairly young, their AFR is an impressive 0.85% as a pool.
- Impressive, most impressive. These drives had zero failures:
- HGST HMS5C4040BLE640 (4TB)
- HGST HUH728080ALE600 (8TB)
- Seagate ST16000NM002J (16TB)
- And these drives had one:
- Seagate ST8000NM000A (8TB)
- Seagate ST12000NM000J (12TB)
- Seagate ST14000NM000J (14TB)
- Seagate ST16000NM000J (16TB)
- Toshiba MG09ACA16TE (16TB)
That list proves a point we’ve made in a few different quarters: net failure does not necessarily mean a low AFR. On this list, the Seagate ST16000NM000J (16TB) came in with a 3.61% AFR—when there are only 129 drives left in the fleet, even one failure spikes the AFR.
These aren’t the drives you’re looking for
As mentioned, we remove drives that don’t meet our criteria. We’ve covered the reasons that we’ve designed these exclusions in past reports, but here’s the quick and dirty:
| Period | Drive Count | Drive Days |
|---|---|---|
| Quarterly | > 100 | > 10,000 |
| Annual | > 250 | > 50,000 |
| Lifetime | > 500 | >100,000 |
Regardless of whether or not a given drive model is included in this article’s charts and tables, all of the line item data is included in our Drive Stats dataset which you can download by visiting our Drive Stats page.

Lifetime hard drive failure rates
Now let’s look at the lifetime failure rates. A reminder that
Backblaze Lifetime Hard Drive Failure Rates
Reporting period January 1, 2026–March 31, 2026 inclusive
Drive models with drive count > 100 and drive days > 10,000 as of March 31, 2026 in Q1 2026.
| MFG | Model | Size (TB) | Drive Count | Avg. Age (Months) | Drive Days | Drive Failures | AFR (%) |
|---|---|---|---|---|---|---|---|
| HGST | HMS5C4040BLE640 | 4 | 186 | 106.1 | 15,858 | 0 | 0 |
| HGST | HUH728080ALE600 | 8 | 1,026 | 93 | 86,921 | 0 | 0 |
| HGST | HUH721212ALE600 | 12 | 2,608 | 75.4 | 234,350 | 8 | 1.25 |
| HGST | HUH721212ALE604 | 12 | 13,277 | 56.5 | 1,183,774 | 86 | 2.65 |
| HGST | HUH721212ALN604 | 12 | 9,780 | 80.9 | 870,252 | 95 | 3.98 |
| Seagate | ST8000DM002 | 8 | 8,910 | 112.3 | 639,473 | 25 | 1.43 |
| Seagate | ST8000NM000A | 8 | 247 | 37.9 | 21,552 | 1 | 1.69 |
| Seagate | ST8000NM0055 | 8 | 13,232 | 101.5 | 1,176,619 | 39 | 1.21 |
| Seagate | ST10000NM0086 | 10 | 981 | 98.3 | 86,667 | 11 | 4.63 |
| Seagate | ST12000NM0007 | 12 | 983 | 75.8 | 87,389 | 11 | 4.59 |
| Seagate | ST12000NM0008 | 12 | 18,650 | 70.7 | 1,664,558 | 129 | 2.83 |
| Seagate | ST12000NM000J | 12 | 1,087 | 19 | 96,887 | 1 | 0.38 |
| Seagate | ST12000NM001G | 12 | 13,216 | 60.7 | 1,185,545 | 33 | 1.02 |
| Seagate | ST14000NM000J | 14 | 433 | 16.2 | 37,258 | 1 | 0.98 |
| Seagate | ST14000NM001G | 14 | 10,519 | 60.3 | 944,400 | 21 | 0.81 |
| Seagate | ST14000NM0138 | 14 | 1,251 | 62.6 | 111,709 | 15 | 4.9 |
| Seagate | ST16000NM000J | 16 | 129 | 17 | 10,117 | 1 | 3.61 |
| Seagate | ST16000NM001G | 16 | 34,729 | 41.2 | 3,098,105 | 44 | 0.52 |
| Seagate | ST16000NM002J | 16 | 466 | 38.8 | 41,931 | 0 | 0 |
| Seagate | ST24000NM002H | 24 | 9,605 | 9.3 | 820,090 | 74 | 3.29 |
| Toshiba | MG07ACA14TA | 14 | 37,263 | 64.1 | 3,343,724 | 94 | 1.03 |
| Toshiba | MG07ACA14TEY | 14 | 996 | 39.8 | 88,602 | 5 | 2.06 |
| Toshiba | MG08ACA16TA | 16 | 40,036 | 30.7 | 3,548,250 | 102 | 1.05 |
| Toshiba | MG08ACA16TE | 16 | 6,264 | 48.9 | 553,878 | 21 | 1.38 |
| Toshiba | MG08ACA16TEY | 16 | 4,885 | 50.5 | 435,063 | 26 | 2.18 |
| Toshiba | MG09ACA16TE | 16 | 506 | 6.6 | 36,988 | 1 | 0.99 |
| Toshiba | MG10ACA20TE | 20 | 20,451 | 11.6 | 1,665,263 | 42 | 0.92 |
| Toshiba | MG11ACA24TE | 24 | 7,203 | 4 | 495,387 | 3 | 0.22 |
| WDC | WUH721414ALE6L4 | 14 | 8,640 | 61.3 | 776,557 | 7 | 0.33 |
| WDC | WUH721816ALE6L0 | 16 | 2,994 | 50.4 | 267,868 | 24 | 3.27 |
| WDC | WUH721816ALE6L4 | 16 | 26,801 | 34.6 | 2,402,732 | 64 | 0.97 |
| WDC | WUH722222ALE6L4 | 22 | 45,638 | 16.1 | 3,992,942 | 42 | 0.38 |
| WDC | WUH722626ALE6L4 | 26 | 3,604 | 2.5 | 182,471 | 4 | 0.8 |
| Totals | 30,203,180 | 1030 | 1.24 |
Notes and observations
- Stay on target. The lifetime failure rate is 1.39%.
- Hello there! Three drives make their appearance on the lifetime table, including our 26TB drive (which was just under on drive days last time around):
- Toshiba MG09ACA16TE (16TB)
- WDC WUH722222ALE6L4 (22TB)
- WDC WUH722626ALE6L4 (26TB)
- You served me well. The last of our 4TB drives have finally dropped below the exclusion criteria for the lifetime table. The HGST HMS5C4040ALE640 is completely gone, while the HGST HMS5C4040BLE640 (4TB) has just 186 drives left in the pool.
Do or do not: When failure isn’t the only metric in play
As I teased in the introduction, this quarter, some unexpected behavior brought forth one of the most interesting edge cases we’ve seen in a while, and it spotlights some relevant truths about the Drive Stats project. More interestingly, it showed up with only slightly higher failure rates, partially because of some mitigation steps we were able to take. Stay with me—there are multiple, overlapping issues at play.
We’ve said often that individual drives within a manufacturer pool, and even within a single drive model, can vary quite a bit. On these particular drives, that was the case: there were two different mechanical issues, one which affected writes and one which affected drives when they power cycled. The fact that it was two different types of issues made the initial investigation more difficult, and depending on the age of the drive, either, both, or neither issue could have affected the drive model.
Additionally, in both of those types of errors, it didn’t affect every drive in the pool, and for a long period of time, the failure rate was actually acceptable. Once we saw more of the failures happening, we correlated with the power issue, and we could help mitigate by reducing the frequency of the power cycling systems for Vaults that contained these drives. What that looked like in practice is that we put the Vaults with suspected issues into no-upload mode and kept them in reserve. Once the investigation was complete, we were able to understand the full picture.
The point I want to highlight here is one that I’ve made quite often: our drive failure rates, and what we report on in general, is the function of people actively managing failure and risk. You can see that clearly here—mitigating one of the two root causes reduced overall risk for this drive model; and, while we were doing that, we had an alternative option that let us use the drives, albeit in a different way.
Meanwhile, it also reflects the point we’ve been making from the beginning of time, from way back when we said “why not use consumer hardware to create a storage cloud?” Some level of risk is always acceptable. A system that pushes for absolutely zero failures on the hardware level is imprudent, given that our software layer largely prevents data loss.
Always two there are
And yet, this investigation was particularly impactful because we saw a decent number of drives (not all of them—again, multiple causes to this incident) that were day one failures. Because that’s true, there’s another important piece of the puzzle to consider, one that speaks to the ways we define a failure and the ways the Drive Stats program is written.
The short version is that at the end of each day, a C++ program collects the various SMART stats. If a drive was there the day before and is not there the day of, then it’s logged as a failure. There are other pieces of the puzzle as well, including a lookback period. So if the disappeared drive serial number shows back up on day two (or three or four), it retroactively tells us that it wasn’t a failure. We cut that off at the end of the quarter, which means there’s a handful of drives that might be false positives on that kind of failure, but the probability is quite low (and you have to cut things off somewhere).
But the more important part of things is this: Drive Stats is a function of conditional logic. Because it defines a failure based on a drive’s presence in the pool the day before, that means we can’t define day one failures using only the Drive Stats program.
What does that mean for us going forward? Have we been completely under-reporting day one failures? Short answer: yes, probably. But, back to that whole “managed environment” caveat—once drives enter data centers, they’ve already gone through a period of drive qualification. So, it’s relatively rare we have day one failures to begin with.
But, that does mean that we should caveat things appropriately, particularly if you’re one of the folks who likes to use the full dataset for your projects. The logline data compiles SMART stats, but only for drives that have the chutzpah to make it to the end of day one.
Remember the Drive Stats will be with you, always
Thank you, as always, for following Drive Stats. We had some folks reach out to make sure the report was going live, particularly because we lost an important member of the team recently, the inimitable Pat Patterson. We appreciate all the well wishes, and the patience.
Here’s our standard fine print:
The complete dataset used to create the tables and charts in this report is available on our Hard Drive Test Data page. You can download and use this data for free for your own purpose. All we ask are three things:
- You cite Backblaze as the source if you use the data;
- You accept that you are solely responsible for how you use the data, and;
- You do not sell this data itself to anyone; it is free.
If you’re a new Drive Stats fan, consider signing up for the newsletter. If you’re not ready for that kind of commitment, sound off in the comments section below or reach out directly to us to let us know what you’re working on. May the Stats be with you!
The post Backblaze Drive Stats for Q1 2026 appeared first on Backblaze Blog | Cloud Storage & Cloud Backup