All posts by Stephanie Doyle

Backblaze Drive Stats: How an Open Dataset Powers Academic and AI/ML Research

Post Syndicated from Stephanie Doyle original https://www.backblaze.com/blog/backblaze-drive-stats-academic-ai-ml-research/

A decorative image showing stylized hard drives.

Since April 2013, Backblaze has published the daily health readings of every hard drive running in our data centers. Model, serial number, failure flag, and dozens of Self-Monitoring, Analysis, and Reporting Technology (SMART) attributes, collected into a CSV for each day, released publicly every quarter, for free. We built Drive Stats as a mechanism to understand our own fleet, then published almost on a whim—so much so that the original idea is credited to two Brians. What happened next was an exciting surprise.

More than 227 papers and articles have cited Drive Stats as a primary dataset since 2018. Researchers have trained transformer architectures, long short-term memory (LSTM) networks, survival models, and gradient-boosted ensembles on it. The dataset that started as an internal reliability tool has become one of the most-cited open benchmarks in hard drive failure prediction research.

What makes Drive Stats so valuable?

Drive Stats reflects a live, continuously operating commercial fleet of drives: different manufacturers, different models, different capacities, all spinning in production Storage Pods under real workload conditions. That combination of scale and heterogeneity is rare, and it is exactly what makes the dataset especially useful to researchers.

For storage engineers and data scientists, the dataset checks every important box: real-world origin, a long time horizon, labeled failures, an open license, and an active maintainer that publishes new data each quarter. Here are a few other specifics worth understanding before diving into the research:

  • Download access: The full quarterly archive is available for free on the Backblaze Drive Stats page under the MIT License. 
  • Open license: Backblaze asks three things of anyone who uses the data: that they cite Backblaze as the source, they accept responsibility for how the data is used, and they do not resell it. 
  • SMART attributes: Each daily snapshot includes raw and normalized values for more than 70 different SMART attributes per drive. We define a drive failure in our dataset based on a few metrics, which we talk about in previous reports, as well as articles dedicated to parsing the program. 
  • Scope and coverage: We began publishing quarterly hard drive data in 2013. The current dataset spans more than a decade of operation and covers hundreds of thousands of individual drives across manufacturers including Seagate, HGST, Western Digital, and Toshiba. Each year, we also compile data related to annualized failure rates (AFR) and lifetime failure rates across all manufacturers. Lifetime failure rates indicate the probability that a drive will fail over the course of its lifetime, while AFR indicates the probability a drive will fail during a year of operation. Rates are expressed as a percentage. Data related to lifetime failure excludes drive manufacturers with less than 500 units deployed, and all drives must have 100,000 active drive days to be included in the lifetime data set. The 2025 annual report recorded an annualized failure rate (AFR) of 1.36% across the fleet, down slightly from 1.57% in 2024, reflecting multiple factors (average drive age, technology improvements, drive size increases, cost per gigabyte, and market demand). 

Most importantly: the economics of drives, and the measures people take to keep them spinning within a data center, are fundamentally different than in a consumer use case. In some ways, it’s the perfect test—the drives are always on, and we run them until they give up the ghost. In others, it’s a bit deceptive—most people don’t have alerts set up to monitor drive health in their home environments. 

Of course, many do. Data is important, and for those who schedule weekly maintenance for your home networks: we love it, we’re here for it, and us too.

Academic research built on Drive Stats

The papers below represent a cross-section of research that uses Drive Stats as a primary dataset. Each represents a meaningfully different approach to the same core problem: predicting when a hard drive will fail, with enough lead time to act on it.

TFBEST: Dual-Aspect Transformer With Learnable Positional Encoding for Failure Prediction

Authors: Rohan Mohapatra, Saptarshi Sengupta

Venue: arXiv preprint 

Submitted: September 2023

Experiments on Seagate hard disk drive (HDD) data led the authors to propose a novel transformer architecture for predicting failures in hard drives that significantly outperformed prior state-of-the-art remaining useful life methods on the Drive Stats benchmark. 

Their proposed architecture—the Temporal-Fusion Bi-Encoder Self-attention Transformer—is an encoder-decoder model trained on the full 10-year Drive Stats corpus (from 2013 to the time of article). Rather than classifying drives as failed or healthy within a fixed horizon, TFBEST predicts a sequence of days-to-failure, giving operators a window, rather than a binary alarm. The paper also introduces a confidence-margin statistic that manufacturers can use to set replacement thresholds with quantified uncertainty.

Large-Scale End-of-Life Prediction of Hard Disks in Distributed Datacenters

Authors: Rohan Mohapatra, Austin Coursey, Saptarshi Sengupta

Venue: IEEE  

Submitted: August 2023

The authors presented a long short-term memory (LSTM) model that used understanding gleaned from Drive Stats to aid in predicting an output sequence of the number of days remaining before the possible failure of a disk. The LSTM posted a root mean square error of 0.83 during training, and 0.86 during testing across the full 10-year corpus, and generalized competitively across multiple Seagate model families. 

The core architecture was an encoder-decoder LSTM network: the encoder processed a window of historical SMART readings for a given drive; the decoder produced a multistep output sequence representing the predicted days-to-failure. The model was trained and validated on all Drive Stats data available at the time, roughly 35GB, covering Seagate drive models with significant failure populations.

Leveraging Survival Analysis in Cost-Aware Deepnet for Efficient Hard Drive Failure Prediction

Authors: Jishan Ahmed, Robert C. Green II 

Venue: Neural Computing and Applications, Vol. 37 

Published: October 2024

To address the significant imbalance of real-world datasets used for drive-failure detection—the relatively small number of failures when compared to the number of drives operating normally—the authors relied on the SMART attributes found in Drive Stats to uncover new insights into drive health and failure. 

They used a dual-track approach: a deep-learning track for failure prediction and a survival-analysis track for identifying which attributes most strongly govern time-to-failure. Together, the two tracks provided both operational predictions and mechanistic insights useful for data-center management strategy.

Examining the Impact of Critical Attributes on Hard Drive Failure Times: Multi-State Models for Left-Truncated and Right-Censored Semi-Competing Risks Data

Authors: Jordan L. Oakley, Matthew Forshaw, Pete Philipson, Kevin J. Wilson

Venue: Applied Stochastic Models in Business and Industry, Vol. 40, Issue 3

Published: December 2023

Many hard-drive failure prediction papers ask a binary question: Will this drive fail in the next N days? This paper asked a more nuanced statistical question: How do intermediate critical states defined by deteriorating SMART attributes affect the time distribution of eventual failure?

Oakley and colleagues first defined critical attributes and critical states using Drive Stats SMART readings, and then fit multistate survival models to the resulting semicompeting risks structure. These risks arise because a drive can move from healthy to critical (nonterminal) before failing (terminal), but failure can also occur without a detectable prior critical state. The multistate framework handled both pathways in a single coherent model.

The key contribution was a set of dynamic predictions of conditional survival probability that updated as the observed state of a drive changed – so operators got a live risk estimate, not a static score. Experiments on Drive Stats data confirmed that drives entering critical states are substantially more likely to fail.

AI/ML Models and Projects Built on Drive Stats

Academic papers are one signal that a dataset has earned its place in a field. Practitioners building things with it are another. A growing body of work, including open-source projects on platforms like GitHub, helps translate academic research into practical, runnable code, and provides additional confirmation of Drive Stats as a standard benchmark for the field.

HDD Failure Prediction Using Machine Learning

Contributor: Marcos Garcia Estevez (warc0s)

Platform: GitHub

Contributions Made: October 2024

The project aimed to create a binary classification model using machine-learning algorithms to predict the probability of drive failures based on SMART data, along with other features such as brand and storage capacity. It applied three methods: random forest, XGBoost, and a combined ensemble to Drive Stats SMART attribute data.

Large-Scale End-of-Life Prediction of Hard Disks in Distributed Datacenters

Contributor: Rohan Mohapatra (rohanmohapatra) (Austin Coursey, Saptarshi Sengupta)

Platform: GitHub 

Contributions Made: June 2024

For practitioners building their own Drive Stats pipelines, this is one of the few public examples that addresses the full stack data ingestion, feature engineering, class imbalance, and sequence modeling, rather than demonstrating a model on a precleaned subset. Its combination of XGBoost for feature selection and LSTM for sequence prediction serves as a practical template for anyone working with raw quarterly CSV files.

Beyond the model architecture described in the academic paper section above, this project is notable for its engineering approach to handling Drive Stats at scale. The team built a preprocessing pipeline using PostgreSQL to ingest, filter, and join the quarterly files; used XGBoost across the full SMART attribute set; and applied interpolation to fill gaps, before feeding sequences to the encoder-decoder LSTM.

Are There Manufacturer Differences in Hard-Drive Reliability?

Contributor: Christoph Siemroth, Yeomyung Park

Venue: IEEE Transactions on Cloud Computing 

Researchers used Backblaze’s large data-center dataset to compare failure rates across four manufacturers (HGST, Seagate, Toshiba, and Western Digital). Duration regression models controlled for drive age, capacity, and form-factor, and the findings concluded that HGST drives fail least often (about 42% of Seagate’s failure rate. However, WD drives outperformed Seagate but fared worse than HGST. Toshiba’s failure rate is similar to Seagate’s. 

The study revealed a significant reliability gap between HGST and Seagate, doubling the financial burden for large-scale operators related to replacement-related labor and other costs. Drive failure analytics highlighted in the study can be used by large-scale operators to forecast future costs, informing procurement decisions.

Drive Stats research at a glance

Paper / Project Authors Venue / Platform What It Predicted / Built
TFBEST: Dual-Aspect Transformer With Learnable Positional Encoding for Failure Prediction Mohapatra, Sengupta arXiv (2309.02641) A novel, high-performing transformer architecture for predicting hard-drive failures
Large-Scale End-of-Life Prediction of Hard Disks in Distributed Datacenters Mohapatra, Coursey, Sengupta IEEE An LSTM helps to predict the number of days to a given disk’s failure to a high accuracy level
Leveraging Survival Analysis in Cost-Aware Deepnet for Efficient Hard Drive Failure Prediction Ahmed, Green II Neural Computing and Applications, Vol. 37 Operational predictions and mechanistic insights for data-center management strategy
Examining the Impact of Critical Attributes on Hard Drive Failure Times Oakley, Forshaw, Philipson, Wilson Applied Stochastic Models in Business and Industry, Vol. 40, Issue 3 Confirmation that drives entering critical states defined by deteriorating SMART attributes are substantially more likely to fail
HDD Failure Prediction Using Machine Learning warc0s GitHub A binary classification model using machine-learning algorithms to predict the probability of drive failures
Large-Scale End-of-Life Prediction of Hard Disks in Distributed Datacenters rohanmohapatra GitHub A practical template for practitioners working with raw quarterly CSV files to build their own prediction pipelines
Are There Manufacturer Differences in Hard-Drive Reliability? Siemroth, Christoph Park, Yeomyung IEEE A comparison of hard-drive reliability across four manufacturers, using data regression models.

The case for open data

The breadth of research is a direct result of open datasets. These citations occur because the data was consistently available every quarter for more than a decade—and it helps that we built a community of similarly interested people, too.

For research communities, open datasets function the way open-source libraries do: they create a shared foundation that everyone can build on and compare against. Drive Stats has earned that role in hard drive failure prediction by showing up reliably for over 13 years. A few things make open data particularly useful:

  • Ecosystem reach. Drive Stats doesn’t exist in isolation: We publish it on Hugging Face, where it sits alongside hundreds of thousands of open datasets, across domains from natural language processing to genomics. Kaggle hosts it alongside tens of thousands of community notebooks and kernels. 
  • Reproducibility. Drive Stats is public, permanently archived, and available for download. A paper published today cannot recreate historical data. There’s not really a corollary in a field where most real-world fleet data is proprietary and inaccessible—but we’d love people to join us. 
  • Research velocity. When data is freely available, there’s no need to spend months negotiating access agreements. You simply download Drive Stats, read the schema documentation, and start building. The papers mentioned in this article collectively span transformer architectures, survival models, deep neural networks, and gradient boosting, all on the same dataset. You can’t necessarily call it a direct comparison, but it does make one thing clear: hardware is central to the cloud conversation.

Sign up for the Drive Stats newsletter

The same data that powers academic research also powers our own reliability reporting: The annualized failure rates, SMART attribute analysis, and transparency have made Drive Stats a standard in the field for more than a decade. And that data keeps coming, with a new release every quarter, since 2013. 

If you’re working on failure prediction, predictive maintenance, or just want a real-world labeled dataset for benchmarking, this is the one researchers keep reaching for.

Sign Up for the Drive Stats Newsletter


What is Backblaze Drive Stats?

Backblaze Drive Stats is a publicly available dataset of daily hard drive health snapshots from our data centers. Published quarterly since 2013, it includes Self-Monitoring, Analysis, and Reporting Technology (SMART) attribute readings; failure labels; and model information for hundreds of thousands of drives. The data is free to download from the Backblaze Drive Stats page.


Has Drive Stats been used in academic research?

Yes. More than 227 papers and articles have cited Drive Stats as a source since 2018. Researchers have used it to develop and test hard drive failure prediction models, survival analysis frameworks, and deep learning architectures across venues including IEEE, Springer, Wiley, and arXiv.


Which AI/ML models were trained on the Backblaze dataset?

Researchers have trained a wide range of models on Drive Stats data, including long short-term memory networks, transformer architectures, 1D convolutional neural networks, gradient-boosted trees, survival analysis models, and ensemble methods. 


Is the Backblaze Drive Stats dataset on Hugging Face?

We publish Drive Stats on Hugging Face at huggingface.co/datasets/backblaze/Drive_Stats. The repository contains over 388 million records and grows by more than 240,000 records per day. It is append-only, meaning daily snapshots are never updated or deleted once written, making it particularly useful for reproducible research.


Why do researchers use open hard drive datasets?

Open datasets like Drive Stats allow researchers to benchmark models against consistent real-world data, reproduce published results, and build on prior work without access to proprietary fleet data. Because Drive Stats reflects a heterogeneous, production-scale environment rather than a lab setting, it provides a uniquely credible benchmark for evaluating failure prediction methods.


How many times has Drive Stats been cited in research?

More than 227 papers and articles have cited Drive Stats since 2018. The actual number continues to grow as researchers publish new work on hard drive reliability, predictive maintenance, and artificial intelligence/machine learning (AI/ML) model benchmarking.

The post Backblaze Drive Stats: How an Open Dataset Powers Academic and AI/ML Research appeared first on Backblaze Blog | Cloud Storage & Cloud Backup
Backblaze Drive Stats for Q1 2026

Post Syndicated from Stephanie Doyle original https://www.backblaze.com/blog/backblaze-drive-stats-for-q1-2026/

A decorative image with the title Q1 2026 Drive Stats.

Long time readers: I must start with a mea culpa that this article was not released on our traditional May the Fourth (or thereabouts) report date. Please know I missed making the many and sundry Star Wars puns as much as (I’m sure) you missed hearing them—so, I’ll probably slip a few in, just because. 

That said, there was good reason for the delay. We were diligently investigating a disturbance in the force. (See? We’re back!) We’ll get into the details after we dig into the numbers, but here’s the teaser: this quarter, we observed something unusual in the data that wasn’t entirely a failure trend. It did, however, prompt us to revisit and validate the assumptions behind our Drive Stats analysis before publishing. 

Sign up for the Drive Stats webinar

Ready to dive deeper into the data? Tune in Wednesday, July 15, 2026 at 12:00 noon PT, as Sr. Market Intelligence Manager, Stephanie Doyle, and Sr. Product Marketing Manager, Laquie Campbell review the trends.

Q1 2026 Hard drive failure rates

As of the end of Q1 2026, Backblaze was monitoring 345,662 drives used to store data. For our evaluation, we removed from consideration 3,907 boot drives and 492 hard drives, as they did not meet the criteria to be included. We’ll discuss the criteria we used in the next section of this report. Removing these drives leaves us with 341,263 hard drives to analyze. The table below shows the annualized failure rates for Q1 2026 for this collection of drives.

Backblaze Hard Drive Failure Rates for Q1 2026

Reporting period January 1, 2026–March 31, 2026 inclusive
Drive models with drive count > 100 and drive days > 10,000 as of March 31, 2026 in Q1 2026.

MFG Model Size (TB) Drive Count Avg. Age (Months) Drive Days Drive Failures AFR (%)
HGST HUH728080ALE600 8 1,026 87.8 3,252,052 125 1.4
HGST HUH721212ALE600 12 2,608 74.5 6,115,413 104 0.62
HGST HUH721212ALE604 12 13,277 55 24,018,962 1,114 1.69
HGST HUH721212ALN604 12 9,780 77.4 26,914,795 1,678 2.28
Seagate ST8000DM002 8 8,910 105.5 33,115,836 1,380 1.52
Seagate ST8000NM0055 8 13,232 94.6 45,131,414 2,404 1.94
Seagate ST10000NM0086 10 981 89.9 3,566,716 306 3.13
Seagate ST12000NM0007 12 983 31.6 37,325,724 2,297 2.25
Seagate ST12000NM0008 12 18,650 67.2 43,012,820 2,466 2.09
Seagate ST12000NM000J 12 1,087 18.6 632,857 22 1.27
Seagate ST12000NM001G 12 13,216 59.5 25,106,715 679 0.99
Seagate ST14000NM001G 14 10,519 58.4 20,025,909 756 1.38
Seagate ST14000NM0138 14 1,251 53.8 2,767,654 438 5.78
Seagate ST16000NM001G 16 34,729 40.7 44,065,062 820 0.68
Seagate ST24000NM002H 24 9,605 9.3 2,779,100 220 2.89
Toshiba MG07ACA14TA 14 37,263 62.6 75,018,084 2,114 1.03
Toshiba MG07ACA14TEY 14 996 38.4 1,235,801 58 1.71
Toshiba MG08ACA16TA 16 40,036 30.4 37,906,446 1,113 1.07
Toshiba MG08ACA16TE 16 6,264 47.6 9,544,691 325 1.24
Toshiba MG08ACA16TEY 16 4,885 49.4 8,035,780 519 2.36
Toshiba MG09ACA16TE 16 506 6.5 101,383 4 1.44
Toshiba MG10ACA20TE 20 20,451 11.5 7,206,903 137 0.69
Toshiba MG11ACA24TE 24 7,203 4 869,474 10 0.42
WDC WUH721414ALE6L4 14 8,640 60.6 16,344,031 231 0.52
WDC WUH721816ALE6L0 16 2,994 50 4,665,417 133 1.04
WDC WUH721816ALE6L4 16 26,801 34.4 28,463,214 394 0.51
WDC WUH722222ALE6L4 22 45,638 16.1 22,472,050 360 0.58
WDC WUH722626ALE6L4 26 3,604 2.5 274,161 5 0.67
Totals 529,968,464 20,212 1.39

Note and observations

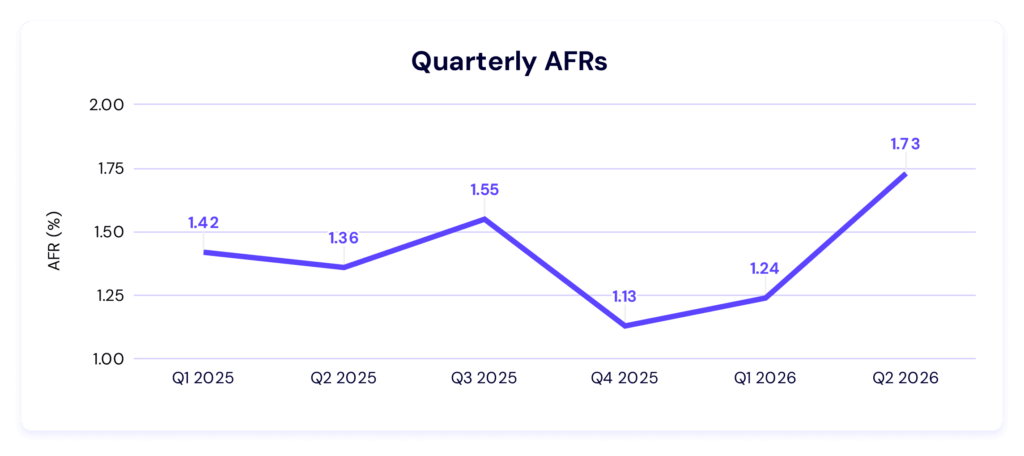
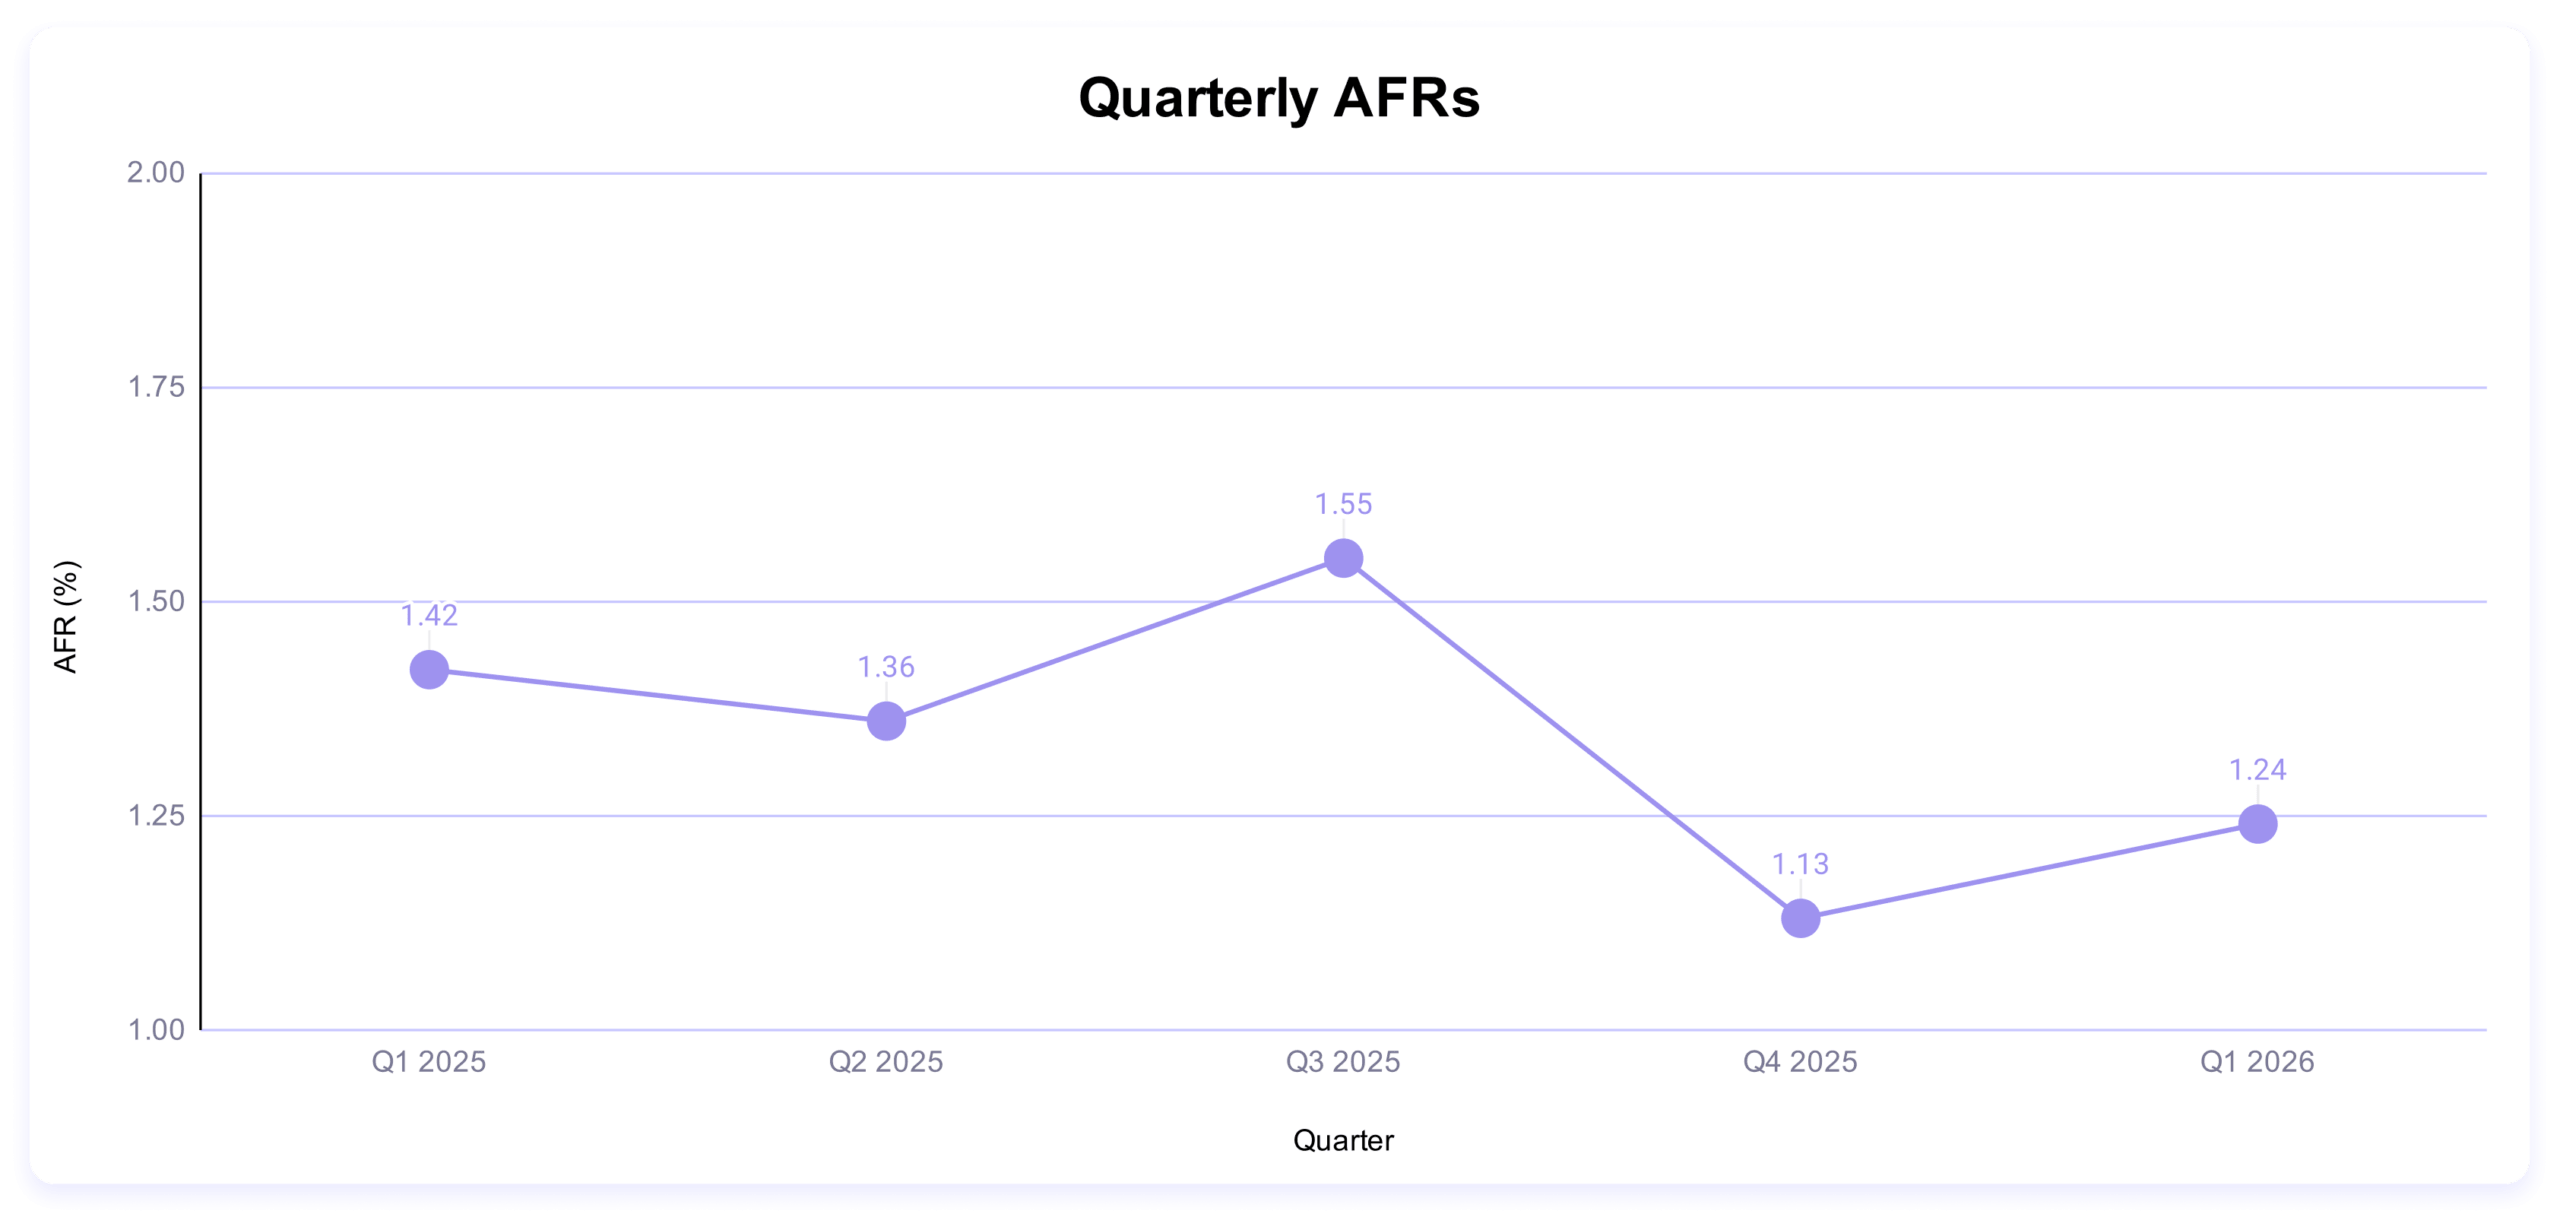
  • The quarterly AFR is 1.24%. This is up from last quarter, but down from the previous year.
A chart showing the quarterly AFRs from Q1 2025 to Q1 2026.
  • No new drive models this quarter. That’s not unheard of, but it’s pretty rare. In the last eight quarters, we’ve had new drives six times. 
  • The investment in higher capacity drives continues. We deployed 10,220 drives last quarter, and 9,404 of those drives had a capacity of more than 20TB. While these drives are still fairly young, their AFR is an impressive 0.85% as a pool. 
  • Impressive, most impressive. These drives had zero failures:
    • HGST HMS5C4040BLE640 (4TB) 
    • HGST HUH728080ALE600 (8TB) 
    • Seagate ST16000NM002J (16TB) 
  • And these drives had one: 
    • Seagate ST8000NM000A (8TB) 
    • Seagate ST12000NM000J (12TB)
    • Seagate ST14000NM000J (14TB) 
    • Seagate ST16000NM000J (16TB) 
    • Toshiba MG09ACA16TE (16TB) 

That list proves a point we’ve made in a few different quarters: net failure does not necessarily mean a low AFR. On this list, the Seagate ST16000NM000J (16TB) came in with a 3.61% AFR—when there are only 129 drives left in the fleet, even one failure spikes the AFR.

These aren’t the drives you’re looking for

As mentioned, we remove drives that don’t meet our criteria. We’ve covered the reasons that we’ve designed these exclusions in past reports, but here’s the quick and dirty: 

Period Drive Count Drive Days
Quarterly > 100 > 10,000
Annual > 250 > 50,000
Lifetime > 500 >100,000

Regardless of whether or not a given drive model is included in this article’s charts and tables, all of the line item data is included in our Drive Stats dataset which you can download by visiting our Drive Stats page.

Use the Source, Luke

Lifetime hard drive failure rates

Now let’s look at the lifetime failure rates. A reminder that

Backblaze Lifetime Hard Drive Failure Rates

Reporting period January 1, 2026–March 31, 2026 inclusive
Drive models with drive count > 100 and drive days > 10,000 as of March 31, 2026 in Q1 2026.

MFG Model Size (TB) Drive Count Avg. Age (Months) Drive Days Drive Failures AFR (%)
HGST HMS5C4040BLE640 4 186 106.1 15,858 0 0
HGST HUH728080ALE600 8 1,026 93 86,921 0 0
HGST HUH721212ALE600 12 2,608 75.4 234,350 8 1.25
HGST HUH721212ALE604 12 13,277 56.5 1,183,774 86 2.65
HGST HUH721212ALN604 12 9,780 80.9 870,252 95 3.98
Seagate ST8000DM002 8 8,910 112.3 639,473 25 1.43
Seagate ST8000NM000A 8 247 37.9 21,552 1 1.69
Seagate ST8000NM0055 8 13,232 101.5 1,176,619 39 1.21
Seagate ST10000NM0086 10 981 98.3 86,667 11 4.63
Seagate ST12000NM0007 12 983 75.8 87,389 11 4.59
Seagate ST12000NM0008 12 18,650 70.7 1,664,558 129 2.83
Seagate ST12000NM000J 12 1,087 19 96,887 1 0.38
Seagate ST12000NM001G 12 13,216 60.7 1,185,545 33 1.02
Seagate ST14000NM000J 14 433 16.2 37,258 1 0.98
Seagate ST14000NM001G 14 10,519 60.3 944,400 21 0.81
Seagate ST14000NM0138 14 1,251 62.6 111,709 15 4.9
Seagate ST16000NM000J 16 129 17 10,117 1 3.61
Seagate ST16000NM001G 16 34,729 41.2 3,098,105 44 0.52
Seagate ST16000NM002J 16 466 38.8 41,931 0 0
Seagate ST24000NM002H 24 9,605 9.3 820,090 74 3.29
Toshiba MG07ACA14TA 14 37,263 64.1 3,343,724 94 1.03
Toshiba MG07ACA14TEY 14 996 39.8 88,602 5 2.06
Toshiba MG08ACA16TA 16 40,036 30.7 3,548,250 102 1.05
Toshiba MG08ACA16TE 16 6,264 48.9 553,878 21 1.38
Toshiba MG08ACA16TEY 16 4,885 50.5 435,063 26 2.18
Toshiba MG09ACA16TE 16 506 6.6 36,988 1 0.99
Toshiba MG10ACA20TE 20 20,451 11.6 1,665,263 42 0.92
Toshiba MG11ACA24TE 24 7,203 4 495,387 3 0.22
WDC WUH721414ALE6L4 14 8,640 61.3 776,557 7 0.33
WDC WUH721816ALE6L0 16 2,994 50.4 267,868 24 3.27
WDC WUH721816ALE6L4 16 26,801 34.6 2,402,732 64 0.97
WDC WUH722222ALE6L4 22 45,638 16.1 3,992,942 42 0.38
WDC WUH722626ALE6L4 26 3,604 2.5 182,471 4 0.8
Totals 30,203,180 1030 1.24

Notes and observations

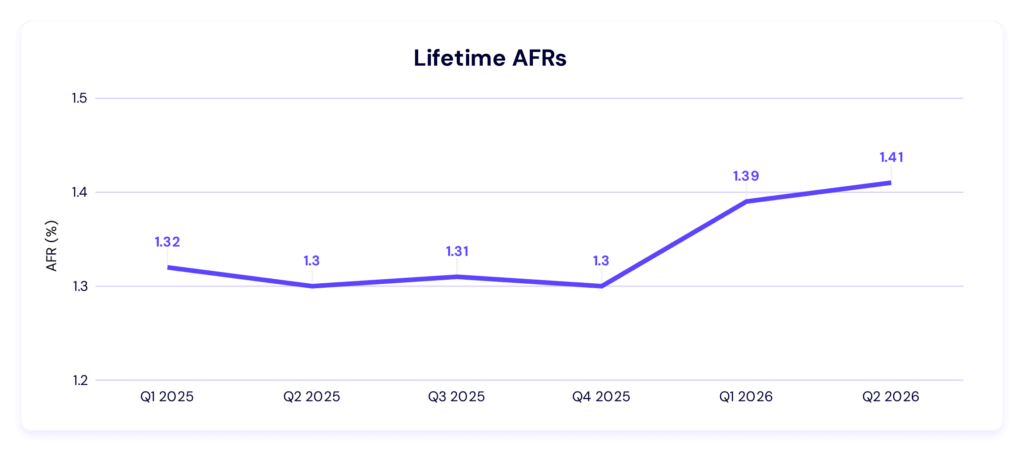
  • Stay on target. The lifetime failure rate is 1.39%.
  • Hello there! Three drives make their appearance on the lifetime table, including our 26TB drive (which was just under on drive days last time around):
    • Toshiba MG09ACA16TE (16TB)
    • WDC WUH722222ALE6L4 (22TB)
    • WDC WUH722626ALE6L4 (26TB)
  • You served me well. The last of our 4TB drives have finally dropped below the exclusion criteria for the lifetime table. The HGST HMS5C4040ALE640 is completely gone, while the HGST HMS5C4040BLE640 (4TB) has just 186 drives left in the pool.

Do or do not: When failure isn’t the only metric in play

As I teased in the introduction, this quarter, some unexpected behavior brought forth one of the most interesting edge cases we’ve seen in a while, and it spotlights some relevant truths about the Drive Stats project. More interestingly, it showed up with only slightly higher failure rates, partially because of some mitigation steps we were able to take. Stay with me—there are multiple, overlapping issues at play. 

We’ve said often that individual drives within a manufacturer pool, and even within a single drive model, can vary quite a bit. On these particular drives, that was the case: there were two different mechanical issues, one which affected writes and one which affected drives when they power cycled. The fact that it was two different types of issues made the initial investigation more difficult, and depending on the age of the drive, either, both, or neither issue could have affected the drive model.  

Additionally, in both of those types of errors, it didn’t affect every drive in the pool, and for a long period of time, the failure rate was actually acceptable. Once we saw more of the failures happening, we correlated with the power issue, and we could help mitigate by reducing the frequency of the power cycling systems for Vaults that contained these drives. What that looked like in practice is that we put the Vaults with suspected issues into no-upload mode and kept them in reserve. Once the investigation was complete, we were able to understand the full picture.  

The point I want to highlight here is one that I’ve made quite often: our drive failure rates, and what we report on in general, is the function of people actively managing failure and risk. You can see that clearly here—mitigating one of the two root causes reduced overall risk for this drive model; and, while we were doing that, we had an alternative option that let us use the drives, albeit in a different way. 

Meanwhile, it also reflects the point we’ve been making from the beginning of time, from way back when we said “why not use consumer hardware to create a storage cloud?” Some level of risk is always acceptable. A system that pushes for absolutely zero failures on the hardware level is imprudent, given that our software layer largely prevents data loss. 

Always two there are

And yet, this investigation was particularly impactful because we saw a decent number of drives (not all of them—again, multiple causes to this incident) that were day one failures. Because that’s true, there’s another important piece of the puzzle to consider, one that speaks to the ways we define a failure and the ways the Drive Stats program is written

The short version is that at the end of each day, a C++ program collects the various SMART stats. If a drive was there the day before and is not there the day of, then it’s logged as a failure. There are other pieces of the puzzle as well, including a lookback period. So if the disappeared drive serial number shows back up on day two (or three or four), it retroactively tells us that it wasn’t a failure. We cut that off at the end of the quarter, which means there’s a handful of drives that might be false positives on that kind of failure, but the probability is quite low (and you have to cut things off somewhere). 

But the more important part of things is this: Drive Stats is a function of conditional logic. Because it defines a failure based on a drive’s presence in the pool the day before, that means we can’t define day one failures using only the Drive Stats program. 

What does that mean for us going forward? Have we been completely under-reporting day one failures? Short answer: yes, probably. But, back to that whole “managed environment” caveat—once drives enter data centers, they’ve already gone through a period of drive qualification. So, it’s relatively rare we have day one failures to begin with. 

But, that does mean that we should caveat things appropriately, particularly if you’re one of the folks who likes to use the full dataset for your projects. The logline data compiles SMART stats, but only for drives that have the chutzpah to make it to the end of day one. 

Remember the Drive Stats will be with you, always

Thank you, as always, for following Drive Stats. We had some folks reach out to make sure the report was going live, particularly because we lost an important member of the team recently, the inimitable Pat Patterson. We appreciate all the well wishes, and the patience. 

Here’s our standard fine print: 

The complete dataset used to create the tables and charts in this report is available on our Hard Drive Test Data page. You can download and use this data for free for your own purpose. All we ask are three things: 

  1. You cite Backblaze as the source if you use the data; 
  2. You accept that you are solely responsible for how you use the data, and; 
  3. You do not sell this data itself to anyone; it is free.

If you’re a new Drive Stats fan, consider signing up for the newsletter. If you’re not ready for that kind of commitment, sound off in the comments section below or reach out directly to us to let us know what you’re working on. May the Stats be with you! 

The post Backblaze Drive Stats for Q1 2026 appeared first on Backblaze Blog | Cloud Storage & Cloud Backup
What Network Data Can and Can’t Tell Us About AI Infrastructure

Post Syndicated from Stephanie Doyle original https://www.backblaze.com/blog/what-network-data-can-and-cant-tell-us-about-ai-infrastructure/

Abstract dotted pattern over a blue-to-orange gradient representing network telemetry and data movement across AI infrastructure.

AI infrastructure is difficult to observe directly. That’s because AI systems are highly distributed. They span storage platforms, GPU clusters, training pipelines, and multiple cloud providers—and those looking to optimize their stacks have to build out a visibility layer that takes all of those things into account. Data is constantly moving between different tools and infrastructure layers, and it’s imperative to understand how and why.

Learn how to structure your data for AI

Your organization is ready to prioritize AI-first projects. But is your data ready? Whether you’re developing AI-powered products to bring in new revenue or building internal AI tools to increase productivity, your AI initiatives start with the data you already have and how it’s stored.

Read the guide, “Navigating Multimodal Dataset Economics,” to understand how to optimize AI infrastructure.

Get the Guide

One critically important aspect: understanding the network layer. Network telemetry makes it possible to observe how data actually moves between environments: which endpoints exchange data, how long those connections persist, and how much information flows between them over time.

Since re-launching the Network Stats series in November 2025, we have had direct visibility into what that movement looks like in practice. Backblaze has always been an advocate for the benefits of a multi-cloud design, and our position as a pure storage provider offers a unique perspective on the movement of storage to the neoclouds where AI processing, inference, and model training take place. Our network telemetry captures data flows across those connections in real time. 

The Q1 2026 Network Stats report covers a full quarter of observed network traffic across those connections. This makes it possible to see patterns in how AI workloads move data between storage and compute environments.

However, while these patterns are real and worth studying, they need to be interpreted carefully. A single quarter of data may highlight emerging behaviors, but those behaviors may not reflect how AI infrastructure will ultimately be designed. 

And, as we often say—the dataset is young, and network landscape is going through a fundamental change. It will be exciting to see what happens over time, but we, as a community, should be discerning. 

What network telemetry actually reveals

Network-level metrics expose behaviors that application or storage metrics often don’t reveal. Application logs can show what a system is trying to do, and storage metrics can show how much capacity is being used. But, it’s the network layer that reveals how data actually moves between systems.

Several network patterns help make that movement visible:

  • Traffic volume shows how much data is flowing through the system.
  • Connection persistence indicates whether that data moves through many short-lived exchanges or a smaller number of sustained transfers.
  • Endpoint concentration and magnitude (that is: how much data is transferred per IP address) show how many systems are involved in those exchanges and how much data each endpoint moves.

When we examine the network data, it begins to reveal how modern workloads operate.

One of the clearest examples appears in the Q4 2025 Network Stats data. In that quarter, neocloud traffic was concentrated around a relatively small number of endpoints, and those connections carry sustained, high-magnitude data transfers over time. Compared with traditional internet traffic patterns, fewer connections are responsible for moving a much larger share of the data. We call those elephant flows. 

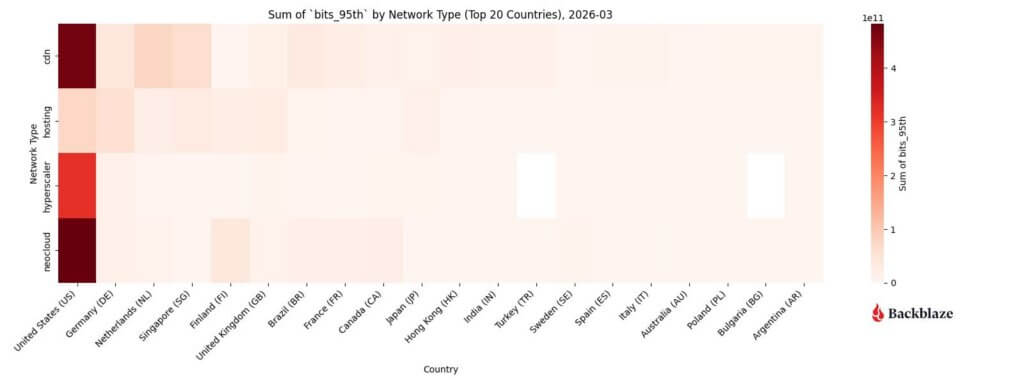
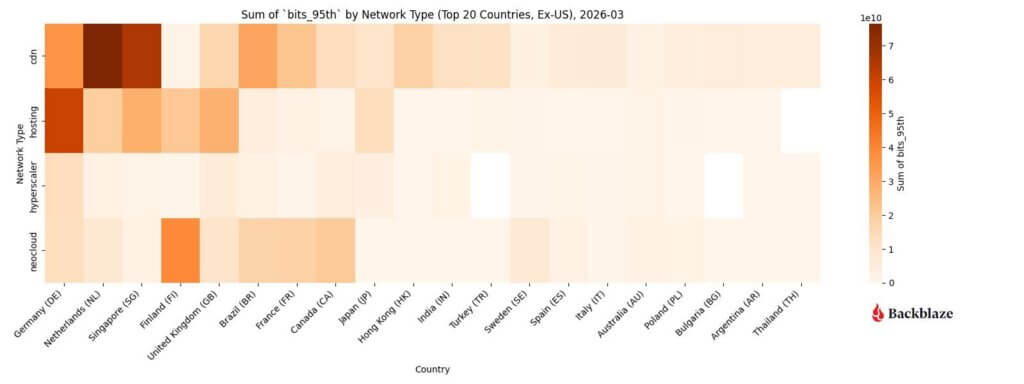
In Q1 2026, we dug into the ways that the data also show a geographic pattern. Neocloud traffic clusters in specific regions with dense compute and interconnect infrastructure, rather than being evenly distributed across the network.

These signals in the network data are meaningful. They reveal important characteristics of how AI workloads behave across infrastructure. But, they do not by themselves explain what those patterns imply for infrastructure design.

What a single quarter of network data cannot tell us

A single quarter of telemetry can reveal emerging patterns, but it cannot distinguish durable infrastructure trends from short-term experimentation.

AI infrastructure is still evolving quickly. New training frameworks are emerging, GPU availability continues to shift, and companies are experimenting with different compute providers and network connections. Because of this, infrastructure decisions today are still temporary. Teams are building pipelines with the resources they can access now, and many are finding that multi-cloud architectures allow them the ability to optimize their tech stack—traditionally only considered cost play, this is far more important from a performance perspective

That means some of the patterns visible in current network data aren’t constraints for anyone attempting to deal with a changing landscape. For example, these are some of the patterns we can’t attribute causality to in a vacuum: 

  • Regional clustering may simply result from where GPU capacity happens to be available today. 
  • Changes in traffic mix may depend on how early training pipelines are assembled across providers. 
  • Differences in connection patterns may be influenced by how mature different platforms’ network interconnects are.

As these conditions change, the same workloads may produce different network signatures. And, more importantly, a flexible, interoperable tech stack means that enterprises can be responsive. 

This also is why network telemetry becomes much more informative when observed quarter by quarter and over time. Multiple quarters of data make it easier to distinguish temporary conditions from infrastructure patterns that persist. 

But even before those longer-term patterns emerge, network telemetry still provides valuable insight into how AI infrastructure behaves under current conditions.

How to interpret network telemetry data

The patterns visible in network telemetry become more useful when we consider what they imply for infrastructure planning. Rather than describing the traffic itself, they help engineers understand the operational demands AI workloads place on real systems.

Sustained high-volume transfers point to the level of throughput infrastructure must support. If large datasets move repeatedly across the network, drive IOPS, API servers, load balancers, network switch pairs, and other interconnect layers must be capable of sustaining those flows without becoming bottlenecks.

Traffic concentrated among a relatively small number of systems suggests that storage and compute environments may become tightly coupled in real deployments. AI pipelines often depend on repeated exchanges between specific components rather than distributing activity evenly across many endpoints. For example, it may make sense to co-locate storage on flash hardware when you’re immediately feeding GPUs; however, your warm or cold data may be better served in different environments. 

Regional clustering highlights where compute capacity and high-bandwidth interconnect infrastructure are currently concentrated. For operators, that can indicate where AI workloads are most likely to run and where supporting infrastructure must perform reliably at scale.

For engineers and infrastructure planners, data like this helps answer practical questions such as:

  • Where sustained high-throughput networking will be required
  • How tightly storage and compute systems may become coupled
  • Which regions currently concentrate the infrastructure supporting AI workloads

Taken together, this information provides a useful view into the operational demands AI workloads place on infrastructure today. They do not, however, define how AI infrastructure will ultimately be designed.

Infrastructure decisions shouldn’t be locked to early signals

The real problem is that, in traditional environments, infrastructure decisions tend to stick. When a team chooses where data lives, how pipelines move it, and which providers are connected, those choices quickly become part of the system.

Over time, early infrastructure decisions can quietly lock an organization into a specific architecture, even if better options appear later.

Once large datasets are stored in a particular environment, changing course becomes slow and expensive. Moving the data can take days or weeks. Pipelines may need to be rewritten. Teams may have to rebuild integrations between storage and compute systems entirely.

This doesn’t mean early signals should be ignored. Network telemetry still shows how workloads behave today, and can indicate what happens tomorrow. That visibility helps teams understand the operational demands AI workloads place on infrastructure.

These observations should be treated as a snapshot of a system that is still evolving. Infrastructure that allows data to move easily between platforms and compute environments gives teams the freedom to adapt as tools, providers, and architectures change. In fast-moving AI ecosystems, flexibility can matter just as much as raw performance.

Using network telemetry responsibly means learning from the pressures visible today while recognizing that the systems producing these patterns are still taking shape.

The post What Network Data Can and Can’t Tell Us About AI Infrastructure appeared first on Backblaze Blog | Cloud Storage & Cloud Backup
Backblaze Now Serving 314 Trillion Digits of Pi

Post Syndicated from Stephanie Doyle original https://www.backblaze.com/blog/backblaze-now-serving-314-trillion-digits-of-pi/

A decorative image showing the symbol for pi repeated on a background.

Lots of us were taught that pi equals 3.14. Maybe 3.14159 if your teacher was ambitious. Akira Haraguchi, who holds the Guiness Book of World Records title for reciting the most digits of pi in a single run, got up to 100,000 digits in 16 hours. 

That’s still only a fraction of the record digits of pi that are calculated—3.18471338 × 10⁻⁸% to be exact. So why do we need that much pi? 

A pi record isn’t a burst workload. It’s a system that runs at sustained pressure for months, writing checkpoints, flushing buffers, and proving that nothing quietly breaks. Last December, StorageReview set a new record, calculating 314 trillion digits on a Dell PowerEdge R7725. 

In honor of Pi Day, Backblaze B2 Cloud Storage has teamed up with StorageReview to host that dataset, which totals over 130TB. The pi dataset is generally available, publicly accessible, and structured for large-scale retrieval and analysis. 

Get the Dataset

Why pi remains a compute benchmark

Pi has long served as a proving ground for computational systems because it offers a deterministic workload with clear correctness criteria and sustained compute and input/output (I/O) demands. Records in pi computation trace back decades and reflect both mathematical and computational advances. In 1949, ENIAC—the first programmable, electronic, general-purpose, digital computer—computed 2,037 digits of pi in about 70 hours, an early demonstration of electronic computing capability that was eventually published in the paper, “The ENIAC’S 1949 Determination of π.

Algorithms have evolved significantly since then. The Chudnovsky algorithm, developed in 1988, is one of the fastest converging methods for high-precision pi calculation and has been used in many modern record attempts because of its efficiency at large digit counts.

Pi calculations do not mirror typical enterprise workloads such as databases or machine learning training, but their determinism and large scale make them useful for evaluating sustained performance of CPU, memory, and storage subsystems under continuous load. It’s also used in various security functions including random number generation (because computers can’t be truly random), cryptographic algorithms, hash functions, digital signatures, and secure communications protocols like SSL/TLS. 

What the 314 trillion digit run represents

In December 2025, StorageReview reported a new record by calculating pi to 314 trillion digits on a single server that ran continuously for approximately 110 days before completion. The achievement emphasizes not only the scale of the computation but also the role of storage architecture, non-uniform memory-access (NUMA) tuning, and system stability in sustaining such a workload.

The raw output of the run, including checkpoints, extended beyond 2PB of data. The finalized dataset hosted in Backblaze B2 exceeds 130TB and is divided into 200GB objects suitable for staged retrieval.

Engineers, researchers, and pi enthusiasts can freely retrieve their own slice of pi (or the whole thing) for analysis, performance characterization, and tool validation. Structuring the dataset into manageable objects enables selective download for analysis, parallelized workflow testing, and evaluation of sustained object retrieval performance.

How to access the dataset

The 314 trillion-digit dataset is available today via Backblaze B2 Cloud Storage.

To request access:

  1. Visit the pi landing page.
  2. Submit the required information to receive credentials.
  3. Use the provided instructions to download via rclone, an open-source cloud storage management tool.

The object layout supports both partial and full dataset retrieval strategies.

Enjoy your pi!

With all the ways you can use the pi dataset, we can’t wait to hear what you all are working on. Feel free to let us know what you’re working on in the comments section below, on socials, or by email

Happy experimenting!

The post Backblaze Now Serving 314 Trillion Digits of Pi appeared first on Backblaze Blog | Cloud Storage & Cloud Backup

Introducing the Backblaze Flamethrower Startup Program

Post Syndicated from Stephanie Doyle original https://www.backblaze.com/blog/introducing-the-backblaze-flamethrower-startup-program/

A decorative image showing cogs and cubes with digital lines.

The Backblaze Flameflower Startup Program is here, and it’s built by people who’ve been burned before (and that’s a good thing for you). 

Startups don’t fail because they pick the wrong cloud storage provider.

They fail because everything else is already hard enough, and infrastructure quietly becomes the thing that slows them down, surprises them, or blows up their budget at exactly the wrong moment.

That’s why we’re launching Flamethrower, the new startup program from Backblaze.

It’s not a gimmick. It’s not a lead trap. And it definitely doesn’t bring the “here’s some credits, good luck” energy.

Flamethrower exists for one simple reason: Founders deserve storage infrastructure that helps them move faster, not learn expensive lessons the hard way.

Why Flamethrower exists

Why Flamethrower? 

Startups don’t need more friction, they need a way through it. Metaphor-wise, flames have always been a part of Backblaze’s DNA, and we want this program to speak to the strongest parts of that fire: speed when you need it, reliability when it counts, and power to scale without drama. 

Flamethrower takes these ideas and applies it directly to startups, burning away the biggest blockers between you and your next milestone.

I’ve spent most of my career in and around startups, as a founder, an operator, a partner, a mentor, and occasionally as the person explaining to a CFO why last month’s cloud bill looked like a typo.

I’ve seen the pattern repeat over and over:

  • Early teams optimize for speed (correct)
  • Infrastructure decisions get made quickly (also correct)
  • Those decisions quietly become very sticky
  • And later… someone realizes storage costs are now a board-level discussion

Flamethrower is designed to meet teams before that moment, making your architecture deliberate, not accidental.

Not with abstract promises, but with:

  • Real infrastructure used in real production environments
  • Credits that actually help you get to product-market fit
  • And access to real, live humans who understand what it’s like to build under pressure

This program was built by founders, for founders, including a lot of hard-earned lessons from what doesn’t work.

What makes Flamethrower different

There are plenty of startup programs out there. Many are well-intentioned. Some are very good at marketing. A few are genuinely useful.

Flamethrower is focused on a few things we think matter more than buzzwords:

Human interaction (Yes, really)

Your application is reviewed by real people. Your emails are read by real people.

And if you want to talk to someone, you’ll talk to someone who understands startups, architectures, and workflows, not a generic support queue.

Infrastructure that scales with you

Backblaze B2 is simple, predictable, and S3 compatible. Teams use it for:

In other words: the boring stuff that absolutely has to work.

A program that respects your time

No mandatory demos. No surprise sales motions. No pressure to “convert” before you’re ready.

If Flamethrower helps you build faster—great.

If it doesn’t—that’s okay too, we’ll handle the boring bits until your rocket ship takes off.

Why Backblaze

Backblaze has always had a bit of a different personality.

We believe:

  • Pricing should be understandable
  • Infrastructure should behave predictably
  • Documentation should be written by people who actually use the product
  • And success shouldn’t be punished with surprise bills

That mindset is exactly why Flamethrower fits here.

This isn’t a side project. It’s an extension of how Backblaze already works with developers and builders, just with a little more gas on the fire (if you will).

A bit about me

If we haven’t met yet: I’m James, and I lead Startups and Developer Relations at Backblaze.

I’ve spent years building and running startup programs, developer ecosystems, partnerships, and learning, sometimes painfully, what not to do. I’ve been on the receiving end of “exciting programs” that turned out to be mostly slide decks.

Flamethrower is my attempt (with a very smart team) to build the kind of program I wish existed when I was earlier in my career: practical, honest, and actually useful.

No heroics. No silver bullets. Just support where it counts.

What happens next

The Flamethrower Program is officially live!

If you’re:

  • A founder building something data-heavy
  • An early team thinking about long-term infrastructure
  • Or someone who just wants storage to be the least cumbersome (and most strategic) part of their stack

We’d love to hear from you.

  • Learn more and apply to Flamethrower
  • Or just explore Backblaze on your own terms.
  • Sign up for the Developer newsletter to stay up-to-date with news about the platform and other peoples’ cool projects. 

And if nothing else, thanks for building things. The world needs more people who do.

The post Introducing the Backblaze Flamethrower Startup Program appeared first on Backblaze Blog | Cloud Storage & Cloud Backup

The New Shape of Risk: How Generative AI Is Changing the Security Landscape

Post Syndicated from Stephanie Doyle original https://www.backblaze.com/blog/the-new-shape-of-risk-how-generative-ai-is-changing-the-security-landscape/

A decorative image showing several cubes split into different smaller shapes.

As generative AI has shifted from selective experimentation to broad operational use, large language models (LLMs) now sit inside developer environments, support workflows, internal knowledge systems, and security tooling itself. Adoption has widened for both enterprises and consumers alike, and, unsurprisingly, have a whole new set of security patterns.

Though oftentimes single catastrophic failures are the types of stories that make the news (like an AI agent pushing code to production against its explicit instructions), the truth is that there’s a bigger narrative here. Generative AI has introduced a whole new way to work, and we’re seeing a set of recurring behaviors—ways that AI systems interact with data, instructions, and people—that either introduce new risks or enhance some tried-and-true bad actor tactics (like more convincing phishing attacks, for example).

This article focuses on seven patterns that have emerged in real deployments and documented incidents. Let’s get into it. 

1. Prompt injection and instruction hijacking

Prompt injection has matured from a research concept into a practical exploit vector. The issue is structural: LLMs interpret text holistically using tokenization, which makes it difficult to maintain a strict separation between instructions and data. When untrusted content is introduced into an AI system with elevated permissions, that ambiguity becomes exploitable.

Recent incidents show how this plays out in production tools. Researchers analyzing Microsoft Copilot demonstrated that carefully crafted inputs could override intended behavior, expose system prompts, or trigger unintended actions within the model’s sandbox.

The common thread is authority. When models are allowed to act on retrieved content or invoke downstream tools, text becomes a control surface.

2. Prompt poaching and peripheral exfiltration

Not all AI-related data loss requires access to the model itself. A recent malware campaign demonstrated how attackers can siphon AI conversations by compromising the surrounding ecosystem.

Malicious Chrome extensions posing as productivity tools were found harvesting prompts, responses, and browsing context from users interacting with AI assistants; the data was quietly sent to external servers.

These attacks target trust boundaries adjacent to AI systems rather than the models directly. Browser extensions, plugins, and integrations become collection points for high-value contextual data that did not previously exist in a single place. And, they’re often less controlled by enterprise IT teams compared with other types of software. 

3. AI-powered malware and ransomware

AI-assisted malware is no longer hypothetical. Security researchers have now documented ransomware that uses generative models as part of its operational logic.

One example: PromptLock, a ransomware strain that leverages LLMs to dynamically generate portions of its code and behavior during execution.

At the ecosystem level, threat intelligence reports show ransomware groups using AI to accelerate development, customize payloads, and craft tailored extortion communications. Akamai’s 2025 ransomware trends report documents LLM usage by active groups for both technical and social components of attacks.

It’s less about how it’s done and more about how fast it’s done: Iteration cycles are shorter, and adaptation happens more quickly.

4. Acceleration and competitive pressure in the ransomware economy

Even when AI is not embedded directly into malware, it influences the broader threat environment. Ransomware activity increased throughout 2025 despite arrests and takedowns; new groups emerged quickly to replace disrupted ones.

As we said above, speed matters here. Defensive models that assume time for analysis, tuning, and response are increasingly stressed by attackers who can prototype and redeploy faster than those cycles allow.

And it’s not just speed—the volume of (credible, real) attacks matters too. The truth of the game has always been that bad actors only have to succeed once whereas defenders have to succeed every time. If better ransomware is being produced more quickly, defenders are having to adapt just as (or more) quickly to a higher volume of attacks (which makes the demand for employees in the security industry that much more understandable). 

5. Semantic noise and operational fatigue

Generative AI produces a large volume of plausible output: summaries, recommendations, alerts, explanations. In isolation, that capability is helpful; in aggregate, it introduces a new operational burden.

Security teams report growing difficulty distinguishing signal from well-formed noise. In reality, this means that over-taxed employees are getting pinged while on-call far more. 

AI-generated conclusions often require human validation, but their tone and confidence can reduce scrutiny over time. That creates opportunities for malicious activity to hide inside outputs that appear reasonable and routine; or, on the flip side, for things like process and architecture misconfigurations to masquerade as security events by creating too many requests. 

This pattern does not map cleanly to a single exploit; it shows up as delayed detection, slower response, and missed anomalies.

6. Code supply chain risk from generated code

AI-generated code compounds familiar supply-chain issues. Generated snippets often compile cleanly, pass tests, and follow common patterns; they also tend to replicate insecure defaults or omit contextual safeguards.

As these patterns are reused across services, small mistakes scale quickly. Not only that, but basic parameters like privileging recency (e.g., new security patches) vs. commonality (e.g., the most often used code) can have major implications and be weighted differently in different tools. While there is demonstrated risk of malicious insertion, it’s also the normalization of fragile or incomplete logic through automation.

7. Potential human skill erosion as a force multiplier

One of the quietest risks is also the hardest to measure. As AI tools handle more analysis, summarization, and decision support, human operators spend less time interrogating raw data. That’s both a good and a bad thing—really, it begs the question of how we go about creating and applying expertise in a new and developing epistemological framework. (Wait, you thought engineering wasn’t philosophical?)

Over time, that shifts how teams validate outcomes and how comfortable they are challenging AI-generated conclusions. This erosion does not cause incidents by itself, but it can amplify the impact of every other failure mode.

Where this leaves us

Across these examples, a consistent theme emerges. Generative AI changes how authority, context, and action flow through systems. Many of the resulting failures are subtle and blend into normal usage patterns.

The next phase of response is already taking shape. Government agencies and standards bodies are beginning to formalize guidance on securing AI systems, managing AI-related risk, and adapting existing security practices to these new patterns.

That guidance belongs in its own discussion. For now, the takeaway is simpler: AI adoption has altered the shape of risk. 

The post The New Shape of Risk: How Generative AI Is Changing the Security Landscape appeared first on Backblaze Blog | Cloud Storage & Cloud Backup

2025: That’s a Wrap and Here Are the Stats

Post Syndicated from Stephanie Doyle original https://www.backblaze.com/blog/2025-thats-a-wrap-and-here-are-the-stats/

A decorative image showing several server racks.

When most people think about year-end work, they think in terms of deadlines, retrospectives, and a well-earned break. Data centers have other ideas because, well, the internet still needs to work on holidays in order to power those digital fireplaces and Spotify playlists.

Backblaze runs year-round, around the clock, which means that even the holidays are business as usual in a data center. And many customers who use Backblaze to store their AI models, applications, media, and critical business data need that data storage to be more reliable than ever, especially around the holidays. Every drive swap, rack adjustment, alert investigation, and routine fix leaves a trace in our work tickets, and we’ve discussed in our Drive Stats reports how we use those work tickets to do things like define a failure. They’re also evidence of what it takes to keep an always-on service humming, even when the rest of the company is offline. 

So, as the year comes to a close, we wanted to shout out to our awesome data center, cloud ops, and on-call team members—we couldn’t do it without you. And here’s a little retrospective on what this past year looked like.

Total time spent working in each data center

Backblaze has four data regions and six data centers. Here’s the breakdown of where we spent our time this year, inclusive of everything from entropy-fighting maintenance tasks to all the normal network and performance upgrades that keep us ahead of changing data patterns to good ol’ scaling and expansion of our data center footprint:: 

In total across data centers, we spent 3,112.43 hours replacing hard drives. (If those hours don’t square up with the charts above, it’s because the total view includes other types of work, like upgrading our systems.) On average, it took about 0.74 hours per hard drive. 

Here’s a breakdown of the drives replaced by capacity: 

If you’re a Drive Stats fan, you may notice there are some funky drive sizes on there based on our other reporting data. (A 2TB drive? Where does that one even come from?) The drives above are inclusive of our whole fleet, including boot drives and non-production drives, and some of those are sized differently than based for whatever reason—history, job in the data center, etc.

Vault deployments

We also deploy new Vaults fairly regularly. This year, we added the following Vaults (per data center): 

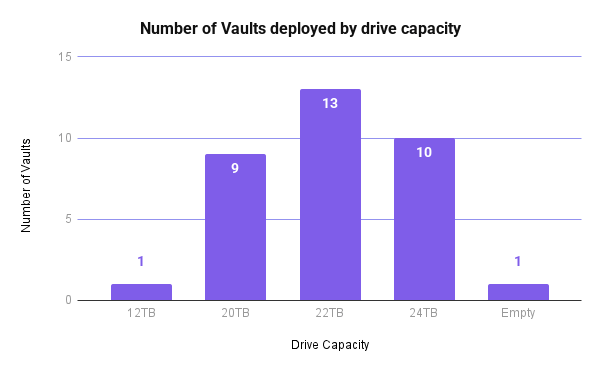
And, here’s a breakdown of the number of Vaults broken down by drive size:

In total, we spent 1043.23 hours on Vault deployment which is about 31.61 hours on average per Vault.

Numbers, as always, tell the story

Taken together, the data shows every hour logged, every drive replaced, every Vault added, and every ticket closed. It adds up to a year’s worth of hands-on infrastructure care; in short, it’s the steady investment required to operate storage at scale.

Whether you’re on call monitoring your own systems, planning for growth in the year ahead, or fully offline over the holidays, your data is here for you. Cheers to another great year!

The post 2025: That’s a Wrap and Here Are the Stats appeared first on Backblaze Blog | Cloud Storage & Cloud Backup
Bookblaze 2025: Backblaze Employee Recommended Reads

Post Syndicated from Stephanie Doyle original https://www.backblaze.com/blog/bookblaze-2025-backblaze-employee-recommended-reads/

A decorative image showing several books on a holiday background.

Sure, we may be a global tech company who spends our days on the front lines of helping our customers solve their toughest data storage challenges, but that doesn’t mean we don’t ever power down the devices and curl up with a good book. Welcome to the third annual Bookblaze, Backblaze’s much-anticipated book guide where our team shares the stories, insights, and adventures that shaped their reading year. 

From thought-provoking nonfiction to immersive fiction and unexpected gems, these recommendations are curated by the people who read, think, and create here at Backblaze—offering you a cozy companion for winter nights, inspiration for your 2026 reading list, and maybe even the perfect gift idea along the way. Whether you’re reconnecting with old favorites or discovering your next great read, we hope this year’s picks spark joy, curiosity, and conversation.

Chris McGranahan, Director, Information Security Architecture

An image of the cover of The Story of CO2 Is the Story of Everything by Peter Brannen.

The Story of CO2 Is the Story of Everything, by Peter Brannen

It’s an exhaustive but entertaining explanation of how our world came to be the way it is, why CO2 is so important to it and how the path we’re currently on is likely to create a world that hasn’t existed in millions of years and never supported humans. And, if you want a fun fiction read, check out any of the Murderbot Diaries series by Martha Wells.

Maddie Presland, Product Marketing Manager

An image of the cover of the book Clytemnestra, by Costanza Casati.

Clytemnestra, by Costanza Casati

I love deeply flawed female protagonists. I also love the fact that myth retellings have been so popular for the last few years, and this year, I decided to tackle my hyper-specific TBR I was neglecting. (Editor’s note: For those of you not afflicted with chronic book collecting, TBR = to be read.) 

Clytemnestra tells the story of one of the most reviled women in Greek mythology. She’s cunning, ruthless, and quite possibly the original champion of playing the long game to seek revenge, as a key player in the Trojan War you’ve probably never heard of. And yet, you can’t help but root for her. It’s shocking that this is a debut novel because, though it can be a slow burn in parts, the characterization and completely immersive writing provides a different perspective of how the Trojan War unfolded for those left at home.

Bala Krishna Gangisetty, Sr. Product Manager

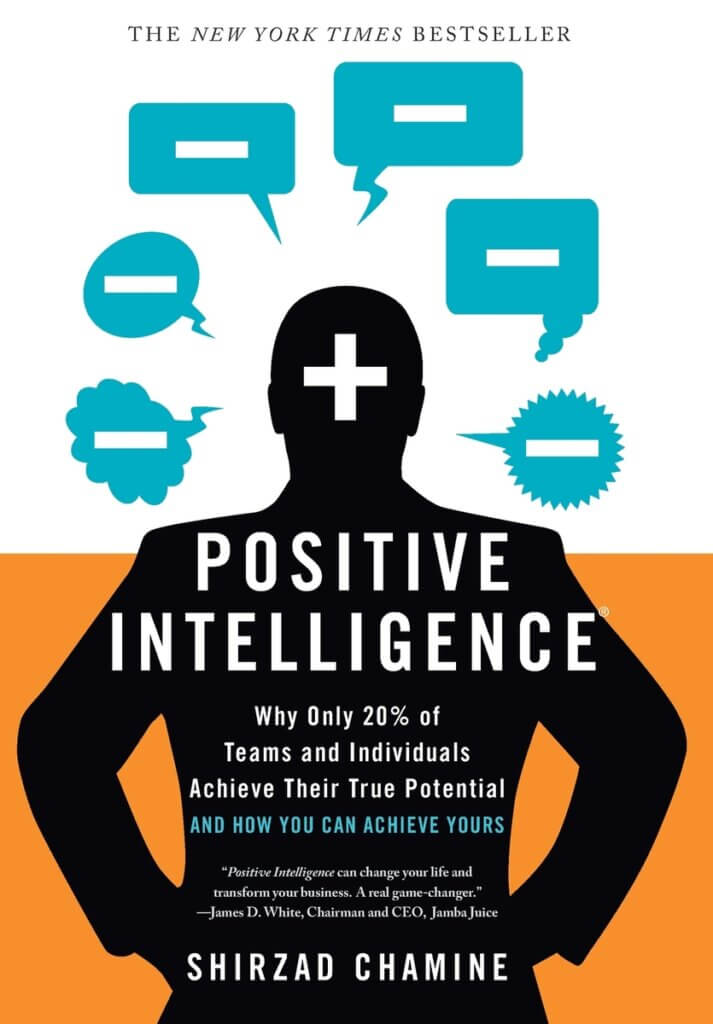
An image of the cover of the book Positive Intelligence, by Shirzad Chamine.

Positive Intelligence, by Shirzad Chamine

I appreciate how Positive Intelligence translates mindset and emotional intelligence into practical exercises for building mental fitness. The Saboteur framework makes it easy to spot negative thinking and shift toward a more productive mindset. It’s a great balance of psychology, neuroscience, and real-world application that supports personal and professional growth.

AJ Sedlak, Director, GTM and Marketing Operations

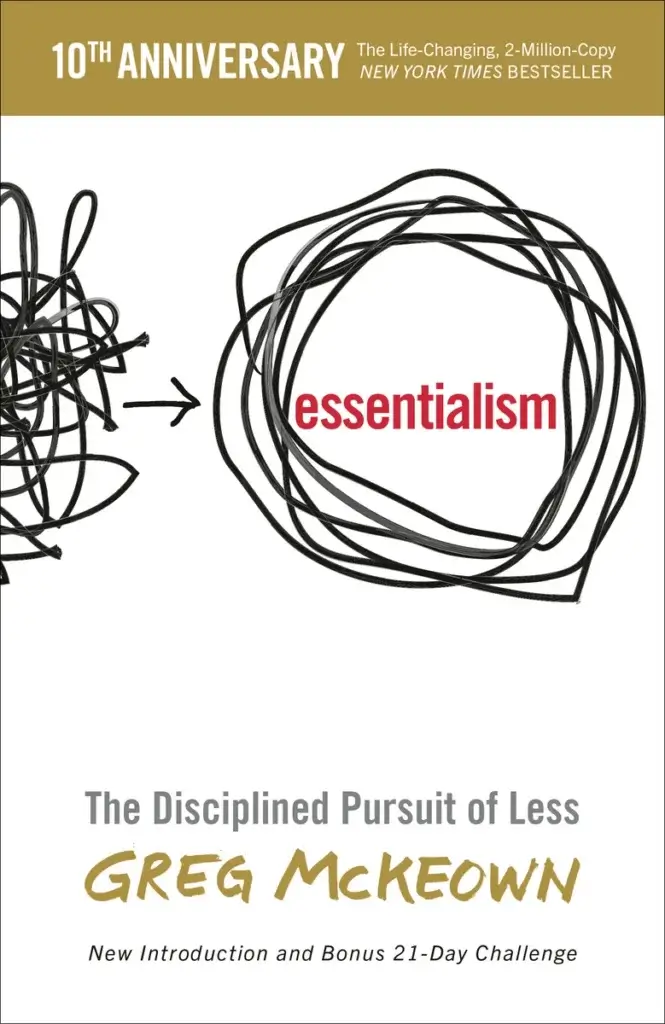
An image of the cover the book Essentialism: The Disciplined Pursuit of Less, by Greg McKeown.

Essentialism: The Disciplined Pursuit of Less, by Greg McKeown

In work and in life, we often struggle with saying “no”, even to ourselves. We take on more than we can effectively manage and execute. As a result, we’re burned out—frustrated by our ever-growing to-do lists and disappointed in the quality of what we do get done. This book helped me understand why doing less actually results in accomplishing more and better things. In addition, it gave me a sense of how to make this case to others—whether it’s about prioritization of work projects or helping a loved one who’s feeling overwhelmed.

Amy Kunde, Sr. Executive Assistant

An image of the cover of the book The Extraordinary Life of Sam Hell, by Robert Dugoni.

The Extraordinary Life of Sam Hell, by Robert Dugoni

Although there were some dark moments in the book, in general it was a feel good book of a boy coming of age through adulthood, paying his dues and then paying it forward.  The setting is right in the Backblaze neighborhood so it’s always interesting to picture the local intersections, and schools referenced in the novel.

Elisa Miller, Sr. Organizational Development Partner

An image of the cover of the book Parable of the Sower, by Octavia Butler.

Parable of the Sower, by Octavia Butler

Octavia Butler is a masterful sci fi writer who has woven a tale in the 1990s set to present time about a dystopian reality oddly similar to the one we are living/heading towards currently of lawlessness, greed, and the quest for survival. Focusing on the power of community, togetherness, and nature, this book was an epic (and scary) adventure into what happens when people gather together to fight the status quo while lifting one another up. It’s not for the faint of heart, but it really was a game changer for me to read, offering solutions beyond capitalism and towards empowerment of humanity, spirituality, and purpose. 

Molly Clancy, Sr. Manager, Content & Creative

An image of the cover of the book Project Hail Mary, by Andy Weir.

Project Hail Mary, by Andy Weir

It’s a buddy comedy, but also the fate of the human race is at stake. There’s lots of science to nerd out on if that’s your thing. And Andy Weir is a former software engineer, so you could kinda sorta say it’s “for work.”

Beth Grey, Sr. Risk & Regulatory Compliance Specialist

An image of the cover of the book The Happy Sleeper: The Science-Backed Guide to Helping Your Baby Get a Good Night's Sleep-Newborn to School Age, by Heather Turgeon, MFT, and Julie Wright, MFT.

The Happy Sleeper: The Science-Backed Guide to Helping Your Baby Get a Good Night’s Sleep-Newborn to School Age, by Heather Turgeon, MFT, and Julie Wright, MFT

Sleep training my child without having to resort to too much crying seemed daunting, but this book helped inform our process with evidence based guidance. I am happy to report that I have a great little sleeper because of it. This book will help any parent gain the skills and confidence to effectively sleep train their child.

Yev Pusin, Head of Communications and Community

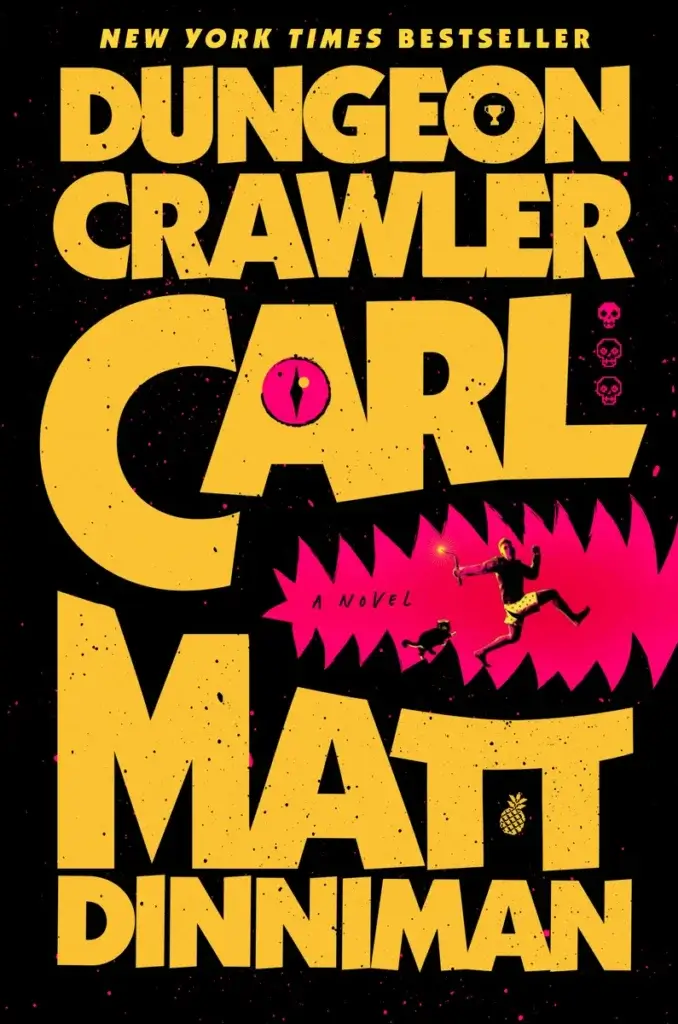
An image of the cover of the book Dungeon Crawler Carl, by Matt Dinniman.

Dungeon Crawler Carl, by Matt Dinniman

This book series is absolute insanity, and if you are able to get the audiobook, you will not regret it. I even got my sister’s mother-in-law to listen to it on audio and she loved it. The premise is that it’s the end of the world, and Carl is sucked into a dungeon to fight for the entertainment of the universe at large—plus there’s a talking cat! What’s not to like? It’s a genre known as LitRPG (editor’s note: Literary role-playing game) which follows Carl and his friends’ progression as they work through the dungeon and try to topple the powers that be.

Nicole Gale, Sr. Marketing Operations Manager

An image of the cover of the book The Ballad of Songbirds and Snakes, by Suzanne Collins.

The Ballad of Songbirds and Snakes, by Suzanne Collins

The new “Hunger Games” book is the first prequel I’ve read in years that genuinely adds something meaningful to its original series. It pulled me right back into Panem, had me rewatching all the movies, and had me loving characters that I didn’t expect to get attached to. A fantastic return to a world I thought I already knew.

Stephanie Doyle, Writer and Content Operations Strategist

An image of the cover of the book Children of Time, by Adrian Tchaikovsky.

Children of Time, by Adrian Tchaikovsky

This series reminds me of old-school science fiction in all the best ways. Without giving too much away, a terraforming project is sabotaged, leading to unexpected outcomes for the targeted planet. Meanwhile, back on Earth, the world ends, and a race begins for the remainder of humanity to find a new home. Tchaikovsky’s brilliance thrives in the details of understanding systems, people, biology, engineering, and science, and each new revelation about what’s happening—in this new world with a new sentient species, and with the humans on their ever-devolving arc ship—stems from each of those details showing up in ways that feel both expected and unexpected at the same time.

The post Bookblaze 2025: Backblaze Employee Recommended Reads appeared first on Backblaze Blog | Cloud Storage & Cloud Backup
AI & Ransomware: Inside the Exfiltration Playbook

Post Syndicated from Stephanie Doyle original https://www.backblaze.com/blog/ai-ransomware-inside-the-exfiltration-playbook/

A decorative image show icons related to security and ransomware.

Ransomware used to mean locked files and paralyzed systems. But today, bad actors are just as focused on exfiltration—the silent theft of sensitive data—and using that data as leverage for extortion.

According to cybersecurity firm BlackFog, 94% of successful cyberattacks in 2024 involved data exfiltration, either alongside or instead of encryption. Whether it’s stolen patient records, credentials, or source code, the goal is simple: Extract something valuable and threaten to leak it if demands aren’t met.

In this article, we examine how exfiltration became a leading tactic, the trends driving its rise, and what organizations—and cloud storage providers—can do to defend against it.

What is exfiltration?

In cybersecurity, exfiltration refers to the unauthorized transfer of data from a system—often done stealthily, and almost always with malicious intent. Think of it as the digital equivalent of corporate espionage: Data is copied, compressed, and quietly smuggled out. Unlike ransomware encryption, which slams the door in your face, exfiltration leaves the front door looking untouched.

The data being exfiltrated is rarely random. Cybercriminals are increasingly strategic about what they take and why. Common targets include:

  • User credentials
  • Personally identifiable information (PII)
  • Intellectual property and source code
  • Encryption keys
  • Shadow copies or backup snapshots

Tactics include exploiting cloud storage misconfigurations, hijacking legitimate credentials, or disguising traffic as everyday protocols like DNS or HTTPS. Increasingly, data exfiltration happens before the main event—laying the groundwork for extortion, credential stuffing, or resale on underground markets.

Recent cybersecurity trends related to exfiltration

Exfiltration has become the defining feature of modern cyberattacks, and the evidence is growing:

  • Double extortion is now standard. Threat actors exfiltrate data first, then deploy ransomware—or skip the encryption altogether—to maximize leverage. According to the 2023 Unit 42 Report, 70% of ransomware incidents involved data theft.
  • Infostealers, malicious programs designed to covertly harvest sensitive information, are on the rise. Over 2.1 billion credentials were stolen in 2024 alone, with malware like RedLine and Lumma making theft accessible to low-skilled attackers. While cybersecurity task forces (comprised of both government and enterprise actors) have made the news with high-profile disruptions of Lumma and other tools, the ability to use generative AI coding tools has meant that cyber attackers have a shortened time to deployment for malware tools.
  • Time to exfiltration is shrinking. Fortinet’s 2025 Threat Landscape Report notes that attackers can extract data in under five hours, while defenders often take days to respond.
  • Encrypted traffic masks malicious behavior. Emerging exfiltration techniques like QUIC-Exfil use modern, encrypted protocols to evade detection by traditional firewalls.
  • State-sponsored actors prioritize stealth. Nation-state groups like Volt Typhoon have used long-term access to exfiltrate sensitive data undetected for months.

Together, these trends point to a world where stolen data is the main prize—and the threat doesn’t start when the ransom note arrives. It starts when your data quietly leaves the building.

Cloud misconfiguration and its role in exfiltration attacks

Exfiltration doesn’t always require malware—sometimes it only takes a misconfigured storage bucket or firewall rule. Cloud misconfigurations remain a leading cause of breaches, with public buckets, excessive identity and access management (IAM) privileges, and overly permissive network rules exposing data to the open internet.

Attackers exploit these gaps to quietly access or extract data without triggering alerts. A strong cloud posture management strategy—one that includes audit automation, implementing the principle of least privilege, and configuring features like Object Lock or Bucket Access Logs—is critical to reducing exposure.

Defending against exfiltration is a shared responsibility

As exfiltration becomes a primary threat, defense requires collaboration between cloud storage providers and their customers. Here’s how the most effective strategies work together.

Immutable backups and Object Lock

One of the strongest defenses is immutability. Backblaze B2’s Object Lock, for example, allows files to be written once and protected from modification, deletion, or encryption for a set period. Even if attackers compromise credentials, the data cannot be altered or removed.

Visibility and outlier detection

Cloud providers are investing in making advanced logging and behavioral analytics available to users to detect data theft in real time. Some examples of these types of features include:

  • Granular access logging with IP and user-level metadata.
  • Rate limiting and download caps to prevent mass theft.
  • Outlier detection powered by machine learning to catch subtle deviations from baseline activity.

Best practices for customers

Storage-layer defenses work best when paired with customer-side security controls:

  • Adopt zero trust architecture: Never assume implicit trust. Continuously validate users, devices, and behaviors.
  • Use MFA and least-privilege access: Lock down credentials, rotate them regularly, and minimize exposure.
  • Encrypt data at rest and in transit: Use strong encryption standards (AES-256, TLS 1.2+) and managed key systems.
  • Monitor for exfiltration indicators: Watch for abnormal traffic volumes, geographic anomalies, and unexpected protocol usage.
  • Run simulated breach drills: Test your team’s ability to detect and respond to stealthy data leaks.

Cloud storage companies can help provide critical security layers, but stopping exfiltration is ultimately a shared responsibility. Combining provider-level resilience with customer vigilance is the best path forward.

In a world of silent theft, vigilance is your best defense

Exfiltration isn’t just an add-on to ransomware. In this environment, locking the doors isn’t enough—You need to monitor the exits.

By combining immutable backups, smart logging, credential controls, and proactive monitoring, organizations can shift from passive victims to active defenders. The best defenses today aren’t just about blocking access; they’re about knowing what’s leaving and making sure it can’t be used against you.

The post AI & Ransomware: Inside the Exfiltration Playbook appeared first on Backblaze Blog | Cloud Storage & Cloud Backup

AI 101: How AI and Ransomware Are Reshaping Cybersecurity

Post Syndicated from Stephanie Doyle original https://www.backblaze.com/blog/ai-101-how-ai-and-ransomware-are-reshaping-cybersecurity/

A decorative image showing a shield, a chip, and the words "AI" over the chip.

AI is rewriting the rules of technology, for better or worse. Arguably one of the most “for better and worse” areas? Ransomware. It’s a full blown billion dollar business, and AI is supercharging both the offense and defense.  

Not only are we seeing AI give bad actors more sophisticated tools and campaigns to target business and consumers alike, we’re also seeing mitigation techniques and technologies deployed by good actors gain equally compelling AI-powered improvements. 

In other words, welcome to the future—where your data is the hostage and the bots are negotiating. Let’s dig in.

Some stage-setting: How much is ransomware costing us?

Despite ransomware payments exceeding an eye-watering $1 billion in 2023—and despite some high profile attacks in 2024, one of which extracted $75 million from a single victim—ransomware attacks actually fell overall in 2024. High profile law enforcement activity, like those against LockBit and BlackCat contributed to a huge drop in the second half of 2024. 

Don’t get too excited though: According to cryptocurrency tracing firm Chainanalysis, that still meant $814 million in 2024. And, the true cost of ransomware includes more than just payments extracted under threat. 

The economic ripple effects of a ransomware attack can include losing C-level talent, having to lay off employees, and ongoing downtime or business closure. Industry-wide, cyber insurance is a growing industry, and 2024 saw a staggering 31% of claims come from third-party risk. 

Reports show that cyber attackers are using ransomware data in new ways, including targeting critical backups and using hostage data to damage organizational reputation

Perhaps most concerningly, ransomware attackers are increasingly using exfiltration as a tactic to double and triple extortion, even using exfiltration data to launch targeted distributed denial-of-service (DDoS) attacks. According to a Check Point’s 2025 Cyber Security Report, some new actors have emerged as exclusively “data-selling platforms,” hosting dedicated data leak sites (DLS) and negotiation platforms.

The good news

  • Machine learning (ML) tools have underpinned modern cyber security techniques for years now—with excellent results. 
  • Sophisticated monitoring tools give us far more granular insights and alerts. 
  • AI-driven behavioral analysis is making it easier to detect anomalies and preempt attacks before they escalate.

What does this mean for defending against ransomware attacks?

Enterprises now have access to security platforms that analyze network behavior in real time, flagging unusual access patterns or lateral movement before a full ransomware payload can deploy. These platforms rely on machine learning models trained on massive datasets of known attack vectors, which allows them to flag and quarantine suspicious activity with impressive accuracy.

The interesting thing is that common knowledge says that “the AI revolution” has been happening recently, and quickly. But, when it comes to cybersecurity defense, many tools have been using ML algorithms for at least two decades. Palo Alto Networks (WildFire), for example, has been using ML since 2003. 

The line between “processing massive datasets and acting up on that info based on programmed parameters” and machine learning is subtle, but important. While the former follows set parameters, machine learning identifies patterns in data—sometimes with human guidance—to decide from multiple possible actions. 

It’s like teaching an assistant a series of tasks they can eventually do on their own. When you think about the progression from basic automation to ML, AI, and deep learning, the shift from rule-based actions to autonomous, chained decisions starts to make a lot of sense.

Zero trust architecture, enhanced by AI, is also gaining momentum. Instead of relying on perimeter-based defenses, AI-enhanced systems enforce granular access controls and continuously verify user and device trust levels. In practice, what this means is that systems no longer assume that you are you on the other end—not without evidence. Combine this with real-time threat intelligence sharing and automated incident response, and enterprises can shorten the window between detection and mitigation drastically. 

The bad news

  • Deep fakes are more convincing. 
  • The ability to generate code means there are more attacks, and those attacks are more sophisticated and responsive. 
  • Cyber criminals of all skill levels have access to more technical tools, including some that are specialized in malware. 
  • Enterprises are adjusting to a new way of working, which can create vulnerabilities.

Generative AI, phishing, and deep fakes

The low-hanging fruit in this discussion is that it’s easy to use generative AI to create more convincing phishing attacks. In the past, bad grammar or non-localized language choices have been an easy way to quickly identify a phishing attack. 

Assisted by generative AI, deep fakes of both the voice and video flavor are getting increasingly difficult to spot—so, while you know your CEO isn’t likely to text you to get a bunch of gift cards or send them company funds via Bitcoin or PayPal, you might believe a video of your CFO or a call from your CEO asking you to transfer funds to accounts that turn out to not be legitimate. 

How is generated code being used by ransomware bad actors?

Just as generative AI models have made everyone a poet, they’re also widely used to generate code. Tools like GitHub Copilot have seen wide adoption amongst enterprises looking to generate and test code. Gartner reports that by 2027, 70% of professional developers will use AI-powered coding tools, up from less than 10% in 2023. 

Given how AI code generation has made code generation easier on enterprises, it’s no surprise that the ransomware industry is following the same adoption trends. By January 2023, this had gone from a hypothetical to a reality, with ransomware bad actors of low levels of technical skill able to leverage LLMs to create malware scripts. 

By July 2023, cybercriminals were already discussing WormGPT, a malicious chatbot trained on ChatGPT which removed standard guardrails against creating illegal or inappropriate content. And, cybersecurity protection firms had executed a proof of concept to demonstrate that AI could generate truly polymorphic code on the fly—a technique used to make it much easier to evade detection by antivirus programs. By July 2024, one study showed that ChatGPT 4 was able to exploit 87% of one-day vulnerabilities. 

Couple that with the fact that ransomware bad actors have opposite success metrics vs. enterprises. Cyber criminals rely on enacting as many attacks as possible, and it only takes one of those attacks succeeding to see a significant upside. Enterprises, on the other hand, only need one failure to see a huge negative impact on their businesses.

What things can you implement to be ransomware ready?

There are a variety of best practices enterprises and users can implement to be more ransomware ready. Organizations like National Institute of Standards and Technology (NIST) and Cybersecurity and Infrastructure Security Agency (CISA) typically publish recommendations, as well as security bulletins and trends within the industry. 

Some of these recommendations are things that users can do on every platform they interact with, such as:  

  • Creating good, strong, unique passwords, and preferably using a password manager: A good password manager reduces password reuse and helps ensure best practices are followed enterprise-wide. 
  • Enabling multifactor authentication (MFA): Multi-factor authentication remains one of the strongest lines of defense, especially when paired with device verification and biometric options. 

On the enterprise side of the house, frameworks like cyber resilience help teams protect data they’ve been entrusted with. And, AI-powered cyber security tools can be a powerful tool in any business’s toolbox. That can look like a number of different things, including: 

  • Investing in AI-powered endpoint detection and response (EDR). These tools continuously monitor and analyze endpoint activities, flagging unusual behavior and isolating threats automatically.
  • Training teams on recognizing deep fakes and AI-enhanced phishing attempts. Security awareness training is evolving fast. Focused, frequent, and AI-aware sessions are critical for employees across departments.
  • Leveraging deception technology. Deploying decoy systems, fake credentials, and honeypots can help trap attackers early and gather valuable intel on their tactics.
  • Running tabletop simulations. Practicing breach scenarios—especially those involving AI-enabled threats—prepares teams to act decisively when seconds matter.

Cyber resilience isn’t static, and neither are the tools and tactics. One of the most important areas an enterprise can invest in is ongoing security and research. Enterprise leaders need to prioritize proactive measures. That means ongoing AI model audits, being nimble in response to new and changing best practices, and investing in cross-functional teams that bring together infosec, legal, and operational leadership. 

The future of AI and ransomware

Let’s level with each other—separately, the AI and ransomware spaces are both changing quickly. When you combine AI and ransomware and try to define how they’re affecting each other, you’re on pretty slippery ground. 

What we’re trying to do here is identify patterns that affect our everyday lives—but we’re also taking a peek at what folks are studying in the research realm, because quantum is just around the corner, and, frankly, too impactful to ignore

So, tell us if we need an update, or if you have another opinion! The comments section is open and we’re happy to chat. 

The post AI 101: How AI and Ransomware Are Reshaping Cybersecurity appeared first on Backblaze Blog | Cloud Storage & Cloud Backup

AI for Enterprise: Getting Started

Post Syndicated from Stephanie Doyle original https://www.backblaze.com/blog/ai-for-enterprise-getting-started/

A decorative image showing various cloud storage and business related icons.

AI is here to stay, and the question on everyone’s mind is how to implement it successfully. If you’re ready to implement AI in your business, consider this article a good jumping off point. I’ll talk about different options for integrating it into your operations and how to make it truly custom, based on your own data, and useful for your business.

More from AI 101

Want to read more about AI? We’ve got you covered in our AI 101 series. And, here’s a sampling that might be useful when you’re thinking about building AI into your business.

How many companies use AI today?

How many businesses are using AI, you ask? Well, let’s ask Google. According to their AI overview (yes, we appreciate the irony), anywhere between 55% and 83% of companies are using or exploring AI in some way.

A screenshot of the Google AI overview that results from the query "how many businesses use AI"?

It’s not lost on me that the above results illustrate some of the big limitations of AI—namely that it’s only as good as the data it’s trained on, it’s far from infallible, and it can’t replace humans wholesale especially when someone needs to fact check those results. Google’s AI overviews have been criticized for providing inaccurate information, hallucinating (with sometimes hilarious results), providing a neat answer to complicated questions, providing information from unreliable sources, potential for bias, and so on. Nevertheless, the feature has had several updates since it was first released (which at least means it’s no longer telling us to put glue on pizza).  

But, setting all that aside, this is actually a great example to consider before we dig into options for incorporating AI into your business. AI Overviews have improved enough—for example, by adding things like source transparency—that we can easily add enough human oversight to consider the above directionally accurate. The landscape of technology is changing, and, ready or not, businesses are being forced to figure out how AI should fit into their strategies.  

What we’ll talk about today

Today we’ll talk about some foundational topics you need to understand when deciding how to incorporate AI into your business. We’ll define the following: 

  1. Software as a service (SaaS) AI add-ons
  2. AI as a service (AIaaS)
  3. Foundation models
  4. Retrieval augmented generation (RAG)

Those definitions will lead us quickly to some practical examples that illustrate how businesses are using AI. 

Software as a service (SaaS) applications, aka, AI as a feature

You may have noticed that many of the web-based applications you are using are suddenly AI-powered or have AI capabilities. While some of that is marketing hype, this could be a way to get started with AI in your organization—by simply turning on a feature in a SaaS product you’re already using. There are lots of ways to do this—Slack, for example, offers AI tools for summarizing and answering questions to help teams work faster.

Example AI use case: AI in customer support

Generative AI capabilities such as chatbots are often added to customer-facing applications like your customer support service. The chatbot is trained using your product support materials or actual questions your staff previously answered.  

By providing a cache of human-based questions and answers, the chatbot can be trained to respond in your unique company voice.

A screenshot of the Backblaze chatbot live on www.backblaze.com.
Oh hey, there’s ours!

Before you activate and use a built-in AI feature of an existing service, you’ll want to determine how you can measure any changes in overall productivity and user satisfaction. In the customer service example above, that could be capturing metrics such as a customer satisfaction rating, time to first contact, time-to-resolution, escalation ratio, and so on. Then establish a baseline for the existing system before engaging the AI assistant and set specific points where you will compare that baseline to the AI powered system. 

Using an AI powered service has many benefits, but there are a number of considerations to contemplate:

  • You are limited in functionality by what the vendor provides.
  • What is the expertise of the software vendor in developing, training, and implementing an AI model?
  • What happens when the model data changes? For example, you’ve employed AI to respond to customer queries. What happens when you add a new product to your lineup or a new feature to an existing product? Is the model retrained? What are the costs? Does it still make economic sense given any new cost? 
  • During the model creation and operational phases, ancillary files such as checkpoints, prompts, responses, and so on are created. Do you have visibility into these files and what analysis can you perform? 
  • Given these ancillary files are derived in part from your original data, can you download these files to your central repository or is the data locked in the vendor’s application?

Artificial intelligence as a service (AIaaS)

AIaaS is one of the many areas of AI where definitions and capabilities are a moving target. That said, we’ll offer that AIaaS is an outsourced service that a cloud-based company provides to other organizations that gives that organization access to different AI models, algorithms, and other resources directly through the vendor’s cloud computing platform via a user interface (UI), API, or SDK connection. The aim is to make a user-friendly interface that simplifies the process of training and deploying AI models accessible to non-AI experts.

AIaaS is worth considering if you’re interested in working with artificial intelligence but you don’t have the in-house resources or expertise to build and manage your own AI technology. There are a broad range of solutions offered in this space which vary by the services provided, let’s categorize the services as follows.

  • Walled gardens:
    • What they offer: In my experience, AIaaS providers in this group usually host most or all of the model training data, checkpoints, inferences, and prompts. 
    • Pros and cons: This is the most straight-forward option, but in practice, this method can be cost prohibitive and lacks transparency. There are few if any options to reduce the cost or economically transfer the model, its work products, or its data elsewhere.
    • Who are they: The obvious ones that come to mind for me are companies like AWS, Google, and IBM Watson.
  • Mix-and-match:
    • What they offer: Solutions in this group vary by the services they provide as well as add-on options and support services. They typically provide hosting services which are used to train, deploy, and use the model. They can also provide data analysis and cleansing for the model input, model testing, engineering support, and general support services as you might require.
    • Pros and cons: As with the walled garden approach, once data is ingested or ancillary data is created within the system it may be difficult to access and if available expensive to retrieve. Often, they also represent companies that provide specialized services—for instance, companies that solve a type of problem, like a computer vision specialist vs. a natural language processing model, or, alternatively, a company that focuses on AI in IT operations, call center operations, cybersecurity, etc.  
    • Who are they: This group includes companies like Twelve Labs, Proofpoint, or Amplify. Note that there’s a bit of a porous line between some of the providers in this category and the following—think of it like a gradient. 
  • Open cloud:
    • What they offer: Providers in this group offer a variety of tools and services that, when combined, allow an organization to construct, test, operate, and maintain an AI-based solution. 
    • Pros and cons: The open cloud approach allows you to select the best of breed providers for the various stages of your AI project. It also allows you to have control over the model and its byproducts such as checkpoint data, inferences, and prompts key to ensuring the model is performing as expected. In summary, while your level of effort for this approach will be higher, you will have more control over your model and more importantly the data, your data.
    • Who are they: This includes platforms like Hugging Face and vendors like OpenAI of ChatGPT fame. Hugging Face is intentionally open source, whereas OpenAI is under pressure to monetize models—one of the bigger evolving conversations in the AI landscape. Today, anyone can purchase an API access subscription from OpenAI to access the GPT-4 Chat from their application. Such subscriptions offer quick access to organizations that want a mature model but aren’t able to or interested in building one themselves. 

The AIaaS approach is a good choice for organizations that lack expertise in building and operating AI systems. The approach you take, walled garden, mix-and-match, or open cloud, will affect how much access and flexibility you have with the data used and produced by the system. This may not be of interest today, but as your organization becomes more AI savvy, being able to access and share the data within the system could become important.

Foundation models

The term “foundation model” originated with the Stanford Institute for Human-Centered Artificial Intelligence’s (HAI) Center for Research on Foundation Models (CRFM) which defines it as “any model that is trained on broad data that can be adapted (e.g., fine-tuned) to a wide range of downstream tasks.” Most, but not all, foundation models are generative AI in form and perform tasks such as language processing, visual comprehension, code generation, and human-centered engagement.

Although foundation models are pre-trained, they can continue to learn from prompts during inference. An organization can develop tailored outputs using techniques such as prompt engineering, fine-tuning, and pipeline engineering. For example, prompt engineering requires you to enter a series of carefully curated prompts to the model such that over time the model infers more precise answers related to the subject matter of the prompts. This makes the model less generic and more specific to your organization.

When using a foundation model, you will need to capture and store all data used to fine-tune the model, for example the prompts and responses used for the prompt engineering process. This will allow you to analyze how the inference process is shifting over time. 

Utilizing a foundation model as a starting point is a good choice, but techniques such as prompt engineering are far from being an exact science. Often such training can exacerbate a subtle bias in the existing model or introduce a new bias. This is especially true if the model is public facing.

Retrieval augmented generation (RAG)

Retrieval augmented generation (RAG) is a relatively new technique that allows AI models to link to external sources. These models are, in most cases, a generative AI model, such as a large language model (LLM). By using RAG techniques, external resources, often rich in technical content, can be leveraged as part of the model during inference to be part of the response to the user. One commonly cited example is having medical journals indexed via this technique so their content is reviewed when the model is generating a response. The same could be done with financial data, legal case law, and so on. 

RAG works by adding code to the original generative AI model to continuously review defined external resources and convert them into machine-readable indices (vector databases) so they are available for inference. This means the core generative model does not have to be retrained, instead it can use new or updated sources on the fly. This allows you to use your data to make the model your own and lets you update the data sources to keep the model current.

This technique is extremely powerful, but it does require you to store the original model, the testing or validation data used, the external resources you are using to augment the model, their vector databases, and any prompts and inferred responses. Given the tools and utilities you will use to monitor and analyze how your RAG infused AI model is performing, a central cloud storage repository is a good choice for storing this data.

It’s all about the data—Your data

AI, at least in its current form, is not deus ex machina. Yes, ChatGPT and its ilk can create wonderful stories of fact or fiction and amazing, never before seen imagery, but without your data, they are marvelously generic. In other words, you and more precisely your data are the key to the value your organization will achieve in using AI.

As we have seen, there are a multitude of options. On one hand, we can hand off our data to a company, pay them handsomely, and let them build and run our AI models—the walled garden approach. While this is enticing, the reality is that AI is still a moving target with few rules and regulations in place and your visibility to what is happening to your data is limited as is your ability to do something if there is a problem. 

At the other end is the open cloud approach. This allows you to choose the best-of-breed cloud based applications and cloud compute services to create and run your model. These applications and services can interact freely with your cloud storage platform to leverage your organization’s data while providing you complete visibility and control. Yes, it will require more investment on your part, but given the maturity of AI in general, it makes sense for you to keep a watchful eye on how AI is used in your organization and more importantly how well it is performing.

In short, AI requires your data to be truly useful to your organization. AI in its current form is still a young science, one that requires watching to ensure it does what is expected. That’s not paranoia, that’s just good business. To do this you will need unfettered affordable access to your data, the AI model, and its work products.

The post AI for Enterprise: Getting Started appeared first on Backblaze Blog | Cloud Storage & Cloud Backup

Bookblaze: The Third Annual Backblaze Book Guide

Post Syndicated from Stephanie Doyle original https://www.backblaze.com/blog/bookblaze-the-third-annual-backblaze-book-guide/

A decorative image showing a book and a cozy library.

It’s time once again for our annual book guide, where Backblaze authors give you the inside scoop on what they’ve been reading. So, whether the weather outside is frightful, or, like at our home office in San Mateo, weird and drizzly, we hope you enjoy!

Pat Patterson, Chief Technical Evangelist

The cover image of Never Understood.

Never Understood: The Jesus and Mary Chain, by William Reid and Jim Reid

I love a good book about music, and when I saw autographed copies of “Never Understood” on sale at the merchandise stand at the Jesus and Mary Chain’s San Francisco gig earlier this year, I could not walk away without buying one. The book is co-authored by William and Jim Reid, the Scottish brothers who have been the only consistent band members since they started making music in the early ‘80s, and alternates between their accounts from early life in a Glasgow tenement through growing up listening to the Velvet Underground, Iggy Pop, and Bowie in the nearby post-war new town of East Kilbride, to realizing that the band each of them wanted to form on their own was actually the same band, and the subsequent rollercoaster ride of recording, touring, breaking up, and getting back together.

There’s a lot of humor amongst the rock and roll excess—one of my favorite moments was the contrasting explanations of how they assigned roles as they were getting started. From William: “It wasn’t like it was Jim’s dream to be the singer—we basically had a big fight about who was gonna sing and he lost.” Jim writes: “We actually tossed a coin for it, but the outcome was the same: William won. I was the singer.” Comedy soon turns to tragedy, however, as Jim explains how he turned to heavy drinking to overcome his shyness of singing on stage, setting the scene for a lifelong battle with alcohol.

Lee Brackstone, the book’s editor, deserves credit for the excellent job he’s done stitching this all together. Even though the viewpoint bounces between the two brothers, it reads as a single narrative. William’s passages are set in a serif font, while Jim’s are sans, so you quickly develop a feel for who you’re reading. It’s a riveting tale, whether you love or hate the band’s music—I envy you listening to their debut album Psychocandy for the first time if you don’t fall into either of those camps—and the brothers’ love/hate relationship brings a poignant dimension to what is already a classic story of early success, record label indifference and shenanigans, figuring out how to play the music you hear in your head, and being shocked that other people actually want to hear it too.

Yev Pusin, Sr. Director, Marketing

The cover image of Impact Winter by Travis Beacham.

Impact Winter, by Travis Beacham

A comet strikes the earth and blocks out the sun. Bad news for people, good news for vampires. If you like the concept of 30 Days of Night and enjoy great world building and story telling with a bloody twist, this is a fantastic addition to your schedule. Bonus: It’s an audio drama, so perfect for your commute.

Jeremy Milk, Sr. Director, Product Marketing

The cover image of How Big Things Get Done by Dan Gardner and Bent Flyvbjerg.

How Big Things Get Done, by Dan Gardner and Bent Flyvbjerg

I stumbled upon this book right around the time one big thing in my life was proceeding nicely and another was not. Why? This book didn’t give me all the answers—sorry, there are no silver bullets—yet it provided a digestible, pragmatic framework for successfully managing big projects and initiatives, with situational awareness for the psychology of the many stakeholders who will be key to the success. As an impatient person who also likes to plan, I took away new nuance from the authors’ Think Slow, Act Fast model. And, as a student of Eric Ries’ The Lean Startup model, I appreciate the authors of this book adding their own flavor of MVP with the Maximum Virtual Product concept when you simply cannot lean-test something as big as you envision and yet you can develop virtual proxies to test underlying assumptions and elements. Now I’m ready to tackle far more big things.

Nicole Gale, Marketing Operations Manager

The cover image for The Women by Kristin Hannah.

The Women, by Kristin Hannah

I love historical fiction and The Women is the first book I’ve read about the Vietnam War. As a big Kristin Hannah fan, I love how she weaves different stories about the historical event into her own. We were immersed into the world of how women were treated in the Vietnam War and I’ll never forget their stories. This one is a must read!

David Johnson, Product Marketing Manager

The cover image for the book The Coming Wave by Mustafa Suleyman.

The Coming Wave: Technology, Power, and the Twenty-First Century’s Greatest Dilemma, by Mustafa Suleyman

I’d suggest “The Coming Wave” by Mustafa Suleyman. It offers an insightful perspective on the evolving world of artificial intelligence and its impact on society. It’s about a year old now, but still great in my opinion.

Bala Krishna Gangisetty, Sr. Product Manager

The cover image for Mindset by Carol Dweck.

Mindset: The New Psychology of Success, by Carol Dweck

This book changed how I see things and perceive challenges or setbacks fundamentally. Growing up, I was wired to strive for perfection in everything I did, and this book shifted my focus from being perfect to continuous improvement. It helped me see opportunities for learning and growth when things don’t go as planned. The best part is that the ideas in this book work for all parts of life, not just work.

Teresa Dodson, Sr. Director, Partner Marketing and Alliances

The cover image for Dare to Lead by Brene Brown.

Dare to Lead: Brave Work. Tough Conversations. Whole Hearts., by Brené Brown

From the official summary: Leadership is not about titles, status, and wielding power. A leader is anyone who takes responsibility for recognizing the potential in people and ideas, and has the courage to develop that potential. Check it out!

Stephanie Doyle, Writer and Content Operations Strategist

The cover image by Skyward by Brandon Sanderson.

The Skyward Trilogy, by Brandon Sanderson

I suppose it’s cheating a bit to recommend a whole series, but the story arc in this series by fantasy heavyweight Brandon Sanderson is great! Full disclosure: I’m hit or miss on Brandon Sanderson’s wider works. (I hate Mistborn and love The Way of Kings. Feel free to get mad at me in the comments.) That said, this series starts with a plucky young heroine on a dystopian planet (don’t worry folks: no love triangle in this one—if you know, you know) and extends into a fascinating view of space travel, AI, and what it means to have a soul.

Happy Reading from Backblaze

We hope this list piques your interest—we may be a tech company, but nothing beats a good, old fashioned book (or audiobook) to help you unwind, disconnect, and lose yourself in someone else’s story for a while.

Any reading recommendations to give us? Let us know in the comments.

The post Bookblaze: The Third Annual Backblaze Book Guide appeared first on Backblaze Blog | Cloud Storage & Cloud Backup
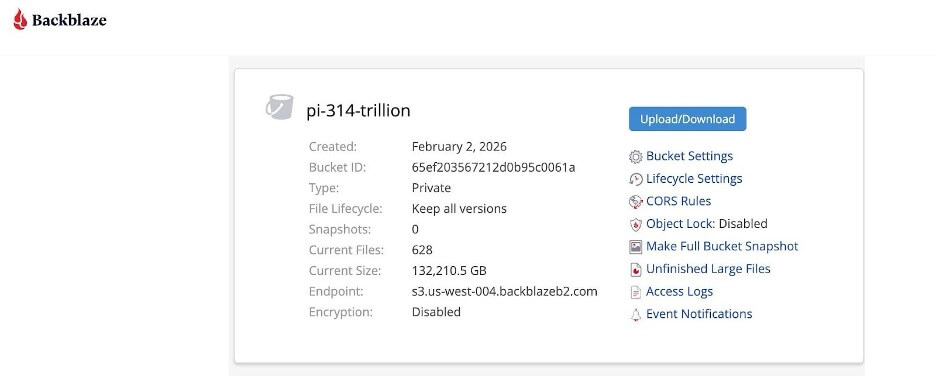
AI 101: Building and Deploying an AI Model

Post Syndicated from Stephanie Doyle original https://www.backblaze.com/blog/ai-101-building-and-deploying-an-ai-model/

A decorative image showing a computer, a cloud, and a building.

Should you build your own AI model? Or use other services to help you accelerate the process?

Once you’ve defined the problem you’re trying to solve and the AI model type that best fits your needs, these are the questions you’re faced with next—where to deploy an AI model and how to go about doing it. In most cases, there is very little reason for you to build, train, and deploy your AI model from scratch, particularly as more and more vendors are stepping in to help companies with all or some of the process. It’s fundamentally complex, takes tons of resources and requires specialized knowledge to do correctly. 

Still, you should have a basic understanding of the AI model training and deployment processes, as these learnings will be useful as later on as you explore various predefined tools, applications, and services you can use to expedite or enhance your ability to use AI within your organization. That’s what I’m digging into today.

How AI model training works

There are several steps in training an AI model which include identification and gathering the data required, data cleansing and assembly, training the model, checkpointing, and, finally, model serving where the model is deployed into the production environment. Here’s an overview of the process. 

A diagram that explains the AI model training process.

Let’s take a minute to explore each of the steps in a little more detail.

Step 1: Review 

The organizational data needed to help educate your model will either be structured or unstructured. Structured data is found in databases, tables, and so on. Unstructured data is basically everything else. Some unstructured data is easy to process, such as text files, while other data is harder to extract, such as PDFs and images. 

In general, the more data you can provide, the better your trained model can be. But, remember to include data that is not what you want as well—this helps models to hone in on the specific piece of information when things are similar. Take this example scenario, for instance:  

You are monitoring hundreds of thousands of wooded acres to determine if there is a fire on the land. As part of training the model, you need to provide images of the legitimate flora and fauna along with images of fire. But you should also provide images of what is not fire, for example reflections of the sun or moon on a lake, a group of lightning bugs at night, car headlights, and so on.

Step 2: Clean 

As the data is collected, it will need to be pre-processed, which involves several techniques such as cleaning the data to handle missing values, removing outliers, scaling features, encoding categorical variables, and splitting the data into training and testing sets. The data needs to be arranged in a manner acceptable to the model itself. This sounds relatively simple, but some studies show that this can take up to 80% of the total model development process time

Step 3: Stage 

This is a collection point for all of the clean, ready to be processed, data. This data will arrive as it is processed (cleaned) which can occur over several days or even weeks. Having this data on hand will be useful if the model is not generated correctly or in the future as a starting point to retrain the model.

Typically large amounts of your data will be cleaned and staged as it is readied to train the AI model. But, there are no special storage requirements for this data. It just needs to be readily available to be uploaded to the AI training environment when the time comes. 

Step 4: Train 

Model training is a resource intensive process where data is copied from staging to high-performance storage located in close proximity to whatever high-powered processor you’re rocking, usually a graphical processing unit (GPU). The GPUs then run the algorithms developed specifically for training the model, and the data is iteratively read and processed an indeterminate number of times until training is complete. Minimizing the time spent utilizing these expensive, high-powered storage and processing resources is critical in managing the overall cost of building the model. In other words: get in, process, and get out.

Step 5: Checkpoint 

During the building of the model, the programming will often create snapshots of the status of the training process. This will include various variables, state changes, and so on. These snapshots are referred to as checkpoints. They initially will be written to local storage within the model training system, and are used to restart the training process from a known good state if something goes wrong. 

Once the model training process is complete, checkpoints should be written to the same centralized data storage location as your staged data. The checkpoint data will become part of the documentation of the model and may be used for forensic purposes should the model not behave appropriately once it is deployed.

Step 6: Serve 

Once the training process is complete, the model can be exported to your central storage location. This will once again help document the system, and from there the model can then be uploaded to the local or cloud compute environment where it will be used.  

At this point you have a clean version of the source data, the checkpoints of the model created, and a copy of the model itself, all stored in your centralized location under your control and readily available should they be needed in the future. 

AI model inference

The term inference is derived from the AI model’s perspective. At a high level, when given a prompt, the model infers its response from the trained model and its data. In simple terms, you’ve trained your model to recognize cats, and then you bring it new data (a picture of a family reunion) and ask your model if it sees any cats in the photo (I’m hoping the answer is yes). 

In AI, the prompt is viewed as new data which is compared to the model’s existing data to determine a response typically in the form of a decision, prediction, or new content as is the case with generative AI models. 

An overview of the inference process is below:

A diagram of the AI inference process.

In some AI systems, the inference process flow includes some additional code to help improve your model. These types of filters can have a range of uses and can happen on either the input or the output stage. For example, if you want to filter inappropriate queries or information, you could include something like keyword filtering when data (the prompt) is input. Or, you could introduce a toxicity detection filter on the output side, which reviews responses and prevents harmful or offensive content to be presented to the user.  

A perhaps better understood problem that filters like this can address is how to get accurate and up-to-date information out of your queried response. On the input flow side of things, retrieval-augmented generation (RAG) directs a trained model to incorporate and weight more heavily information from trusted sources that the user designates. On the output side, you might add a hallucination prevention filter, which would stop the model from presenting false or misleading information.  

More broadly, you’ll notice that both the prompt and response are saved. It is important to review this information on a periodic basis. This is especially true if the model is public facing, if  you are using a model which can change over time such as a foundation model, or if you are using a model which utilizes RAG techniques to include new or external content. 

In all of those examples, your model can drift as new information is introduced, and, as we noted above, getting the right information and cleaning it properly is likely the most time-intensive and important stage of this process. Not for nothing is the phrase “knowledge is power” a truism—in the age of AI, knowledge is power and good data is king. 

The post AI 101: Building and Deploying an AI Model appeared first on Backblaze Blog | Cloud Storage & Cloud Backup

Solving the AI Training Data Challenge with Decart AI and Backblaze

Post Syndicated from Stephanie Doyle original https://www.backblaze.com/blog/solving-the-ai-training-data-challenge-with-decart-ai-and-backblaze/

A decorative image showing the logos of Backblaze and Decart.

Depending on which LLM you ask, we live in a world with somewhere between 25k and 80k AI startups. It’s a growing, highly competitive market where small startups with a big idea can find themselves toe-to-toe with the goliaths of tech—fighting for money, chips, talent, even raw electrical power. 

How does any company differentiate themselves in an explosive burst of technological change, one that requires a lot of investment in talent and infrastructure, where even the richest tech platforms on the planet don’t always succeed? Today we’re sharing the story of Decart—an AI startup that used Backblaze B2 Cloud Storage to leverage a successful launch with an impressive new model that provides an order of magnitude improvement in both the training and inferencing of the largest generative models.

Backblaze is an amazing solution for AI training data. We looked at a number of options and  Backblaze is seriously the best.

—Dean Leitersdorf, Co-Founder and CEO, Decart

First, the news

Decart is an AI research lab that came out of stealth on October 31 with an incredible new model:

While this might look like Minecraft, every pixel you see here and all of the gameplay is being generated by Decart’s Oasis model. It’s like Minecraft in every way you’d expect, except that the entire experience is being generated by AI and you can creatively prompt the model to build beyond the confines of the game. The mindblowing part? Decart says Oasis can perform more than 10 times more efficiently than competitors such as OpenAI’s Sora, which hasn’t been publicly released.

Don’t let the game distract you though—the Minecraft simulation is just an expression of the power of their model. According to the Decart team, this isn’t even version 1.0 of what their approach is capable of generating—more like version 0.01. Given the broad coverage they’ve already received for their launch, we’re excited to see what’s next.

How to break out in the AI market

For Decart, the strategy to pull ahead of the crowd was simple: Disrupt the market on inference speed to deliver game changing models, and do that by building the most high-performance multi-cloud model training infrastructure possible. Then, iterate on that innovation. 

We crafted state of the art infrastructure that allows us to train models that other people simply can’t train.

—Dean Leitersdorf, Co-Founder and CEO, Decart

Before we met Dean and the team at Decart, most of the hard work was done: the multi-cloud AI stack for training was dialed in and the models were going through the paces. They just had one simple, but big, problem holding them back:

The price and the logistics of moving and storing training data were going to limit their growth.

They were burning through free data storage credits from a traditional cloud provider and had data spread across a range of other cloud providers and GPU clusters. Their training data needed to scale from 100s of thousands of hours of video data to 100s of millions of hours, and they needed a storage solution that could handle that scale in three key areas:

  1. Reliably high performance: Decart needed to know that when they got time on a cluster, they could move data in as fast as possible the second that they were able to. 
  2. GPU interoperability: They needed to be sure that whatever storage platform they chose, it would work well with a multi-cluster training approach. Being able to shop jobs between different GPU clouds and disperse training was essential for Dean’s team.
  3. Efficiency: Every dollar an AI startup spends on anything other than training time is a competitive disadvantage, so ensuring that storage costs were low without any surprise fees for data retention or download was key.

Decart discovered Backblaze while researching storage alternatives. After a quick call and two fast months of testing Backblaze in a wide variety of usage patterns, it was clear to the team that they had found the storage foundation they needed. 

We chose Backblaze because everything works. It’s super stable, and we had zero problems.  That’s number one.

—Dean Leitersdorf, Co-Founder and CEO, Decart

When it came time to start moving data from Backblaze to GPU clusters, they had no problem with transferring petabyte-scale datasets. The only minor challenge was ensuring that the compute provider’s pipe could take the volume of data streaming in.

Here’s where things ended up working for Decart:

  • Performance: They were blown away by the performance they achieved with Backblaze (more to come on that later).
  • Price: With pricing at one-fifth the cost of traditional cloud providers, Backblaze unlocked a significant amount of budget.
  • Free egress: The true game changer. Decart, for a number of reasons, trains their models on multiple different GPU clusters at the same time. With Backblaze, they can egress their full dataset to up to three training sites with zero additional cost.

B2 Cloud Storage was literally the only technical thing we used in training these models that didn’t crash the first time we tried it. We’re in an industry where everything fails, but Backblaze didn’t.

—Dean Leitersdorf, Co-Founder and CEO, Decart

Looking forward

With performance, flexibility, and affordability squared away in their data storage approach, the Decart team is now in position to rotate out of this impressive first model and build whatever is next. With all the fundamentals working on the level that Backblaze always provides and Decart is happy with, the two teams are now working together to find even more efficiency and optimization and truly stand up the best infrastructure for training AI models.

The post Solving the AI Training Data Challenge with Decart AI and Backblaze appeared first on Backblaze Blog | Cloud Storage & Cloud Backup

AI 101: Classification vs. Predictive vs. Generative AI

Post Syndicated from Stephanie Doyle original https://www.backblaze.com/blog/ai-101-classification-vs-predictive-vs-generative-ai/

A decorative image showing several buildings with digital lines flowing upward into a cloud.

It may seem like generative AI is the only game in town, or at least the only AI model worth paying attention to. But folks have been using AI models to do all kinds of things for years before ChatGPT, Claude, and Gemini came on the scene. 

Today, I’m talking about the three different broadly defined categories of AI—classification, predictive, and generative—and what they’re good for.

Classification vs. Predictive vs. Generative AI Models: What’s the Diff?

Classification and predictive models have been foundational to AI for decades, powering applications like spam filters, cyber security tools, big data analysis, and demand forecasting. However, with recent advances, generative models like GPT and DALL-E have taken the spotlight, bringing up interesting existential (and legal) questions about the nature of creativity and creative work going forward. Understanding the distinctions and history of these models is key to grasping how AI continues to shape industries and innovation today.

Let’s see which category best applies to your particular problem.

AI classification models

A classification model is built to recognize, understand, and group data into preset categories. The model is fully trained using the training data and then evaluated using test data before being used to respond to unseen data. In general, such models infer answers for the current moment in time, for example, deciding whether an email is spam or phishing. In that case, the decision is based on comparing the incoming email to a model trained on previously classified email messages, both ones that the user has set or ones that the platform has. (The two are related, of course, as the platform’s filters often update to include aggregate user data.) 

In business, classification models drive applications like spam detection, customer segmentation, and fraud detection. Healthcare uses classification models to diagnose diseases based on medical images or patient data. In finance, they help identify high-risk transactions. Social media platforms rely on these models to filter content, detect hate speech, and recommend posts. Overall, classification models are key to organizing large datasets efficiently and making decisions based on patterns, helping automate and optimize numerous industry processes.

AI prediction models

Predictive AI models utilize historical data, patterns, and trends to train the model, so they can be used to make informed decisions about future events or outcomes. Using Drive Stats as an example, we could theoretically build a model that, when given data about a particular drive model and failure rates, predicts the chance that a given hard drive will fail in the next 90 days. Predictive AI models typically require large amounts of data to be trained and are computationally expensive to generate.

Predicting Hard Drive Failure Rates with AI

Okay, we were being coy when we said “example.” Check out Andy Klein’s Tech Day 2024 presentation, “Predicting Hard Drive Failure Rates with AI” to see how this kind of predictive model works.

AI prediction models help predict customer behavior, sales trends, and demand, aiding in decision making and resource planning. In finance, these models are crucial for stock price forecasting, risk assessment, and credit scoring. Healthcare utilizes prediction models for patient outcome predictions, disease progression, and treatment effectiveness. They are also applied in weather forecasting, supply chain optimization, and energy usage management. By analyzing past data, prediction models provide insights that help organizations anticipate trends, make proactive decisions, and optimize performance across various industries.

Generative AI models

You know this one. Generative AI is about creating (sort of) new content. It uses neural networking, deep learning, and other techniques to infer and generate content that is based on patterns it observes in existing content all while mimicking the style and structure as requested. Image generators such as DALL-E and Stable Diffusion, and large language models like ChatGPT, Claude, and Gemini are easily accessible AI applications which have brought AI into the public eye.

Generative AI is at turns the thing that will revolutionize everything, a scary specter with near-sentience that will steal your job, or a big hallucinating fluke that tells you to put glue on pizza. There are some pretty cool use cases—for one, researchers are using generative AI for new drug discovery. But you’re most likely to run into generative AI in the following use cases: customer service chatbots, coding assistants, marketing support, and general business assistants that generate transcripts and summaries.

Unlocking the power of AI

Even with all the current hype around generative AI we are still in the early stages of development when it comes to AI systems given they are most useful in responding to queries based on the subject matter with which they were trained. 

For example, an AI model trained to play chess might find playing checkers to be difficult. While the board, and number of players are the same, can a chess-playing AI model infer the allowed checker moves based on its understanding of chess? Even generative AI models like ChatGPT which are trained on a wide variety of subjects are still lacking a key ingredient to be truly useful to your organization: your data.

An AI chatbot, for example, isn’t going to perform the way you want it to without being powered by your organization’s data. And, how do you build an AI powered tool while keeping your private data private? We started to explore that very question in a recent webinar, “Leveraging your Cloud Storage Data in AI/ML Apps and Services.”

Tune in to learn more about the various ways AI/ML applications use and store data and get insights from our customers who leverage Backblaze B2 Cloud Object Storage for their AI/ML needs.

The post AI 101: Classification vs. Predictive vs. Generative AI appeared first on Backblaze Blog | Cloud Storage & Cloud Backup

Is AI Right for Your Business? 4 Questions to Ask

Post Syndicated from Stephanie Doyle original https://www.backblaze.com/blog/is-ai-right-for-your-business-4-questions-to-ask/

A decorative image showing several layers of computer screen folding into the cloud.

AI is everywhere—powering chatbots, generating images, even deciding what you binge watch next. It’s no wonder businesses of all sizes are feeling compelled to jump on the AI bandwagon. But before you get swept up in the AI hype, here’s the question you need to ask: Is AI right for your business and the problem you’re trying to solve?

Where AI truly becomes a change agent is when it is powered by your organization’s data to deliver relevant, insightful, and actionable observations to you in a timely manner. The reality is, while AI is really cool, without your unique data it provides your organization few competitive advantages. Of course, releasing proprietary, or even sensitive, information to a robot connected to the internet can be risky—and you want to make sure your (and your clients’) information doesn’t end up in surprising places

But just because everyone’s talking about AI doesn’t mean it’s the magic bullet for every problem. Like any strategic investment, it takes careful consideration. So, before you hand over your data to a machine, let’s explore whether AI is really what your business needs—or if it’s just another shiny object in the tech landscape.

Where do I start?

Today, many organizations are somewhere along the AI/ML path. Most are experimenting with AI, some are actively building applications, and a handful have successfully deployed a solution. Like any other project, before you start trying to use AI in your organization, the first thing you should do is define the problem you are trying to solve. Only then can you determine if you really need AI as a part of the solution. 

Ask yourself the following questions about the project. If you answer yes to all four items, the project is AI-worthy:

1. Do you want AI to replace tedious, repetitive tasks?

Start by identifying the business problem in specific, measurable terms. Determine the scope of the problem, its frequency, and the impact it has on your business. Is it recurring and time consuming? If the problem is complex, repetitive, or data-intensive, it might be suitable for AI.

2. Do you want to use AI because you can’t consistently apply a set of logical rules to answer the questions at hand?

If the problem involves large amounts of data that is difficult to process manually where the answer is derived by combining and weighing multiple factors, it may be a candidate for an AI-based solution. On the other hand, just because it can be automated doesn’t mean you need an AI solution—AI is expensive in terms of power and processing resources. If you’re running a simple routine task over and over, you might be just as well off using traditional programming methods. But, when you’re solving a complex task, you need a structure that is not a strict binary, and that’s when you might want to use AI.

3. Will you use AI for problems that humans can solve, but AI can solve much faster?

AI should help your organization solve problems it finds extremely difficult or nearly impossible to solve otherwise. AI excels at tackling complex problems that overwhelm traditional methods, such as processing vast amounts of data, recognizing intricate patterns, or making real-time predictions. If your business is facing challenges that manual processes or standard software can’t handle effectively, AI can step in to provide powerful, scalable solutions that would otherwise be out of reach.

But remember, AI should work with you, not against you. Understand how AI will integrate into your workflow and whether it aligns with your overall business strategy to avoid creating unnecessary complications or disrupting ongoing operations.

4. Do you intend for AI to increase productivity of a function or group?

Most AI projects are productivity based, even those that seem otherwise. Even AI projects aimed at improving customer experiences, like personalized recommendations, ultimately enhance productivity by streamlining interactions and reducing manual effort. At their core, most AI implementations are designed to automate tasks, optimize processes, or extract actionable insights, all of which drive greater efficiency and cost savings. And, that means you need to analyze the potential return on investment (ROI). 

AI integration requires an investment in technology, data management, and often specialized personnel. Weigh the cost of implementing AI against the potential benefits it could bring. Will it save time or reduce costs? By how much? If the financial or productivity benefits outweigh the costs, AI may be a worthwhile investment.

Where to next?

Clearly defining the problem and deciding if it’s suitable for an AI-based solution is really just the first step. Once the problem is defined, you open up another set of questions around whether and how to implement it. Do you have the right data, resources, and expertise to support an AI solution? How will it integrate with your systems? How will you measure success? The answers to all of these questions should absolutely inform your decision-making, but understanding if you’re applying AI to the right problem is your starting point. Without that, you’re using a sledgehammer to crack a nut, so to speak. 

The post Is AI Right for Your Business? 4 Questions to Ask appeared first on Backblaze Blog | Cloud Storage & Cloud Backup
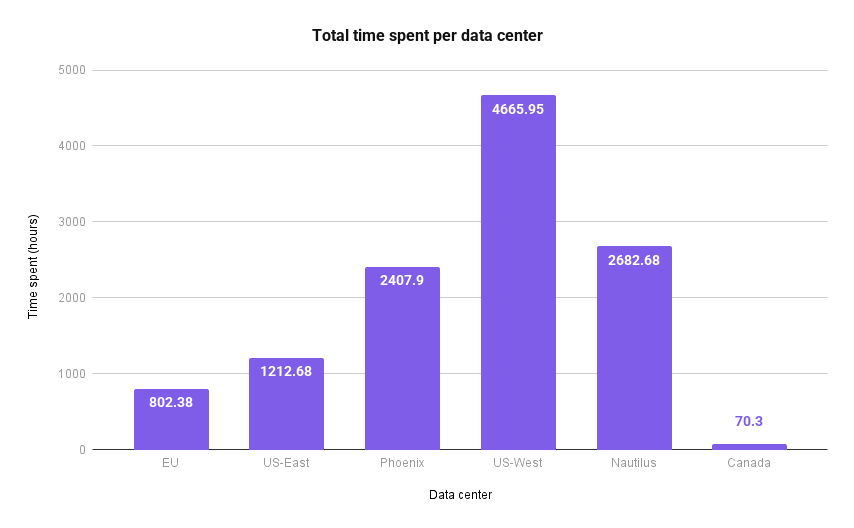
Proper Address: IPv4 vs. IPv6

Post Syndicated from Stephanie Doyle original https://www.backblaze.com/blog/proper-address-ipv4-vs-ipv6/

A decorative image showing a cloud over performance graphs and charts.

Ah, the 1980s. It brought us such classics as Ghostbusters, The Princess Bride, Tina Turner’s triumphant comeback, Pac-Man, and the original Apple Macintosh. Also, it gave us the birth of the internet, in which we figured out how to make all our computers one giant, powerful network held together initially by internet protocols (IPs) and, eventually, by a mutual love of cat videos

Now, each of our devices that connect to the internet require a way to find and send information back and forth, which means they need an IP address. Most folks don’t type IP addresses into their search bar though—we use domain names (for example, www.backblaze.com). Which IP addresses correspond to which domain names is stored in a hierarchical and distributed database system known as the domain name system (DNS), which is also an internet protocol. 

Today, let’s talk about IP addresses: What are IPv4 and IPv6, why is IPv6 necessary, and what impact will it have on networking?

Let’s set the scene

Any time you’re sending and receiving data, be it a letter in the mail, dialing a phone number, or loading a website, you’ve got to have an identifiable address reach the proper person and/or device. What all of these types of addresses have in common is that as our population has exploded, we’ve had to re-work how addresses work in order to include more possible data locations. U.S. zip codes were established in 1963. Area codes were established in 1947, and a great expansion was necessary only three(ish) decades later, and that plan was implemented starting in the late 1980s and ending in the mid ’90s.

IP addresses, meanwhile, have been operating on the first and only protocol we introduced in the 1980s, called IPv4. Not only has the world population almost doubled since then, but there has also been a nonlinear explosion in internet-connected devices per person. When IP addresses were first invented, it was unfathomable that most folks would be walking around with a computer in their pocket, remotely checking who’s ringing their doorbells while adjusting their thermostat in anticipation of returning home. All of those internet-connected devices use an IP address, in one way or another. 

So, it’s no surprise that we’re now seeing an adoption of a new IP address standard. In keeping with tradition, the versions aren’t sequential: Right now we’re jumping from IPv4 to IPv6. (What happened to IPv5? It was skipped, sort of.)

What is IPv4?

IPv4 is an internet protocol that assigns addresses to devices. It uses a 32-bit address, represented by four numbers (octets), each between 0 and 255, separated by dots (e.g., 192.168.1.100), and uses decimal notation. 

Remember that each bit represents one of two possible values, a 0 or a 1. So, for a 32-bit value, there are 2^32 possible addresses, or 4,294,967,296 IP addresses total. Several IPv4 address blocks were also reserved for private networks and multicast addresses, about 286 million total. Between the two reserved blocks of addresses, that’s about 7% of the total addresses in existence.

What is IPv6?

IPv6 uses a 128-bit address, represented by a longer string of numbers and letters (e.g., 2001:0db8:85a3:0000:0000:8a2e:0370:7334) in hexadecimal code, aka hex code. If you’ve ever designed a MySpace page (hi, Tom!) or a webpage, you’re likely familiar with the hex codes used to identify precise colors.

Doing the math as we did above, there are 2^128 possible IPv6 addresses, which is 340 undecillion. (That’s the 11th order of magnitude if you’re going, million, billion, trillion, and so on.) And, just like IPv4, there are some reserved addresses, but they represent such a comparatively smaller number of total available addresses that it’s not even worth calculating a percentage. 

Woah, how have we been surviving in the meantime?

We mentioned above that we’ve known we’re running out of IP addresses for a while. But, important detail: There was evidence of the problem as early as 1981, and mitigation efforts were enacted by 1992. Before we get into what mitigation strategies have been used over the years, a bit of a refinement of the above information—IP addresses consist of two main parts, one that identifies the network (or, sometimes, the subnet) and the host, or the destination on that network. (That’s true of both IPv4 and IPv6.)

Classful networking

In the original iteration of IPv4, the bits that identified the subnet were fixed, and that meant a lot of wasted space. In 1981, we implemented classful networking. Instead of keeping a fixed number of bits to identify a network, the three most significant bits identified the size of the network prefix, and that sent you to different classes. That meant that existing addresses didn’t have to change. Here’s a handy table:

Class Most significant bits Network prefix size (bits) Host identifier size (bits) Address range Maximum number of networks Maximum number of hosts per network
A 0 8 24 0.0.0.0–127.255.255.255 128 networks 16,777,216 hosts per network
B 10 16 16 128.0.0.0–191.255.255.255 16,384 networks 65,386 hosts per network
C 110 24 8 192.0.0.0–223.255.255.255 2,097,152 networks 256 hosts per network
D (multicast)
E (reserved)
1110
1111
224.0.0.0–255.255.255.255

All that sounds a bit like gobbley-gook. An analogy: You live in a city that wants to improve mail delivery, so it’s introduced the option to choose from a small, medium, or large mailbox. The sizes are actually pretty disproportionate—the small is about the size of a toaster, whereas the medium is the size of a kitchen trash can. (And large is the size of your car. Who gets that much mail?) No matter which size mailbox you (or your neighbor) chooses, your physical address didn’t change when this system was implemented. You usually get more mail than the toaster would accommodate, but never even come close to filling your trash can-sized mailbox. So, that extra space just sits empty and unused, never fulfilling its mail volume potential.  

Note that classful networking is now largely defunct, replaced by…  

Classless inter-domain routing (CIDR)

The biggest issue of the above system was its inflexibility. Adding classes gave us more flexibility than the original design, but you were still restricted to 8, 16, or 24 bits to identify the network. That means you can end up with a lot of unused IP addresses, as indicated by our above analogy. Here’s the math behind why: 

The number of addresses available on a network is the inverse of how many bits you use to define it. So, in a 32-bit address, if you use 16 bits to define the network, you have 8 bits leftover to define the host. That’s our Class C network, which contained 2^8 (256) IP addresses—not enough for most use cases. And, the next smallest subset, Class B, represented 2^16 IP addresses (65,536 total), which most organizations could not use efficiently. After DNS became the norm, it became clear that classful networking wasn’t scalable, and thus CIDR rose to prominence.  

CIDR is based on variable-length subnet masking (VLSM), which lets each network be divided into subnetworks of various power-of-two sizes. This method optimizes the allocation of IPv4 addresses by allowing for more flexible address blocks. 

Using our analogy, instead of assigning mailbox size based on household size, you might just have a system in which folks walk up to the post office and find their name on a list associated with a mailbox. If someone has more or less mail that month, then they can be assigned the properly sized mailbox. 

Network address translation (NAT)

NAT allows multiple devices to share a single public IPv4 address by modifying the IP header when it’s in transit. This is super useful when you’re talking about private networks—you can assign a single IP address to multiple devices. For example, if you have several internet of thing (IoT) devices in your home, they can all appear to the public network as one IP address, and your local network can figure out what traffic goes where. It also makes it so that if a network moves, the host doesn’t necessarily have to be assigned a new IP address, such as if an internet provider like Cox decides to stop doing business in your region, and Spectrum takes over their IP address allocation—though likely they’d just change your public IP address in that specific scenario.

In our mail analogy, NAT is like those group mailboxes you see in rural areas, apartment buildings, or in neighborhoods. Everyone in the same location gets their mail delivered to the same physical address, and your box number is used to further identify your house within the group mailbox. 

The secondary market of IP addresses

If we can learn anything from the above workarounds, flexibility and possibility is key. So, it’s unsurprising to know that a secondary market has cropped up, introducing things like address recycling, address trading, and address leasing. IPv6 will solve the scarcity issue—but what else can it do?

What are the benefits of IPv6?

So far we’ve talked about the primary benefit of IPv6—more IP addresses that we clearly need. But, there are other benefits as well. Here’s a summary: 

Improved Efficiency

  • Simpler header: The IPv6 header is simpler than IPv4’s, leading to faster packet processing and reduced overhead.
  • Efficient routing: IPv6’s design allows for more efficient routing, potentially reducing latency and improving network performance. Arguably, most folks won’t see a huge performance improvement unless they reconfigure their own network architecture, but the possibility is there. 
  • Autoconfiguration: IPv6 supports automatic configuration of network interfaces, simplifying setup and reducing administrative overhead.

Enhanced Security

  • Built-in security features: IPv6 offers built-in security mechanisms like IPsec, potentially providing better protection against attacks. In practice, it’s not typically implemented as most encryption is typically handled at the transport layer security (TLS) IP layer. 

Quality of Service (QoS)

  • Improved QoS: IPv6 provides better support for QoS, allowing for prioritization of different types of traffic, ensuring a better user experience for applications like video conferencing and online gaming.

Other Benefits

  • Reduced reliance on NAT: IPv6 reduces the need for NAT, simplifying network configurations and improving end-to-end connectivity.
  • Support for new services: IPv6 is better suited for emerging technologies and applications that require a large number of addresses and advanced features.

What’s next? Will we run out again?

Given the amount of addresses for IPv4 vs. IPv6 (4.2 billion vs. 340 undecillion, respectively), you can understand how we might have needed to shore up our IPv4 addresses. Honestly, if you assume one device per person, we already outnumber IPv4 addresses—in fact, we outnumbered IP addresses in the 1970s, before IPv4 was even invented! You shouldn’t assume one device per person, by the way. While many countries with widespread broadband access have several devices per person—in the U.S., Consumer Affairs was reporting 21 per U.S. household in 2023, and the average U.S. household for that same year was 2.51 people. Globally, that same source reports 3.6 internet-connected devices per person.   

Changes like this can certainly be disruptive, but the good news on that front is that most devices will be dual-stacked for quite a while. That means that you’ll have both versions of an IP address, and this change can roll out organically (so to speak). In the end, we’ll have a better-performing internet, ready to grow with us for the foreseeable future.

The post Proper Address: IPv4 vs. IPv6 appeared first on Backblaze Blog | Cloud Storage & Cloud Backup
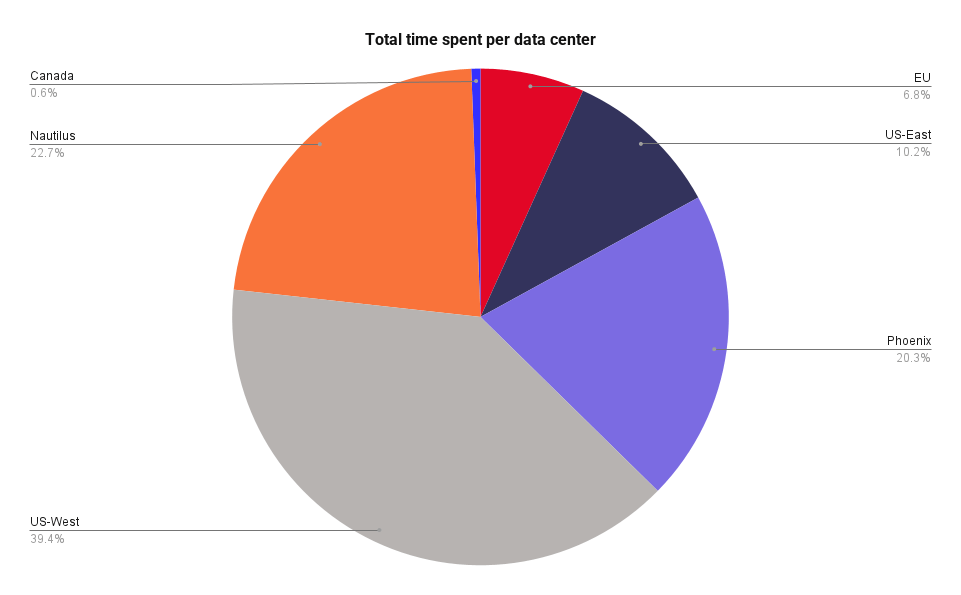
How to Future-Proof Your Archives: File Formats That Stand the Test of Time

Post Syndicated from Stephanie Doyle original https://www.backblaze.com/blog/how-to-future-proof-your-archives-file-formats-that-stand-the-test-of-time/

A decorative image showing a vault door with a series of 0s and 1s behind it.

You may have heard us talk about backup a time or two, and hopefully our love has been clear. So, when Wired gave us a shoutout in their recent, astute article about archiving, allow us to say we were flattered. 

As both a tribute and a collaboration, we’re happy to build on their article’s premise about choosing the correct file type for archiving purposes, and we’ll highlight a few tools to help you protect your files in the long term. 

Wired reports: Archived files are especially vulnerable to changing file types

Archives are distinct from backups and have their own demands. Backups are intended to give you the ability to restore files or your whole environment—they need to be both in step with your current environment and flexible enough to respond to both a point in time restore of your whole system or a single file, depending on what you need. Archiving, on the other hand, is about preservation when you can’t depend on the continuity of devices or digital tools—those tools might look quite different (or not exist at all!) down the line. That said, backups are also an essential building block of digital archives. 

Making something last long-term takes more work than you’d think. And, interestingly, digital archiving suffers from the opposite problem of “traditional” archiving. Whereas with books, magazines, and other paper-based media, you want to touch them as little as possible, with digital archives, you actually need to do some active maintenance to make sure you’re converting files to accessible formats that you can open well into the future. 

Here’s an expert from the Wired report telling us about just one part of the practical concerns of digital archiving: 

“Twenty years, in the digital realm, is ancient,” says Lance Stuchell, director of digital preservation services at the University of Michigan. His team is frequently tasked with recovering digital files from old computers and storage mediums. “We have a lab that can deal with old media—floppy drives, CDs, older computers. We can get that off of those types of media and move it into our preservation system while ensuring we don’t mess it up while we’re doing it.”

Wired goes on to report that the problem isn’t just having the correct device, but actually having the correct file type. Their biggest takeaways for making sure your files hold up over time? 

  1. Use open source file types. 
  2. If you’re storing media, store files uncompressed. 
  3. Back up absolutely everything. 

Check out the rest of the article for details—it’s worth a read. And, thanks for the shoutout as a good option for folks looking to back up, Wired. 

Some tools for converting files

So, now that you’re all geared up to get your archive in order, here are some free, open source tools that will help you convert your files. One note when you’re using open source (and we’re big fans) is to make sure you’re using a tool you trust. And, some tools, especially web-based tools, may collect user data or can expose sensitive information. 

With that in mind, here are a few to get you started: 

  • LibreOffice: The successor to OpenOffice, LibreOffice is a well-respected open source alternative to Microsoft Office and supports several open source and older document file formats.
  • Pandoc: Pandoc calls itself the Swiss army knife of file converters for markup formats, which includes documents, HTML formats, spreadsheets, and more. It’s got a very helpful list of file formats and indicates whether they can convert from/to each of them. 
  • ImageMagick: ImageMagick can certainly convert your files, and it’s also beloved because it can edit files, including support for scripting and automation. But, for our purposes, it converts image formats and has continuous support from the open source community. 
  • FFmpeg: FFmpeg is a community supported audio and video tool. 
  • VLC media player: Another audio and video tool that supports conversion.

Keep in mind that while we’re recommending many of these for conversion purposes, many are actually fully-fledged programs with some very cool features—and, some can even replace traditional paid tool options, if you’re the budget-conscious type.  

Archiving hardware of the future

Standard tech right now for storing archived files is on hard disk drives (HDDs) or solid state drives (SSDs), and you’ll even find DVDs that can keep your data stored for 1,000 years or more. All storage media types are known to degrade over time—when you’re storing long-term, you can’t just leave your drive disconnected from power forever, for instance. 

That said, developing storage media types, while not as common, offer some interesting (if not yet widely practical) options. If you’re willing to drop some cash, DNA (yes, the biological kind) or ceramic might be for you. And, if you want to get super sci-fi with it, PhysicsWorld has reported on the “Superman memory crystal” that could keep data intact for millions of years. 

Build your archive for alien circumstances

When we ambitiously sent out messages to the (potential) sentient life in the universe almost 50 years ago, on golden records no less, we apparently thought it was enough to also include a phonograph needle and some symbolic instructions on how to play the record. In practice, we sent a message with no guarantees that someone could decode and play it. 

That may be fine for our space-age time capsule, but for our everyday archives, we do want to do our best to make sure we’re able to open them in the future. While we can’t anticipate where technology will be in 20, 40, or 100 years, we can follow digital archiving best practices to give future generations the best chance of opening files. At least they’ll likely share a language with us, as opposed to our alien friends.

The post How to Future-Proof Your Archives: File Formats That Stand the Test of Time appeared first on Backblaze Blog | Cloud Storage & Cloud Backup
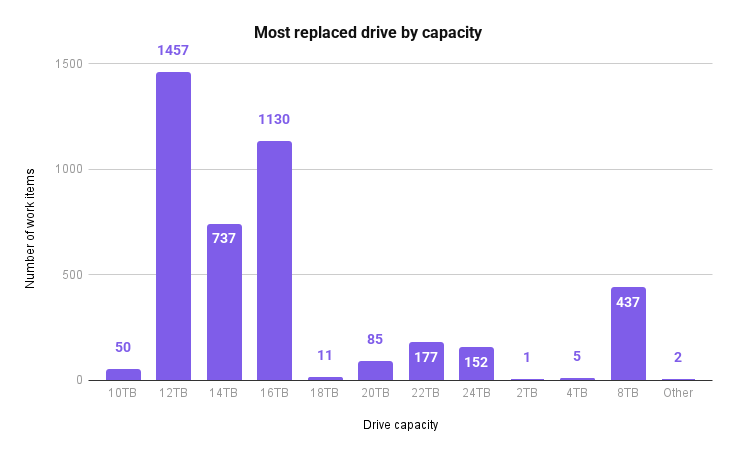
Fireworks vs. The Cloud: Which Is Louder?

Post Syndicated from Stephanie Doyle original https://www.backblaze.com/blog/fireworks-vs-the-cloud-which-is-louder/

A decorative image showing a comically large hammer smash a hard drive.

You may think the answer to “What do fireworks and the cloud have in common?” is nothing. But, you would be wrong. Both are carefully designed, highly-researched systems that contain a chain reaction of events that lead to a desired outcome. In the case of data centers (DCs), that’s storing and using data. In the case of fireworks, that’s a delightful explosion. 

More importantly for our purposes today, both data centers and fireworks are loud. Not upstairs-neighbor loud; rather, they are hearing-loss-and-noise-pollution loud. But, which thing is louder, the cloud or fireworks? What are their sonic qualities, and which is more dangerous?

So, in honor of America’s Independence Day, let’s quantify that with data.

Let’s talk about how we measure sound

We talked briefly about how loud the cloud is in a previous article. All that noise comes from a combination of factors, largely cooling systems—either those that affect large areas of the DC, or those that are part of the hardware of each server rack. Back in 2017, we measured our DCs at approximately 78dB, and other sources report that DCs can reach up to 96dB

And, it’s unfair to paint a data center with a broad brush, sonically speaking. There are different zones in a data center, and they can vary widely in the amount of decibels produced based on a variety of factors. Here’s a handy list: 

  • Lower range (40-55 dBs): This quieter zone might be experienced in administrative areas or server rooms with less densely packed equipment. It’s comparable to quiet conversation or background noise in a library.
  • Mid range (55-70 dBs): This is a more common range within data centers, representing the noise level near operating servers. It’s similar to normal conversation or background noise in a restaurant.
  • Higher range (70-85 dBs): This zone can be found near high-powered equipment or cooling systems. It’s comparable to a vacuum cleaner or busy traffic. Prolonged exposure at these levels can begin to cause hearing damage.
  • Very high range (85-96 dBs or above): This is the loudest zone and is typically only encountered near generators or during maintenance activities. It’s similar to a power lawnmower or motorcycle and can cause hearing damage with prolonged exposure.

This can all seem relatively esoteric, but it has real world effects. Noise pollution has been shown to cause all sorts of environmental impacts in humans and other animals, and it’s a hot topic of conversation amongst people who live nearby and amongst those responsible for designing and building DCs. 

And, how loud are fireworks?

As we all know, there are many types of fireworks, ranging from the humble sparkler to the professionals-only aerial explosives. In theory, consumer-level explosives are supposed to have a noise limit of 120 dBs when fired from 15 meters (about 50 ft.) away. Just to get us all on the same page (for science), here’s a table that outlines some dB ranges for major types of fireworks:

Type of Firework Noise Level Decibel Range Description
Sparklers Soft Crackling 80-90 dB Hand-held sticks that emit showers of sparks.
Glow Worms Soft Crackling/Hissing 85-100 dB Ground-based fireworks that glow and crackle slightly.
Snakes Crackling/Popping 90-110 dB Long, snake-like fireworks that unfurl with a crackling or popping sound.
Poppers Moderate Pops 100-115 dB Small, paper-wrapped fireworks that make a popping sound when lit.
Fountains Crackling/Hissing 95-120 dB Ground-based fireworks that spray sparks and make a crackling or hissing noise.
Roman Candles Moderate Pops/Booms 110-130 dB Hand-held tubes that shoot out stars with loud pops or small booms.
Bottle Rockets Loud Whistle/Boom 120-140 dB Fireworks that launch into the air with a whistle and explode with a loud boom.
Aerial Shells (Small) Moderate-Loud Booms 130-150 dB Launched into the air, these explode with moderate to loud booms and create colorful visual effects.
Aerial Shells (Large) Very Loud Booms 150-175 dB Large shells launched high into the air, exploding with very loud booms and spectacular visuals.
Salute Batteries Extremely Loud Booms 150-180 dB+ Rapid-fire bursts of loud explosions, often used in professional displays.

Curveball: A direct comparison of dBs isn’t our only metric for “dangerous”

Here’s the funny thing about sound and human hearing, and it ties back to our discussion of decibels: Different types of sound register differently with us, and “loud” isn’t the only risk factor for potential hearing loss. Think of when you’re listening to singers—in general, humans find deeper ranges to be “quieter” while they find higher-pitched ranges to be “louder.” In theory, they could be putting out the same loudness of sound, but we perceive it differently. 

A second factor is that a short, percussive sound (like a firework), and a quieter sound that you’re exposed to for longer periods of time (like in a data center) can cause different types of damage. Any loud noise can cause hearing loss—a rapid change in pressure can easily damage the delicate anatomy of the inner ear. 

When you’re talking about prolonged exposure, the safe zone is generally 70dB and below. And, while 85dB is considered safe over a period of eight hours, that safe period gets cut in half for every 3dB increase. So, at 88dBs, safe exposure time is 4 hours. At that 96dBs we cited above, you’re at risk for hearing loss in less than an hour. 

Of course, there are several ways to mitigate hearing loss in instances where you know you’ll be exposed to potentially dangerous levels of sound, like if you’re attending a fireworks show or going to visit a data center. Over-ear hearing protection and earplugs—which range from your common wax/silicone variety to specially designed models that let in more or less noise—are your two main options (as it relates to your body). And, data centers and fireworks each have methods of reducing sound.

A warning from our robot friend, and declaring a winner

In doing my very thorough research, I did wonder what would happen if you stack these noises… that is, what happens if you set off a firecracker in a data center? Would the noises stack (80dB + 120dB = 200dB)? Would they equalize, then have an additive increment (80dB + the 40dB between baseline and firecracker spike)? 

So, I asked my favorite large language model robot friend, who I seem to have distressed. It answered: 

Setting off a firecracker in a server room would be a very bad idea for several reasons, and the combined noise level wouldn’t be the biggest concern.

Turns out, while the noise levels would be significant, the combined effect might not be as dramatic as one might imagine. First, unlike open spaces, server rooms often have soundproofing measures to dampen noise. This would limit the amplification of the firecracker’s sound as it does the existing server noise. And second, the firecracker’s sudden, high-intensity sound would likely be the dominant noise even within the server’s noise range. The combined effect wouldn’t be a simple addition of decibel levels. The firecracker’s very loud, short burst would likely overpower the server’s constant hum within the room.

LLM conclusion:

Setting off a firecracker in a server room is extremely dangerous and has far worse consequences than just a loud noise. It’s crucial to prioritize safety and avoid such actions in these critical environments.

Obviously (or I hope it’s obvious), this is not something we’d test in our real-world environment, and we don’t ever recommend that you do either. However, it’s safe to say that in the battle of cloud vs. fireworks, it’s a tad unfair to do a direct comparison of their loudness. Fireworks are (on average) louder, as they’re designed to be. Data centers are still very loud, and the quality of the sound therein is also likely to cause hearing damage over a period of time, and all that is still true even when we’re making active efforts to reduce and dampen the noise in DCs.

Safety first, friends. Remember that ear protection around both servers and fireworks is advisable, and use fireworks and data centers responsibly. We’ll see you on the other side.

The post Fireworks vs. The Cloud: Which Is Louder? appeared first on Backblaze Blog | Cloud Storage & Cloud Backup
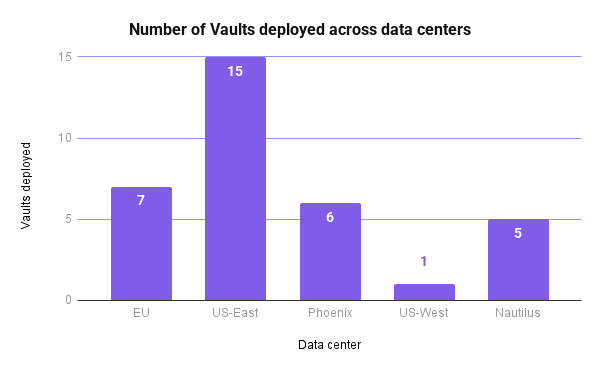
AI 101: Why RAG Is All the RAGe

Post Syndicated from Stephanie Doyle original https://www.backblaze.com/blog/ai-101-why-rag-is-all-the-rage/

A decorative image showing an AI chip connecting icons of representing different files.

At the risk of being called the stick in the mud of the tech world, we here at Backblaze have often bemoaned our industry’s love of making up new acronyms. The most recent culprit, hailing from the fast-moving artificial intelligence/machine learning (AI/ML) space, is truly memorable: RAG, aka retrieval-augmented generation. For the record, its creator has apologized for inflicting it upon the world.

Given how useful it is, we’re willing to forgive. (I’m sure he was holding his breath for that news.) Today, our AI 101 series is back to talk about what RAG is—and the big problem it solves. 

Read more AI 101

This article is part of a series that attempts to understand the evolving world of AI/ML. Check out our previous articles for more context:

Let’s start with large language models (LLMs)

LLMs are the most recognizable expression of AI in our current zeitgeist. (Arguably, you could append that with “that we’re all paying attention to,” given that ML algorithms have been behind many tools for decades now.) LLMs underpin tools like ChatGPT, Google Gemini, and Claude, as well as things like service-oriented chatbots, natural language processing tasks, and so on. They’re trained on vast amounts of data with algorithmic guardrails known as parameters and hyperparameters guiding their training. Once trained, we query them through a process known as inference

Fabulous! The possibilities are endless. However, one of the biggest challenges we’ve experienced (and laughed about on the internet) is that LLMs can return inaccurate results, while sounding very, very reasonable. Additionally, LLMs don’t know what they don’t know. Their answers can only be as good as the data they draw from—so, if their training dataset is outdated or contains a systematic bias, it will impact your results. As AI tools have become more widely adopted, we’ve seen LLM inaccuracies range from “funny and widely mocked” to “oh, that’s actually serious.

Enter retrieval-augmented generation (Fine! RAG)

RAG is a solution to these problems. Instead of relying on only an LLM’s dataset, RAG queries external sources before returning a response. It’s more complicated than “let me google that for you,” as the process takes that external data, turns it into a vectored database, and then balances external data with an LLM’s “general knowledge” generated response and skill at responding to conversational queries. 

This has several advantages. Users now have sources they can cite, and recent information is taken into account. From a development perspective, it means that you don’t have to re-train a model as frequently. And, it can be implemented in as few as five lines of code. 

One important nuance is that when you’re building RAG into your product, you can set its sources. For industries like medicine and law, that means you can point them towards industry journals and trusted sources, outweighing the often misquoted or mis-cited examples you might see in a general database. 

Another example: For a technical documentation portal, you can take an LLM, trained on general information and the nuts and bolts of conversational querying, and direct it to rely on your organization’s help articles as its most important sources. Your organization controls the authoritative data, and how often/when changes are made. Users can trust that they’re getting the most recent security patches and correct code. And, you can do so quickly, easily, and—most importantly—cost-effectively. 

RAG doesn’t mean foolproof AI

RAG is a great, straightforward method for keeping LLM tools updated with current, high-quality information and giving users more transparency around where their answers are coming from. However, as we mentioned above, AI is only ever as good as the data it uses. Keep in mind, that’s a deceptively simple thing to say. It’s an entire, specialized job to validate datasets, and that expertise is built into the research and monitoring that happens while training an LLM. 

RAG gives a new source of data a privileged position—you’re saying “this data is more authoritative than that data” and, since the LLM doesn’t have anything in its general database, it may not have a counter argument. If you’re not paying attention to your RAG data source standards, and doing so on an ongoing basis, it’s possible, and even likely, that data bias, low quality data, etc. could creep into your model. 

Think of it this way: If you’re pointing to a new feature in your tech docs and there’s an error, that impact is magnified because an LLM will give more weight to the RAG data. At least in that case, you’re the one who controls the source data. In our other examples of legal or medical AI tools pointing to journal updates, things can get, well, more complicated. If (when) you’re setting up an AI that uses RAG, it’s imperative to make sure you’re also setting yourself up with reliable sources that are regularly updated. 

But, given its impact, and how low of a lift it is to integrate into existing products, we can see why RAG is all the RAGe—and, as always, we look forward to more to come in the AI landscape. For now, we can already see the impact it’s having on the market, with SaaS companies and startups alike exploring the possibilities.

The post AI 101: Why RAG Is All the RAGe appeared first on Backblaze Blog | Cloud Storage & Cloud Backup