Post Syndicated from Drive Stats Team original https://www.backblaze.com/blog/backblaze-drive-stats-for-q3-2025/

Every quarter, Drive Stats gives us the numbers. This quarter, it gave us a crisis of meaning. What does it really mean for a hard drive to fail? Is it the moment the lights go out, or the moment we decide they have? Philosophers might call that an ontological gray area. We just call it Q3.
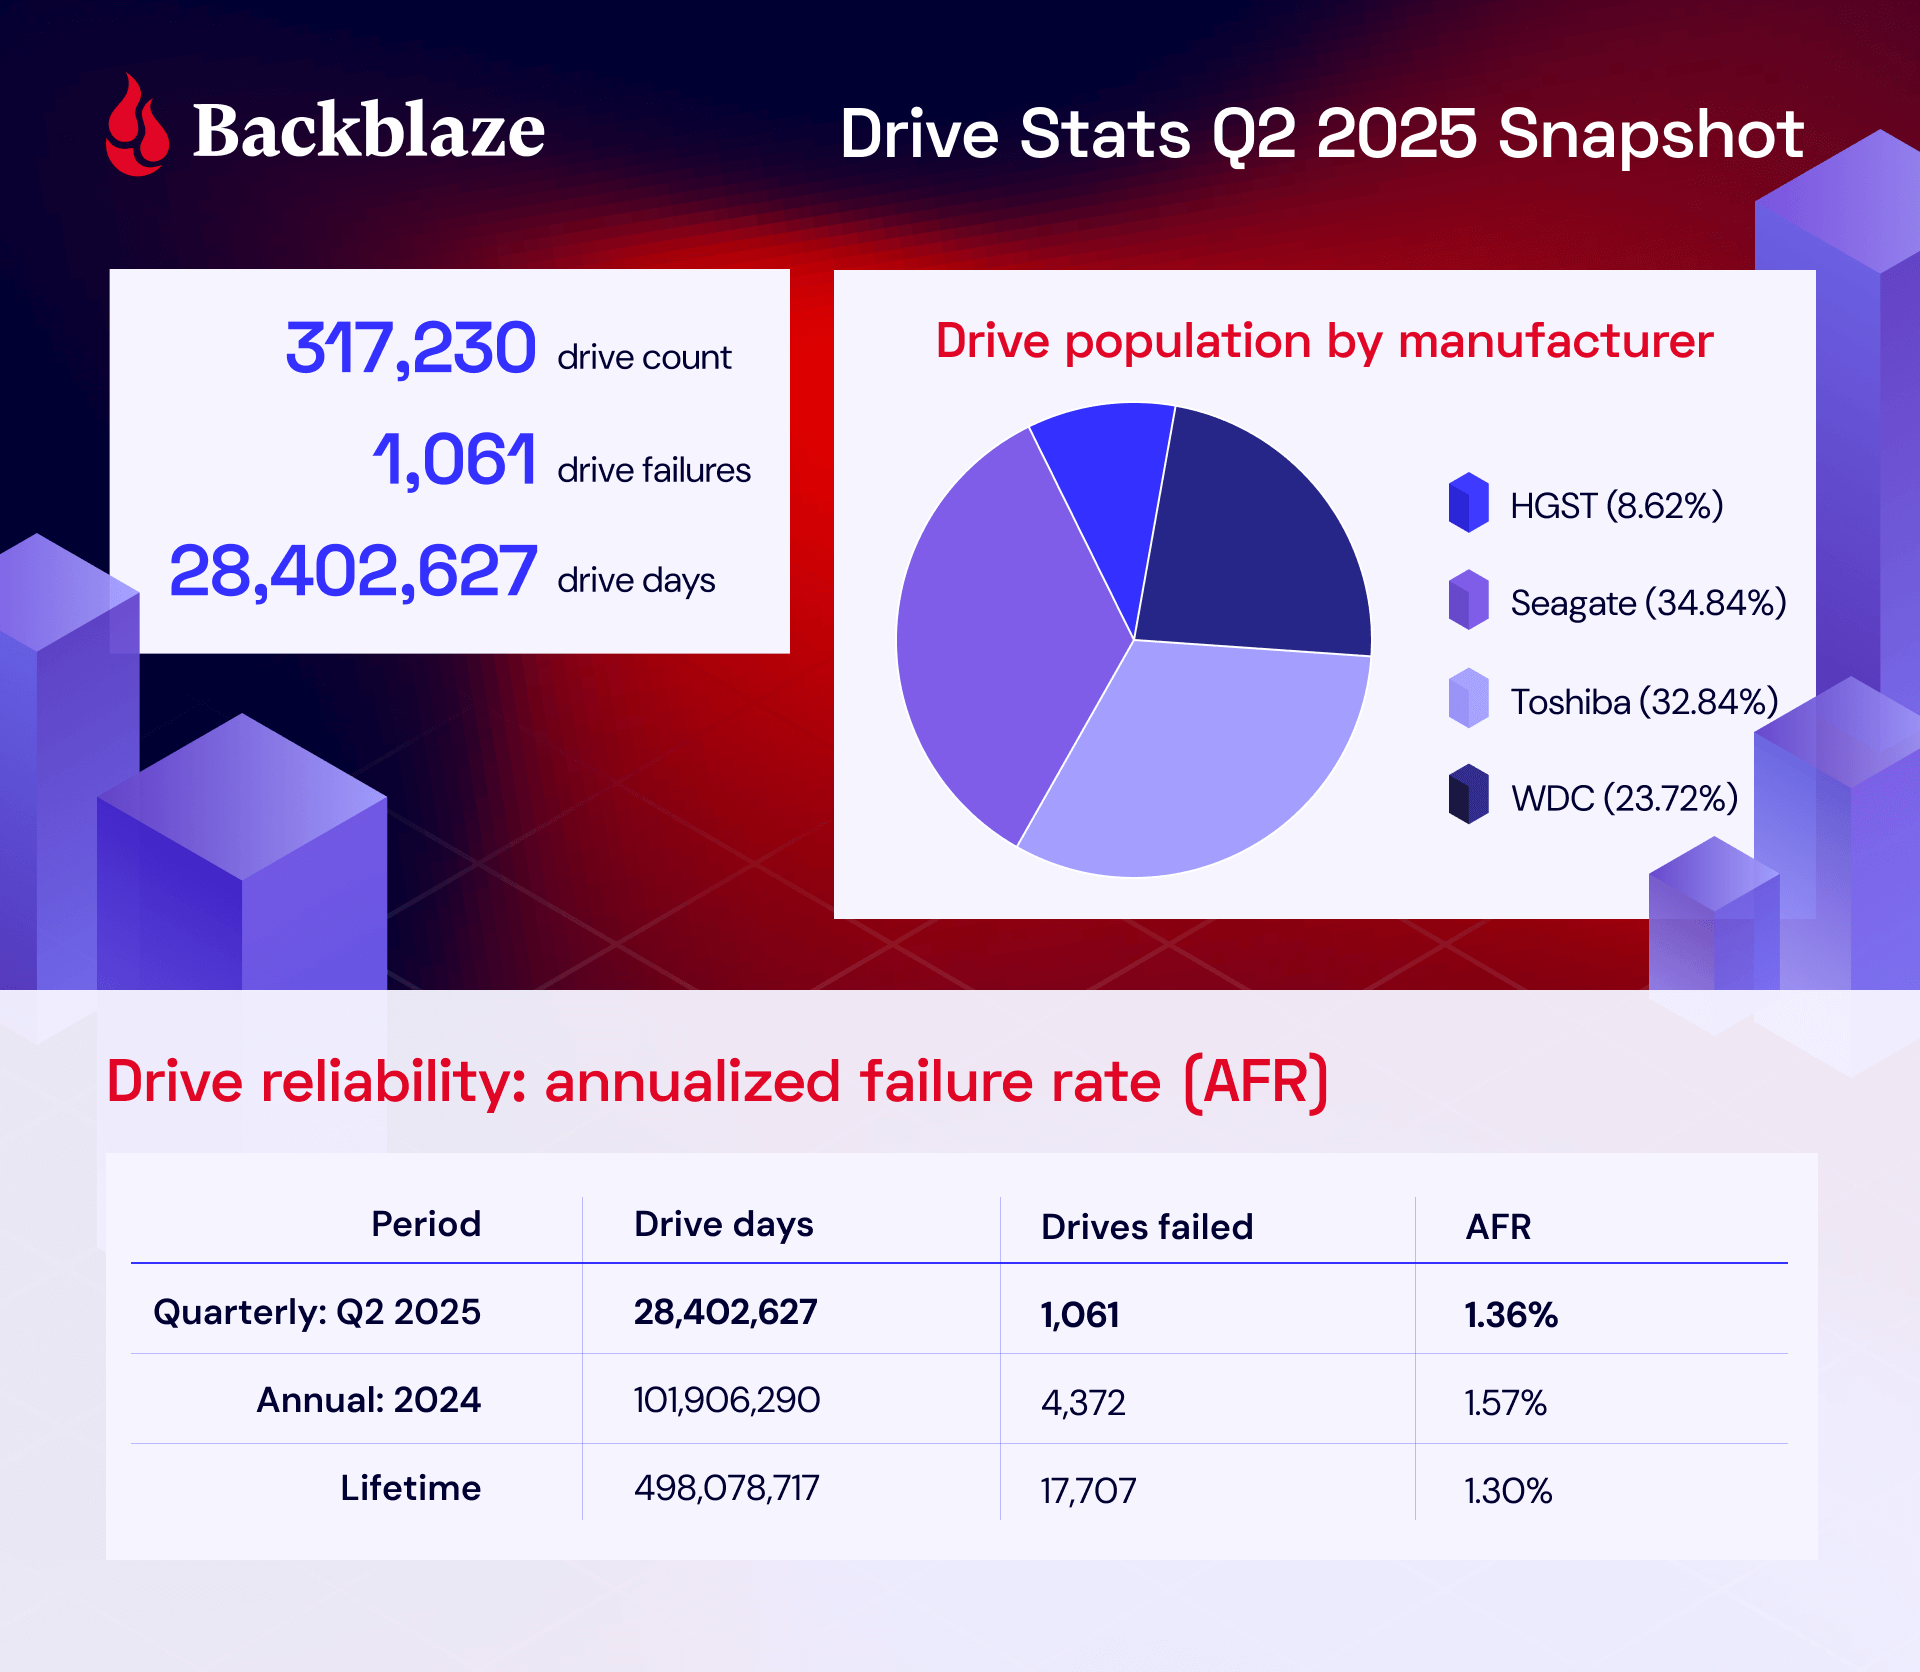
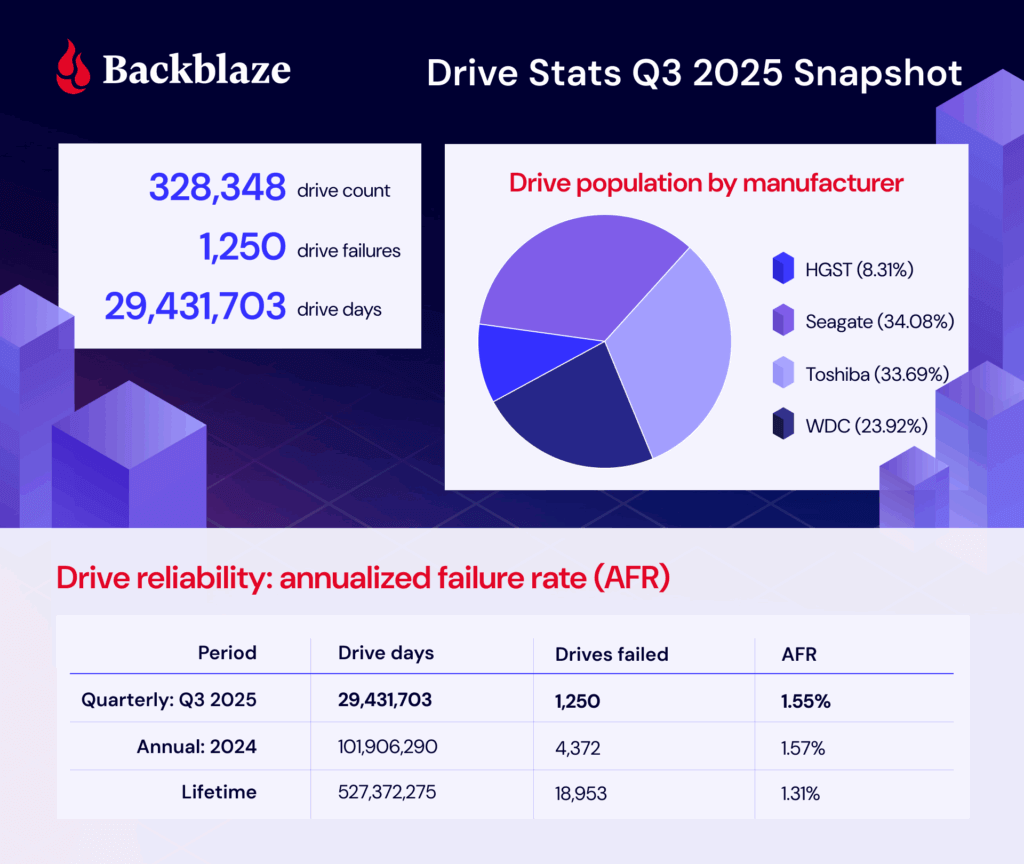
As of June 30, 2025, we had 332,915 drives under management. Of that total, there were 3,970 boot drives and 328,348 data drives. Let’s dig into our stats, then talk about the meaning of failure.
This quarter, we have more to talk about (Stats-wise)
Drive Stats was the beginning. Want to see more of the full picture? Check out the Stats Lab webinar, bringing together content from all of our Stats articles. We’re going to chat about all things Backblaze (and beyond)—by the numbers.

Drive Stats: The digest version
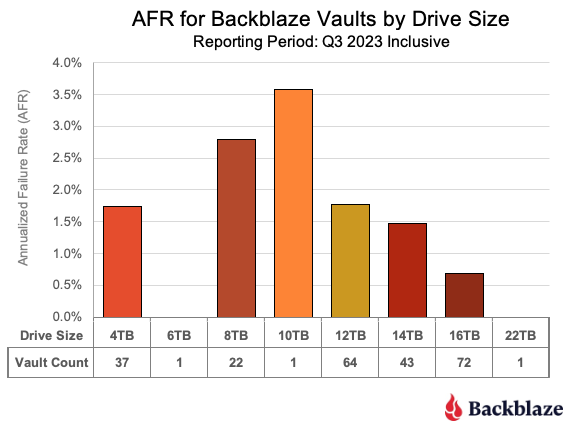
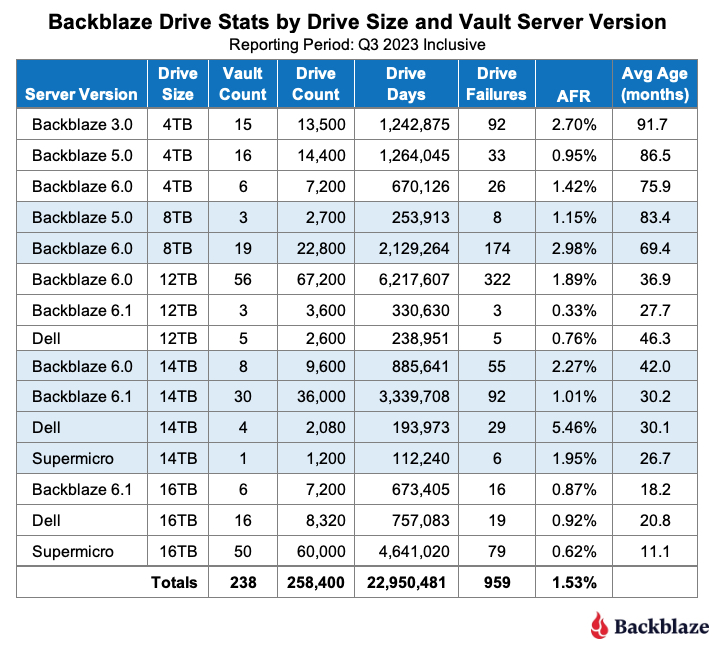
Q3 2025 hard drive failure rates
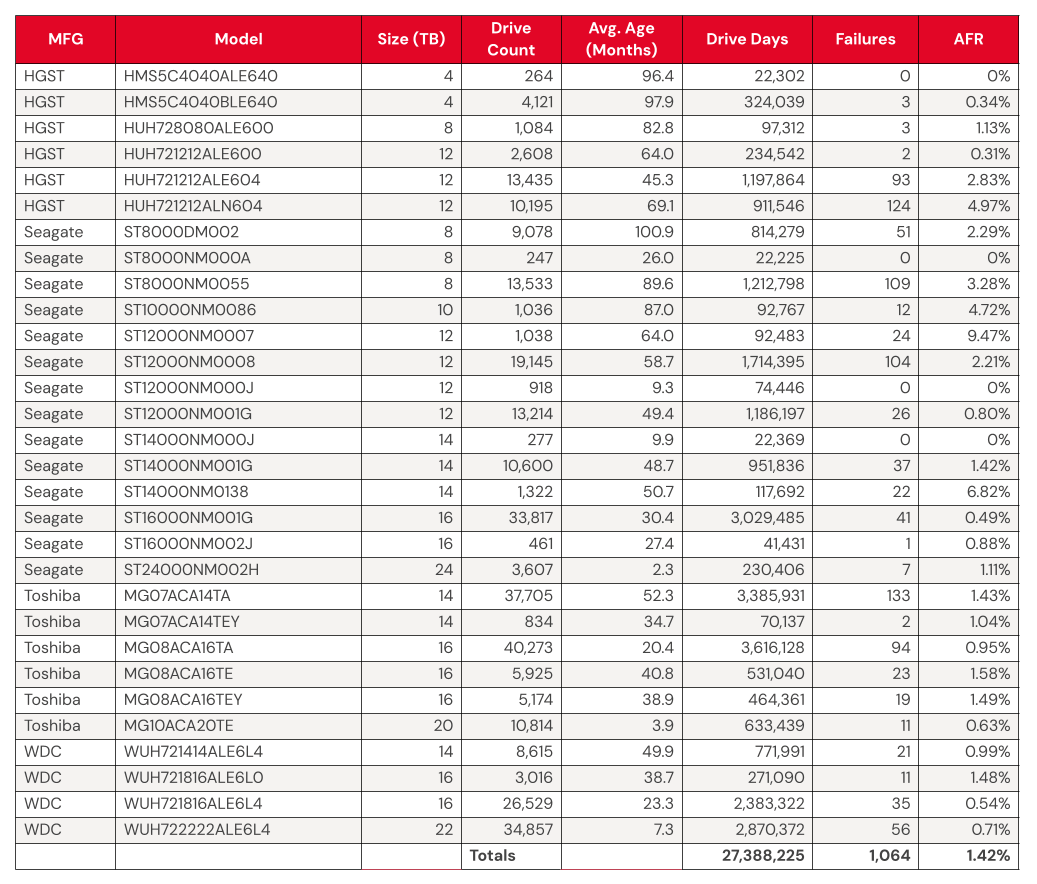
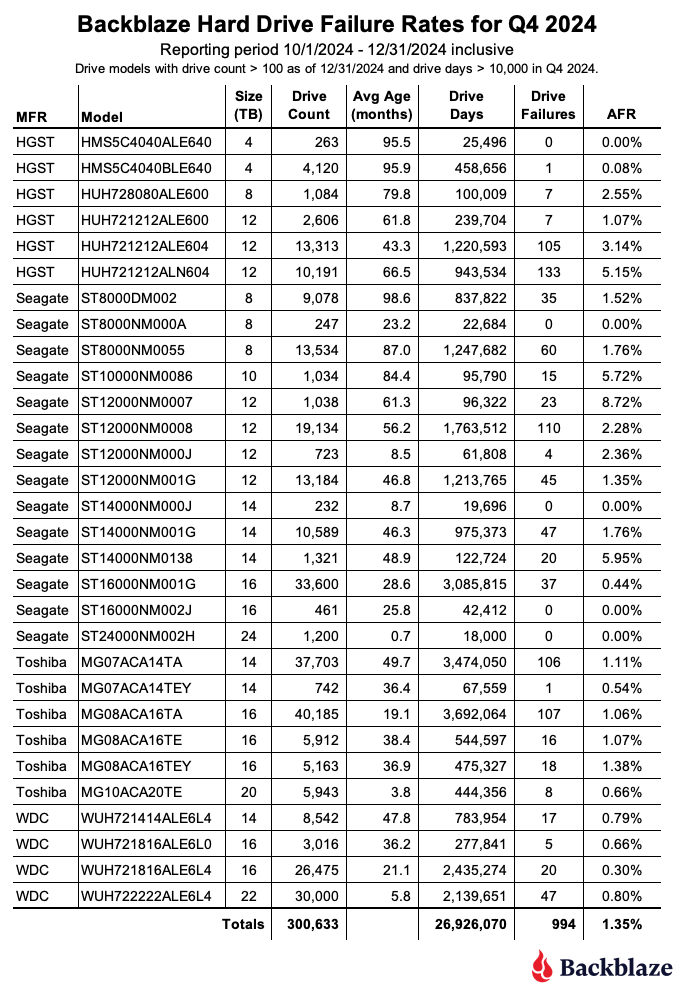
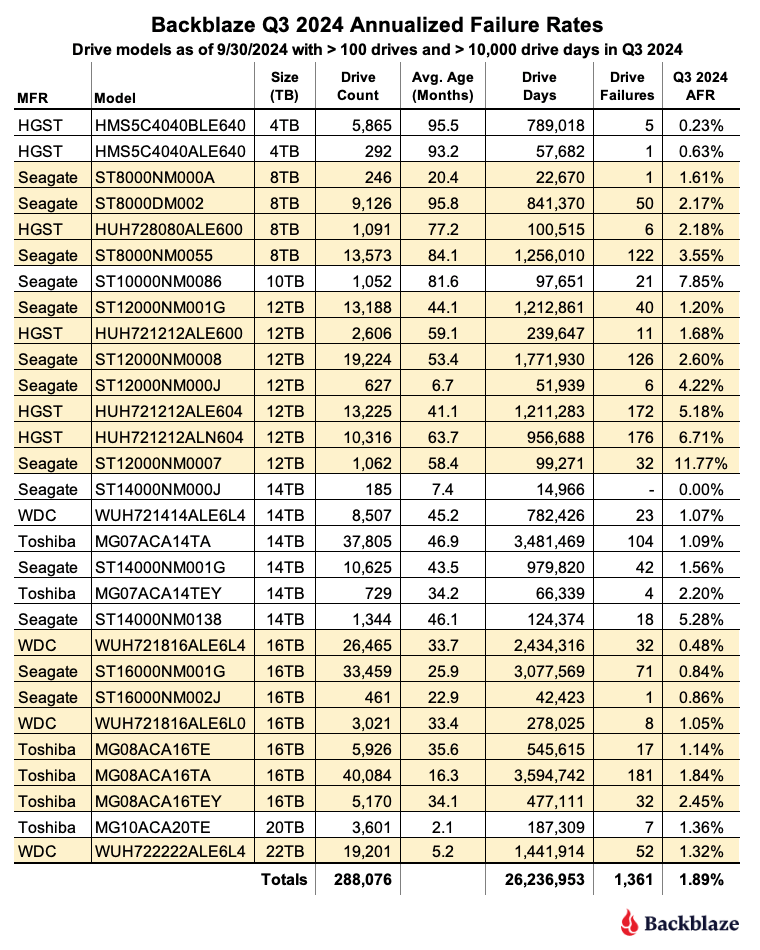
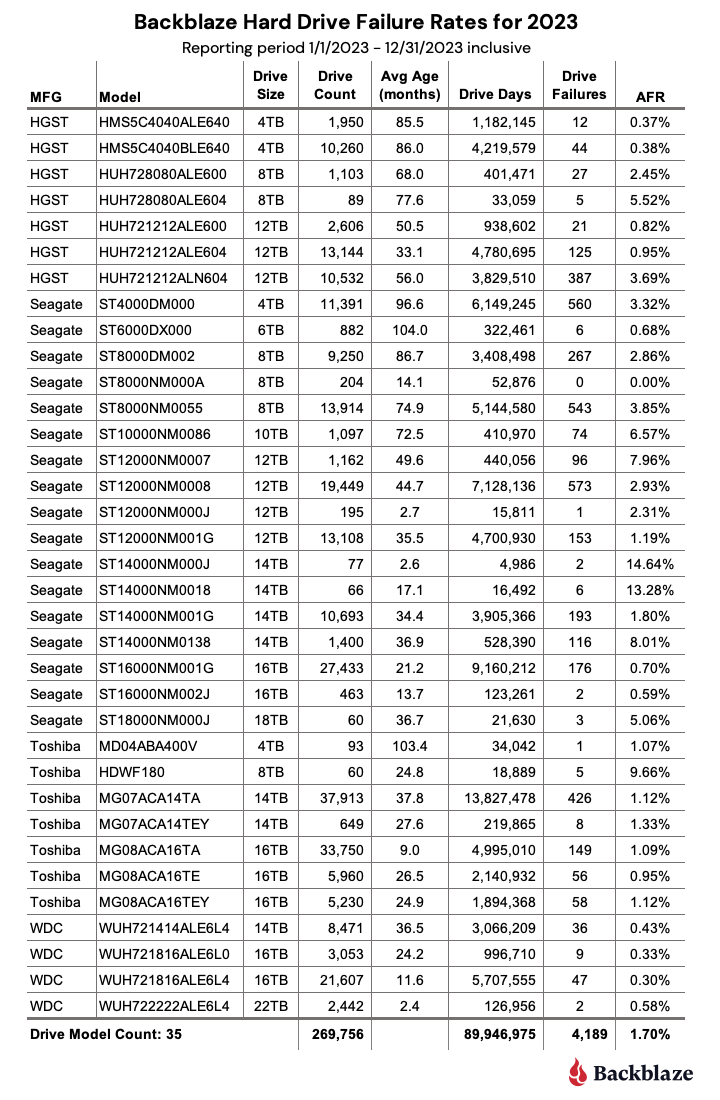
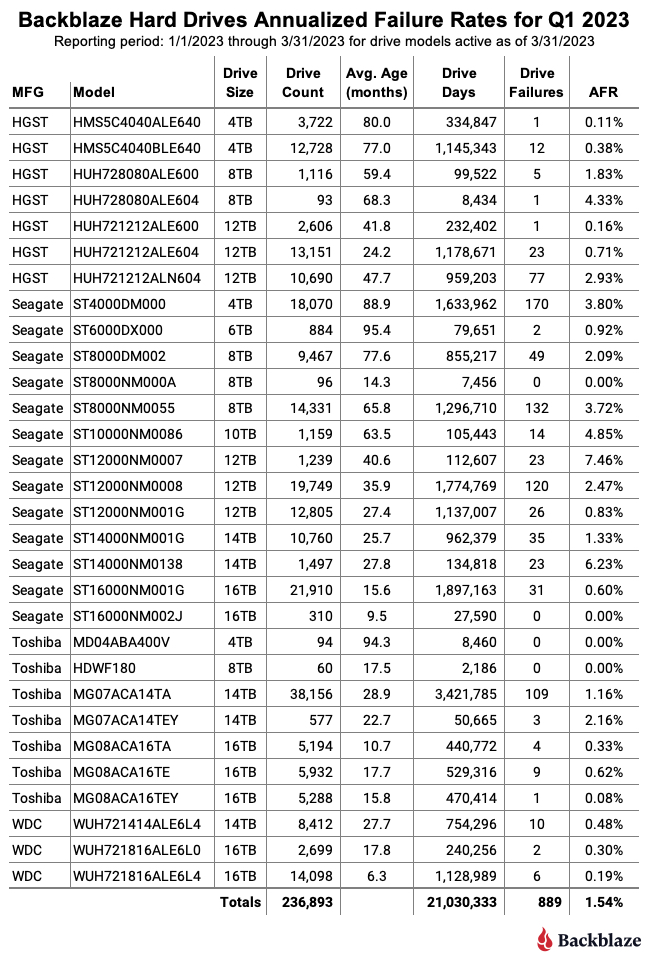
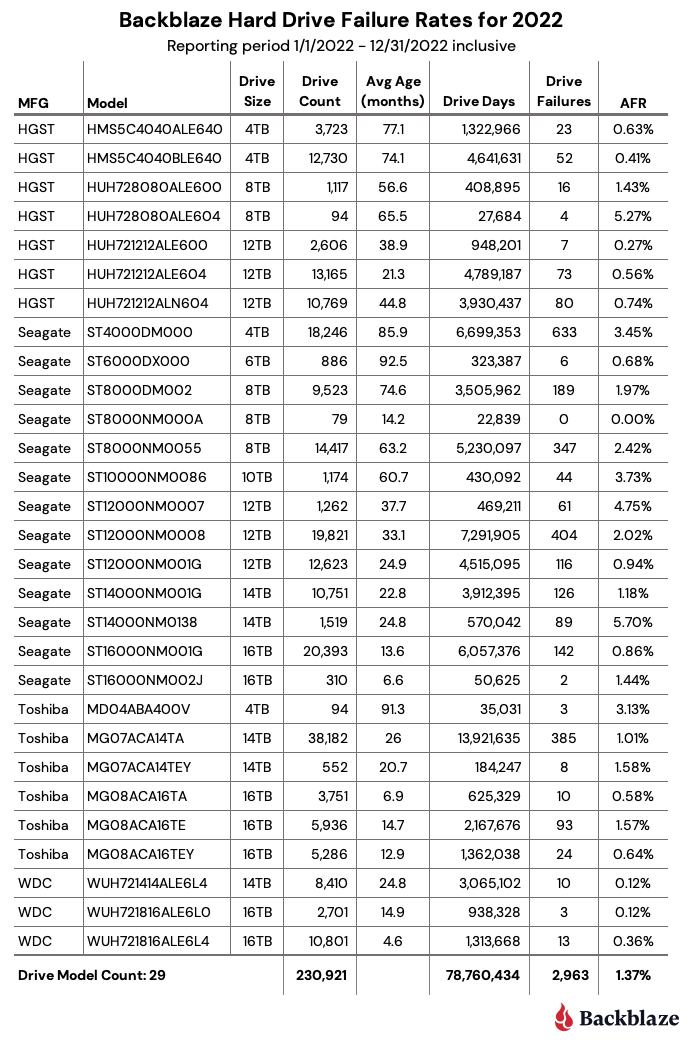
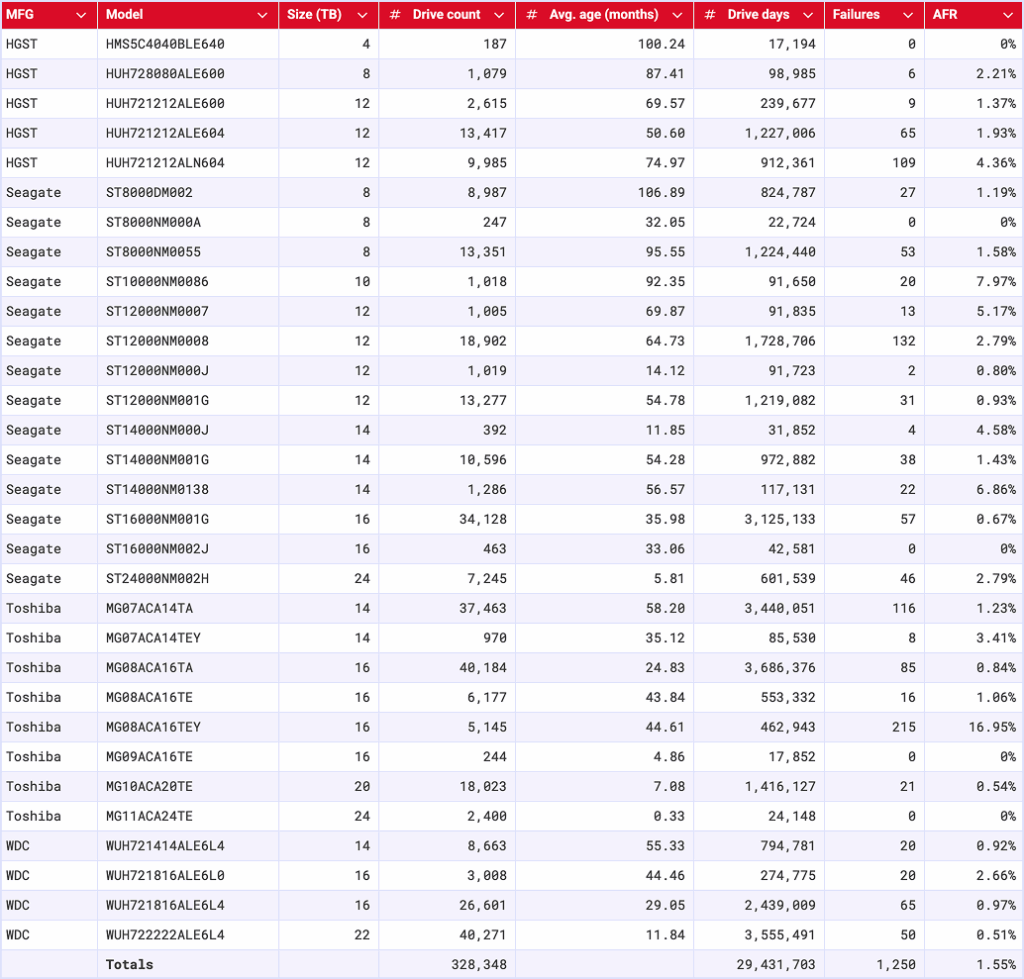
During Q3 2025, we were tracking 328,348 storage drives. Here are the numbers:
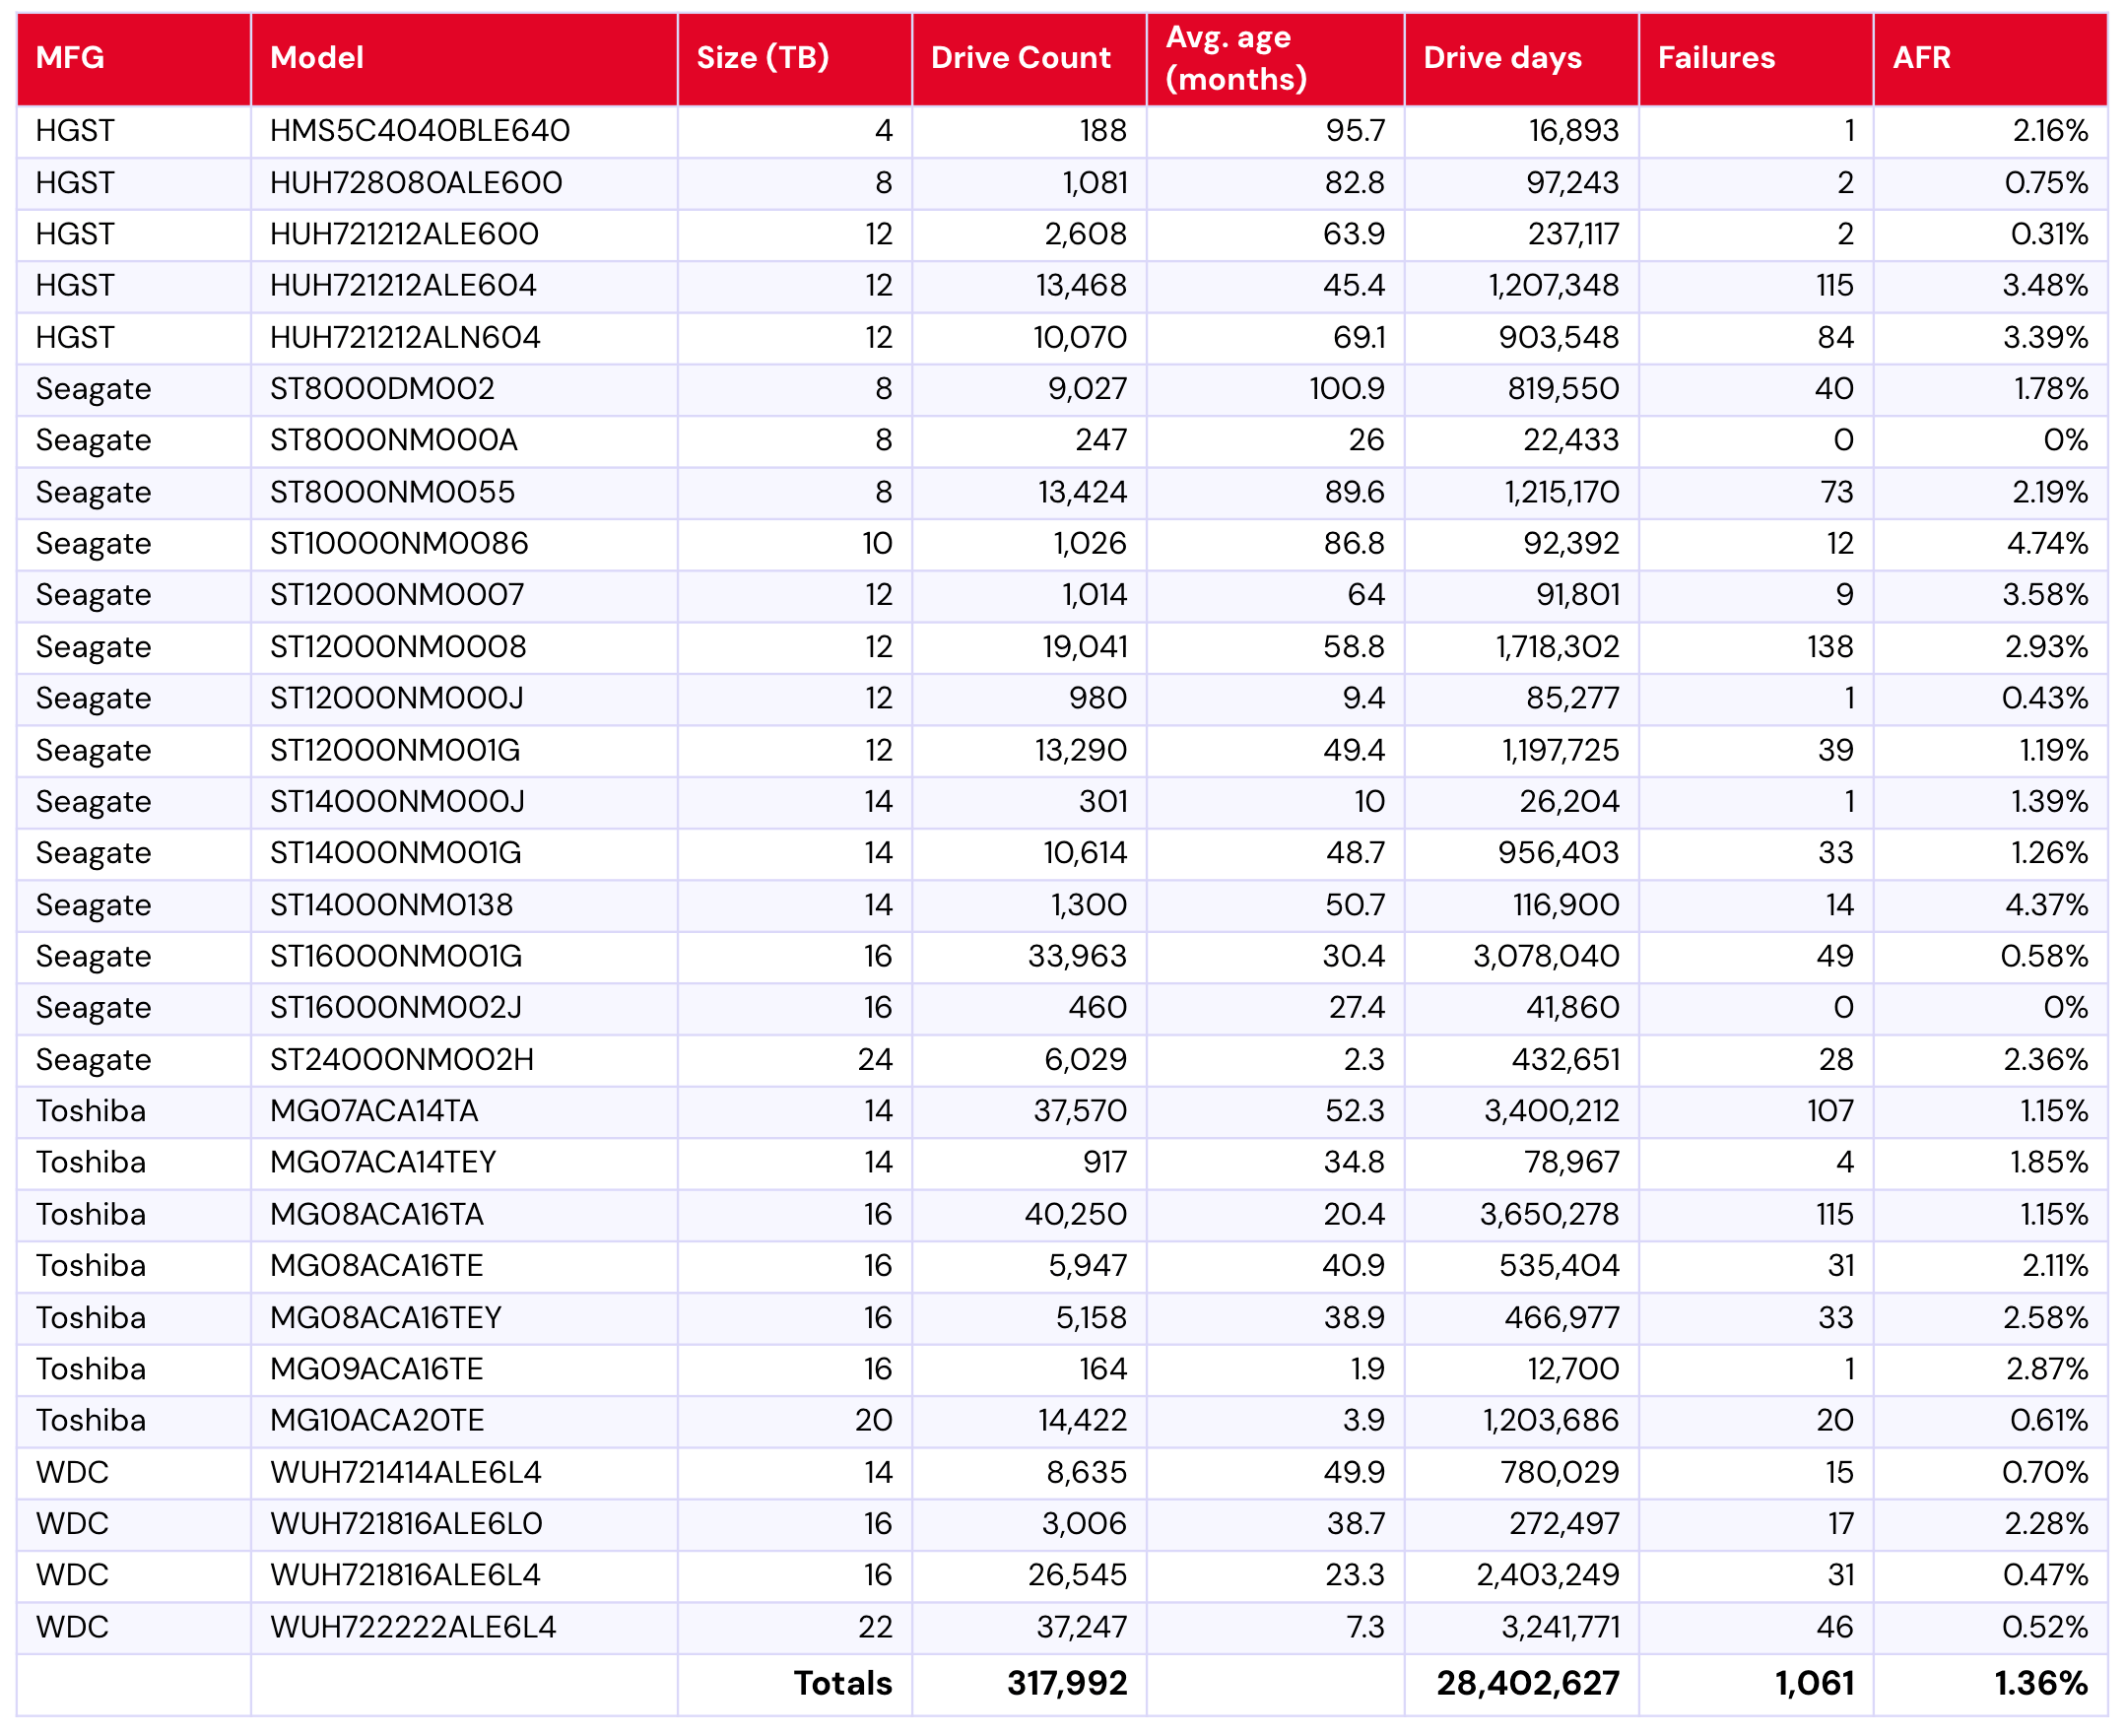
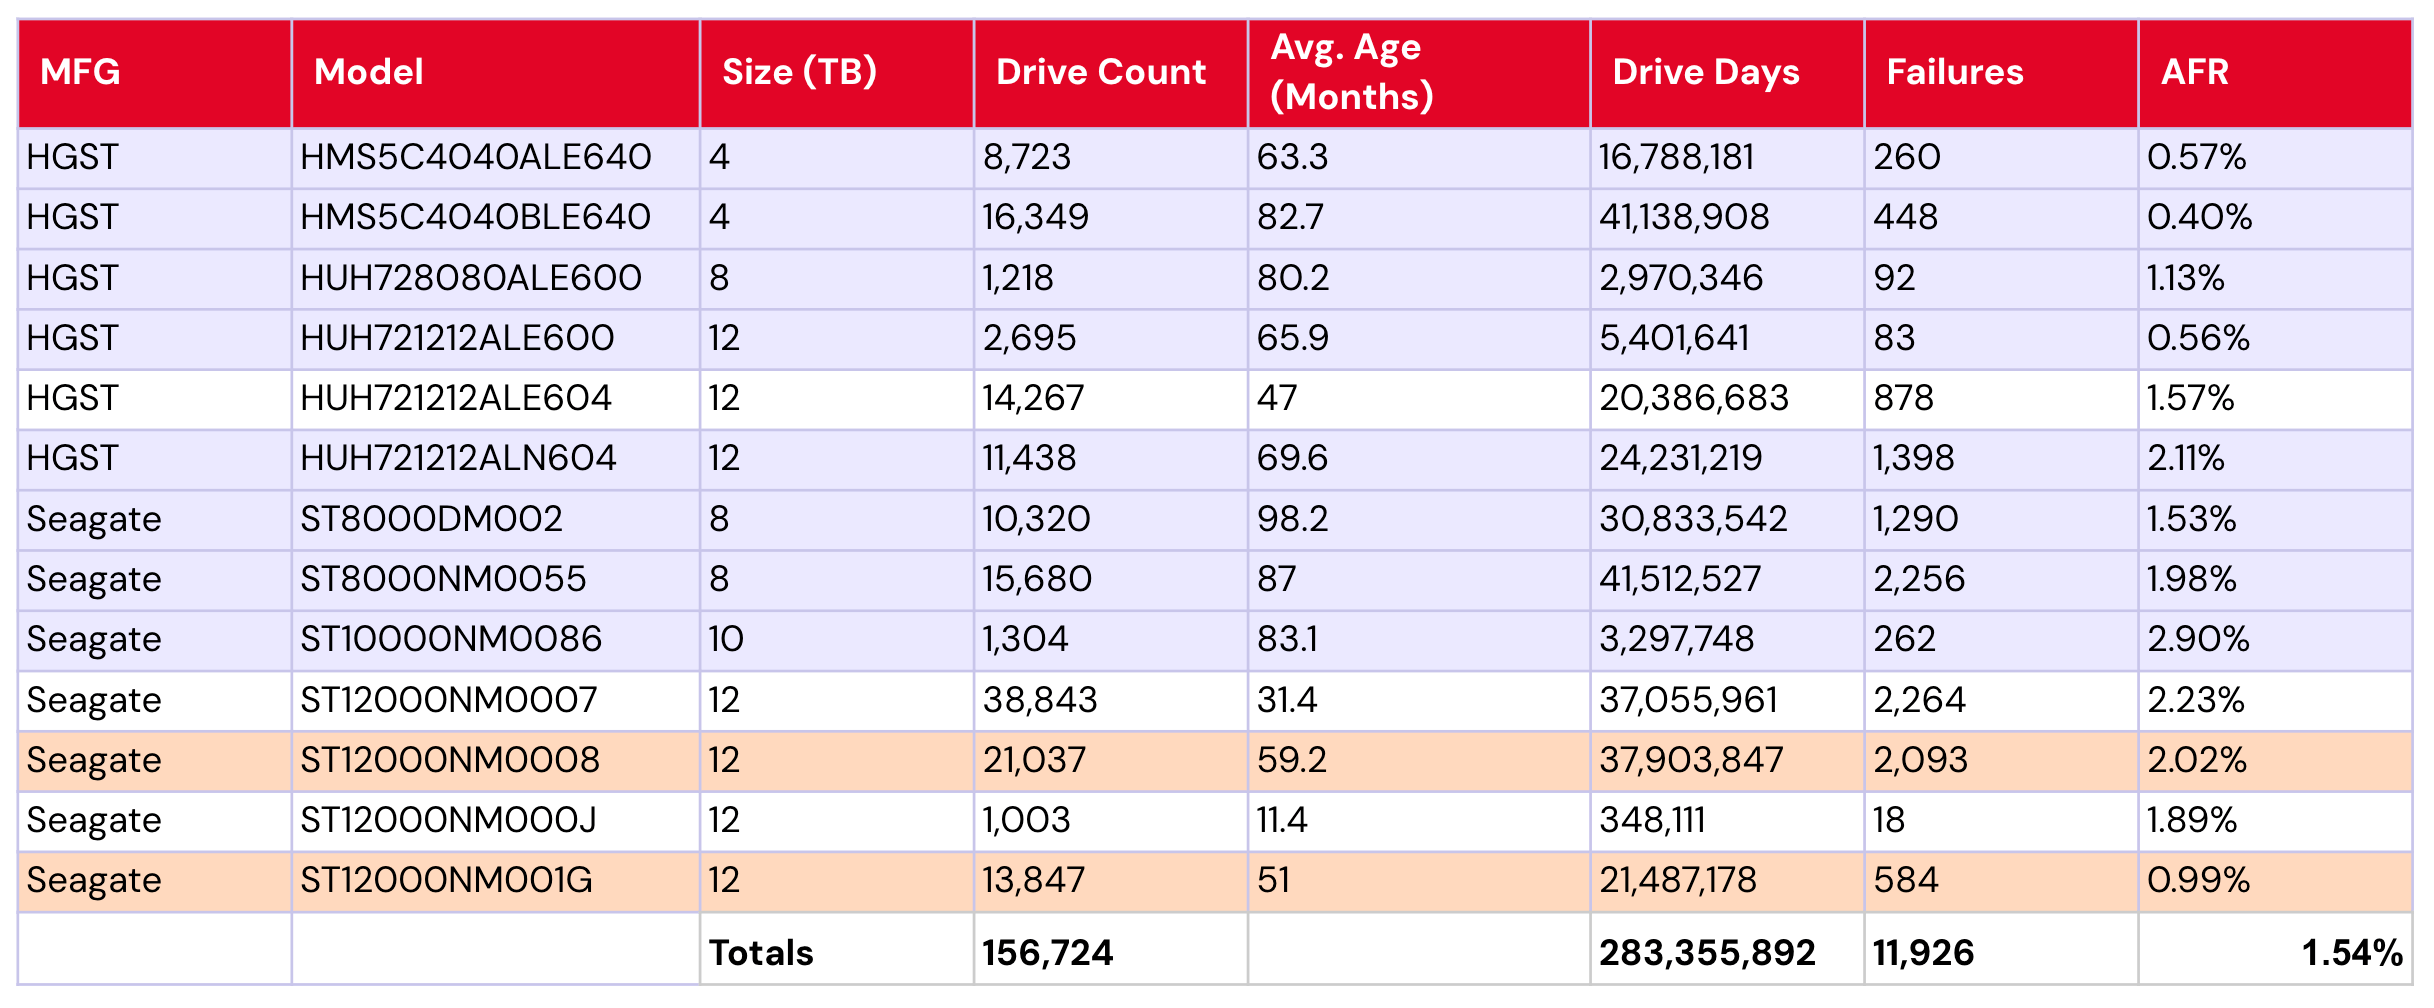
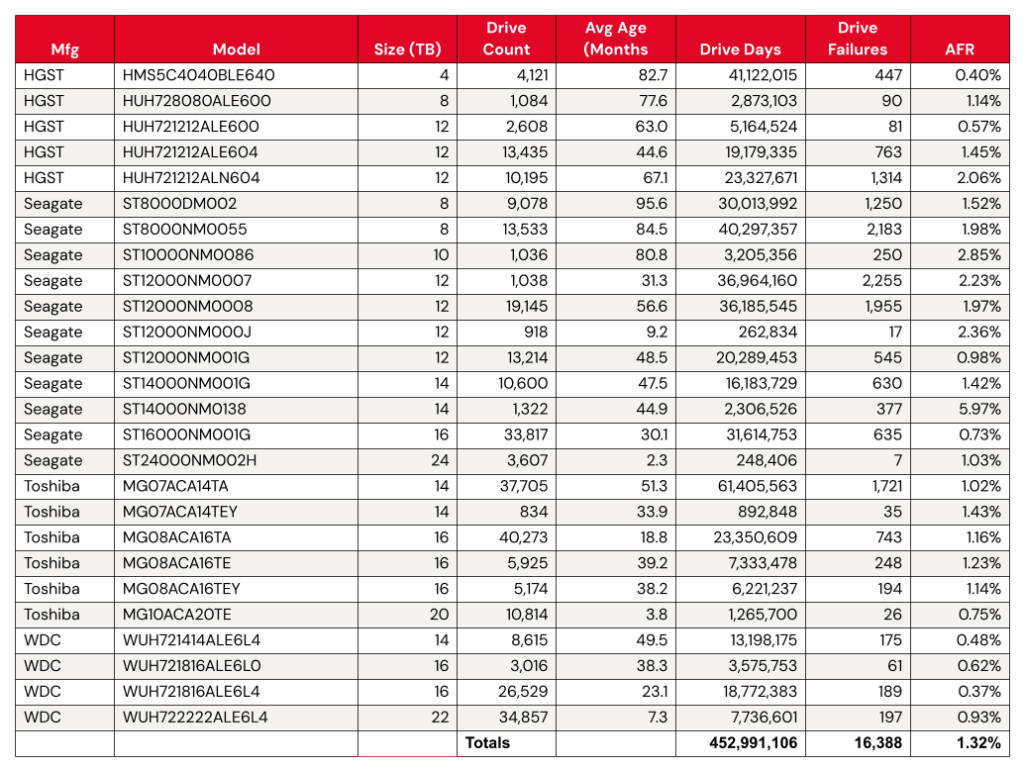
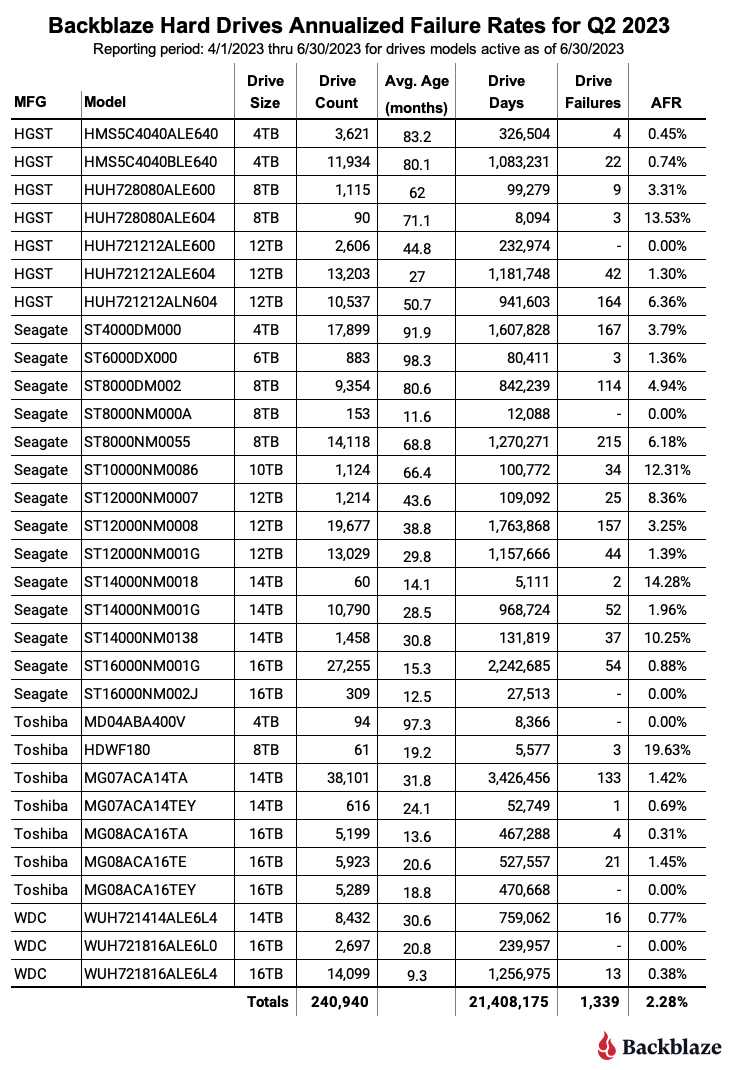
Backblaze Hard Drive Failure Rates for Q3 2025
Reporting period July 1, 2025–September 30, 2025 inclusive
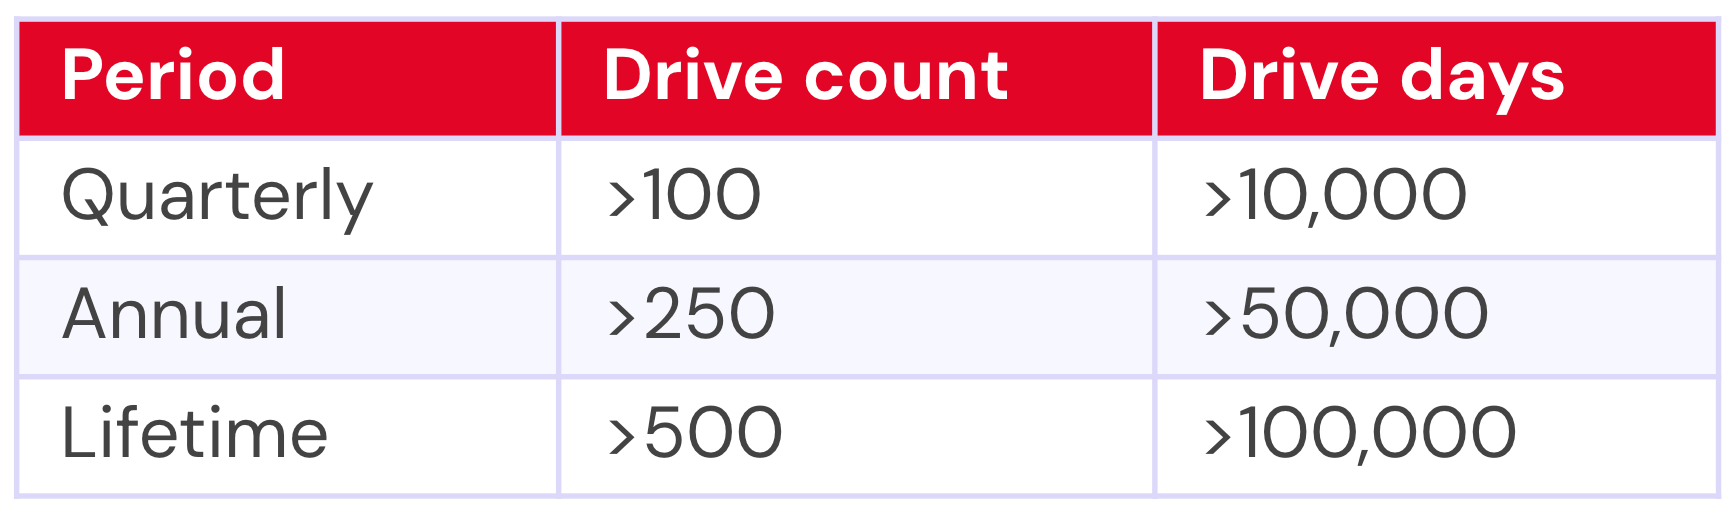
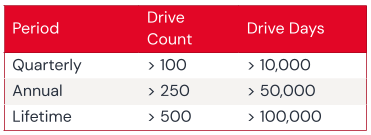
Drive models with drive count > 100 as of July 1, 2025 and drive days > 10,000 in Q3 2025
Notes and observations
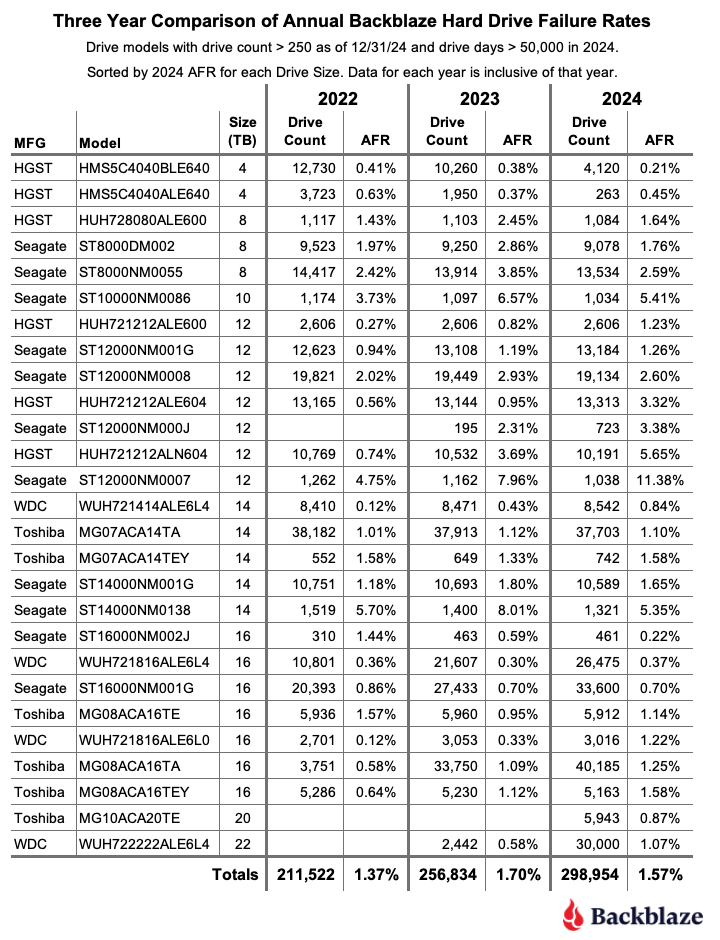
- The failure rate has increased: The failure rate has changed, and by quite a bit. As a reminder, last quarter’s AFR was 1.36% compared with this quarter’s 1.55%. (Interestingly, the 2024 yearly AFR was 1.57%.)
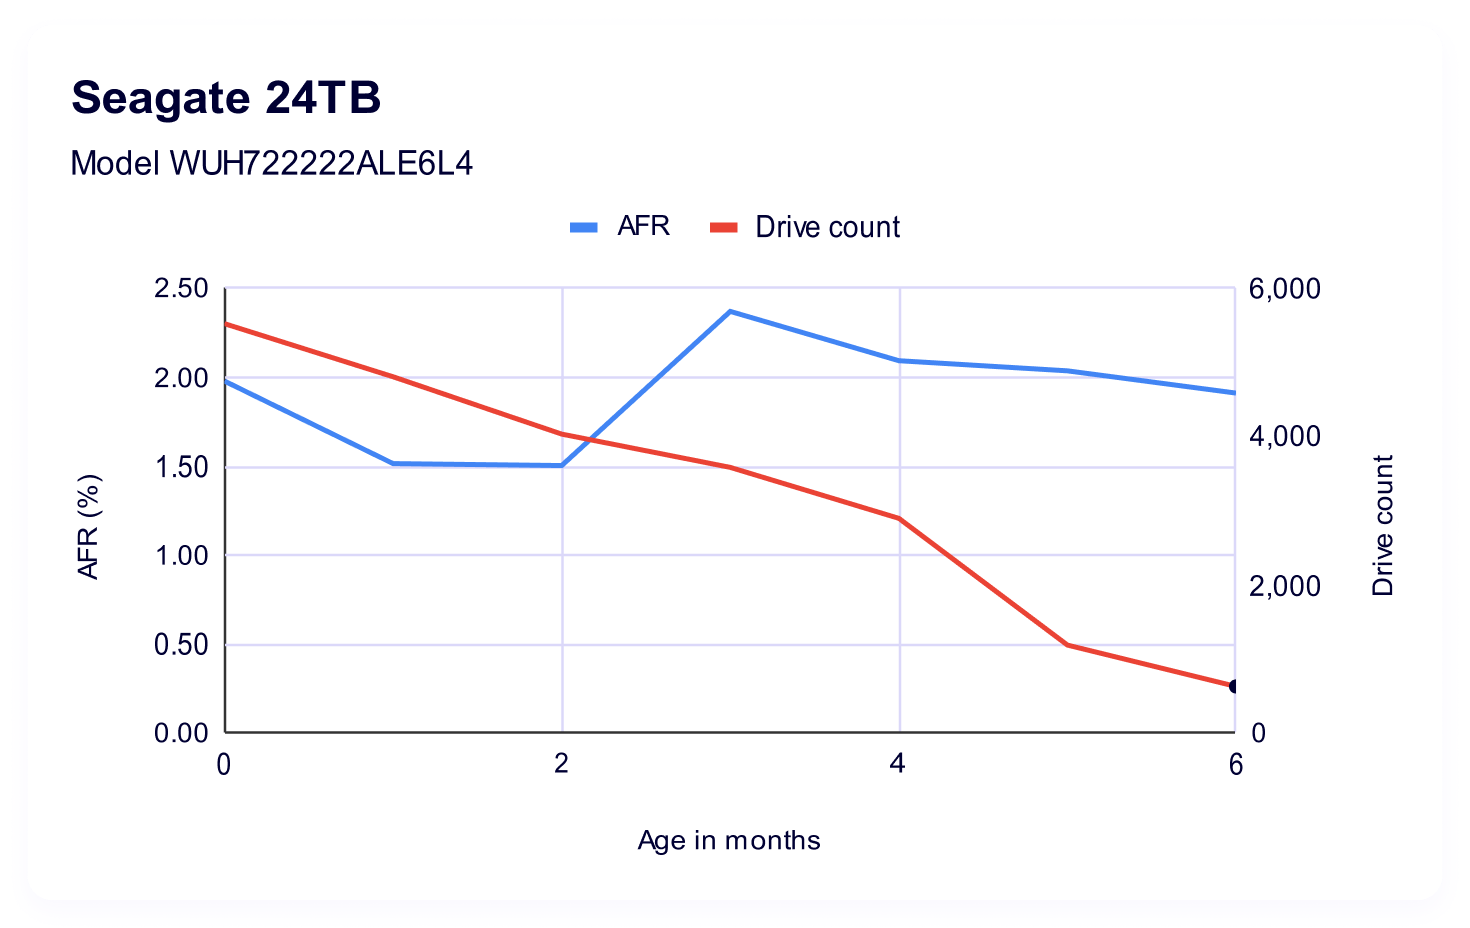
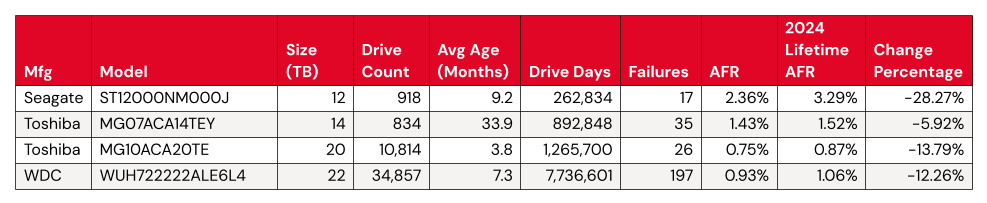
- That new drive energy: Say hello to the 24TB Toshiba MG11ACA24TE, joining the drive pool with 2,400 drives and 24,148 drive days. That means that we’ve hit the thresholds for the quarterly stats, but not the lifetime.
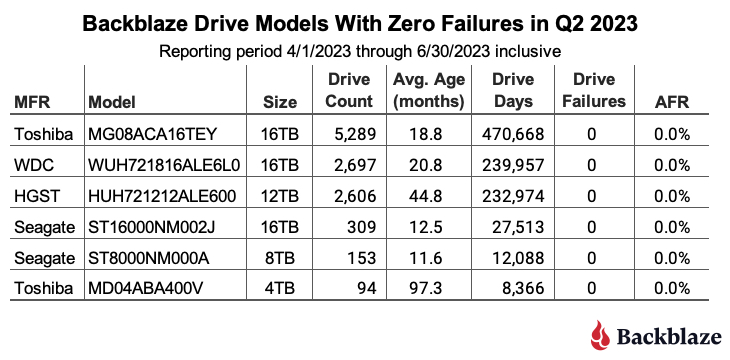
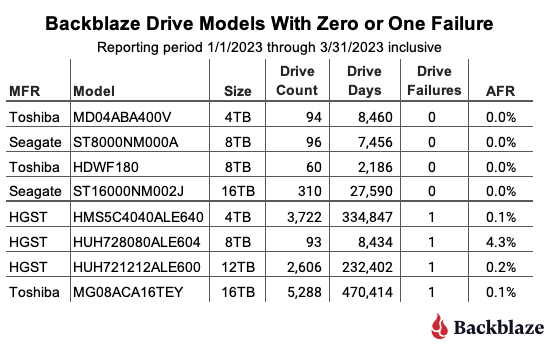
- The zero failure club: It was a big month for the zero failure club, with four drives making the cut:
- Seagate HMS5C4040BLE640 (4TB)
- Seagate ST8000NM000A (8TB)
- Toshiba MG09ACA16TE (16TB)
- Toshiba MG11ACA24TE (24TB)—and yes, that’s the new drive.
For those of you tracking the stats closely, you’ll notice that the Seagate ST8000NM000A (8TB) is a frequent flier on this list. The last time it had a failure was in Q3 2024—and it was just a single failure for the whole quarter!
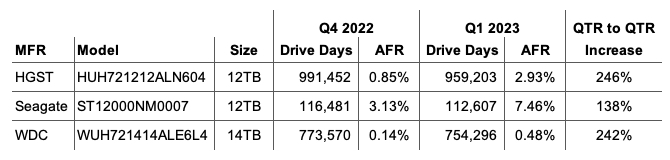
- The highest AFRs were really high: The high end was so high that this month, it inspired us to run an outlier analysis using the standard quartile analysis (Tukey method). Based on that information, any drive with a quarterly AFR higher than 5.88% is an outlier, and there are three:
- Seagate ST10000NM0086 (10TB): 7.97%
- Seagate ST14000NM0138 (14TB): 6.86%
- Toshiba MG08ACA16TEY (16TB): 16.95%
What’s going on there? Great question, and we’ll get into that after the lifetime failure rates.
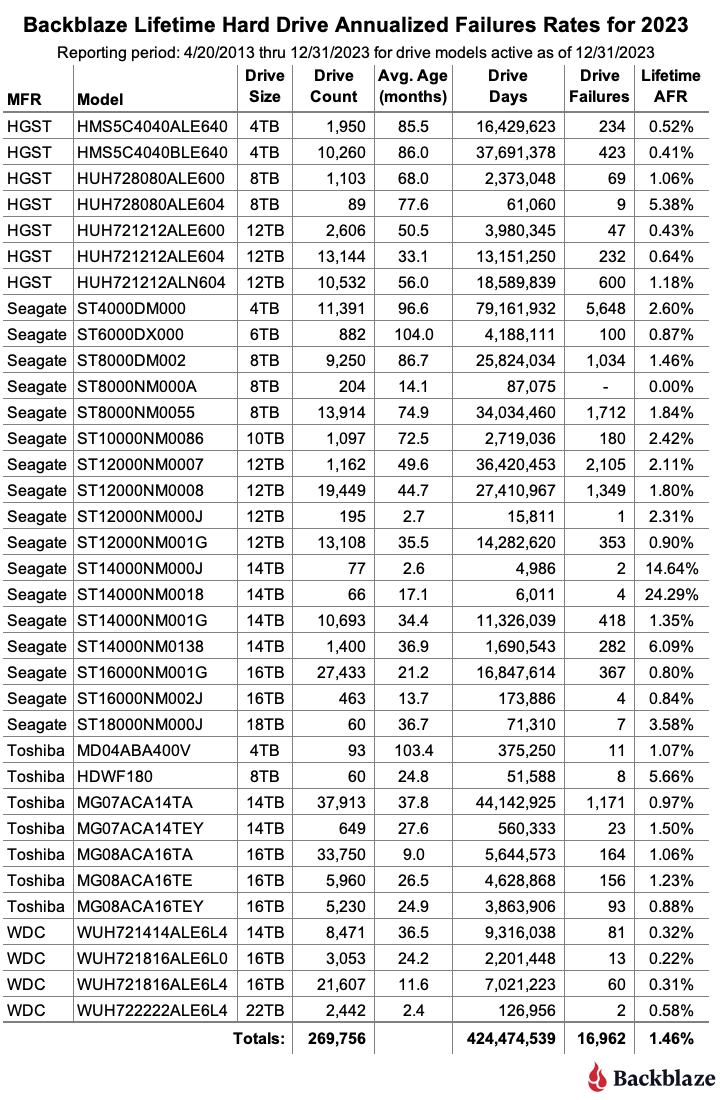
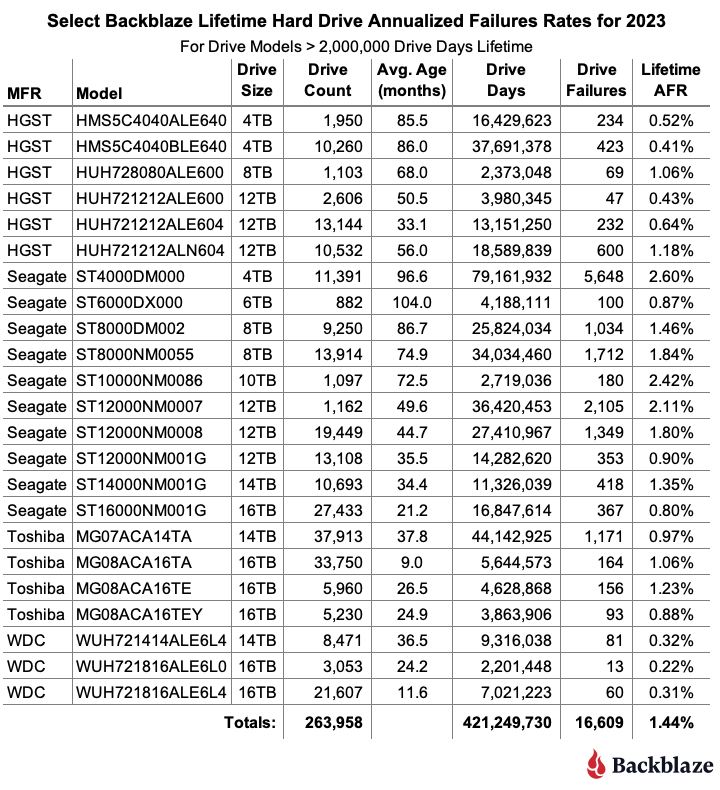
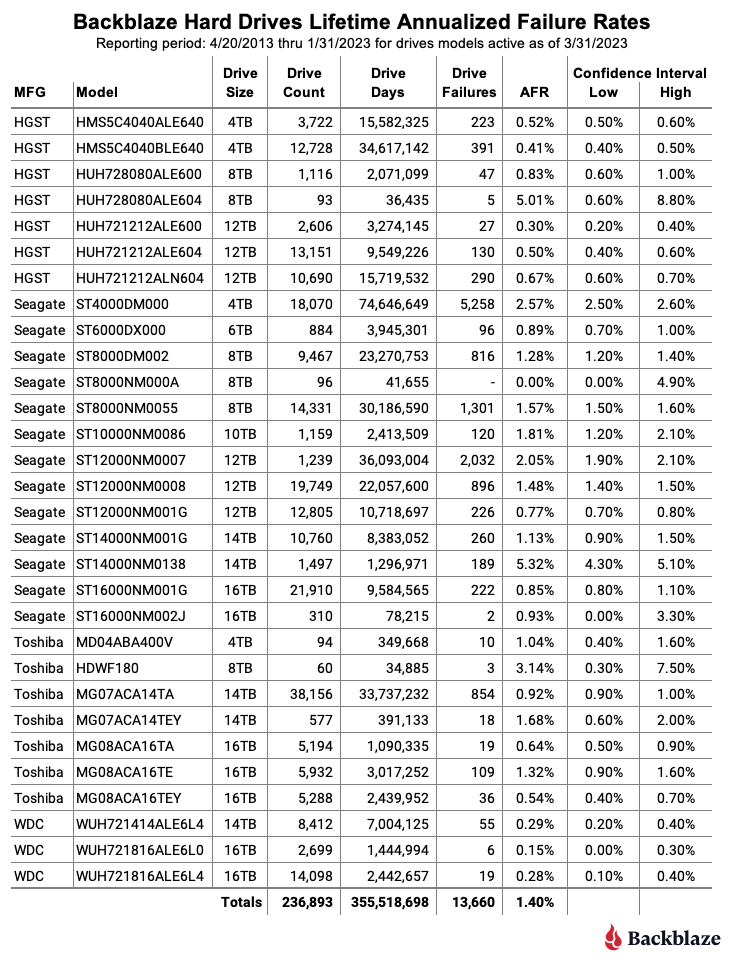
Lifetime hard drive failure rates
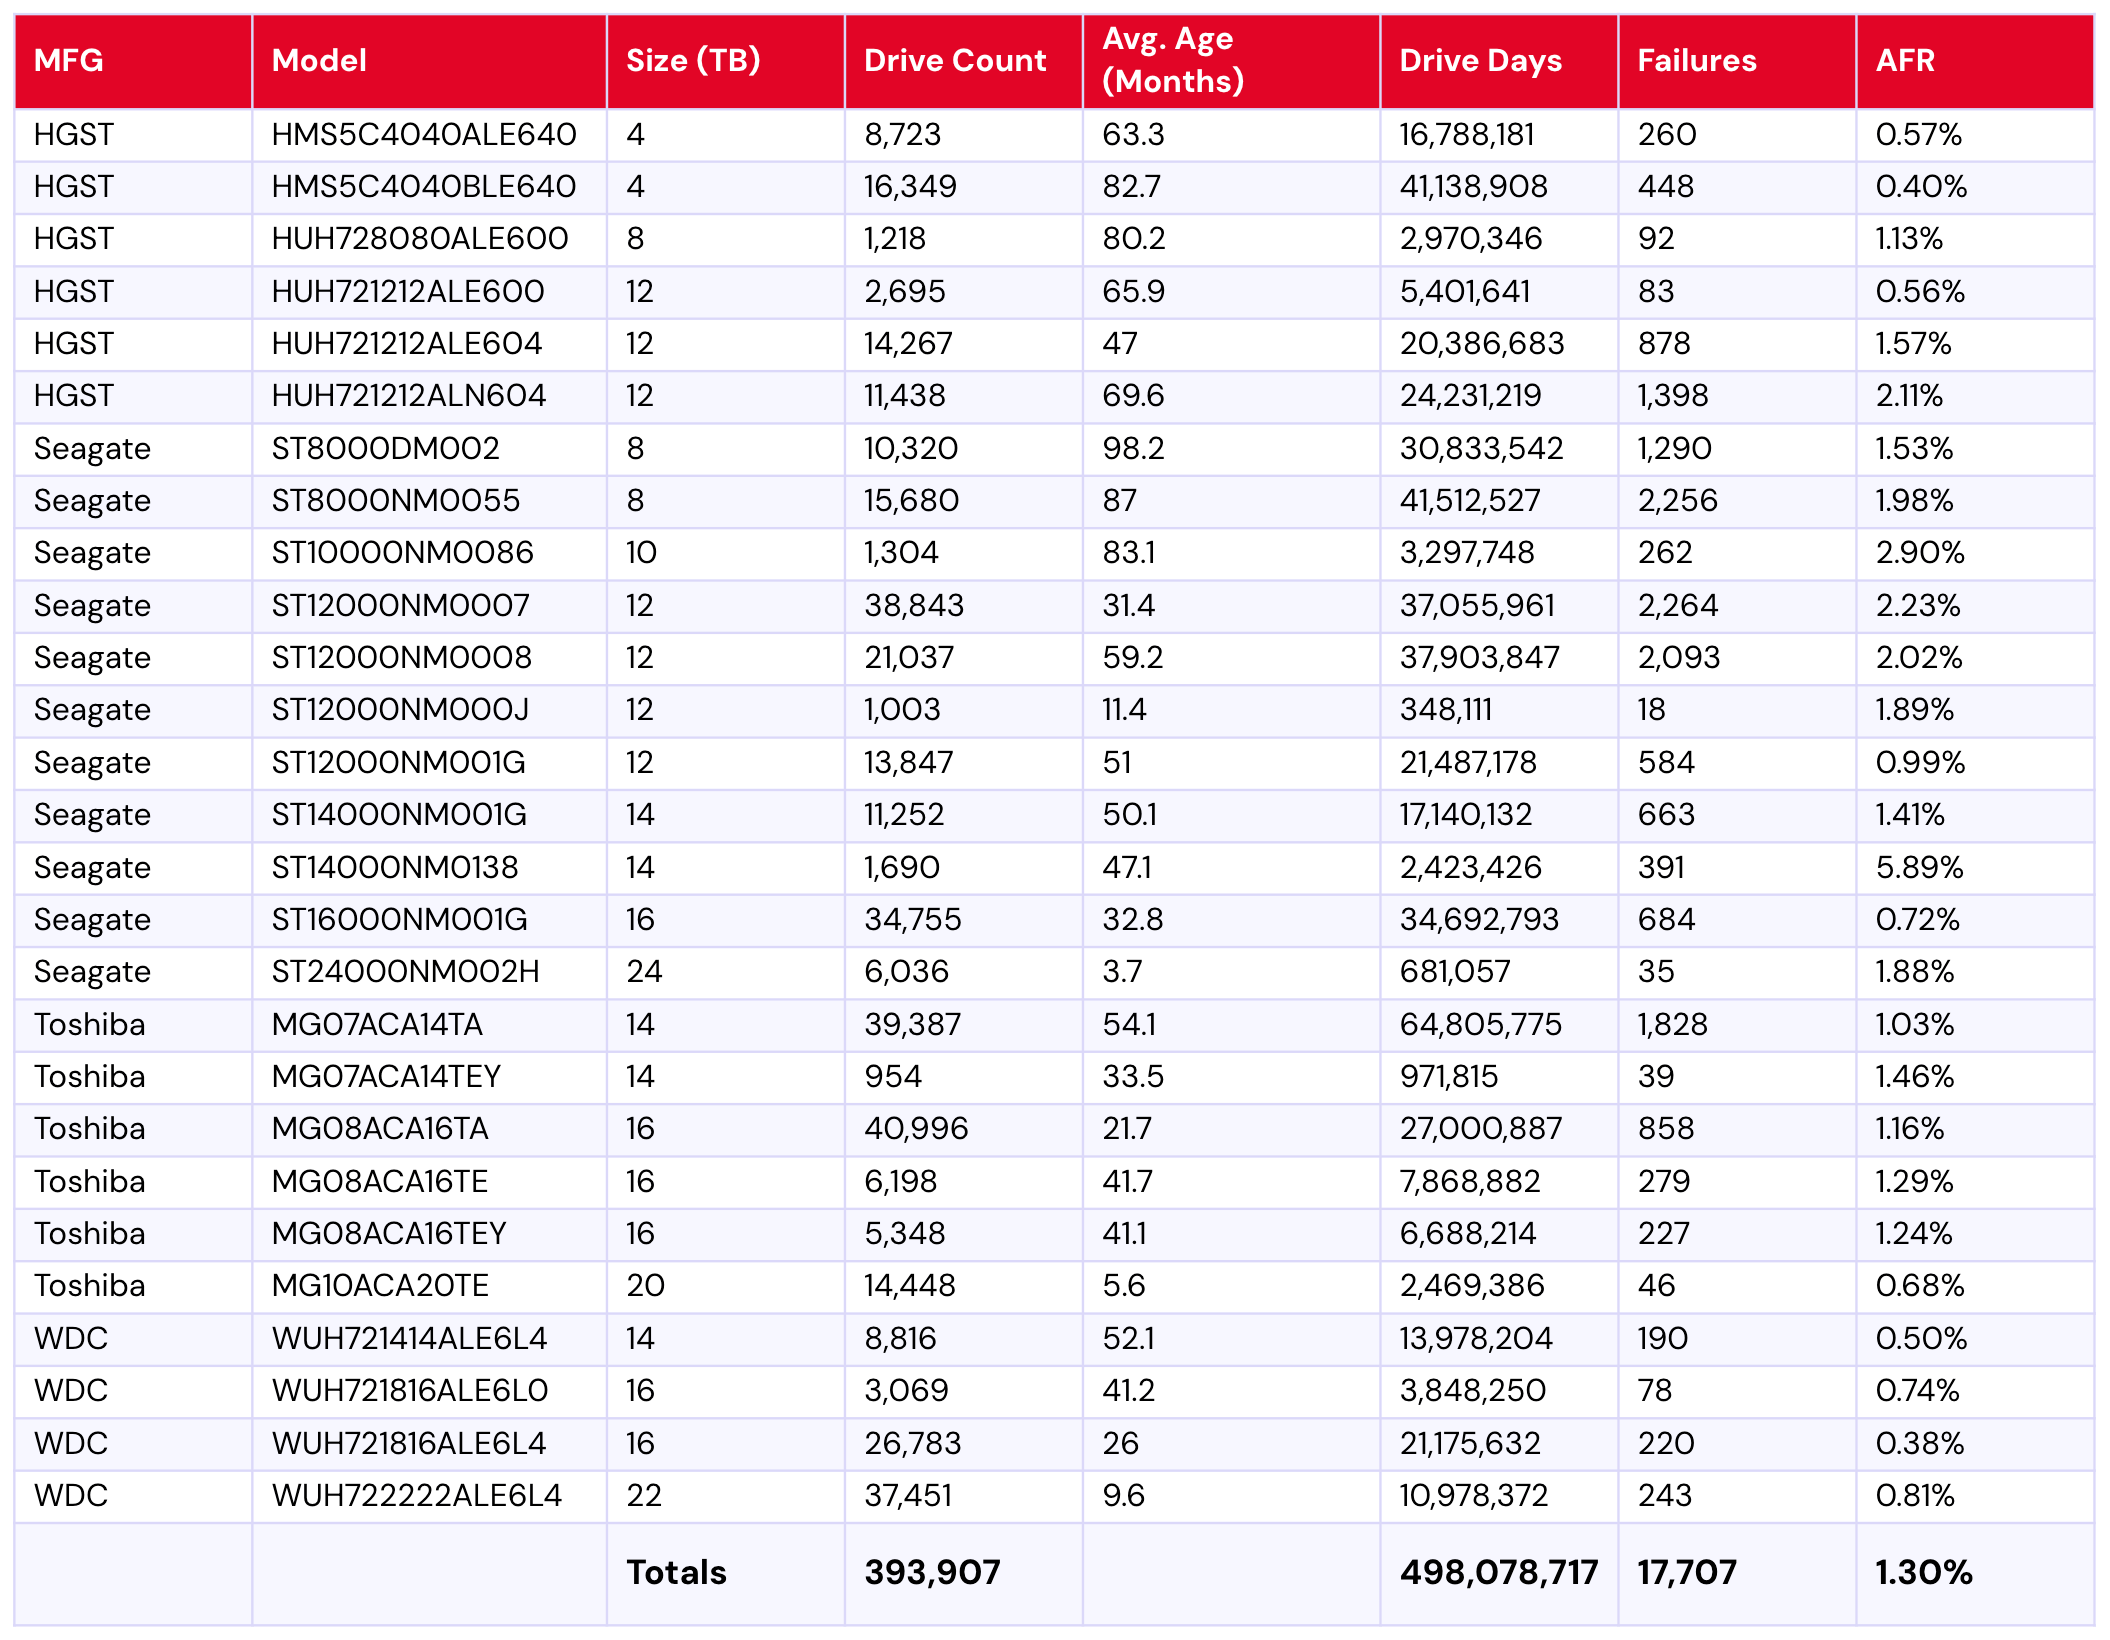
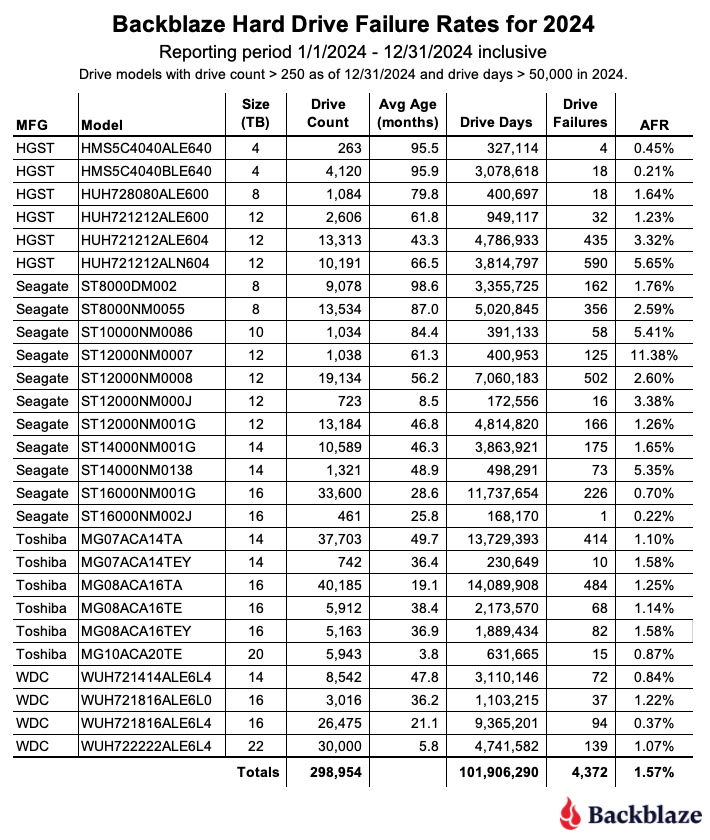
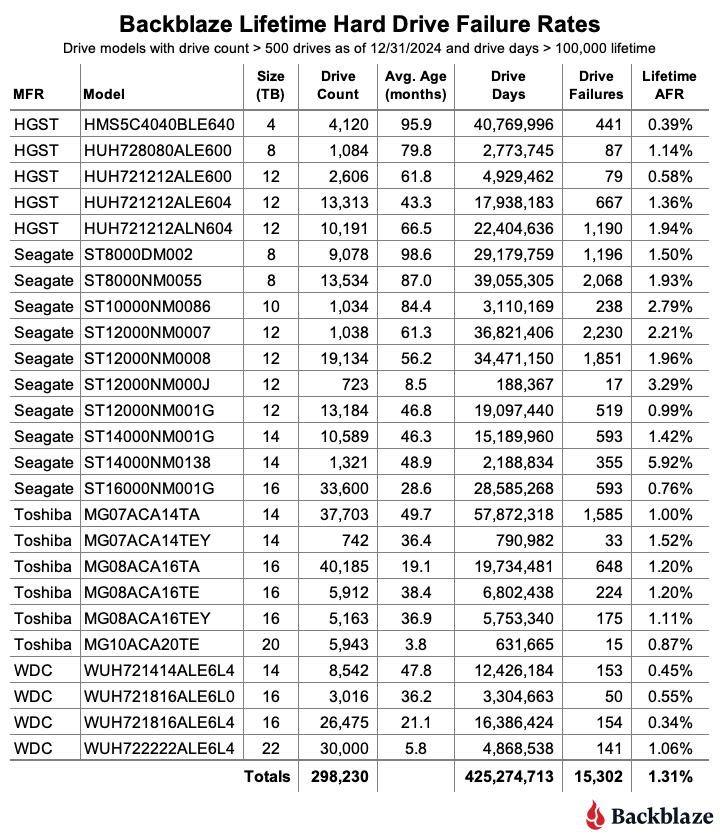
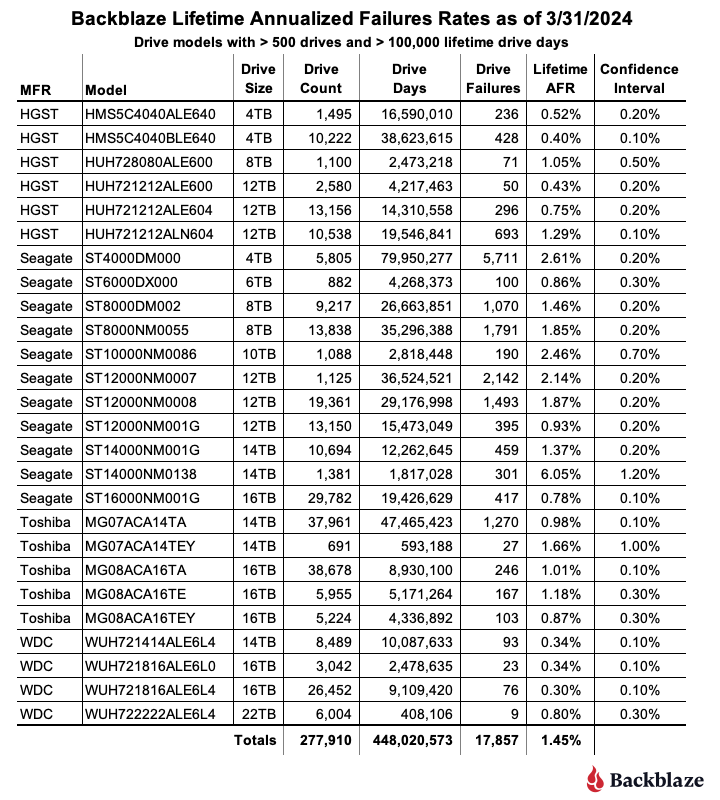
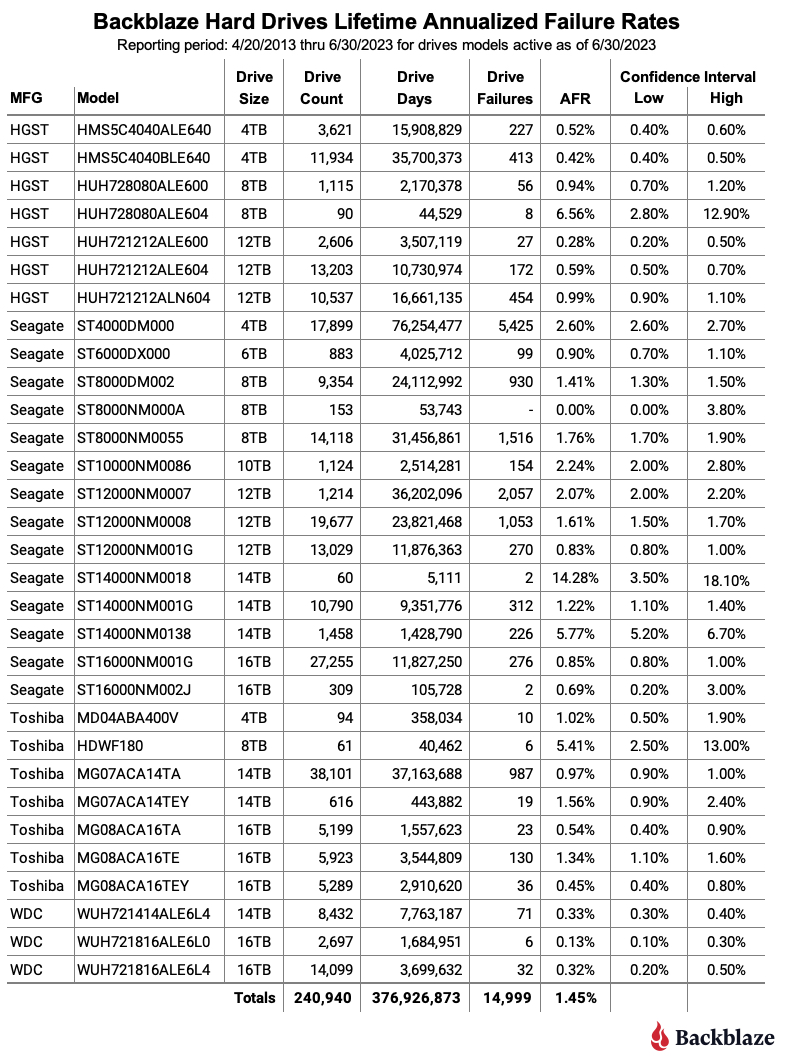
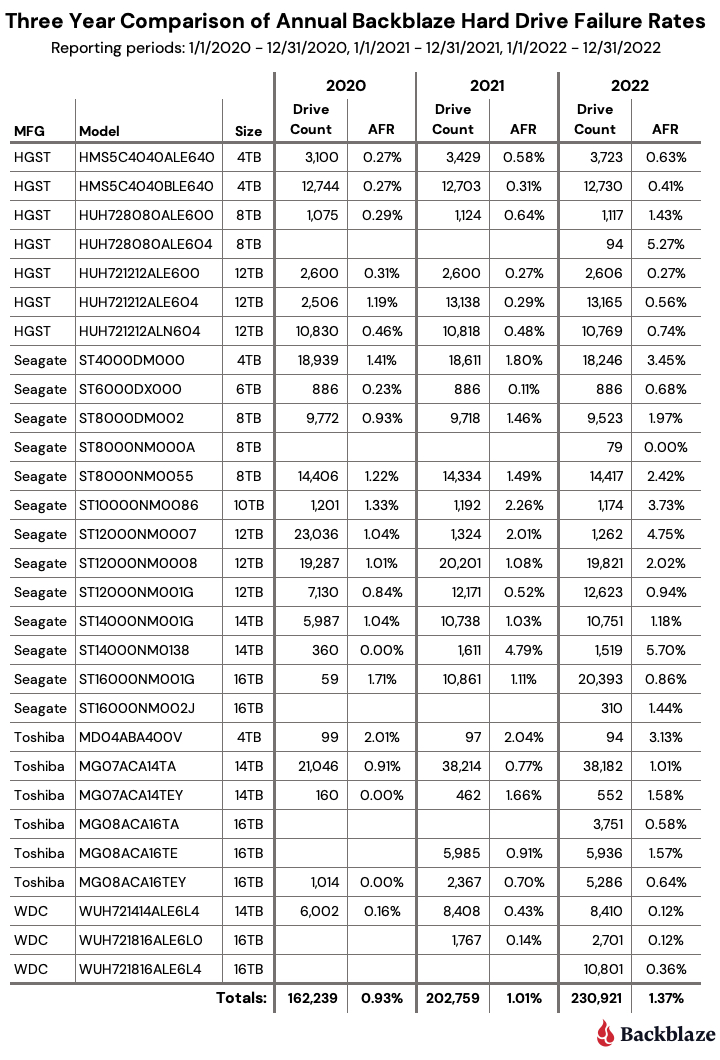
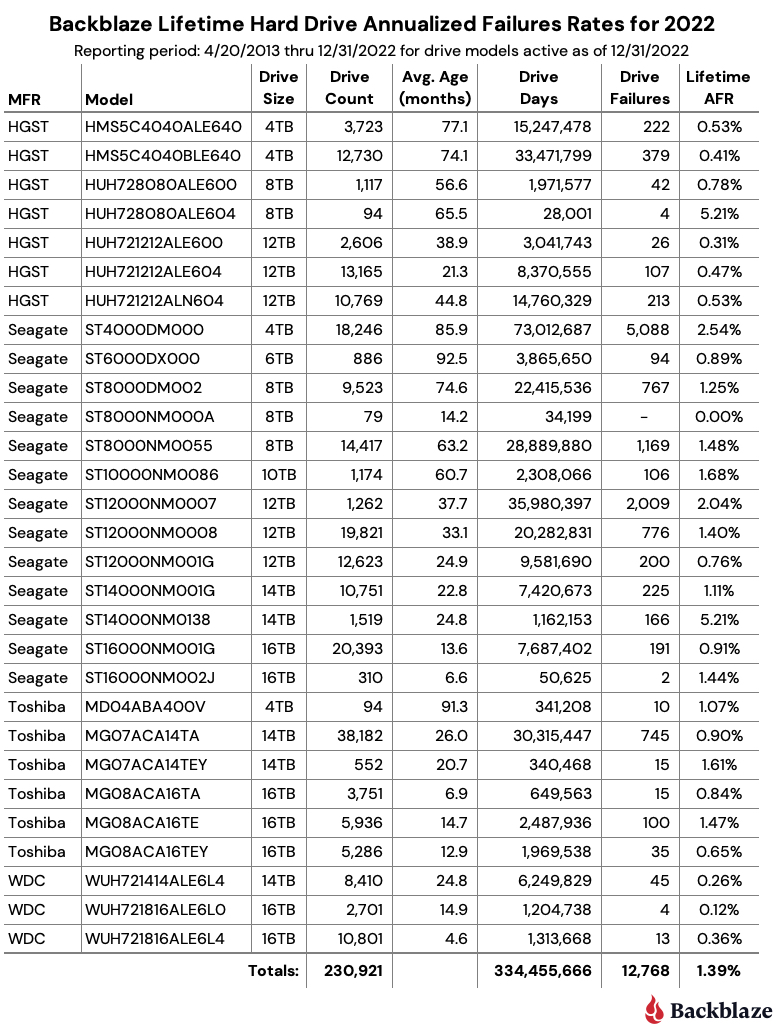
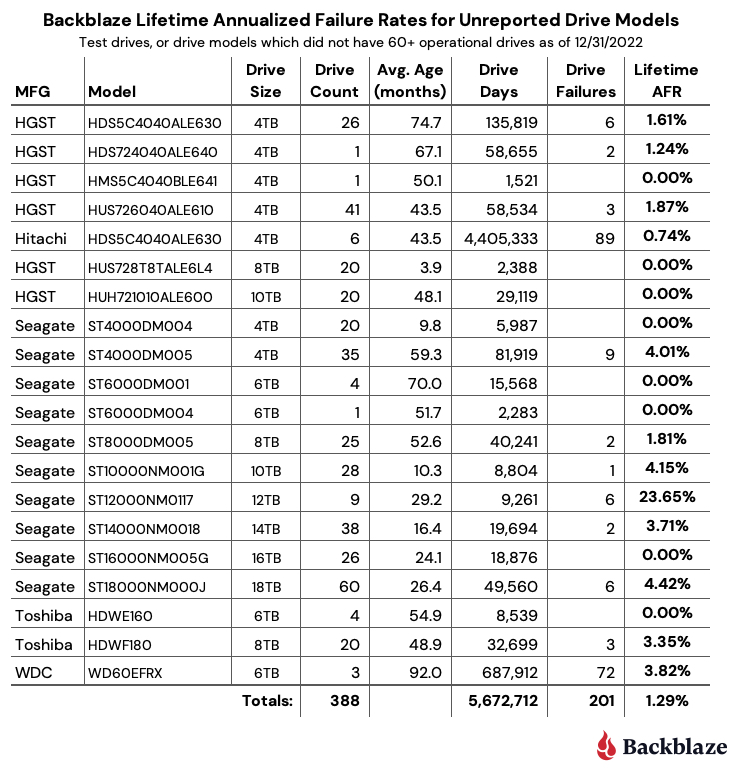
To be considered for the lifetime review, a drive model was required to have 500 or more drives as of the end of Q2 2025 and have over 100,000 accumulated drive days during their lifetime. When we removed those drive models which did not meet the lifetime criteria, we had drives grouped into 27 models remaining for analysis as shown in the table below.
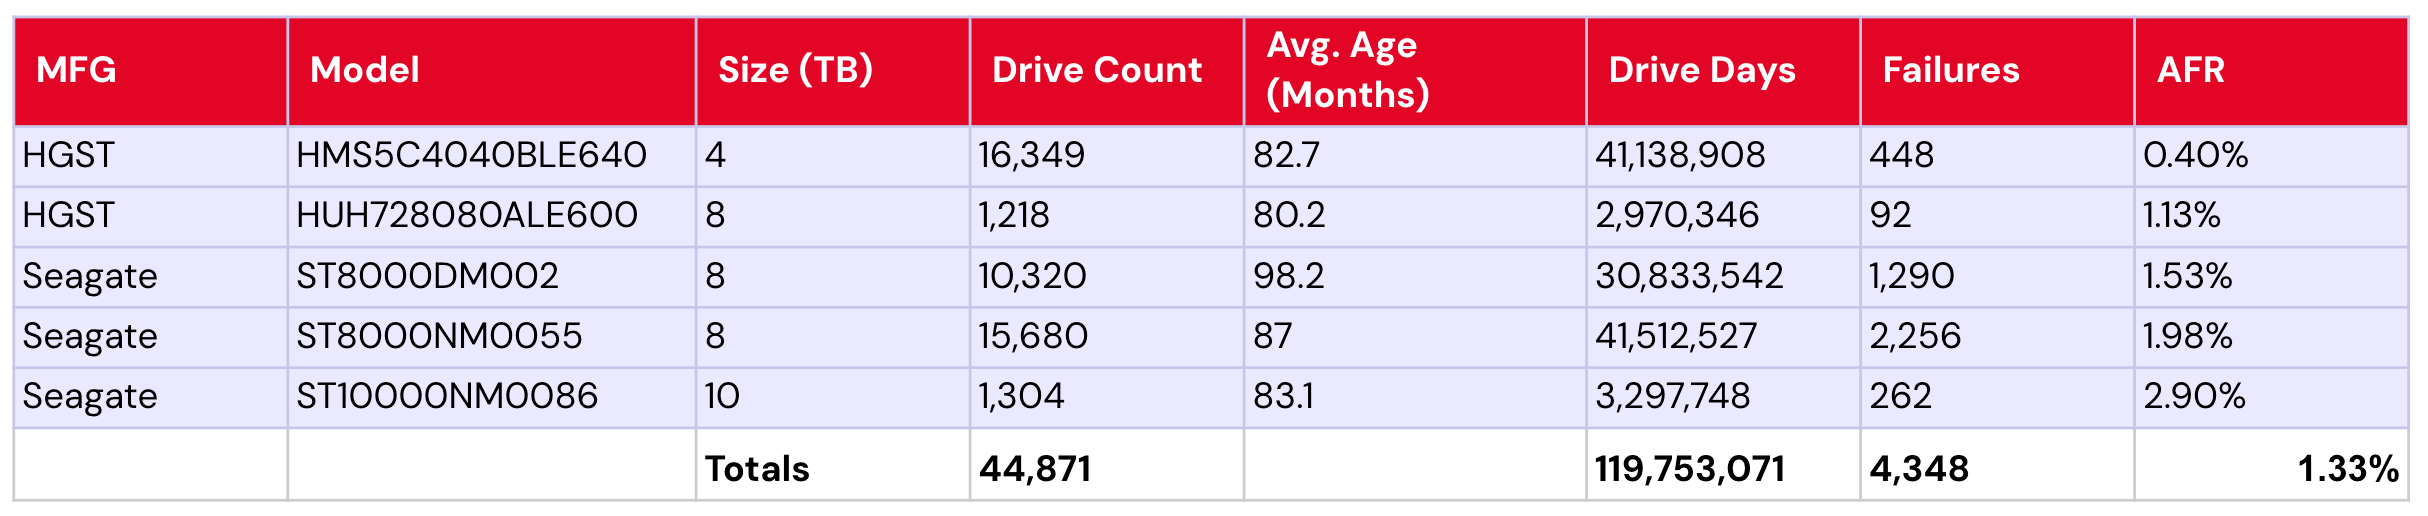
Backblaze Hard Drive Failure Rates for Q2 2025
Reporting period ending September 30, 2025
Drive models > 500 drives and > 100,000 lifetime drive days

Notes and observations
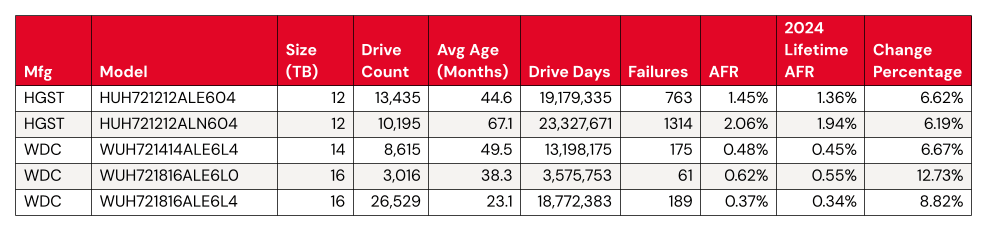
- That lifetime AFR is pretty consistent, isn’t it? The lifetime AFR is 1.31%. Last quarter we reported that it was 1.30%, and the quarter before that, it was 1.31%.
- The 4TB average age hasn’t shifted: As we’ve reported on previously, the 4TB drives are being decommissioned over time. Now, we’re down to just a handful left—just 11 of the ALE models and 187 of the BLE models. But, because their lifetime populations are so comparatively large, the additional drive days aren’t enough to move the needle on the average age in months. So, no ghosts in the machine here, and decommissioning is proceeding as planned.
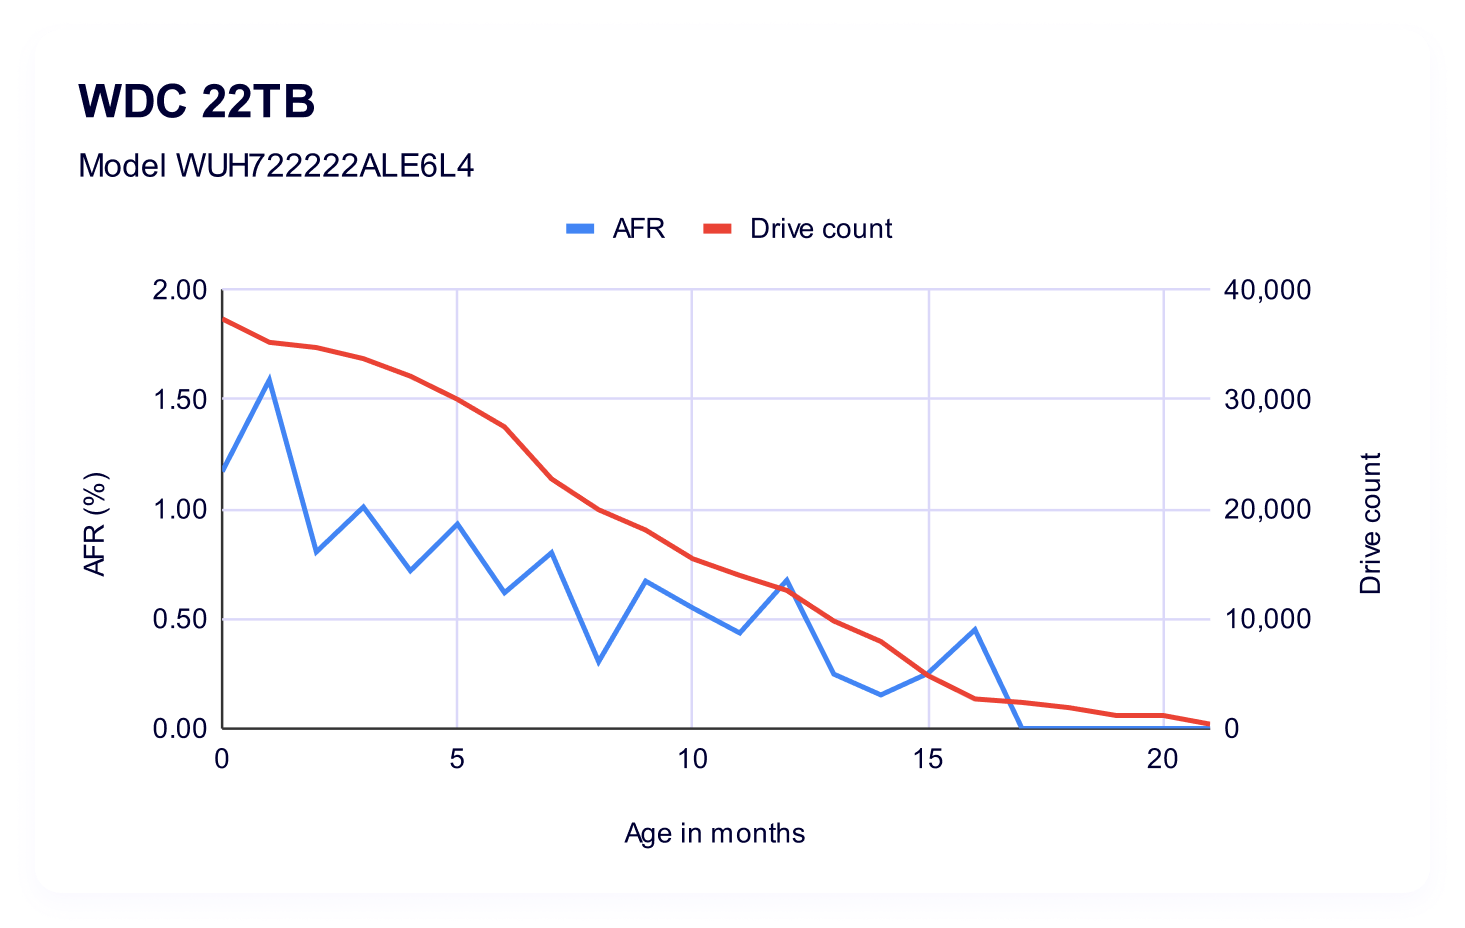
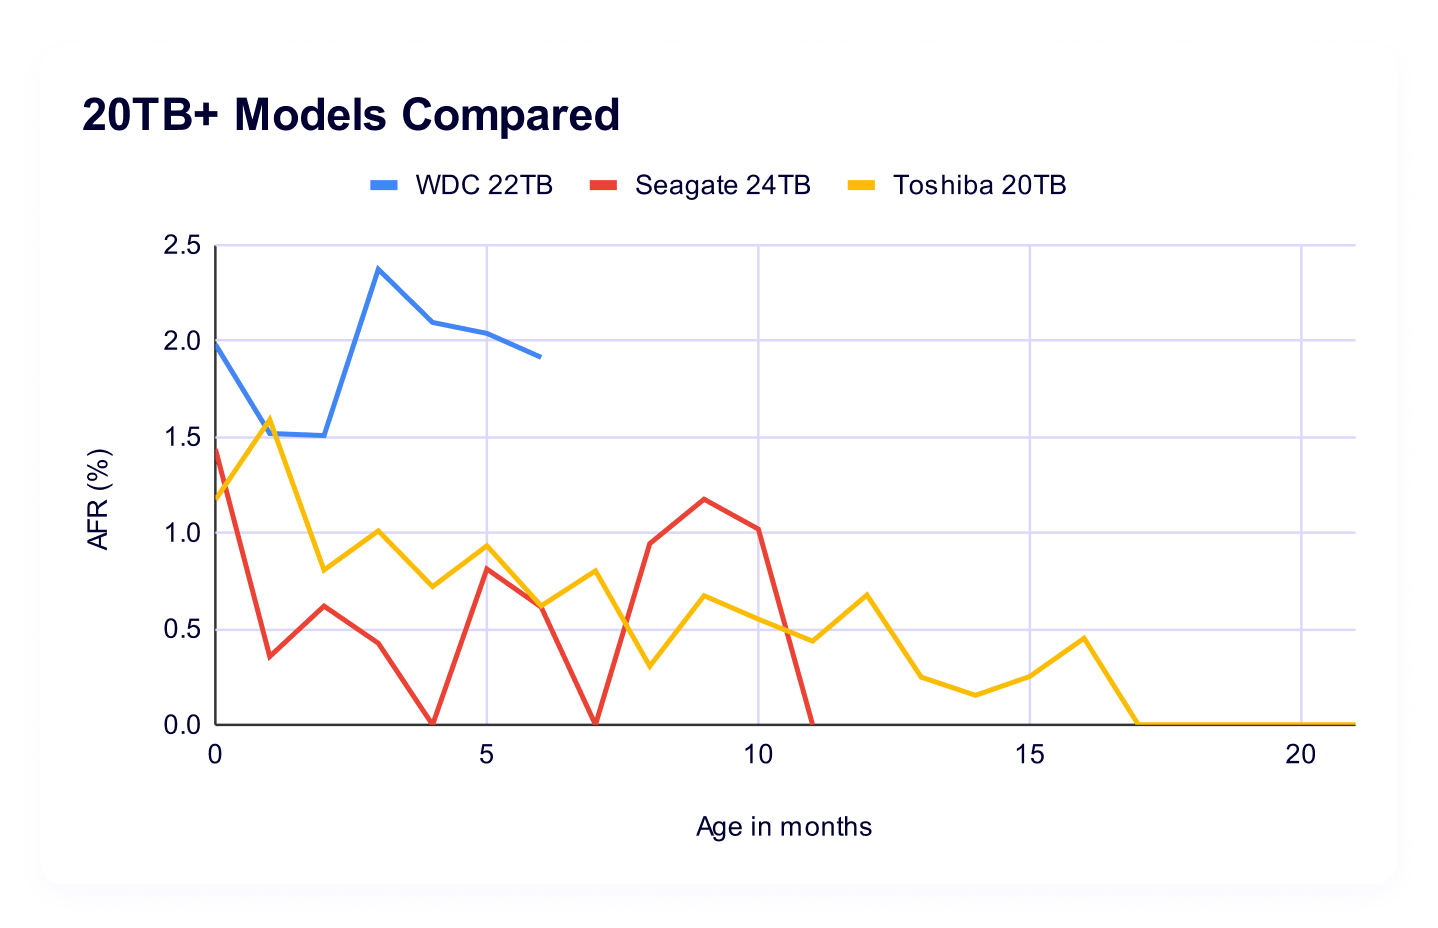
- Steady uptick in higher capacity drives: Of the 20TB+ drives that meet our lifetime data parameters, we’ve added 7,936 since last quarter. And, don’t forget that our newest entrée to the cohort, the Toshiba MG11ACA24TE (24TB), hasn’t made its way to this table yet—that adds an additional 2,400 drive models. All together, the 20TB+ club represents 67,939 drives, or about 21% of the drive pool.
Defining a failure—from a technical perspective
A question that’s come up a few times when we’re hosting a webinar or chatting in the comments section is how we define a failure. While it may seem intuitive, it’s actually something of a meaty conundrum, and something we haven’t addressed since the early days of this series. Tracking down the answer to this question touches internal drive fleet monitoring tools (via SMART stats), the actual Drive Stats collection program, and our data engineering layer. I’ll dig into each of these in detail, then we’ll take a look at the outliers for this quarter.
SMART stats reporting
We use Smartmontools to collect the SMART attributes of drives, and another monitoring tool called drive sentinel to flag read/write errors that exceed a certain threshold as well as some other anomalies.
The main indicator we use for determining if a drive should be replaced is when it responds to reads with uncorrectable medium errors. When a drive reads the data from the disk, but the data fails its integrity check, the drive will try to reconstruct the data using internal error correction codes. If it is unable to reconstruct the data, it notifies the host by reporting it as an uncorrectable error and marks that part of the disk as pending reallocation, which shows up in SMART under an attribute like Current_Pending_Sector.
On Storage Pods that control drives through SATA links, the drive sentinel will count the number of these uncorrectable errors a drive reports and if it exceeds a threshold, access to the drive will be removed. This is important in the classic Backblaze Storage Pods where five drives share a single SATA link and errors by one drive will affect all drives on the link.
On Dell and SMCI pods that use a SAS topology to connect drives, drive sentinel doesn’t remove access to drives because the errors are reported differently; but, that’s also not as critical since SAS minimizes the impact that a problem disk can have on others.
The Drive Stats program
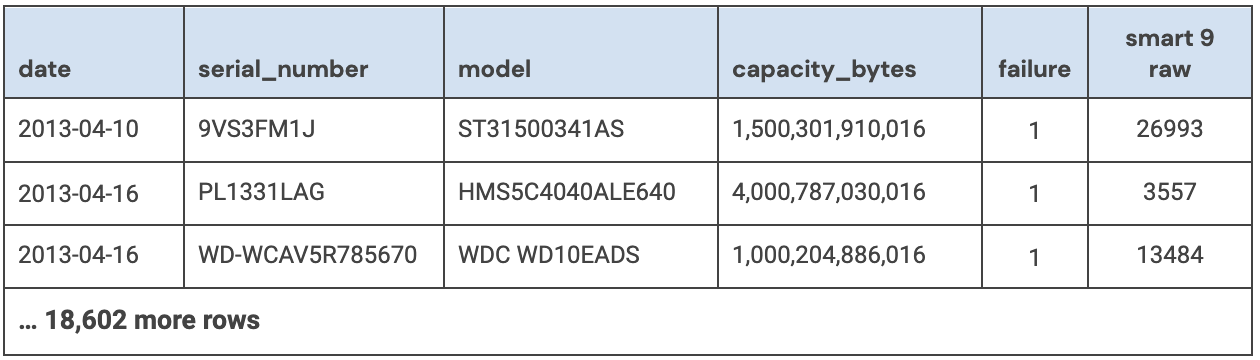
We’ve talked about the custom program we use to collect Drive Stats in the past, and here’s a quick recap:
The podstats generator runs on every Storage Pod, what we call any host that holds customer data, every few minutes. It’s a C++ program that collects SMART stats and a few other attributes, then converts them into an .xml file (“podstats”). Those are then pushed to a central host in each datacenter and bundled. Once the data leaves these central hosts, it has entered the domain of what we will call Drive Stats.
For this program, the logic is relatively simple: A failure in Drive Stats occurs when a drive vanishes out of the reporting population. It is considered “failed” until it shows up again. Drives are tracked by serial number and we report daily logs on a per-drive basis, so truly, we can get pretty granular here.
The data engineering layer
To recap, we’ve collected our SMART stats and compiled them with the podstats program. Now we’ve got all the information, and data intelligence needs to add the context. A drive may go offline for a day or so (not return a response to those tools that collect daily logs of SMART stats), but it could be something as simple as a loose cable. So, time-wise, if a drive reappears after one day or 30, at what point in that period of time do we classify it as an official failure?
Previously, we manually cross-referenced data center work tickets, but these days, we’ve automated that process. On the backend, it’s a SQL query, but in human speak, this is what it comes down to:
- If a drive logs data on the last day of the selection period (which in this case is a quarter) then it has not failed.
- There are three human-curated tables that the query cross references. If a drive serial number appears on one of them, it tells us whether there’s a failure or not (depending on the table’s function).
- If the drive serial number is the primary serial number in a drive replacement Jira ticket then it has failed. (Jira is where we track our data center work tickets.)
- If the drive serial number is the target serial number in a clone Jira ticket or a (temp) replacement ticket, then it has not failed.
Basically, when we go to write the Drive Stats reports at the end of the quarter, if a drive has either appeared in one of our various work trackers or hasn’t re-entered the population, then it’s considered failed.
In rare instances, that can mean that we have so-called “cosmetic” failures when we have some work we’re doing on a drive model that lasts more than that quarterly collection period. And, spoiler, we have one of those instances that showed up in the data this month—our outlier Toshiba drive with the 16.9% failure rate. We’ll dig in in just a minute; but first, some context.
Connecting drive failure to overall picture of the drive pool
As we mentioned above, certain drives in the pool had such high swings in AFR that we ended up running an outlier analysis using the quartile method. (It’s also worth mentioning that a cluster analysis could potentially be a better fit, but we can save that for another day.) Based on that analysis, anything that has above a 5.88% failure rate is an outlier.
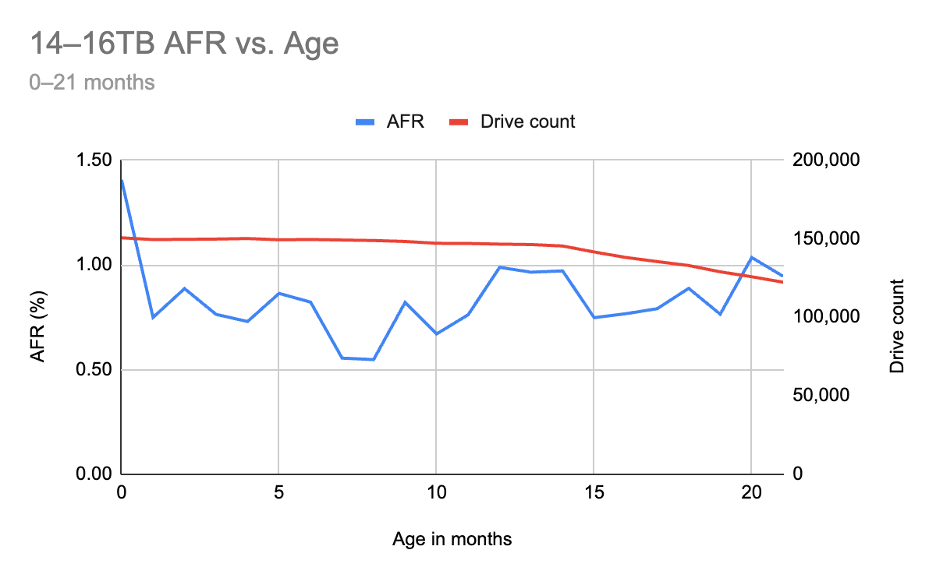
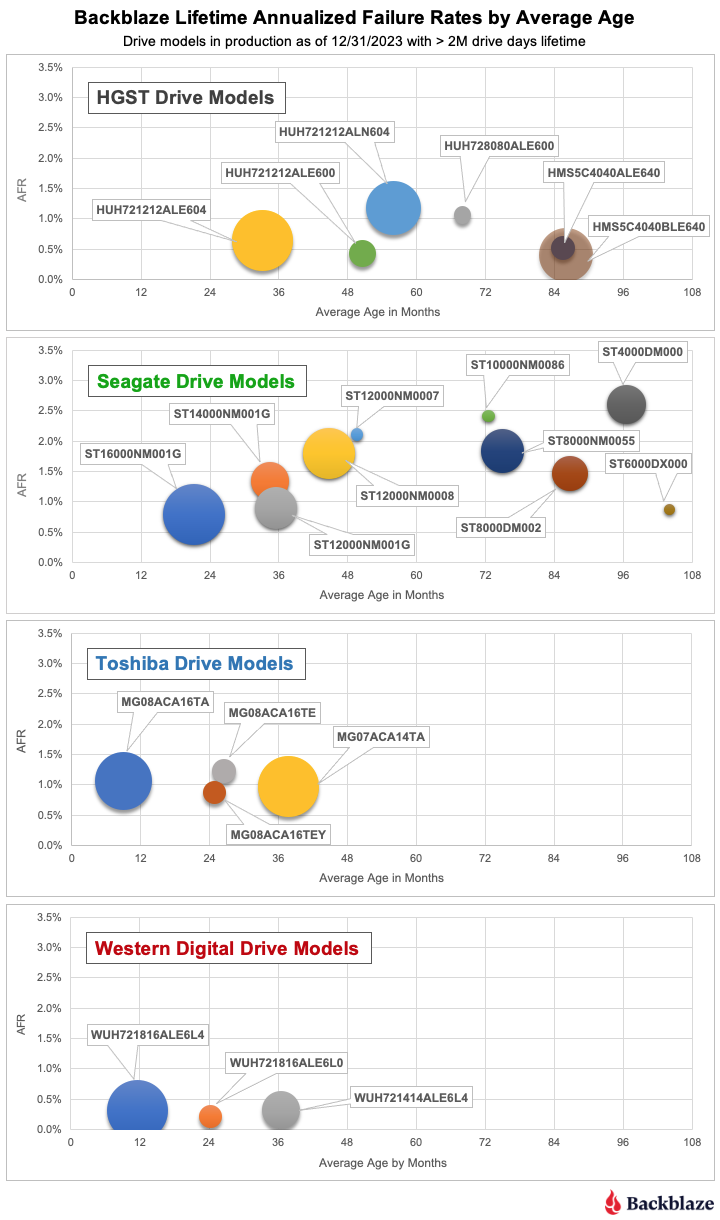
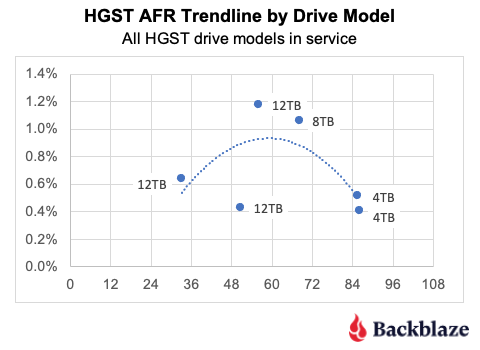
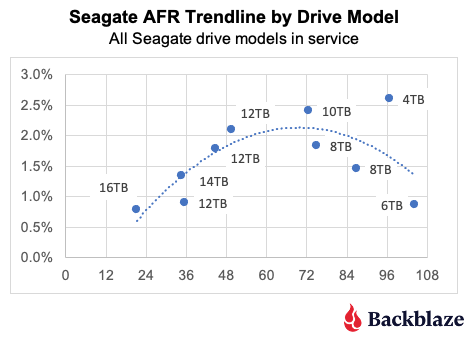
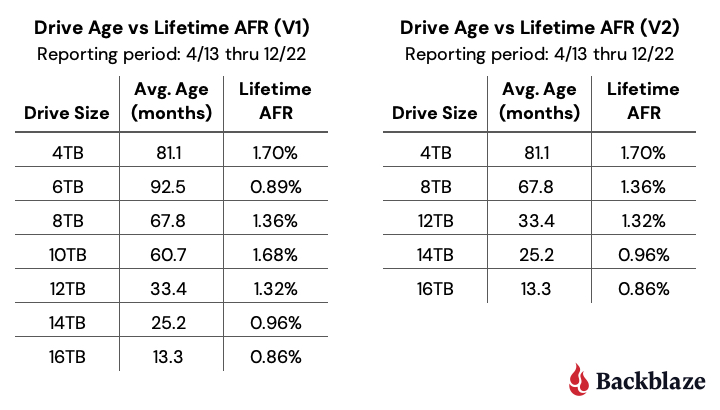
The primary motivation was inspired by an attempt to visualize the relationship between the age in months of a drive versus this quarter’s AFRs.
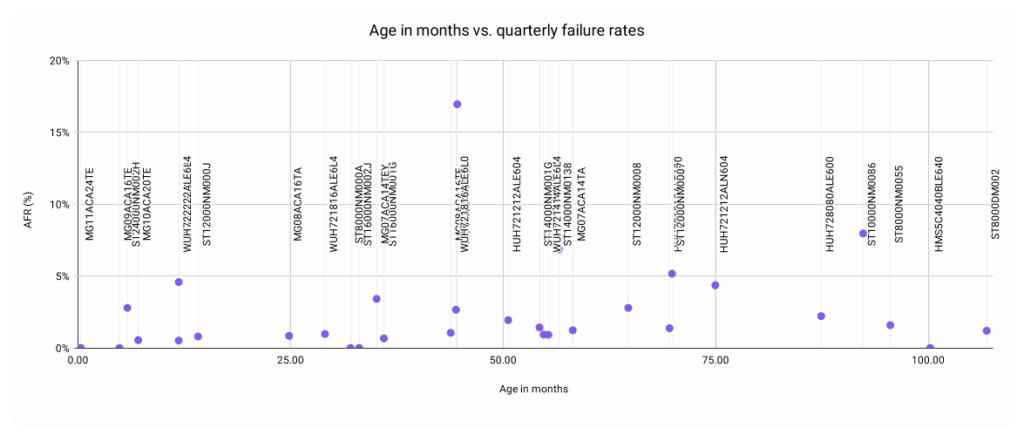
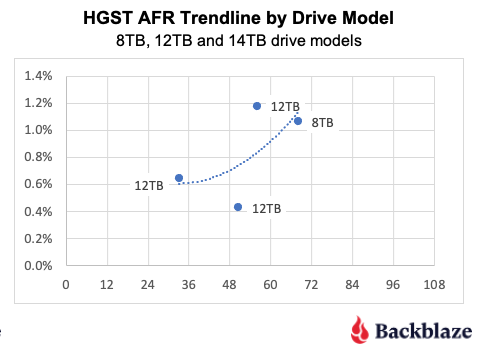
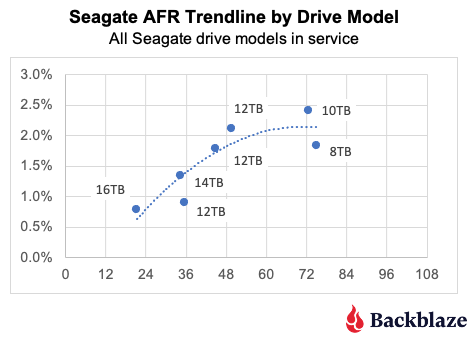
And yes, we’re fully aware that that’s a… super unreadable scatter plot. Removing the labels, this is a bit better:

We’re interested, really, in the shape of the relationship. If we posit that the older drives get, the higher their failure rates, you’d expect a larger concentration in the top right quadrant. But, our data follows a much more interesting pattern than that, with most of our data points concentrated in the lowest regions of the graph regardless of age—something you’d expect from a set of data that reflects a bunch of smart folks actively working towards the goal of a healthy drive population. And yet, we have some data points that break the mold.
As is pretty intuitive to my business intelligence folks in the audience, the process of identifying outliers is actionable data as well. Just like all press is good press; in our world, more data is more better. So, let’s take a closer look at those outliers. As a reminder, that’s these three drive models:
- Seagate ST10000NM0086 (10TB): 7.97%
- Seagate ST14000NM0138 (14TB): 6.86%
- Toshiba MG08ACA16TEY (16TB): 16.95%
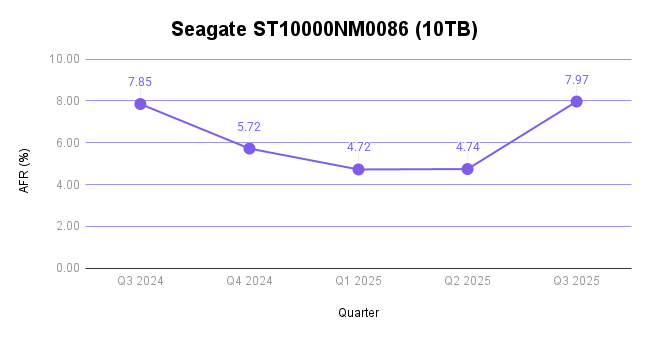
Seagate ST10000NM0086 (10TB)
This drive has some pretty explainable factors for the high failure rate. It’s well over seven years old (92.35 months). And, since it only has 1,018 drive models in operation, single failures hold a lot of weight compared with the average drive count per model—which comes in at 10,952 if you use the mean of this quarterly data and 6,177 if you use the median.
And, you can see that borne out in the trend in the last year of data:
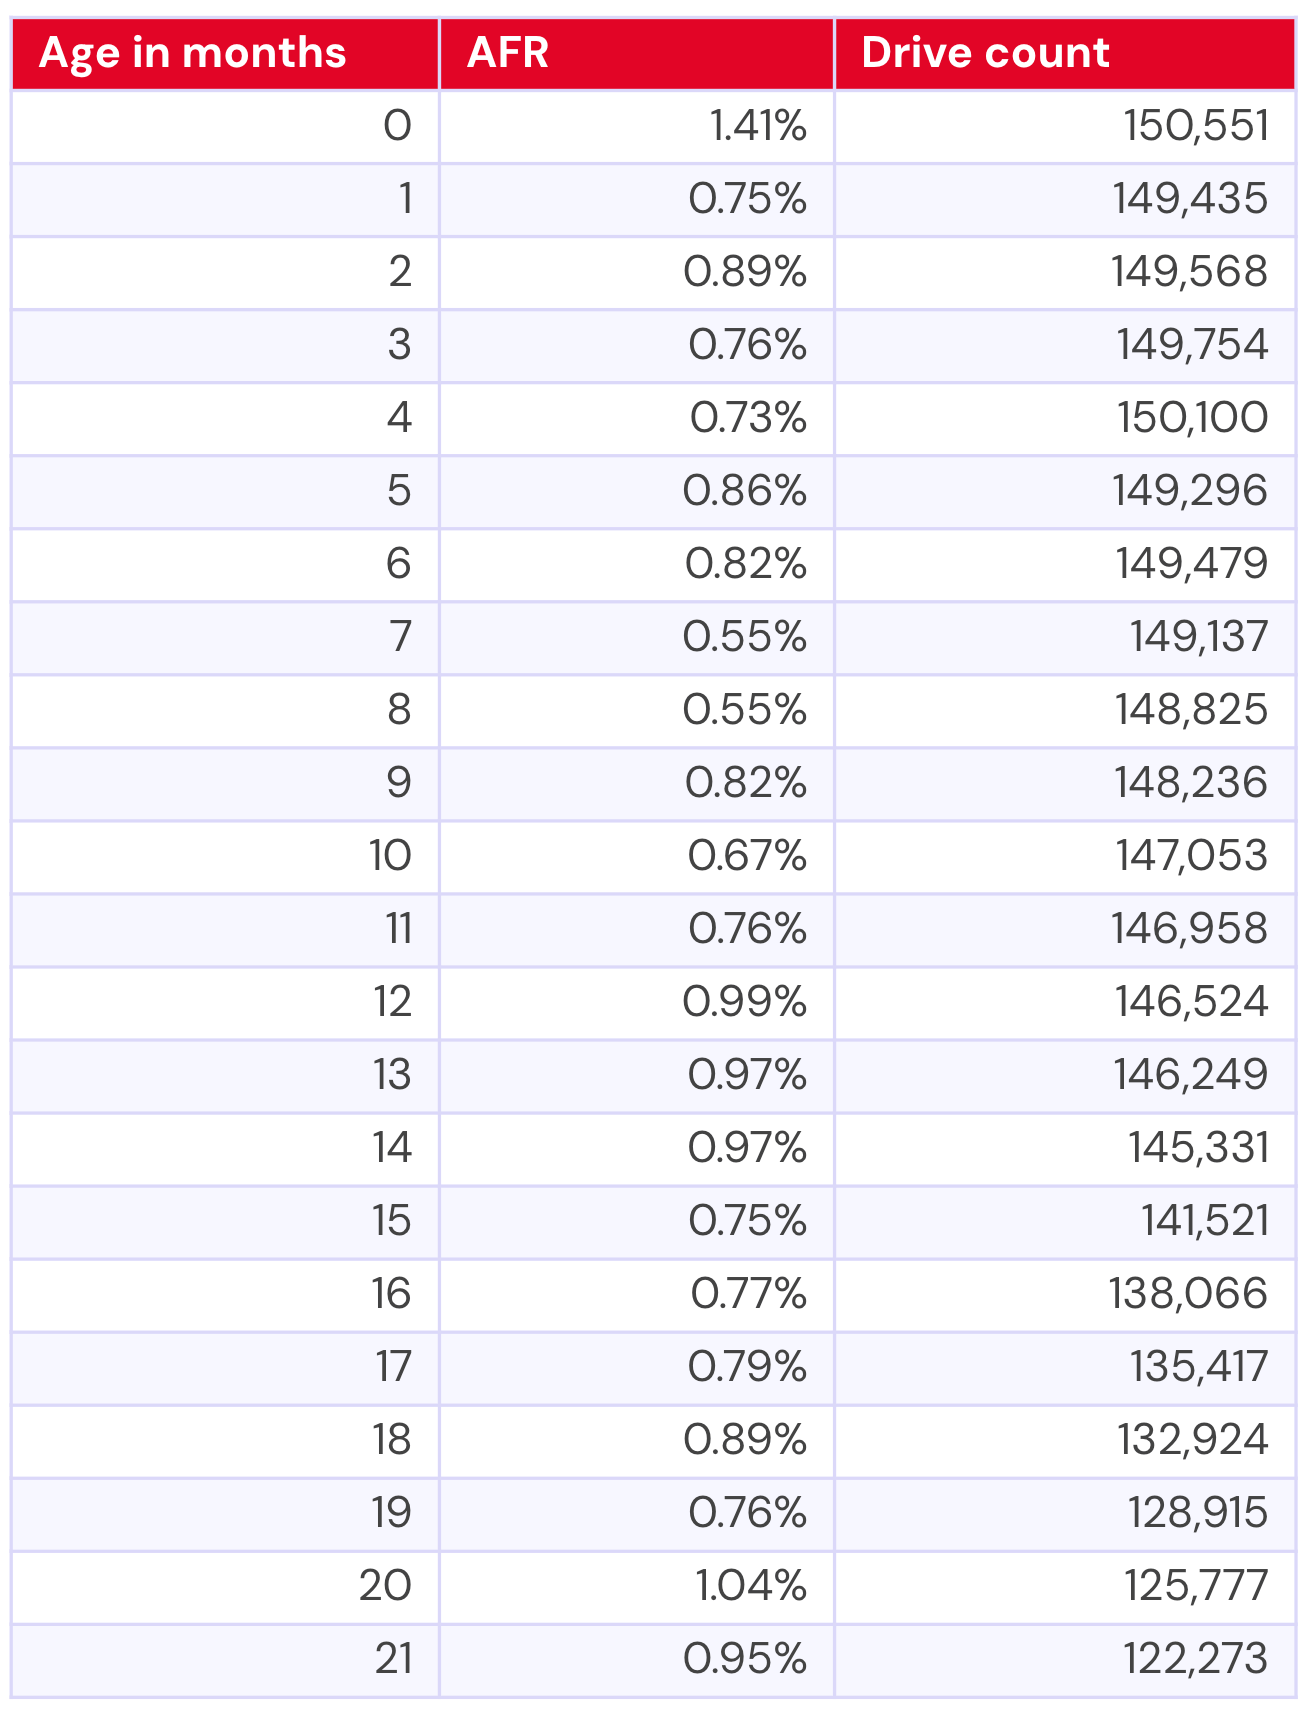
Seagate ST14000NM0138 (14TB)
This drive is nearing five years in age (56.57 months) and, again, has a lower drive count at 1,286. More importantly, this particular drive model has had historically high failure rates. In parallel with above, here’s the last year of quarterly failure rates:

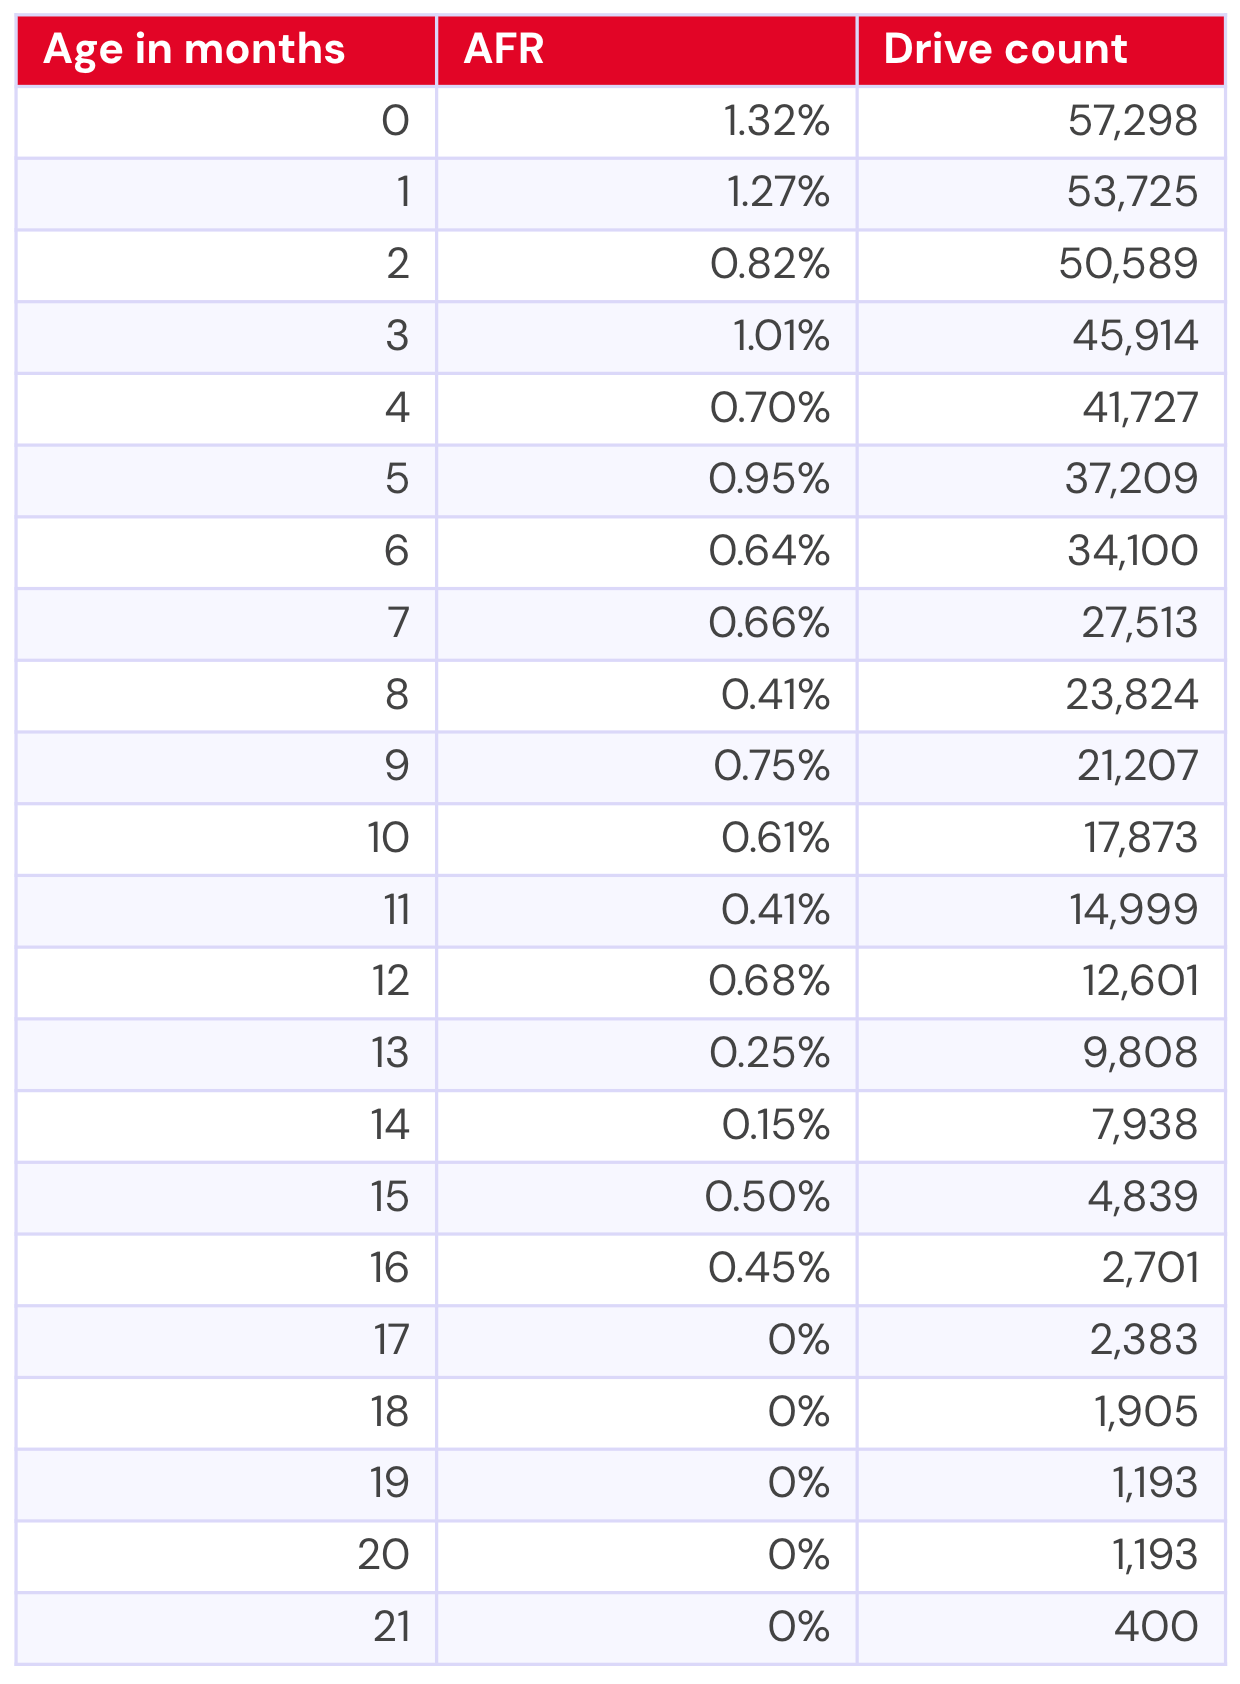
Toshiba MG08ACA16TEY (16TB)
Finally, our Toshiba model is the most interesting of all. It’s less than four years old (44.61 months), and has 5,145 drives in the pool. And, this quarter is clearly a change from its normal, decent, AFRs.

When we see deviations like this one, it’s usually an indication that there’s something afoot.
Never fear, Drive Stats fans; this was a known quantity before we went on this journey. This past quarter, working with Toshiba, we deployed some firmware updates they provided to optimize performance on these drives. Because we needed to pull drives to achieve this in some cases, we had an abnormal number of “failed” drives in this population.
What that means for this drive is that it’s actually not a bad drive model; and, given the ways we and Toshiba have worked together on a fix, we should see failure rates normalizing in the near future. And, this also goes back to our conversation of defining a failure—in this case, while the drives “failed,” the failure wasn’t mechanical and was based on something that we’ll be able to fix without replacing the drives. In short, don’t sweat the spike and pay attention to the long arc of performance on this population. We expect to see those drives happy and spinning for years to come (and with better performance, too).
The Hard Drive dataset (and beyond)
Thank you, as always, for making it through ~2,500 or so words to examine the fun side of data. Here’s our standard fine print:
The complete dataset used to create the tables and charts in this report is available on our Hard Drive Test Data page. You can download and use this data for free for your own purpose. All we ask are three things:
- You cite Backblaze as the source if you use the data;
- You accept that you are solely responsible for how you use the data, and;
- You do not sell this data itself to anyone; it is free.
If you’re a new Drive Stats fan, consider signing up for the newsletter. If you’re not ready for that kind of commitment, sound off in the comments section below or reach out directly to us to let us know what you’re working on. Happy investigating!
The post Backblaze Drive Stats for Q3 2025 appeared first on Backblaze Blog | Cloud Storage & Cloud Backup