All posts by D Surya Sai

Set up your AI coding agent to build with AWS Step Functions

Post Syndicated from D Surya Sai original https://aws.amazon.com/blogs/compute/set-up-your-ai-coding-agent-to-build-with-aws-step-functions/

You want to build an AWS Step Functions workflow, and you have an AI coding agent open in your terminal or IDE. But the agent doesn’t know about Amazon States Language (ASL), service integrations, or how to deploy state machines. Before you can start, you need to find the right Model Context Protocol (MCP) server package, figure out the configuration format for your specific agent, and set up credentials.

AWS Step Functions has added a “Copy agent prompt” button to the AWS Step Functions console that removes this setup entirely. You choose the button, paste the prompt into your agent, and the agent configures itself with Serverless skills and an MCP server. You can start building workflows with natural language immediately. The feature works with Claude Code, Kiro CLI, Cursor, GitHub Copilot, Codex, Devin Desktop, OpenCode, and any other MCP-compatible agent.

How it works

The button appears in three places in the Step Functions console:

  • The home page, under “How it works”.
  • The Create State Machine modal (at the top, before you begin building).
  • The Local Development section on the home page.

Here’s an example from the Create State Machine flow:

  1. Open the Step Functions console and choose Create state machine.
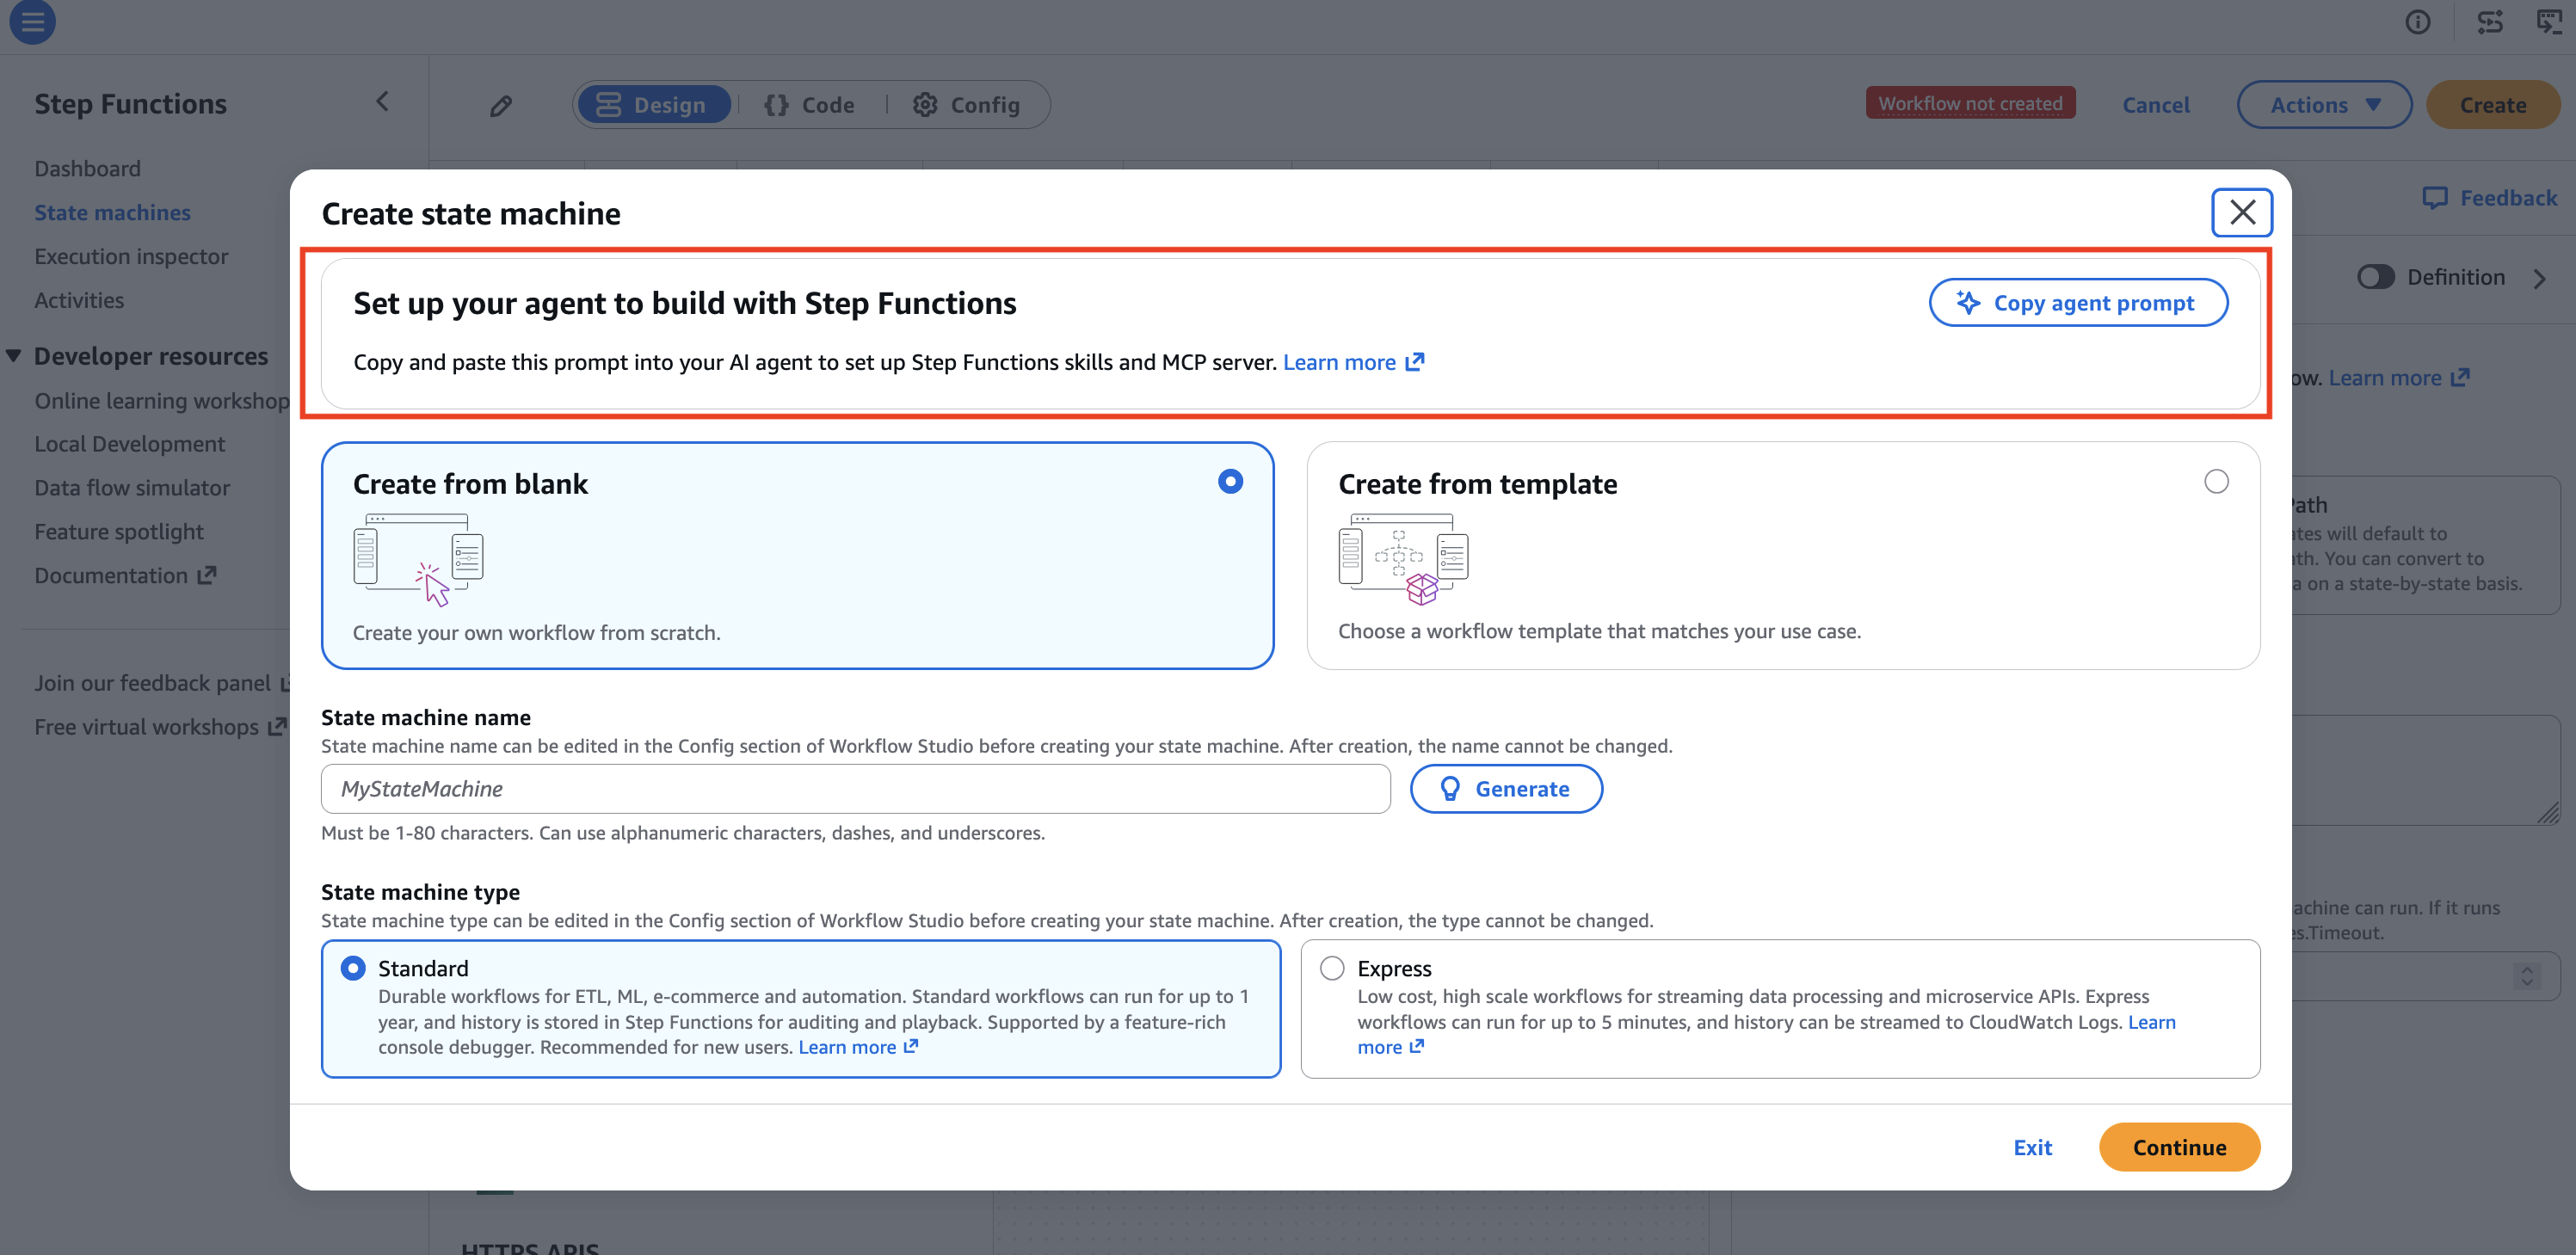
  2. At the top of the modal, you see the banner: “Set up your agent to build with Step Functions. Copy and paste this prompt into your AI agent to set up Step Functions skills and MCP server.”
Step Functions console modal showing the Copy agent prompt banner and button

Figure 1: Step Functions console modal showing the Copy agent prompt

  1. Choose Copy agent prompt. The console copies a fetch instruction to your clipboard.
  2. Paste the prompt into your AI agent’s chat or terminal.
  3. The agent reads the setup guide and self-configures.

The copied prompt is a fetch instruction that points to a setup guide hosted on AWS documentation. You paste it into your agent, and the agent installs two things:

AWS Serverless skill (from the Agent Toolkit for AWS) provides your agent with deep context on Step Functions. It includes how to write ASL, structure workflows with retries and error handling, choose between Standard and Express workflow types, implement patterns like saga orchestration and parallel fan-out, and deploy using AWS Serverless Application Model (AWS SAM) or AWS Cloud Development Kit (AWS CDK).

AWS Serverless MCP Server gives your agent direct access to AWS. Through the Model Context Protocol, your agent can create and update state machines, start and describe executions, inspect workflow history, and manage resources in your account.

Supported agents

The setup guide auto-detects your agent and provides the correct configuration format:

  • Claude Code: Installs through the plugin marketplace and registers the MCP server with claude mcp add.
  • Kiro CLI: Writes to ~/.kiro/settings/mcp.json.
  • Codex: Registers with codex mcp add.
  • Cursor: Writes to .cursor/mcp.json.
  • GitHub Copilot: Writes to .vscode/mcp.json.
  • Devin Desktop: Writes to .devin/mcp_config.json.
  • OpenCode: Writes to ~/.config/opencode/opencode.jsonc.

If you use a different MCP-compatible agent, the guide provides a generic JSON configuration block you can add to your agent’s config file.

What you can build

Once your agent is configured, you can describe workflows in natural language, and the agent produces valid, deployable state machines. Here are a few examples:

Order processing with compensation: “Build a workflow that validates a payment, reserves inventory and sends a confirmation email. If payment fails, release the inventory reservation.”

Parallel fan-out: “Create an Express workflow that calls three AWS Lambda functions in parallel, waits for all to complete, and merges the results into a single response.”

Human approval gate: “Add a step that pauses the workflow and waits for a manager to approve before proceeding with the deployment.”

Error handling: “Add retry with exponential backoff and a maximum of three attempts to the payment processing step. If all retries fail, route to a fallback notification step.”

Because the agent has the MCP server connected, it can also deploy the workflow directly to your account, start test executions, and inspect the results without leaving the agent interface.

Advantages

Always current: The Agent Toolkit for AWS content stays up to date as Step Functions adds new features, integrations, and patterns. When you run the prompt, your agent gets the latest skills and configurations automatically.

No context switching: You stay in your agent’s interface for the entire workflow: design, build, deploy, test, and iterate. No switching between the console, documentation, and your editor.

Works with your existing credentials: The MCP server uses your local AWS profile. No new AWS Identity and Access Management (IAM) roles or permissions are required beyond what you already use for Step Functions development.

Agent-agnostic: Whether you use Claude Code, Kiro, Cursor, Copilot, or another tool, the same button and prompt works. You don’t need to find agent-specific setup instructions.

Get started

  1. Open the AWS Step Functions console.
  2. Choose Copy agent prompt from the banner (on the home page under “How it works,” in the Local Development section, or in the Create State Machine modal).
  3. Paste the prompt into your AI coding agent.
  4. Start describing the workflow you want to build.

This feature is available in all commercial AWS Regions at no additional cost. To learn more about the setup process, see the agent setup guide. For more on the Agent Toolkit for AWS, see the GitHub repository. For AWS MCP Servers, see the documentation.

We’d like to hear how you use this feature. Tell us about it in the comments.

Observability best practices for Lambda durable functions

Post Syndicated from D Surya Sai original https://aws.amazon.com/blogs/compute/observability-best-practices-for-lambda-durable-functions-2/

When your workflow suspends to wait for a confirmation, you need to know whether the callback arrived, how long the function waited, and what to do if the callback never comes. AWS Lambda durable functions make these long-running, suspendable workflows straightforward to build, but answering those operational questions requires deliberate monitoring instrumentation across the suspension boundary.

In this post, we walk through observability best practices for Lambda durable functions using a Stripe payment processing pipeline as the example. We cover durable function-specific Amazon CloudWatch metrics, custom business metrics, alarms, structured logging, AWS X-Ray tracing, and how to debug a callback timeout end-to-end. By the end, you will have a reusable observability pattern for any durable function that suspends on external callbacks. The GitHub repository contains the complete implementation.

Architecture overview

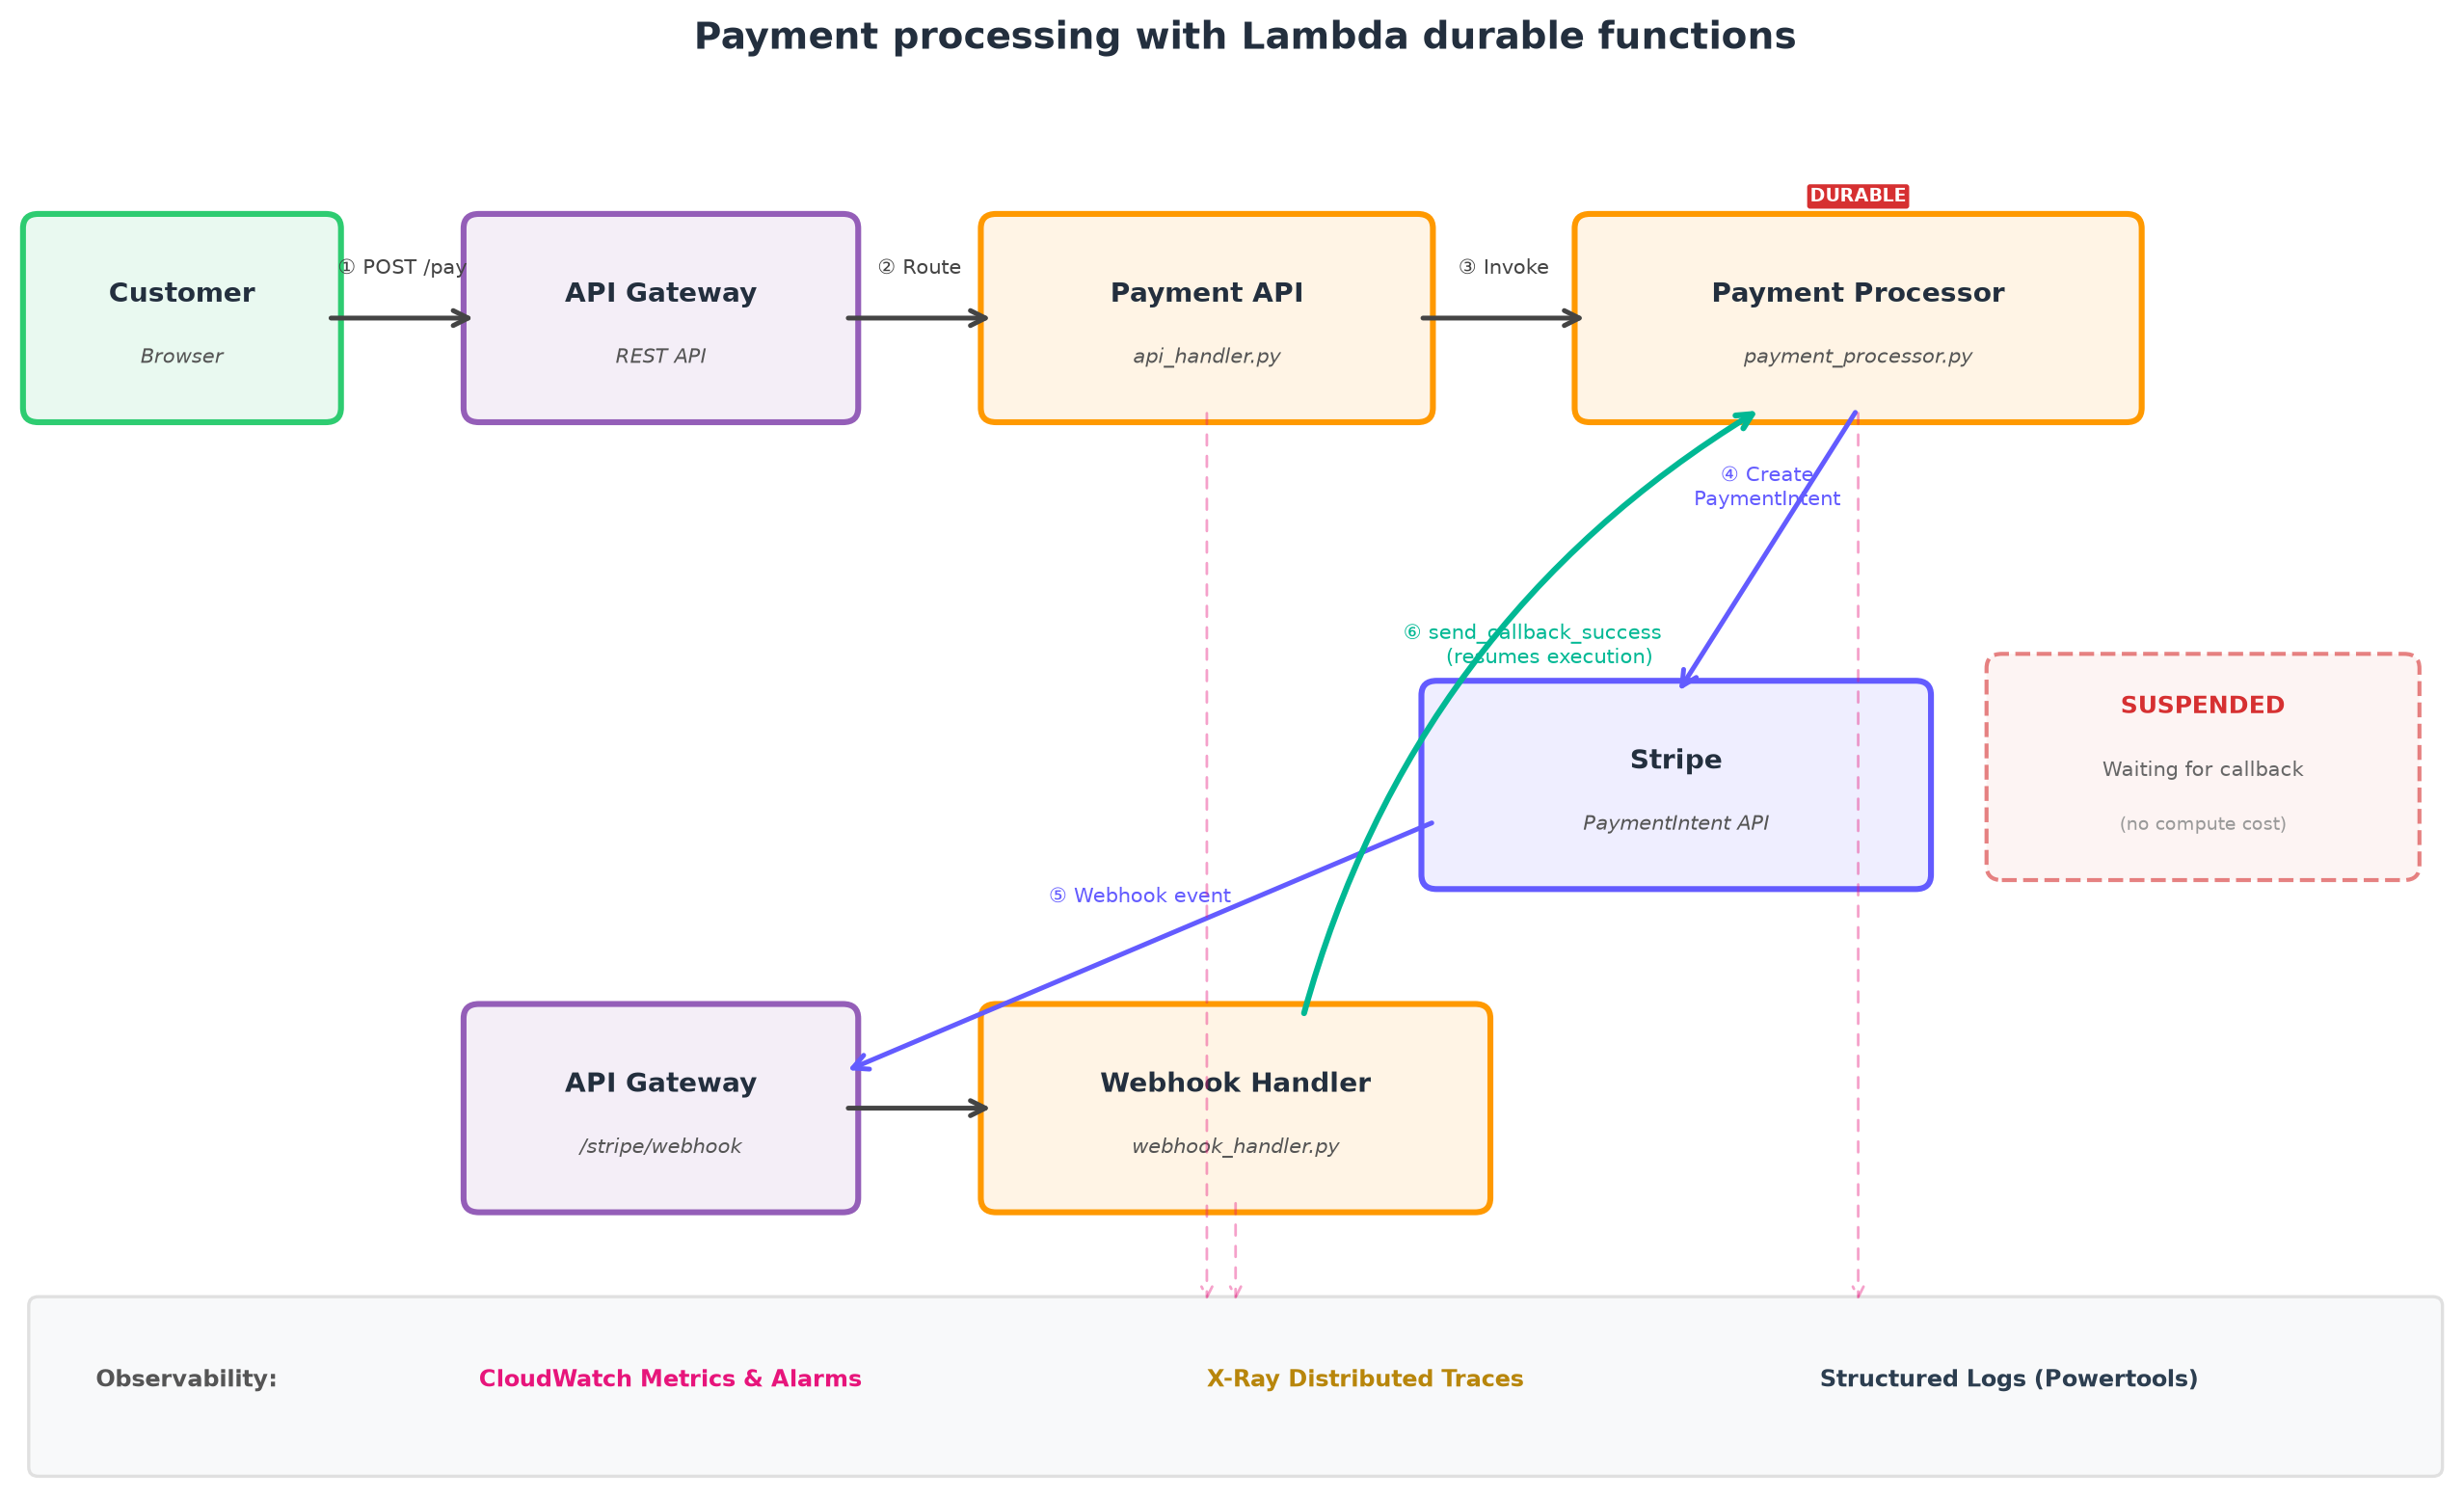
Our application processes card payments through Stripe using three Lambda functions and Amazon API Gateway:

1. Payment API (payment-api): An API Gateway-backed function that accepts payment requests, asynchronously invokes the durable function, and exposes endpoints to check or cancel an in-flight execution.

2. Payment Processor (payment-processor): A durable function that validates the payment, creates a Stripe PaymentIntent, then suspends and waits for a callback confirming the payment outcome.

3. Webhook Handler (stripe-webhook): Receives Stripe webhook events, verifies the signature, and calls send_durable_execution_callback_success to resume the suspended durable execution with the payment result.

Architecture diagram showing payment processing flow with durable callback suspension

Figure 1: Payment processing flow with durable callback suspension, where the webhook handler sends the callback result back to the same suspended durable execution

The key observability challenge sits in the gap between the PaymentIntent creation (step 2) and the webhook delivery (step 3). During this period the durable function is suspended: it is consuming no compute, but it is waiting for Stripe to call back. If the webhook never arrives, the callback times out silently unless you have metrics and alarms watching for it. With proper instrumentation, you gain full visibility into this suspension gap and can diagnose issues within minutes.

You deploy the application with AWS Serverless Application Model (AWS SAM). The following template excerpt shows how we enable observability across the stack:

Globals:
  Function:
    Runtime: python3.13
    Tracing: Active # X-Ray on all functions
    Environment:
      Variables:
        POWERTOOLS_METRICS_NAMESPACE: DurablePayments
        LOG_LEVEL: INFO

Resources:
  PaymentApi:
    Type: AWS::Serverless::Api
    Properties:
      TracingEnabled: true # X-Ray on API Gateway

  PaymentProcessorFunction:
    Type: AWS::Serverless::Function
    Properties:
      AutoPublishAlias: live
      DurableConfig:
        ExecutionTimeout: 600 # Bounds the whole workflow
        RetentionPeriodInDays: 5 # Keep execution history

Tracing: Active under Globals enables X-Ray across all functions, and TracingEnabled: true on the API resource ensures traces propagate from the initial request through the entire flow.

Durable function CloudWatch metrics, custom business metrics, and alarms

Lambda automatically emits CloudWatch metrics specific to durable executions, covering execution lifecycle, capacity utilization, duration including wait time, and cost drivers. For the full list, see Monitoring durable functions.

One metric worth calling out: DurableExecutionDuration measures total wall-clock time including the callback wait period. For a payment that takes 2 seconds to process but waits 30 seconds for a webhook, this metric reports approximately 32 seconds. This is distinct from the standard Duration metric, which only measures active compute time.

Custom business metrics for the callback funnel

The built-in metrics tell you whether executions succeeded or failed. To understand where in the business flow the issue occurred, we emit custom metrics at each stage using Powertools for AWS Lambda Metrics with Embedded Metric Format (EMF):

from aws_lambda_powertools import Metrics
from aws_lambda_powertools.metrics import MetricUnit

metrics = Metrics(namespace="DurablePayments", service="payment-processor")

# In the durable handler, after each stage:
metrics.add_metric(name="PaymentIntentCreated", unit=MetricUnit.Count, value=1)
metrics.add_metric(name="PaymentSucceeded", unit=MetricUnit.Count, value=1)
metrics.add_metric(name="PaymentFailed", unit=MetricUnit.Count, value=1)
metrics.add_metric(name="PaymentTimeout", unit=MetricUnit.Count, value=1)

In the webhook handler:

metrics.add_metric(name="WebhookReceived", unit=MetricUnit.Count, value=1)
metrics.add_metric(name="WebhookSucceeded", unit=MetricUnit.Count, value=1)
metrics.add_metric(name="WebhookSignatureFailure", unit=MetricUnit.Count, value=1)

These metrics create an end-to-end funnel:

PaymentRequested → PaymentIntentCreated → WebhookReceived → WebhookSucceeded → PaymentSucceeded

Any drop-off between stages pinpoints the problem. If PaymentIntentCreated is higher than WebhookReceived, Stripe is not delivering webhooks. If WebhookReceived is higher than WebhookSucceeded, signature verification is failing. No corresponding PaymentSucceeded for a PaymentIntentCreated means the callback timed out.

Alarms for callback failure modes

Durable functions with callbacks have specific failure modes: callbacks that never arrive, webhook signatures that fail verification, and executions that time out waiting. We define alarms for each:

DurableExecutionFailureAlarm:
  Type: AWS::CloudWatch::Alarm
  Properties:
    Namespace: AWS/Lambda
    MetricName: DurableExecutionFailed
    Dimensions:
      - Name: FunctionName
        Value: !Ref PaymentProcessorFunction
    Threshold: 1
    ComparisonOperator: GreaterThanOrEqualToThreshold
    TreatMissingData: notBreaching
    ...

PaymentTimeoutAlarm:
  Type: AWS::CloudWatch::Alarm
  Properties:
    Namespace: DurablePayments
    MetricName: PaymentTimeout
    Dimensions:
      - Name: service
        Value: payment-processor
    Threshold: 1
    ...

WebhookSignatureFailureAlarm:
  Type: AWS::CloudWatch::Alarm
  Properties:
    Namespace: DurablePayments
    MetricName: WebhookSignatureFailure
    Dimensions:
      - Name: service
        Value: stripe-webhook
    Threshold: 3

These alarm definitions are abbreviated for readability. Each alarm in the deployed template.yaml also sets Dimensions (scoping DurableExecutionFailed to the payment-processor function, and the custom metrics to their service). It also includes Statistic, Period, EvaluationPeriods, and AlarmActions/OKActions wired to an SNS topic. See the GitHub repository for the deployable definitions.

Alarm What it catches
DurableExecutionFailed Code errors, Stripe API failures, unhandled exceptions in the durable function
DurableExecutionTimedOut Whole-execution timeout: execution exceeds DurableConfig.ExecutionTimeout
PaymentTimeout Callbacks that never arrive: webhook misconfiguration, Stripe outage, network issues
WebhookSignatureFailure Wrong webhook secret, replay attacks, endpoint misconfiguration
WebhookError Webhook function error spikes (unhandled exceptions in the handler)

Unified dashboard

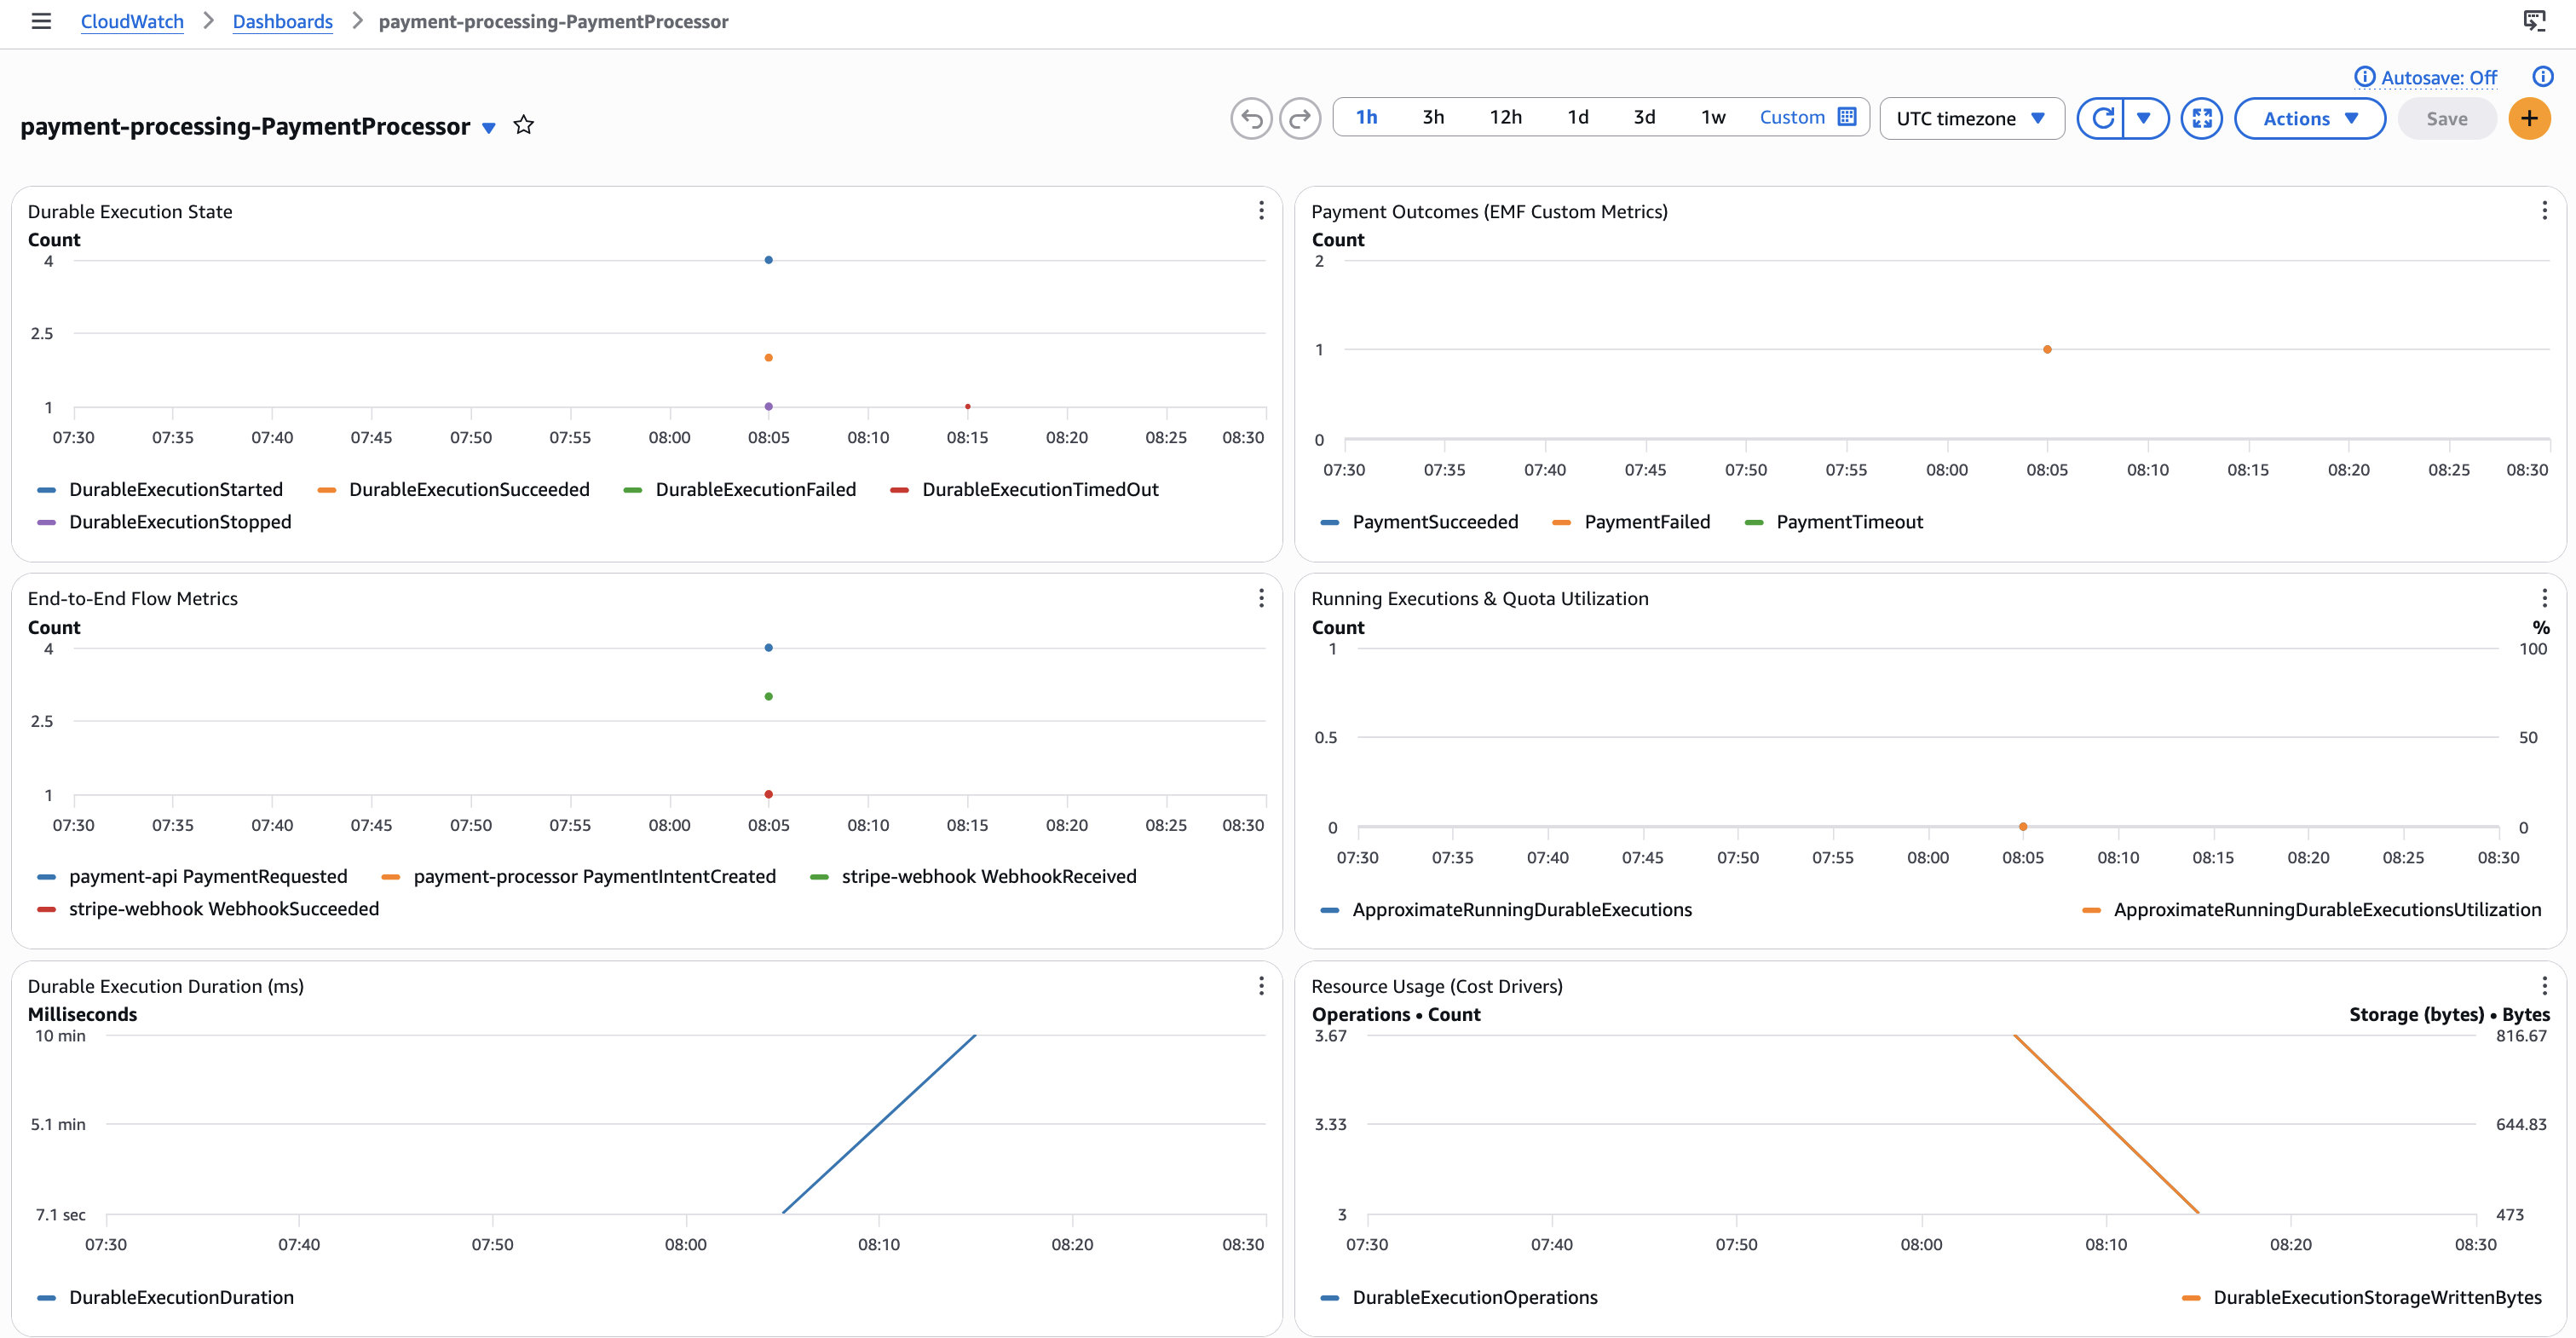
We combine built-in durable metrics, custom EMF metrics, and standard Lambda metrics into a single CloudWatch dashboard. The dashboard includes widgets for execution state, payment outcomes, end-to-end flow metrics, quota utilization, cost drivers, error breakdown, and API/webhook latency.

CloudWatch dashboard showing durable execution state, payment outcomes, and end-to-end flow metrics

Figure 2: CloudWatch dashboard showing durable execution state, payment outcomes, end-to-end flow metrics, running executions and quota utilization

CloudWatch Alarms panel showing DurableExecutionFailures, PaymentTimeouts, and WebhookSignatureFailures alarm states

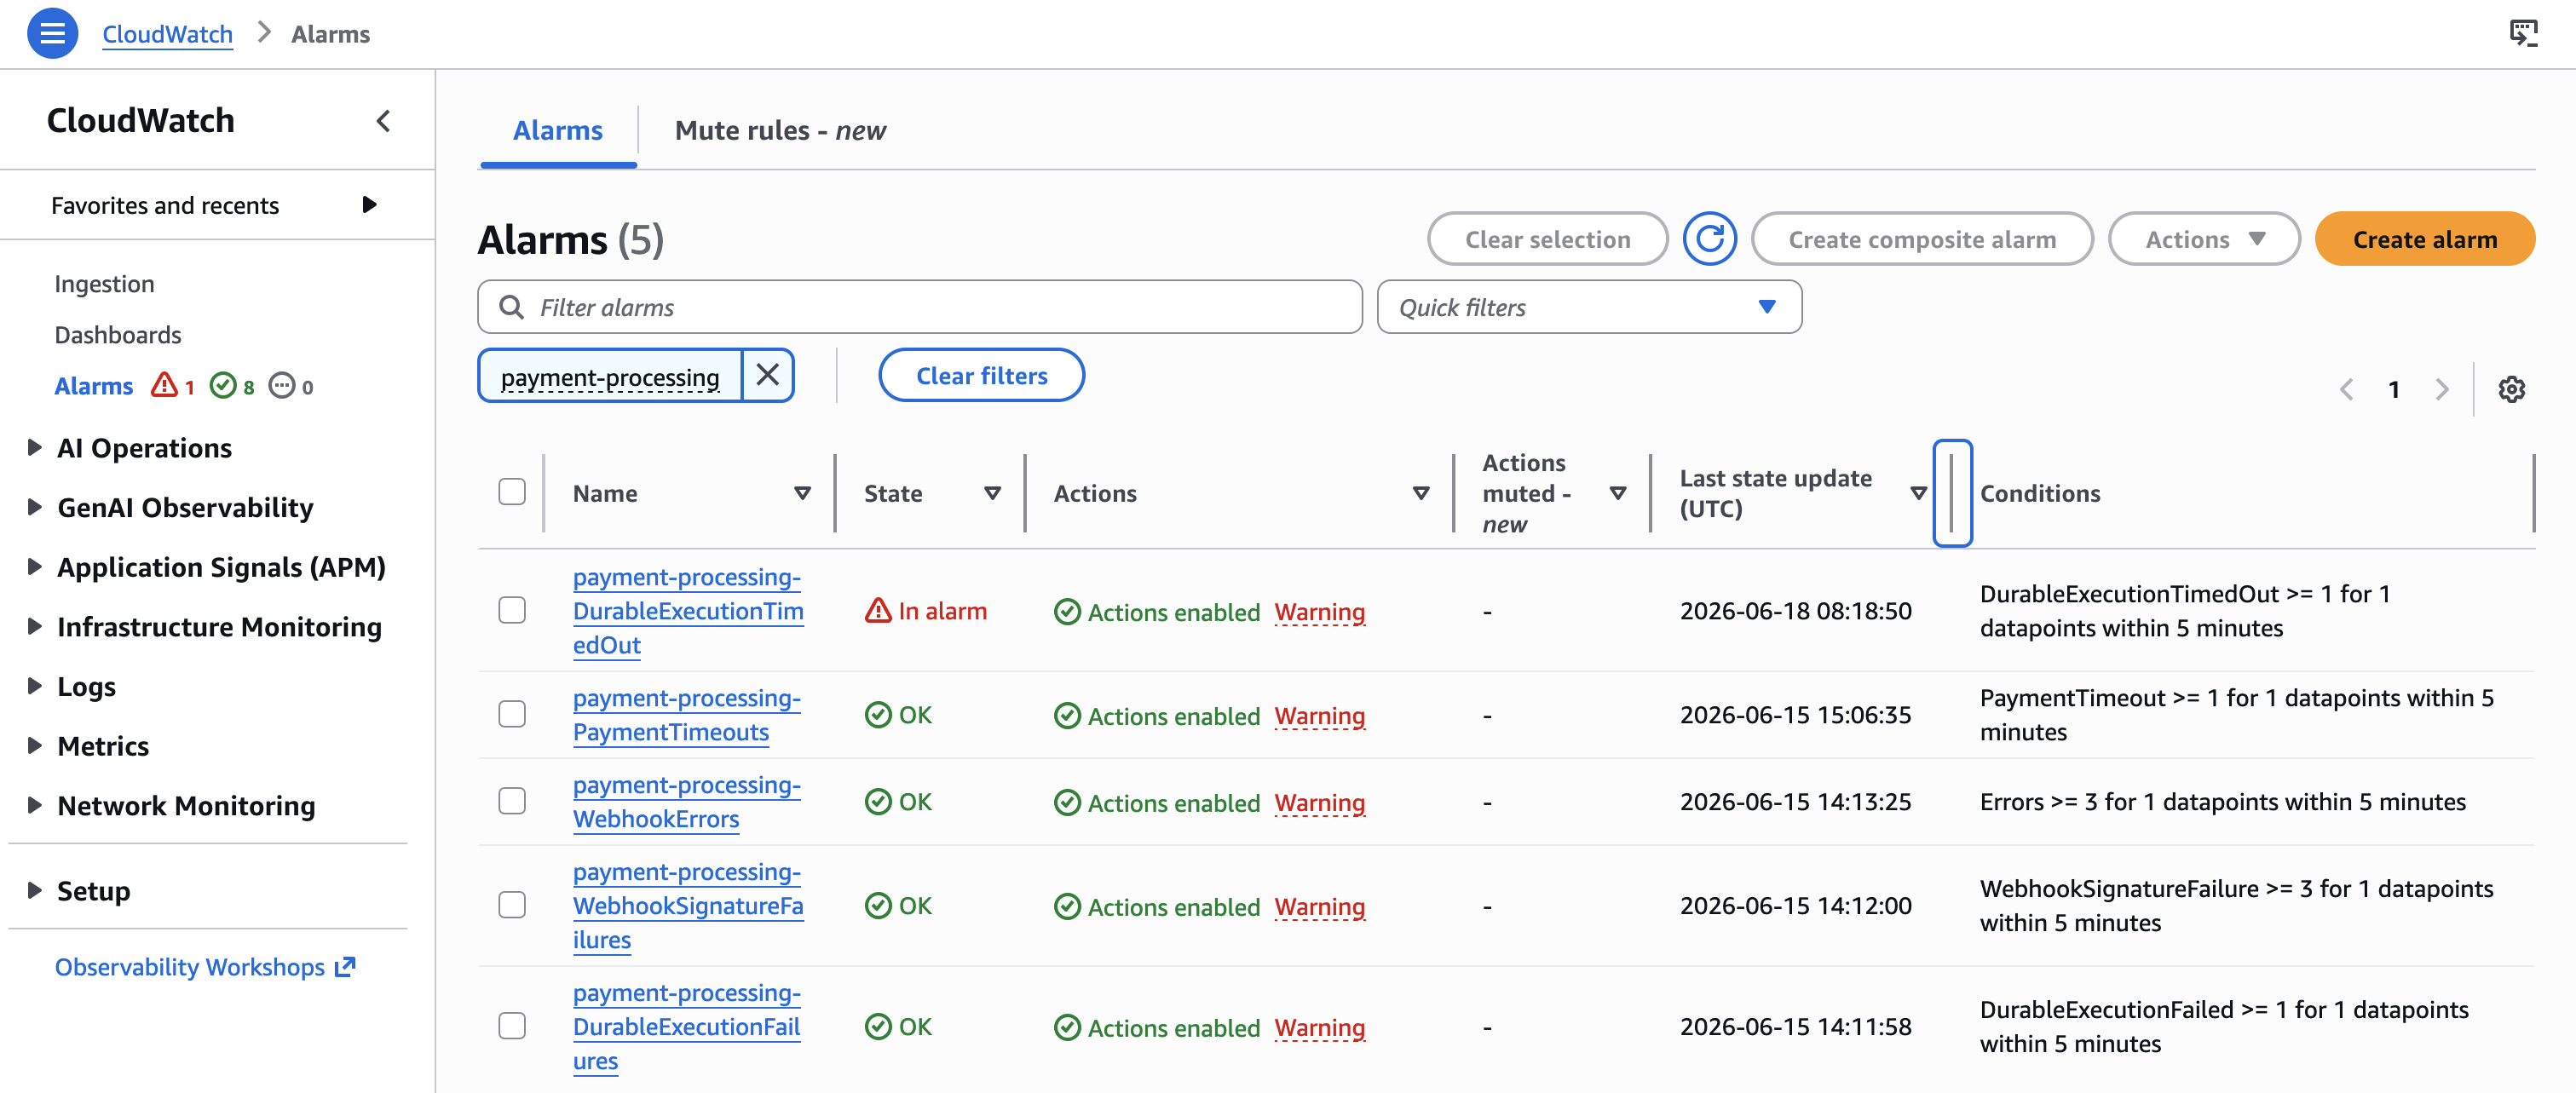
Figure 3: CloudWatch Alarms showing DurableExecutionFailures, PaymentTimeouts, and WebhookSignatureFailures alarm states

Tracing callbacks across the suspension boundary

When a durable function suspends at a callback, the execution pauses. An external system (Stripe) fires a webhook to your API Gateway, which invokes the webhook handler. The webhook handler then calls send_durable_execution_callback_success to deliver the result back to the suspended execution, which resumes and completes. The challenge is correlating these two separate invocations so you can reconstruct the full payment timeline from a single query.

Structured logging with correlation keys

Using Lambda Powertools Logger, we progressively append correlation keys as they become available. Each subsequent log entry automatically includes all previously appended keys:

from aws_lambda_powertools import Logger
from aws_durable_execution_sdk_python import (
    DurableContext, durable_execution, durable_step,
)
from aws_durable_execution_sdk_python.config import CallbackConfig, Duration
from aws_durable_execution_sdk_python.exceptions import CallbackError

logger = Logger(service="payment-processor")

@durable_execution
def handler(event, context: DurableContext):
    payment = context.step(validate_payment_request(event), name="validate-payment")
    logger.append_keys(customer_id=payment["customer_id"])

    callback = context.create_callback(
        name="stripe-payment-result",
        config=CallbackConfig(timeout=Duration.from_minutes(5)),
    )
    logger.info("Callback created", callback_id=callback.callback_id)

    intent = context.step(
        create_stripe_payment_intent(payment, callback.callback_id),
        name="create-payment-intent",
    )
    logger.append_keys(payment_intent_id=intent["payment_intent_id"])
    logger.info("Suspending, waiting for Stripe webhook callback")

    try:
        result = callback.result()  # Function suspends here
    except CallbackError:
        logger.warning("Payment timed out")
        return {"status": "timeout", "message": "No confirmation within 5 minutes"}

In the webhook handler, we append the same keys so a single Logs Insights query reconstructs the full timeline:

logger = Logger(service="stripe-webhook")

def handler(event, context):
    # ... verify signature, parse event
    logger.append_keys(event_type=event_type, payment_intent_id=payment_intent_id)
    logger.append_keys(callback_id=callback_id)
    logger.info("Processing webhook event")

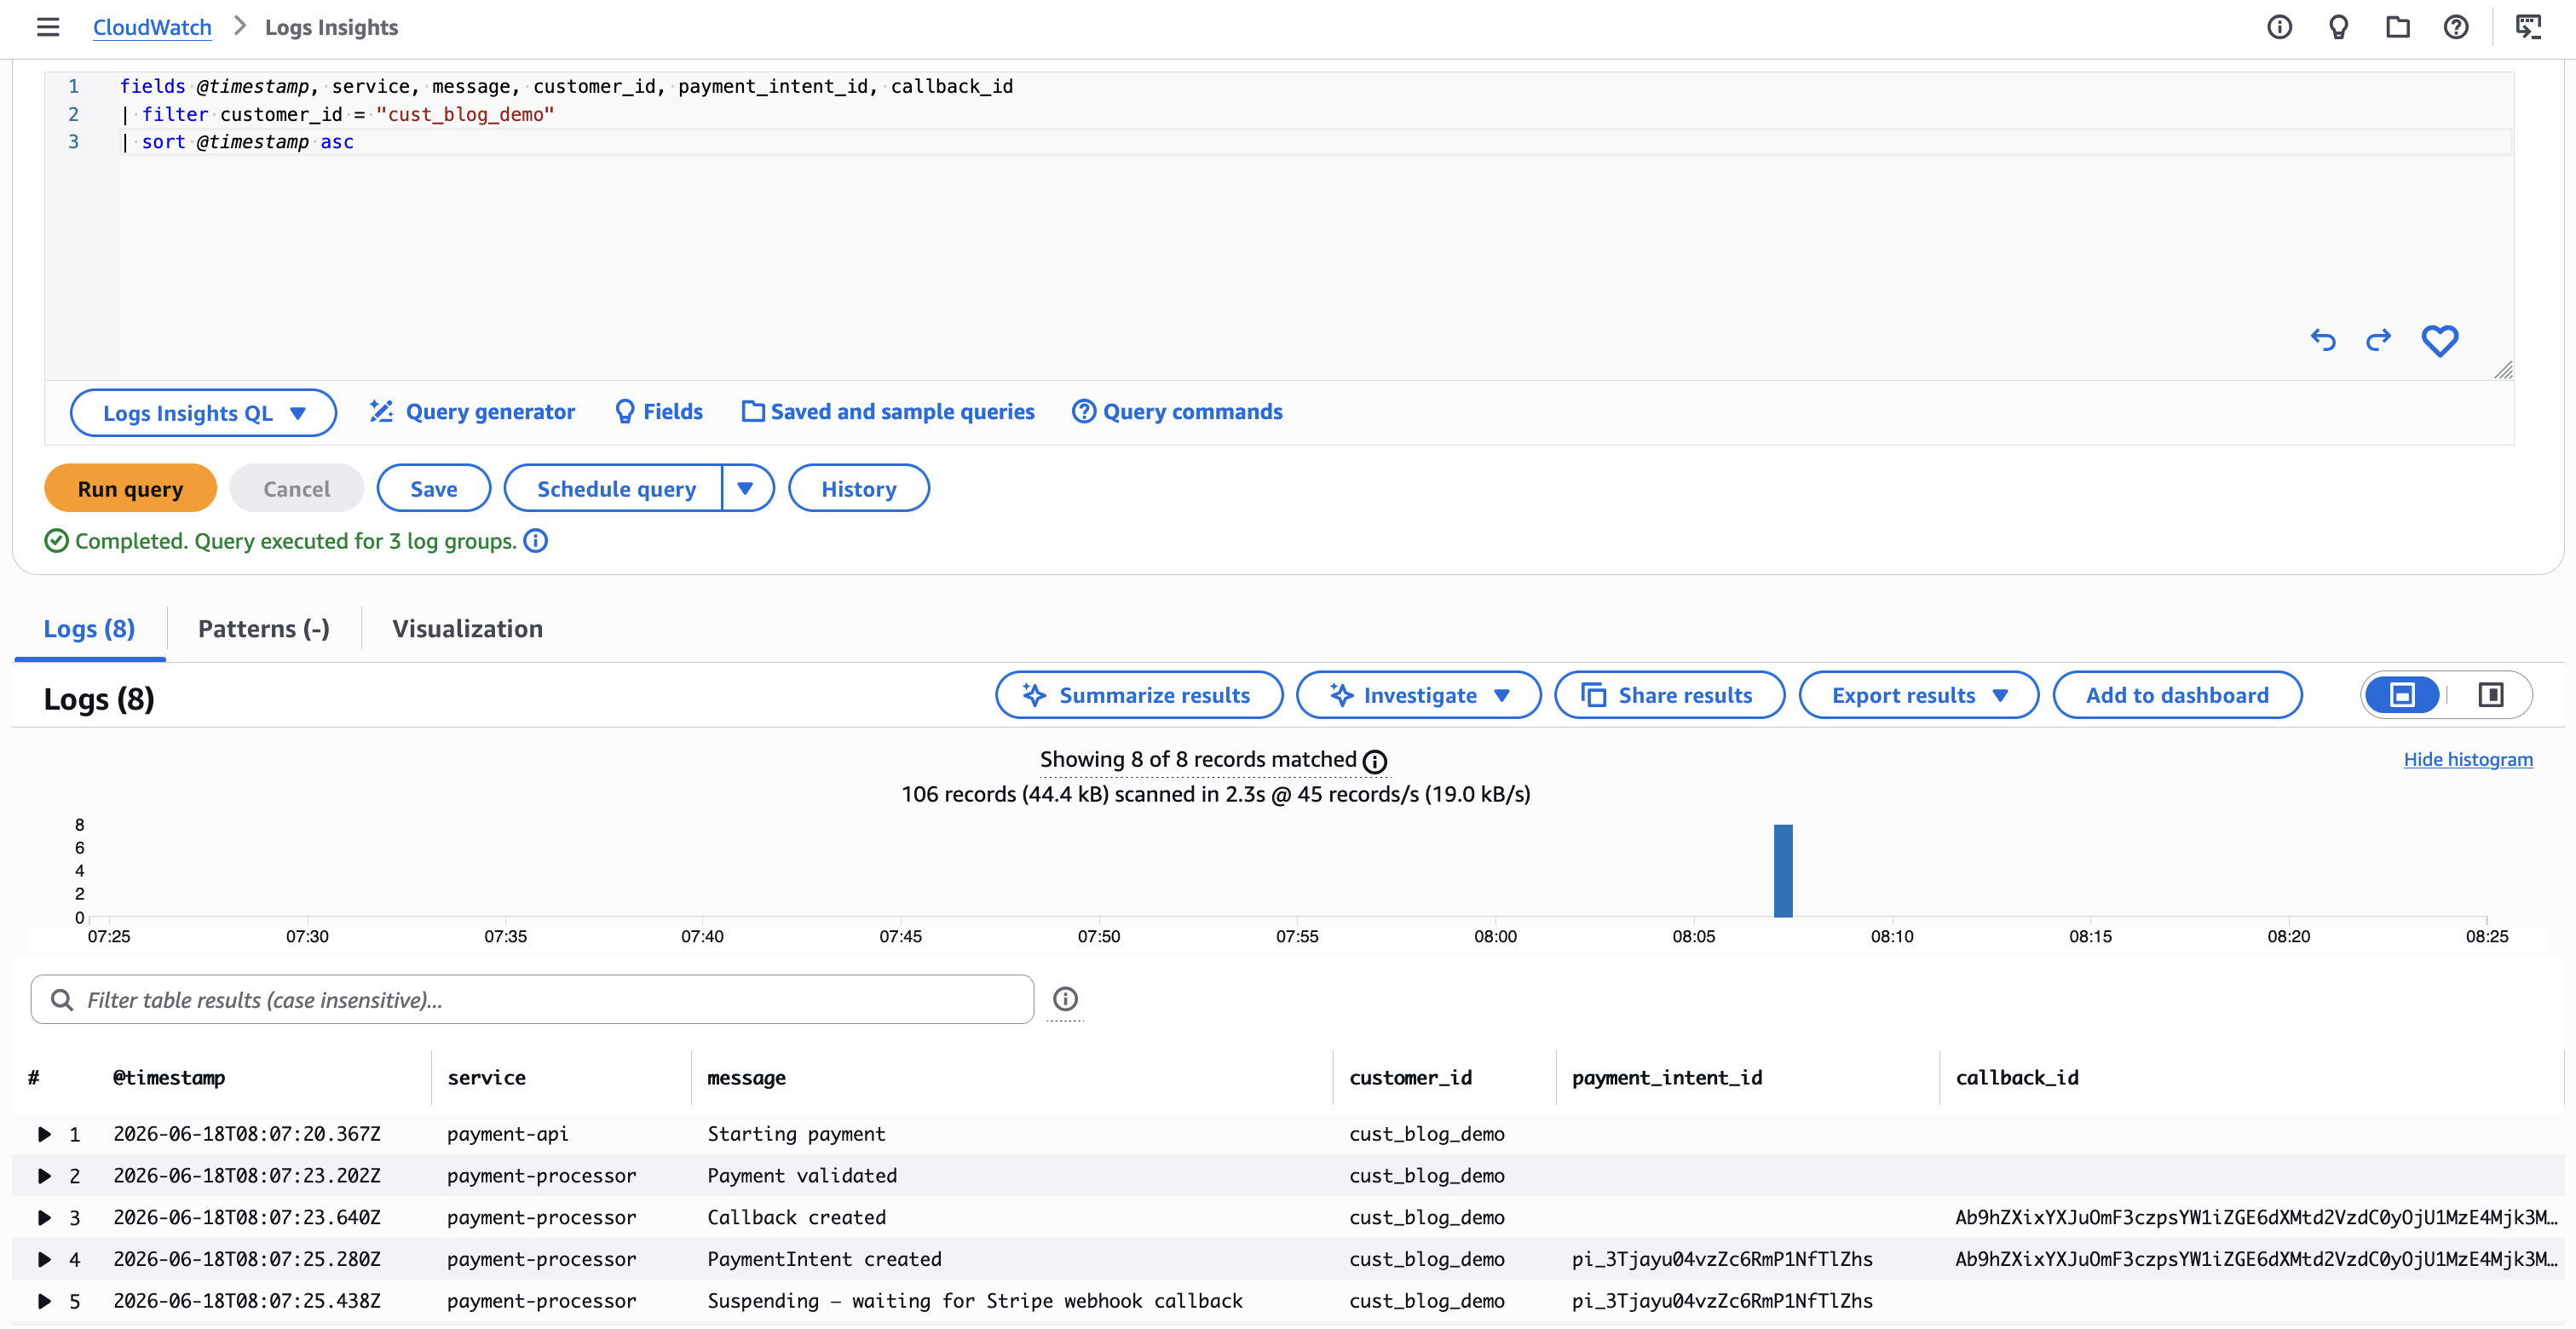
Query across all three log groups for a single payment:

fields @timestamp, service, message, customer_id, payment_intent_id, callback_id
| filter payment_intent_id = "pi_3TJafD04vzZc6RmP0RrCWhix"
| sort @timestamp asc
CloudWatch Logs Insights query showing the timeline of a single payment across payment-api, payment-processor, and stripe-webhook

Figure 4: CloudWatch Logs Insights query showing the timeline of a single payment across payment-api, payment-processor, and stripe-webhook

Durable steps and X-Ray annotations

The SDK’s @durable_step decorator checkpoints each step. If the function crashes and replays, completed steps return their cached result without re-executing. We combine this with Powertools Tracer to add searchable X-Ray annotations at each business-critical point:

from aws_durable_execution_sdk_python import StepContext, durable_step

@durable_step
@tracer.capture_method
def create_stripe_payment_intent(step_context: StepContext, payment: dict, callback_id: str) -> dict:
    tracer.put_annotation("callback_id", callback_id)
    tracer.put_annotation("customer_id", payment["customer_id"])

    try:
        intent = stripe.PaymentIntent.create(
            amount=payment["amount"], currency=payment["currency"],
            payment_method=payment["payment_method_id"], confirm=True,
            metadata={"callback_id": callback_id},
            automatic_payment_methods={"enabled": True, "allow_redirects": "never"},
            ...
        )
    except stripe.error.CardError as exc:
        # Hard declines (e.g. pm_card_chargeDeclined) raise synchronously. Return a
        # structured decline so the step doesn't retry and fail the whole execution.
        ...
        metrics.add_metric(name="PaymentDeclinedAtCreate", unit=MetricUnit.Count, value=1)
        return {"declined": True, ...}  # decline_code, error_message, payment_intent_id

    metrics.add_metric(name="PaymentIntentCreated", unit=MetricUnit.Count, value=1)
    ...
    return {"payment_intent_id": intent.id, "status": intent.status}

Note: The preceding code is abbreviated for readability. Refer to the GitHub repository for the complete code. The main durable handler runs within a FacadeSegment X-Ray context that does not support put_annotation(). Annotations work normally inside @durable_step functions. In the main handler, use a try/except wrapper if you need annotations outside of steps.

Note: When calling PaymentIntent.create with confirm=True, some cards decline synchronously (no webhook fires). The deployed code handles this by detecting the decline in the step return value and skipping the callback suspension, preventing an indefinite wait.

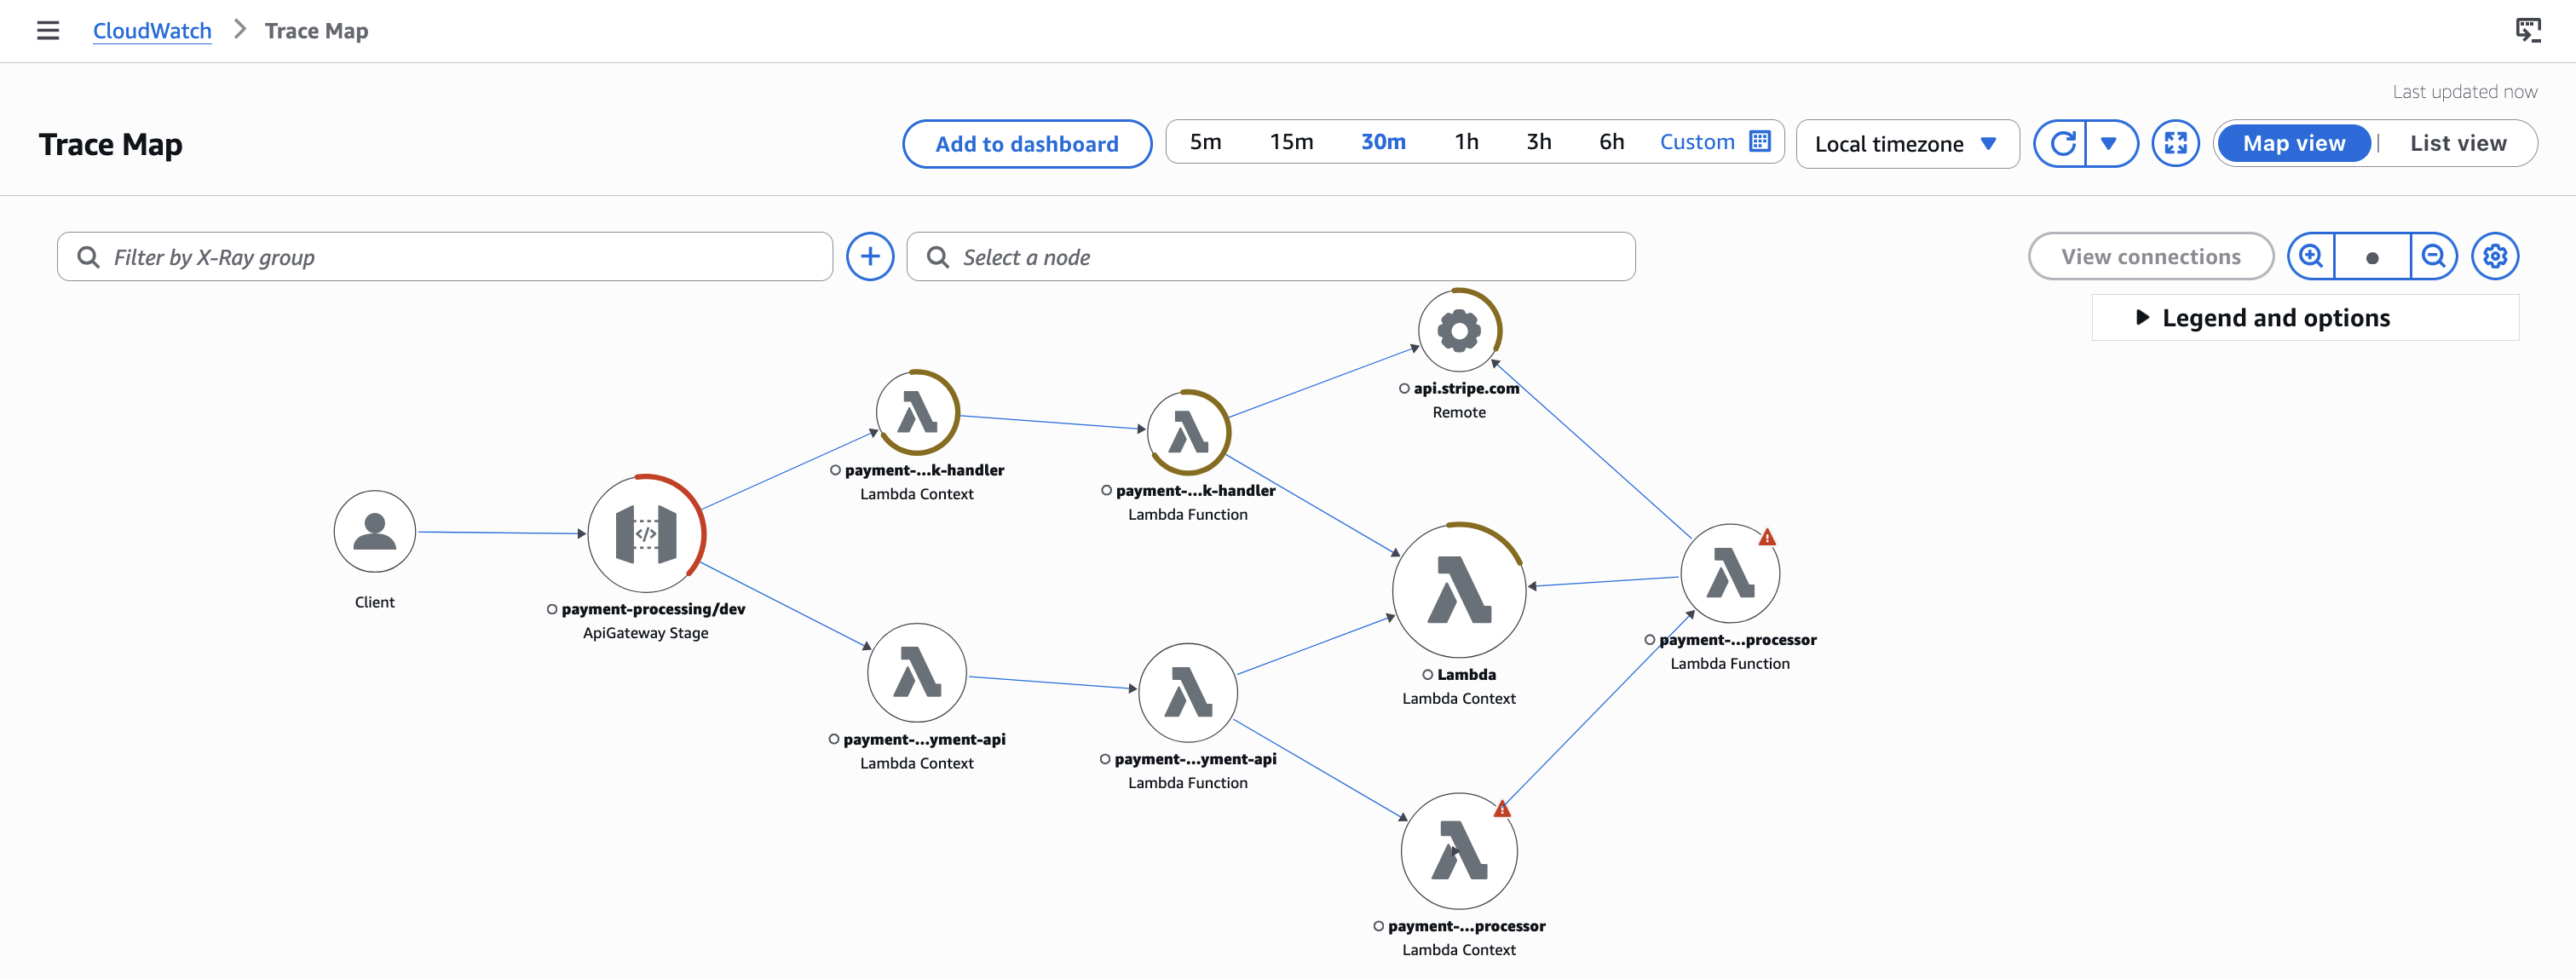
The X-Ray Service Map shows the complete request flow: API Gateway to payment-api to payment-processor, and the separate webhook path from API Gateway to stripe-webhook.

X-Ray Service Map showing API Gateway connected to payment-api and stripe-webhook, with payment-api connected to payment-processor

Figure 5: X-Ray Service Map showing API Gateway connected to payment-api and stripe-webhook, with payment-api connected to payment-processor

Durable executions tab

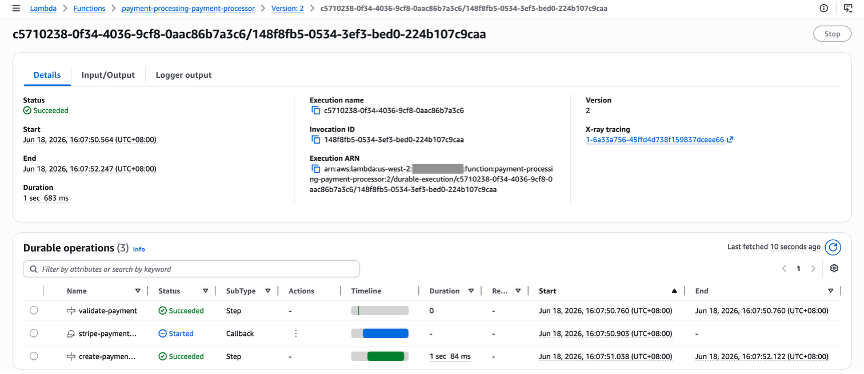
The Lambda console provides a built-in Durable executions tab showing each execution’s step-by-step timeline, including the callback wait state. You can see which steps completed, where the function suspended, and when (or if) the callback arrived.

Lambda console Durable executions tab showing a completed execution with steps: validate-payment succeeded, create-payment-intent succeeded, stripe-payment-result callback received, and final result succeeded

Figure 6: Lambda console Durable executions tab showing a completed execution with steps: validate-payment succeeded, create-payment-intent succeeded, stripe-payment-result callback received, and final result succeeded

Putting it together: debugging real failure modes

The following three scenarios demonstrate how all of these observability layers work together. You can reproduce each one from the demo checkout page.

Scenario 1: Webhook never arrives

A customer reports that their payment was charged but they never received a confirmation.

1. Alarm fires. The PaymentTimeoutAlarm triggers, indicating a durable execution timed out waiting for a callback.

2. Check the dashboard. The Payment Outcomes widget shows a spike in PaymentTimeout. The End-to-End Flow Metrics widget reveals the drop-off: PaymentIntentCreated count is higher than WebhookReceived, meaning the webhook never arrived.

3. Query logs. Search Amazon CloudWatch Logs Insights for the timed-out payment:

fields @timestamp, service, message, payment_intent_id, callback_id
| filter message = "Payment timed out"
| sort @timestamp desc
| limit 5

This returns the payment_intent_id of the timed-out payment.

4. Cross-reference the webhook handler. Search for that payment_intent_id in the webhook handler logs. No results means Stripe never delivered the webhook. Results with WebhookSignatureFailure mean the webhook secret is misconfigured.

5. Inspect the X-Ray trace. Filter traces by the payment_intent_id annotation. The trace shows the durable function start but no corresponding webhook handler span, confirming the webhook never arrived.

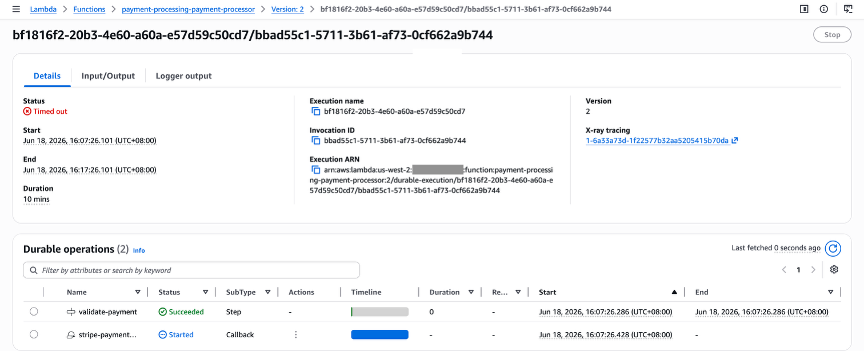
6. Check the durable executions tab. The execution shows validate-payment and create-payment-intent as succeeded, with the stripe-payment-result callback in a timed-out state.

Durable executions tab showing the timed-out execution: validate-payment succeeded, create-payment-intent succeeded, stripe-payment-result callback timed out

Figure 7: Durable executions tab showing the timed-out execution: validate-payment succeeded, create-payment-intent succeeded, stripe-payment-result callback timed out

Within minutes, you have identified the root cause (the Stripe webhook endpoint was misconfigured) without adding a single debug statement or redeploying code.

Scenario 2: The whole workflow runs too long

The callback timeout in Scenario 1 is a per-callback bound (5 minutes in this example). There is also an outer bound: DurableConfig.ExecutionTimeout (600 seconds), which caps the total wall-clock time of the whole execution. If you set a callback to wait an hour but the overall ExecutionTimeout is 10 minutes, the execution itself terminates first. This shows up as a distinct terminal state in the durable executions tab, on the Durable Execution State widget, and as its own alarm (DurableExecutionTimedOutAlarm).

Choose the “Simulate timeout (no webhook)” option on the demo checkout page to reproduce this. The durable function skips the Stripe call, suspends on a long-timeout callback, and lets ExecutionTimeout catch it. The dashboard distinguishes the two failure modes cleanly: per-callback timeouts show up on the custom Payment Outcomes widget as PaymentTimeout. Whole-execution timeouts appear on the built-in Durable Execution State widget alongside started/succeeded/failed counts. This distinction matters operationally because the remediation is different: callback timeouts point to external system issues (Stripe), while execution timeouts point to configuration issues (your timeout values).

Scenario 3: Customer abandons checkout

Real checkout flows have a third outcome: the customer cancels while the durable function is still suspended. The demo wires this up to StopDurableExecution, which terminates the in-flight execution and surfaces on the same Durable Execution State widget as a separate terminal state.

Choose “Simulate timeout” and then “Cancel Payment” on the demo page to see this happen. Looking at the dashboard after running all three scenarios, the execution-state widget tells the full story: started, succeeded, failed, timed-out, and stopped. Each state answers a different operational question about what is happening to your workflows.

Conclusion

In this post, we walked through observability best practices for Lambda durable functions using a Stripe payment processing pipeline. Callbacks can time out, whole executions can expire, and running workflows can be canceled. Each shows up as a distinct terminal state, and each deserves its own alarm. Layering custom business metrics, structured logging with correlation keys, X-Ray annotations, and the durable executions tab on top of the built-in CloudWatch metrics gives you a clear picture of where in the lifecycle any given execution is. It also reveals where in the business funnel any failure occurred.

Deploy the payment processing application from the GitHub repository and try the three demo scenarios to see the dashboards, alarms, and execution history in your own account. For core concepts, see Lambda durable functions. For the durable execution SDK, see the Python SDK, JavaScript SDK, and Java SDK. Browse Serverless Land for reference architectures.
Testing Step Functions workflows: a guide to the enhanced TestState API

Post Syndicated from D Surya Sai original https://aws.amazon.com/blogs/compute/testing-step-functions-workflows-a-guide-to-the-enhanced-teststate-api/

AWS Step Functions recently announced new enhancements to local testing capabilities for Step Functions, introducing API-based testing that developers can use to validate workflows before deploying to AWS. As detailed in our Announcement blog post, the TestState API transforms Step Functions development by enabling individual state testing in isolation or as complete workflows. This supports mocked responses and actual AWS service integrations, and provides advanced capabilities. These capabilities include Map/Parallel states, error simulation with retry mechanisms, context object validation, and detailed inspection metadata for comprehensive local testing of your serverless application.

The TestState API can be accessed through multiple interfaces such as AWS Command Line Interface (AWS CLI), AWS SDK, LocalStack. By default, TestState API in AWS CLI and SDK runs against the remote AWS endpoint, providing validation against the actual Step Functions service infrastructure. We’ve partnered with LocalStack to offer an additional testing endpoint for the TestState API. Developers can use LocalStack for unit testing their workflows by changing the AWS SDK client endpoint configuration to point to LocalStack: http://localhost.localstack.cloud:4566/ instead of AWS endpoint. This approach provides complete network isolation when needed. For a streamlined development experience, you can also use the LocalStack VSCode extension to automatically configure your environment to point to the LocalStack endpoint. This approach is detailed in the AWS blog post.

This blog post demonstrates building test suites to unit test your Step Functions workflows using the AWS SDK for Python using the pytest framework. The complete implementation is available in the GitHub repository.

Building test cases using the TestState API

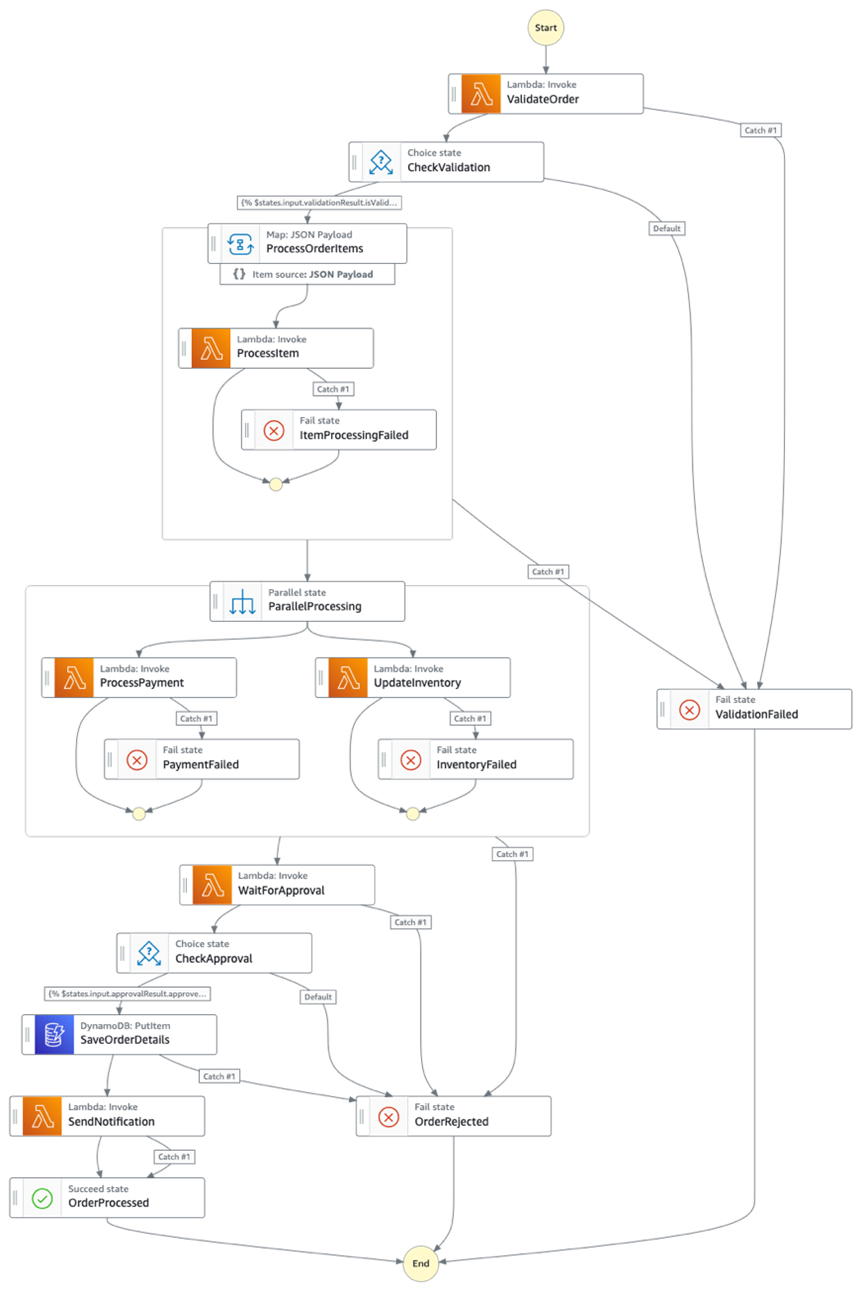
This example workflow implements a real-world ecommerce order processing system using JSONata for advanced data transformations. It incorporates complex Step Functions patterns including distributed Map states, Parallel execution, and waitForTaskToken callback mechanisms. The process validates orders through AWS Lambda functions, distributes order item processing with configurable failure tolerance, runs parallel payment and inventory updates, handles human approval workflows using task tokens, then persists orders in Amazon DynamoDB with notification delivery. This workflow demonstrates advanced error handling with multiple Catchers and Retriers, exponential backoff for Lambda throttling and DynamoDB limits, and sophisticated state transitions that were previously challenging to test locally. This makes it the recommended choice for demonstrating the use of enhanced TestState API’s local testing features.

The complete workflow is available in the GitHub repository, where you can examine the full state machine definition and see how JSONata expressions handle data transformation throughout the execution flow.

Figure 1: State machine workflow that demonstrates a real-world ecommerce order processing system.

Figure 1: State machine workflow that demonstrates a real-world ecommerce order processing system.

Effective Step Functions testing requires a systematic approach to TestState API integration that provides state validation, error simulation, and assertion capabilities. The testing framework is built using Python’s pytest framework, using fixtures to automatically provide pre-configured runner instances that handle TestState API client initialization and state machine definition loading. This eliminates repetitive setup code and provides consistent test environments. The enhanced TestState API supports both mock integrations and actual integrations with AWS services, providing flexibility in testing strategies. For this demonstration, you use mock integrations to showcase how a complete local testing can be achieved without having any resources deployed to AWS accounts.

This framework is built for demonstration purposes, and you can similarly build your own testing frameworks using other programming languages like Java, Node.js. The testing framework uses method chaining patterns to create readable test cases with comprehensive assertion methods, automatic output chaining between state executions, and error simulation for testing retry mechanisms, backoff intervals, and catch blocks across AWS service error conditions.

The following test implementations demonstrate the testing capabilities that are achievable with the enhanced TestState API in local development environments. The test cases are run against the preceding Statemachine.

Test Case 1: Lambda throttling and retry mechanism testing

Service integrations with Statemachines like AWS Lambda, Amazon DynamoDB may face throttling depending on their usage. A key capability of the enhanced TestState API is its ability to simulate retry mechanisms with control over retry counts and backoff intervals. This test demonstrates the enhanced TestState API’s retry testing capabilities through the stateConfiguration.retrierRetryCount parameter and inspectionData.errorDetails response fields. This response field provides retryBackoffIntervalSeconds for validating exponential backoff calculations, retryIndex for tracking retry attempt sequences, and catchIndex for identifying which error handler processed the exception. These enhanced inspection capabilities enable validation of retry logic, backoff strategies, and error propagation patterns across complex state machine workflows.

def test_lambda_throttling_retry_mechanism(self, runner):
"""Test retry mechanism for Lambda.TooManyRequestsException"""
throttling_error = {
"Error": "Lambda.TooManyRequestsException",
"Cause": "Request rate exceeded"
}

# Test first retry attempt
(runner
.with_input({"orderId": "order-retry-test"})
.with_mock_error(throttling_error)
.with_retrier_retry_count(0)
.execute("ValidateOrder")
.assert_retriable()
.assert_error("Lambda.TooManyRequestsException"))

# Verify exponential backoff calculation
response = runner.get_response()
error_details = response['inspectionData']['errorDetails']
assert error_details['retryBackoffIntervalSeconds'] == 2

# Test retry exhaustion
(runner
.with_retrier_retry_count(3)
.execute("ValidateOrder")
.assert_caught_error()
.assert_next_state("ValidationFailed"))

Test Case 2: Map state testing with tolerance thresholds

Distributed Map states present unique testing challenges due to their parallel processing nature and failure tolerance capabilities. The enhanced TestState API provides specialized configuration options for testing these complex scenarios.

def test_map_state_tolerated_failure_threshold(self, runner):
"""Test Map state with tolerated failure threshold"""
test_input = {
"orderId": "order-map-test",
"orderItems": [
{"itemId": "item-1"}, {"itemId": "item-2"}, 
{"itemId": "item-3"}, {"itemId": "item-4"}
]
}

# Test normal Map state execution
map_success_result = [
{"itemId": "item-1", "processed": True},
{"itemId": "item-2", "processed": True}
]

(runner
.with_input(test_input)
.with_mock_result(map_success_result)
.execute("ProcessOrderItems")
.assert_succeeded()
.assert_next_state("ParallelProcessing"))

# Test tolerance threshold exceeded scenario
tolerance_error = {
"Error": "States.ExceedToleratedFailureThreshold",
"Cause": "Map state exceeded tolerated failure threshold"
}

(runner
.with_input(test_input)
.with_mock_error(tolerance_error)
.execute("ProcessOrderItems")
.assert_caught_error()
.assert_next_state("ValidationFailed"))

This test demonstrates the enhanced TestState API’s Map state testing capabilities through the stateConfiguration.mapIterationFailureCount parameter for simulating iteration failures. The API provides comprehensive inspection data including inspectionData.afterItemSelector for validating ItemSelector transformations, inspectionData.afterItemBatcher for batch processing validation, inspectionData.toleratedFailureCount and inspectionData.toleratedFailurePercentage for threshold verification. When the specified failure count exceeds the configured tolerance, the API correctly returns States.ExceedToleratedFailureThreshold, enabling testing of Map state resilience patterns.

Test Case 3: WaitForCallback pattern testing

The waitForCallback integration requires context object construction to simulate realistic execution environments, particularly for human approval workflows.

def test_context_object_usage_in_jsonata_expressions(self, runner):
"""Test Context object usage in waitForTaskToken scenarios"""
test_input = {
"orderId": "order-context-test",
"amount": 125.0
}

context_data = {
"Task": {"Token": "ahbdgftgehbdcndsjnwjkhas327yr4hendc73yehdb723y"},
"Execution": {
"Id": "arn:aws:states:us-east-1:123456789012:execution:test:exec-123"
},
"State": {
"Name": "WaitForApproval",
"EnteredTime": "2025-01-15T10:45:00Z"
}
}

mock_result = {
"approved": True,
"taskToken": "ahbdgftgehbdcndsjnwjkhas327yr4hendc73yehdb723y"
}

(runner
.with_input(test_input)
.with_context(context_data)
.with_mock_result(mock_result)
.execute("WaitForApproval")
.assert_succeeded()
.assert_next_state("CheckApproval"))

# Verify JSONata expressions processed context correctly
response = runner.get_response()
after_args = json.loads(response['inspectionData']['afterArguments'])
assert after_args['Payload']['taskToken'] == context_data['Task']['Token']

This test demonstrates the enhanced TestState API’s support for waitForCallback integrations through the `context` parameter for realistic Context object simulation. The API enables comprehensive testing of JSONata expressions that reference $states.context.Task.Token, $states.context.Execution.Id, and other context fields. The inspectionData.afterArguments response field validates that JSONata expressions correctly processed the context data, while the API automatically handles the complexity of task token embedding in service integration payloads for waitForCallback testing scenarios.

Test Case 4: Happy path testing – complete workflow validation

Happy path testing validates that workflows execute correctly under normal operating conditions. The enhanced TestState API allows you to chain state executions together, automatically passing outputs between states to simulate a complete workflow execution.

def test_complete_order_processing_workflow(self, runner):
"""Integration test: Complete happy path workflow using method chaining"""
test_input = {
"orderId": "order-12345",
"amount": 150.75,
"customerEmail": "[email protected]",
"orderItems": [
{"itemId": "item-1", "quantity": 2, "price": 50.25}
]
}

# Test ValidateOrder state
(runner
.with_input(test_input)
.with_mock_result({"statusCode": 200, "isValid": True})
.execute("ValidateOrder")
.assert_succeeded()
.assert_next_state("CheckValidation"))

# Test CheckValidation choice state (no mock needed)
validation_output = runner.get_output()
(runner
.with_input(validation_output)
.clear_mocks()
.execute("CheckValidation")
.assert_succeeded()
.assert_next_state("ProcessOrderItems"))

This test demonstrates how the TestState API maintains state context between executions, enabling realistic workflow simulation. The get_output() method retrieves the processed output from one state to use as input for the next, mimicking actual Step Functions execution behavior.

Note: The code snippet above shows only the first two states of the complete workflow test for brevity. The full test code with all states (ProcessOrderItems, ParallelProcessing, WaitForApproval, CheckApproval, SaveOrderDetails, and SendNotification) can be viewed in the complete GitHub repository, demonstrating end-to-end workflow validation using the same method chaining pattern.

Integration with modern CI/CD pipelines

In this section, we will explore how to integrate the previous unit tests in a CI CD pipeline to enable local testing.

The sample repository includes a GitHub Actions workflow that demonstrates how TestState API testing integrates into continuous integration and continuous delivery (CI/CD) pipelines. The workflow (.github/workflows/test-and-deploy.yml) provides a two-step process that validates before any AWS resources are deployed using AWS Serverless Application Model (AWS SAM).

The CI/CD pipeline follows the following pattern:

  1. Unit Tests: Executes the complete TestState API test suite using pytest tests/unit_test.py -v
  2. SAM Deploy: Deploys AWS resources using sam build and sam deploy

To enable the GitHub Actions workflow to deploy resources to your AWS account, configure these AWS credentials in your GitHub repository settings. For detailed setup instructions, see the AWS blog post.

Following are the required secrets to be configured in GitHub repository settings:

  • AWS_ACCESS_KEY_ID
  • AWS_SECRET_ACCESS_KEY
  • AWS_REGION

In production environments, you can typically extend this basic pipeline to include additional stages. The enhanced pipeline often begins with deploying to a development account first, followed by integration testing against deployed resources. The final stage involves moving to production with proper approval gates and security scanning compliance checks.

Conclusion

The enhanced TestState API enables testing Step Functions workflows locally without requiring AWS deployments that accelerated development cycles, and reduce testing times. This post demonstrates how to implement testing for state types including Map states with tolerance thresholds, retry mechanisms with exponential backoff, and waitForTaskToken patterns with context object simulation using mock integrations for isolated testing.

By integrating TestState API testing into CI/CD pipelines, you can validate workflow logic before deployment, reducing the risk of production issues. The GitHub Actions workflow example demonstrates an implementation that runs tests and deploys resources in a controlled sequence. The complete code examples and testing framework are available in the GitHub repository to implement similar testing practices for Step Functions workflows.