All posts by Dorothy Li

Convoy uses Amazon QuickSight to help shippers and carriers improve efficiency and save money with data-driven decisions

Post Syndicated from Dorothy Li original https://aws.amazon.com/blogs/big-data/convoy-uses-amazon-quicksight-to-help-shippers-and-carriers-improve-efficiency-and-save-money-with-data-driven-decisions/

Convoy is the leading digital freight network in the United States. We move millions of truckloads around the country through our connected network of carriers, saving money for shippers, increasing earnings for drivers, and eliminating carbon waste for our planet. In 2015, Convoy started a movement toward efficient freight. We build technology to find smarter ways to connect shippers with carriers while solving some of the toughest problems that result in waste in the freight industry.

As a digital freight network, Convoy uses machine learning and automation to efficiently connect shippers and carriers. As our marketplace grows, it creates a flywheel effect that benefits both sides. As more shippers join the network, drivers have better options, fewer empty miles, and fewer wasted hours, allowing them to earn more per day. As more carriers join the network, capacity increases and shippers see lower costs and higher service quality. Convoy is on a mission to transport the world with endless capacity and zero waste.

Our digital freight network collects thousands of disparate data points and intelligently connects the dots to provide transparent visibility into freight operations. By providing transparency and insights into every step of the shipment lifecycle, shippers benefit from lower costs, reduced waste, and higher carrier loyalty. To surface these insights to customers inside our product, we needed a business intelligence (BI) tool that could not only handle our volume of data, but could provide at-a-glance insights through a user-friendly interface, empowering our customers to make data-driven decisions, and taking the guesswork out of resolving unexpected issues.

After reviewing our options and evaluating which would best meet our needs, we turned to Amazon QuickSight.

In this post, we discuss how QuickSight is helping us serve our customers with the insights they need, and why we consider this business decision a win for Convoy.

From disparate data points to at-a-glance insights

Our vast network of small carriers and owner-operators, totaling more than 400,000 trucks nationwide, provides meaningful data points through the Convoy app. We require carriers to use our app when hauling loads—this is how we provide GPS tracking on 95% of live loads and 100% of drop loads. It’s also how we collect robust data around dwell times, detention costs, and more. To date, we’ve captured more than 2.7 million facility reviews in the Convoy app.

We chose QuickSight because we needed ease in development. We wanted to be able to quickly build dashboards and get them in the hands of our customers. Because this is an externally facing tool, we had data privacy and governance requirements to consider as well. Especially important was that we needed granularity in row-level security. QuickSight provided what we needed out of the box, whereas the other BI platforms we considered did not. Additionally, QuickSight’s pricing would allow us to scale the platform as our user base continues to grow.

Connecting the dots with data

The challenges facing our customers are as varied as the landscapes our carriers travel through every day. From managing delays due to weather, traffic, and unpredictable load times on the carrier’s end, to lacking freight visibility and root causes of operational issues and inaccuracies in manual reporting on the shipper’s end, there is no shortage of opportunities to improve the status quo.

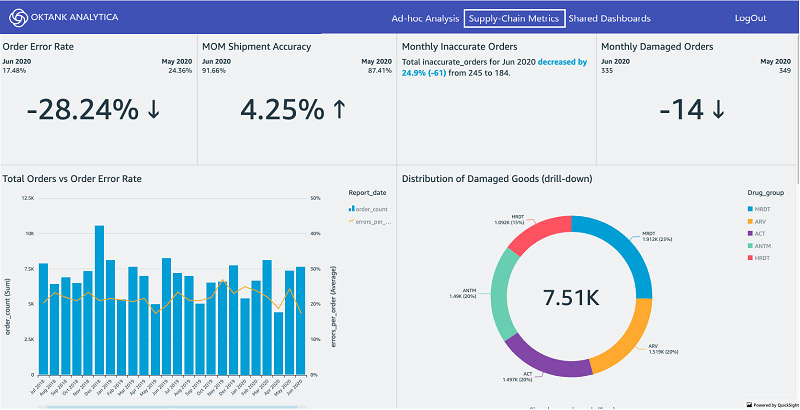
The following screenshot shows performance metrics, like dwell time and incidentals per shipment, plus breakouts that show incidental types and categories for each facility.

Convoy facilities dashboard showing QuickSight BI

Where we strive to meet the needs of both shippers and carriers, we’re in a unique position to connect the dots to identify gaps on one end that have corresponding inputs on the other. The challenges shippers face are often driven by pricing, complexity, and reliability of transporting goods. For carriers, their challenges are more centered on earning predictable and consistent income with the least amount of time and effort invested in finding loads, building schedules, and adjusting to delays. Our customers have sophisticated internal analytics programs, but highly granular data or synthesized data from their vendors is rare. Finding ways to develop metrics and benchmarks for specific business entities (lanes, regions, facilities, and so on) meant we would need to learn and update our products quickly. QuickSight allows us to do that.

With so many data points and opportunities to turn them into key insights, the dashboards and visualizations QuickSight provides makes spotting trends and taking proactive measures to get ahead of minor issues before they become major problems easier than ever.

When reviewing our BI options, the following factors were front and center in our decision to go with QuickSight:

  • Pace of development – We wanted to deliver insights to our customers quickly. The seamless integration of QuickSight with other AWS services had our dashboards up and running in no time.
  • Secure access to data – With row-level authorization, QuickSight gives us the flexibility we need, along with the peace of mind knowing the data is secure.
  • Scalable cost model – The QuickSight pricing model suits our needs, allowing us to scale based on usage.

When we first piloted our external insights product, we built a prototype with our previously used BI tool. Building future iterations with this same tool wasn’t feasible because it lacked functionality in several key areas. We needed to be able to join data from multiple sources, drill down into layers of data, and customize data based on the user accessing the information. In addition, because we were self-hosting, the overhead of scaling our footprint was going to be high. We did consider other solutions, but QuickSight was best able to offer all the features we needed, at the best price.

Visibility improves efficiency

With QuickSight, we were able to build an external-facing product for our shipper customers, helping them gain visibility into the health of their supply chain, which could then provide insights to make things run more efficiently.

The following screenshot shows incidentals, broken out by spend, type or category, and more.

Convoy dashboard showing QuickSight BI

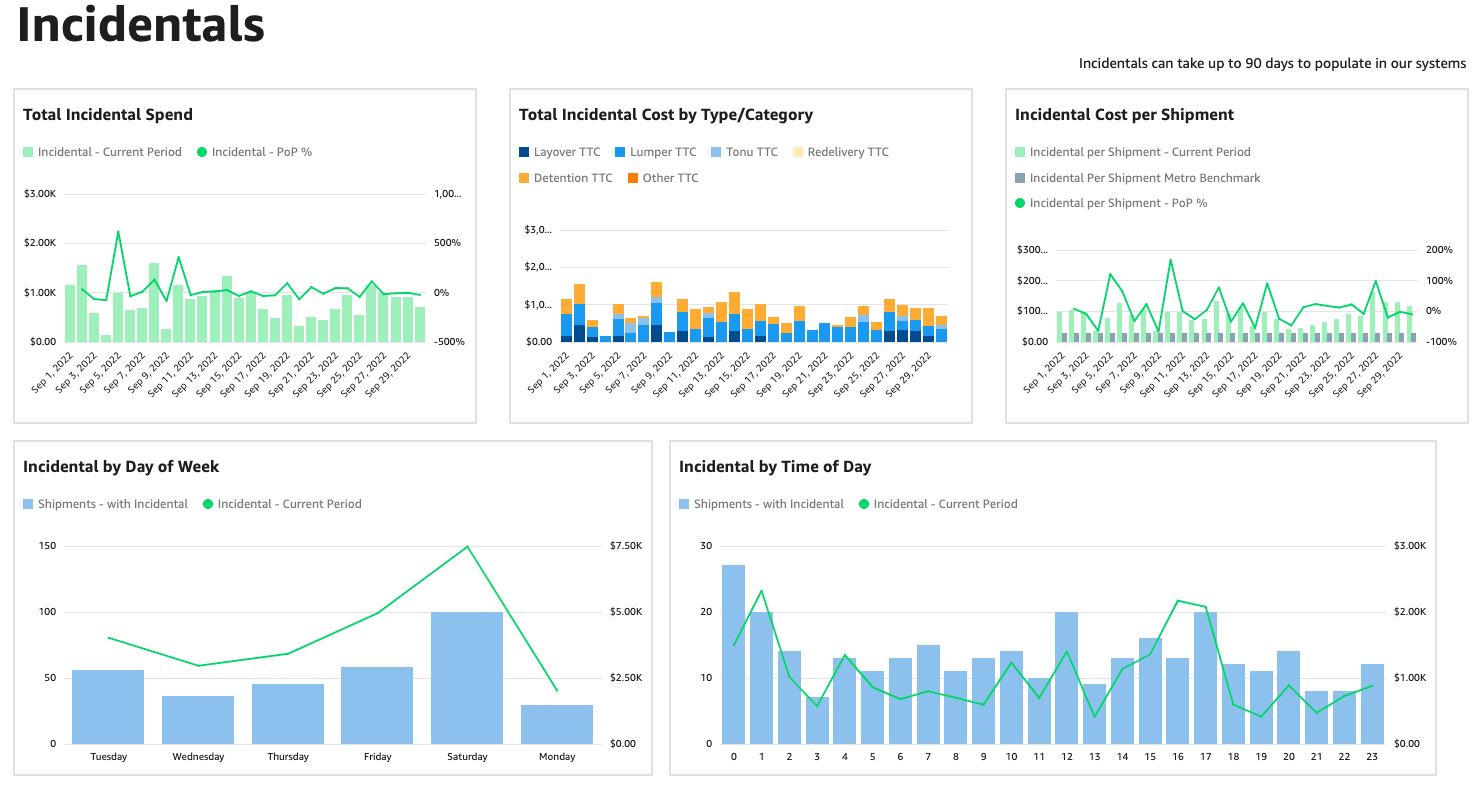
With a visualization of how incidental costs break down, for example, they can see the cost of having a truck unloaded at a facility, the cost of canceling loads on a driver, the cost of having travers waiting at a facility, and more. With that visibility, our shipper customers can now begin to address systemic issues that can save them money, such as improving scheduling to reduce driver wait times.

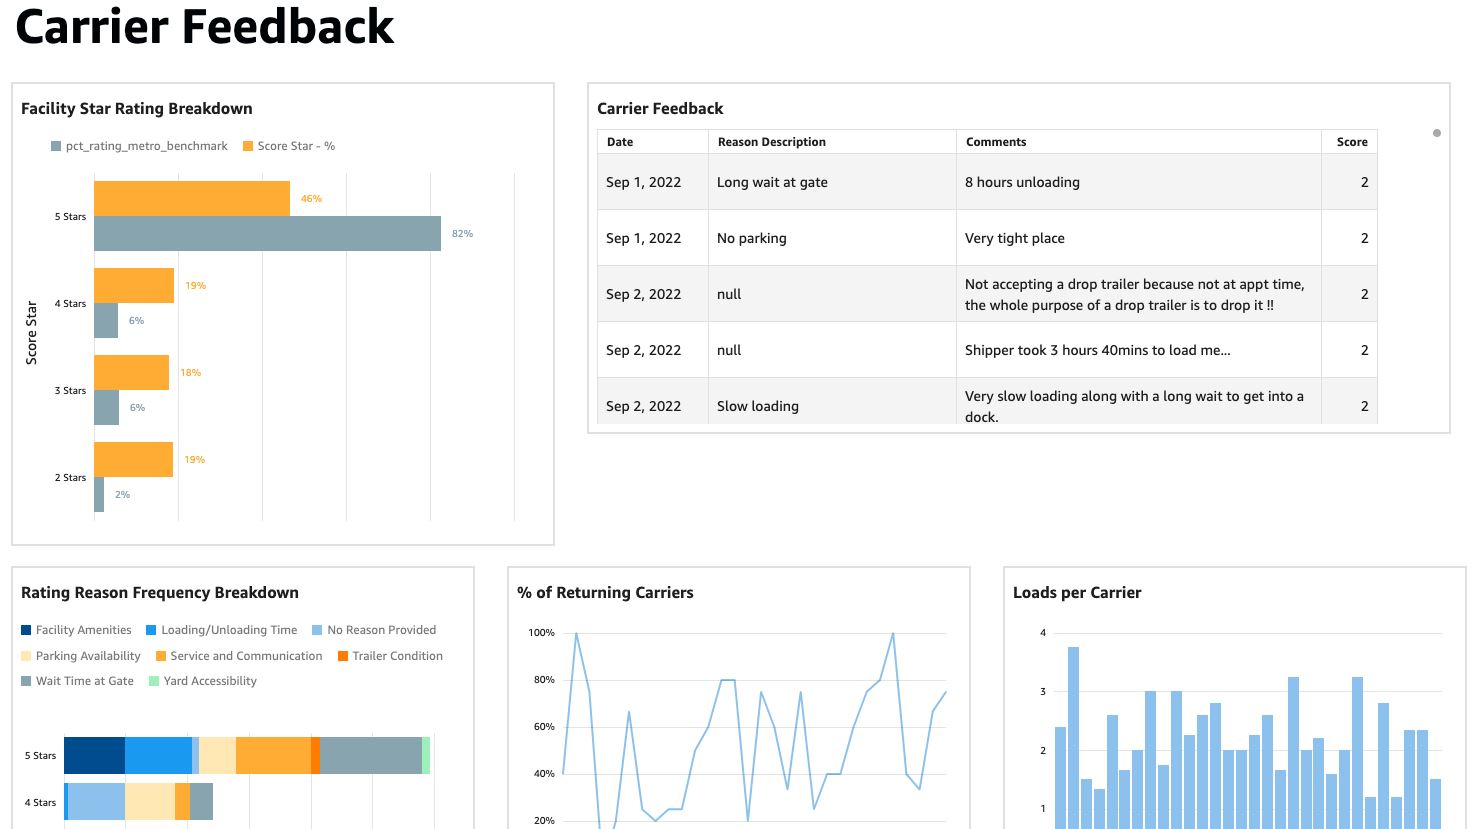
The following screenshot shows a visualization on carrier feedback, which shippers could use to make improvements that provide a faster, smoother experience.

Convoy dashboard showing QuickSight BI

Future plans with partnering team expansions

They say that imitation is the purest form of flattery. Although that phrase is often used in the context of competitors who develop products and services that are suspiciously similar to an existing product or service, it can also apply to when good ideas are duplicated within an organization. That’s the case for us, in that our QuickSight adoption has drawn the attention and curiosity of partnering teams, who have reached out to us to understand our implementation specifics and the successes we’ve seen as a result.

We’re very happy with our QuickSight Embedded experience and look forward to continuing to iterate and expand its use for additional customer profiles and use cases.

To learn more about how you can embed customized data visuals, interactive dashboards, and natural language querying into any application, visit Amazon QuickSight Embedded.


About the Author

Dorothy Li is Convoy’s CTO, overseeing Convoy’s Product and Engineering group and technology strategy, shaping and scaling the company’s innovation and industry-defining technology platforms. Prior to Convoy, Dorothy held leadership roles at Amazon, most recently as Vice President of BI and Analytics at AWS. During her more than 20 years at Amazon, Dorothy helped build out Amazon’s ecommerce platform and also led and collaborated on products that had visibly impacted customers around the world – from the initial launch of Amazon Prime, to Kindle, and at AWS where she focused on data analytics and BI. Dorothy received her Bachelor of Science at Brigham Young University and studies at Shanghai International Studies University.

Bringing the power of embedded analytics to your apps and services with Amazon QuickSight

Post Syndicated from Dorothy Li original https://aws.amazon.com/blogs/big-data/bringing-the-power-of-embedded-analytics-to-your-apps-and-services-with-amazon-quicksight/

In the world we live in today, companies need to quickly react to change—and to anticipate it. Customers tell us that their reliance on data has never been greater than what it is today. To improve your decision-making, you have two types of data transformation needs: data agility, the speed at which data turns into insights, and data transparency, the need to present insights to decision makers. Going forward, we expect data transformation projects to become a centerpiece in every organization, big or small.

Furthermore, applications are migrating to the cloud faster than ever. Applications need to scale quickly to potentially millions of users, have global availability, manage petabytes of data, and respond in milliseconds. Such modern applications are built with a combination of these new architecture patterns, operational models, and software delivery processes, and allow businesses to innovate faster while reducing risk, time-to-market, and total cost of ownership.

An emerging area from these two trends is to combine the power of application modernization with data transformation. This emerging trend is often called embedded analytics, and is the focus of this post.

The case for embedded analytics

Applications generate a high volume of structured and unstructured data. This could be clickstream data, sales data, data from IoT devices, social data, and more. Customers who are building these applications (such as software-as-a-service (SaaS) apps or enterprise portals) often tell us that their end-users find it challenging to derive meaning from this data because traditional business intelligence (BI) approaches don’t always work.

Traditional BI tools live in disparate systems and require data engineering teams to provide connectivity and continous integration with the application, adding to complexity and delays in the overall process. Even after the connectivity is built, you must switch back and forth between your application and the BI tool, causing frustration and decreasing the overall pace of decision-making. Customers tell us that their development teams are constantly looking for new ways to delight their users, and embedding the BI capability directly into their applications is one of the most requested asks from their end-users.

Given the strategic importance of this capability, you can use this to differentiate and up-sell as a new service in their applications. Gartner research demonstrates that 63% of CEOs expect to adopt a product-as-a-service model in the next two years, making this a major market opportunity. For example, if you provide financial services software, you can empower users to perform detailed analysis of portfolio performance trends. An HR solution might enable managers to visualize and predict turnover rates. A supply chain management solution could embed the ability to slice and dice KPIs and better understand the efficiency of logistics routes.

Comparing common approaches to embedded analytics

The approach to building an embedded analytics capability needs to deliver on the requirements of modern applications. It must be scalable, handle large amounts of data without compromising agility, and seamlessly integrate with the application’s user experience. Choosing the right methodology becomes especially important in the face of these needs.

You can build your own embedded analytics solution, but although this gives you maximum control, it has a number of disadvantages. You have to hire specialized resources (such as data engineers for building data connectivity and UX developers for building dashboards) and maintain dedicated infrastructure to manage the data processing needs of the application. This can be expensive, resource-intensive, and complex to build.

Embedding traditional BI solutions that are available in the market has limitations as well, because they’re not purpose-built for embedding use cases. Most solutions are server-based, meaning that they’re challenging to scale and require additional infrastructure setup and ongoing maintenance. These solutions also have restrictive, pay-per-server pricing, which doesn’t fully meet the needs of end-users that are consuming applications or portals via a session-based usage model.

A new approach to embedded analytics

At AWS re:Invent 2019, we launched new capabilities in Amazon QuickSight that make it easy to embed analytics into your applications and portals, empowering your customers to gain deeper insights into your application’s data. Unlike building your own analytics solution, which can be time-consuming and hard to scale, QuickSight allows you to quickly embed interactive dashboards and visualizations into your applications without compromising on the ability to personalize the look and feel of these new features.

QuickSight has a serverless architecture that automatically scales your applications from a few to hundreds of thousands of users without the need to build, set up, and manage your own analytics infrastructure. These capabilities allow you to deliver embedded analytics at hyperscale. So, why does hyperscale matter? Traditional BI tools run on a fixed amount of hardware resources, therefore more users, more concurrency, or more complex queries impact performance across all users, which requires you to add more capacity (leading to higher costs).

The following diagram illustrates a traditional architecture, which requires additional servers (and higher upfront cost) to scale.

With QuickSight, you have access to the power and scale of the AWS Cloud. You get auto scaled, consistent performance no matter the concurrency or scale of the userbase, and a truly pay-per-use architecture, meaning you only pay when your users access the dashboards or reports. The following diagram illustrates how QuickSight scales seamlessly with its serverless architecture, powered by the AWS cloud.

Furthermore, QuickSight enables your users to perform machine learning based insights such as anomaly detection, forecasting, and natural language queries. It also has a rich set of APIs that allow you to programmatically manage your analytics workflows, such as moving dashboards across accounts, automating deployments, and managing access for users with single sign-on (SSO).

New features in QuickSight Embedded Analytics

We recently announced the launch of additional embedding capabilities that allow you to do even more with QuickSight embedded analytics. QuickSight now allows you to embed dashboard authoring within applications (such as SaaS applications and enterprise portals), allowing you to empower your end-users to create their own visualizations and reports.

These ad hoc data analysis and self-service data exploration capabilities mean you don’t have to repeatedly create custom dashboards based on requests from your end-users, and can provide end-users with even greater agility and transparency with their data. This capability helps create product differentiation and up-sell opportunities within customer applications.

With this launch, QuickSight also provides namespaces, a multi-tenant capability that allows you to easily maintain data isolation while supporting multiple workloads within the same QuickSight account. For example, if you’re an independent software vendor (ISV), you can now assign dedicated namespaces to different customers within the same QuickSight account. This allows you to securely manage multiple customer workloads as users (authors or readers) within one namespace, and they can only discover and share content with other users within the same namespace, without exposing any data to other parties.

Without namespaces, you could set up your own embedded dashboards for hundreds of thousands of users with QuickSight. For example, see the following dashboard for our fictional company, Oktank Analytica.

With namespaces in place, you can extend this to provide ad-hoc authoring capabilities using curated datasets specific to each customer, created and shared by the developer or ISV. See the following screenshot.

For more information about these new features, see Embed multi-tenant analytics in applications with Amazon QuickSight.

Customer success stories

Customers are already using embedded analytics in QuickSight to great success. In this section, we share the stories of a few customers.

Blackboard

Blackboard is a leading EdTech company, serving higher education, K-12, business, and government clients around the world.

“The recent wave in digital transformation in the global education community has made it clear that it’s time for a similar transformation in the education analytics tools that support that community,” says Rachel Scherer, Sr. Director of Data & Analytics at Blackboard. “We see a need to support learners, teachers, and leaders in education by helping to change their relationship with data and information—to reduce the distance between information and experience, between ‘informed’ and ‘acting.’

“A large part of this strategy involves embedding information directly where our users are collaborating, teaching, and learning—providing tools and insights that aid in assessment, draw attention to opportunities learners may be missing, and help strategic and academic leadership identify patterns and opportunities for intervention. We’re particularly interested in making the experience of being informed much more intuitive—favoring insight-informed workflows and/or embedded prose over traditional visualizations that require interpretation.

“By removing the step of interpretation, embedded visualizations make insights more useful and actionable. With QuickSight, we were able to deliver on our promise of embedding visualizations quickly, supporting the rapid iteration that we require, at the large scale needed to support our global user community.”

For more information about Blackboard’s QuickSight use case, see the AWS Online Tech Talk Embedding Analytics in your Applications with Amazon QuickSight at the 25:50 mark.

Comcast

Syndication Insights (SI) enables Comcast’s syndicated partners to access the same level of rich data insights that Comcast uses for platform and operational improvements.

“The SI platform enables partners to gain deeper business insights, such as early detection into anomalies for users, while ensuring a seamless experience through embedded, interactive reports,” says Ajay Gavagal, Sr. Manager of Software Development at Comcast. “From the start, scalability was a core requirement for us. We chose QuickSight as it is scalable, enabling SI to extend to multiple syndicated partners without having to provision or manage additional infrastructure. Furthermore, QuickSight provides interactive dashboards that can be easily embedded into an application. Lastly, QuickSight’s rich APIs abstract away a lot of functionality that would otherwise need to be custom built.”

For more information about how Comcast uses QuickSight, see the AWS Online Tech Talk Embedding Analytics in your Applications with Amazon QuickSight at the 38:05 mark.

Panasonic Avionics Corporation

Panasonic Avionics Corporation provides customized in-flight entertainment and communications systems to more than 300 airlines worldwide.

“Our cloud-based solutions collect large amounts of anonymized data that help us optimize the experience for both our airline partners and their passengers,” says Anand Desikan, Director of Cloud Operations at Panasonic Avionics Corporation. “We started using Amazon QuickSight to report on in-flight Wi-Fi performance, and with its rich APIs, pay-per-session pricing, and ability to scale, we quickly rolled out QuickSight dashboards to hundreds of users. The constant evolution of the platform has been impressive: ML-powered anomaly detection, Amazon SageMaker integration, embedding, theming, and cross-visual filtering. Our users consume insights via natural language narratives, which allows them to read all their information right off the dashboard with no complex interpretation needed.”

EHE Health

EHE Health is national preventive health and primary care Center of Excellence provider system.

“As a 106-year-old organization moving toward greater agility and marketplace nimbleness, we needed to drastically upgrade our ability to be transparent within our internal and external ecosystems,” says David Buza, Chief Technology Officer at EHE Health. “With QuickSight, we are not constrained by pre-built BI reports, and can easily customize and track the right operational metrics, such as product utilization, market penetration, and available inventory to gain a holistic view of our business. These inputs help us to understand current performance and future opportunity so that we can provide greater partnership to our clients, while delivering on our brand promise of creating healthier employee populations.

“QuickSight allowed our teams to seamlessly communicate with our clients—all viewing the same information, simultaneously. QuickSight’s embedding capabilities, along with its secure platform, intuitive design, and flexibility, allowed us to service all stakeholders—both internally and externally. This greater flexibility and customization allowed us to fit the client’s needs seamlessly.”

Conclusion

Where data agility and transparency are critical to business success, embedded analytics can open a universe of possibilities, and we are excited to see what our customers will do with these new capabilities.

Additional resources

For more resources, see the following:


About the Author

Dorothy Li is the Vice President and General Manager for Amazon QuickSight.