All posts by Lillie Atkins

Create threshold alerts on tables and pivot tables in Amazon QuickSight

Post Syndicated from Lillie Atkins original https://aws.amazon.com/blogs/big-data/create-threshold-alerts-on-tables-and-pivot-tables-in-amazon-quicksight/

Amazon QuickSight previously launched threshold alerts on KPIs and gauge charts. Now, QuickSight supports creating threshold alerts on tables and pivot tables—our most popular visual types. This allows readers and authors to track goals or key performance indicators (KPIs) and be notified via email when they are met. These alerts allow readers and authors to relax and rely on notifications for when their attention is needed. In this post, we share how to create threshold alerts on tables or pivot tables to track important metrics.

Background information

Threshold alerts are a QuickSight Enterprise Edition feature and available for dashboards consumed on the QuickSight website. Threshold alerts aren’t yet available in embedded QuickSight dashboards or on the mobile app.

Alerts are created based on the visual at that point in time and are not affected by potential future changes to the visual’s design. This means the visual can be changed or deleted and the alert continues to work as long as the data in the dataset remains valid. In addition, you can create multiple alerts off of one visual, and rename them as appropriate.

Finally, alerts respect RLS and CLS rules.

Set up an alert on a table or pivot table

Threshold alerts are configured for dashboards. On a dashboard, there are three different ways to create an alert on a table or pivot table.

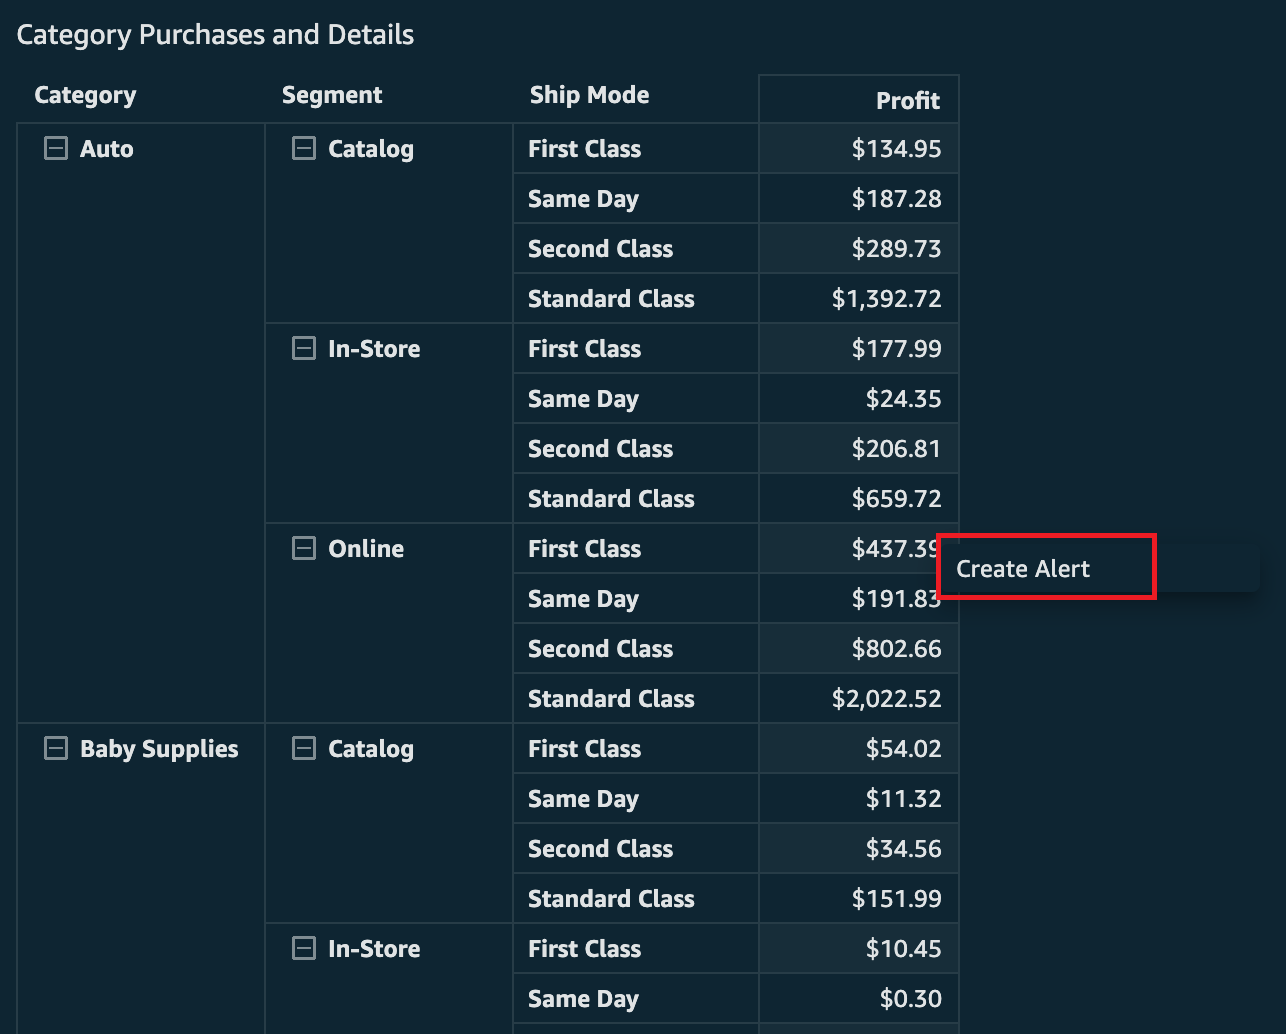
First, you can create directly from a pivot table or table. You click directly on the cell you would like to create an alert on (if there is another action enabled, you may have to right-click to get this option to show). This needs to be on a numeric value (no dates or strings allow for creation of alerts). Then choose Create Alert to start creating the alert.

Let’s assume you want to track the profit coming from online purchases for auto-related merchandise being shipped first class. Choose the appropriate cell and then choose Create Alert.

Create Alert

You’re presented with the creation pane for alerts. The only difference from KPIs or gauge visual alerts is that here you’ll find the other dimensions in the row that you’re creating the alert on. This will help you identify what value from the table you have selected, because there can be duplicates of the numeric values.

In the following screenshot, the value to track is profit, which currently is $437.39. This is the value that will be compared to the threshold you set. You will also see the dimensions being used to define this alert, which are taken from the row of the table. In this case, the Category is Auto, the Segement is Online, and the Ship Mode is First Class.

Now that you have checked that the value is correct, you can update the name of the alert that is automatically filled with the name of the visual it is created off of, set the condition (between Is above, Is below, and Is equal to), and pick the threshold value, notification frequency, and whether you want to be emailed when there is no data.

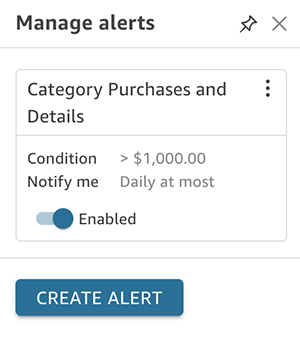
In the following example, the alert has been configured so that you will receive an email when the profit is above the threshold of $1,000. You’ve also left the notification frquency at Daily at most and haven’t requested to be emailed when there is no data.

If you have a date field, you also will see an option to control the date. This will automatically set the date field to be the most recent of whatever aggregation you’re looking at, such as hour, week, day, month. However, you could override to use the specific date applied to the value you have selected if you would prefer.

Below is an example where the data was aggregated based on the week and so Latest Week has been selected rather than the historical Week of Jan 4, 2015.

You can then choose Save if you’re happy with the alert and it will load the Manage alert pane.

The Create Alert button is also at the bottom of the pane. This is the second way you can start creating an alert off of a table or pivot table.

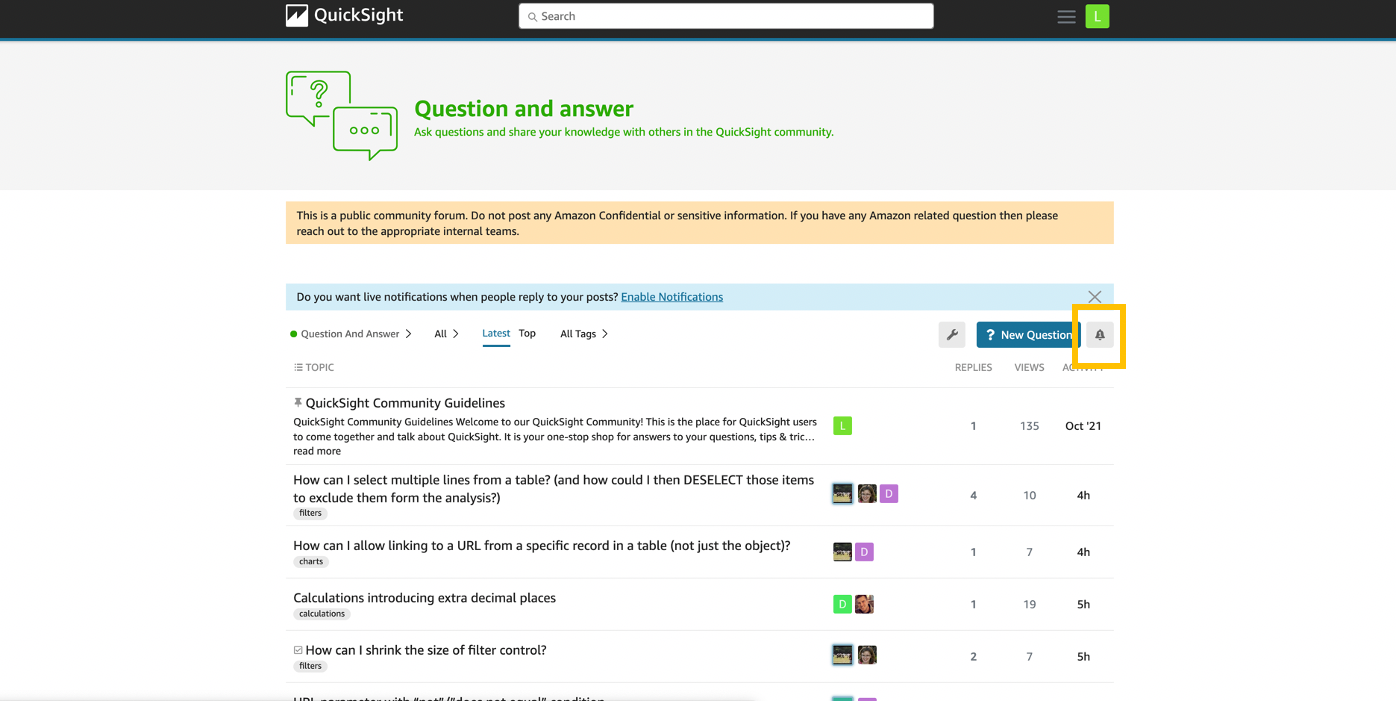
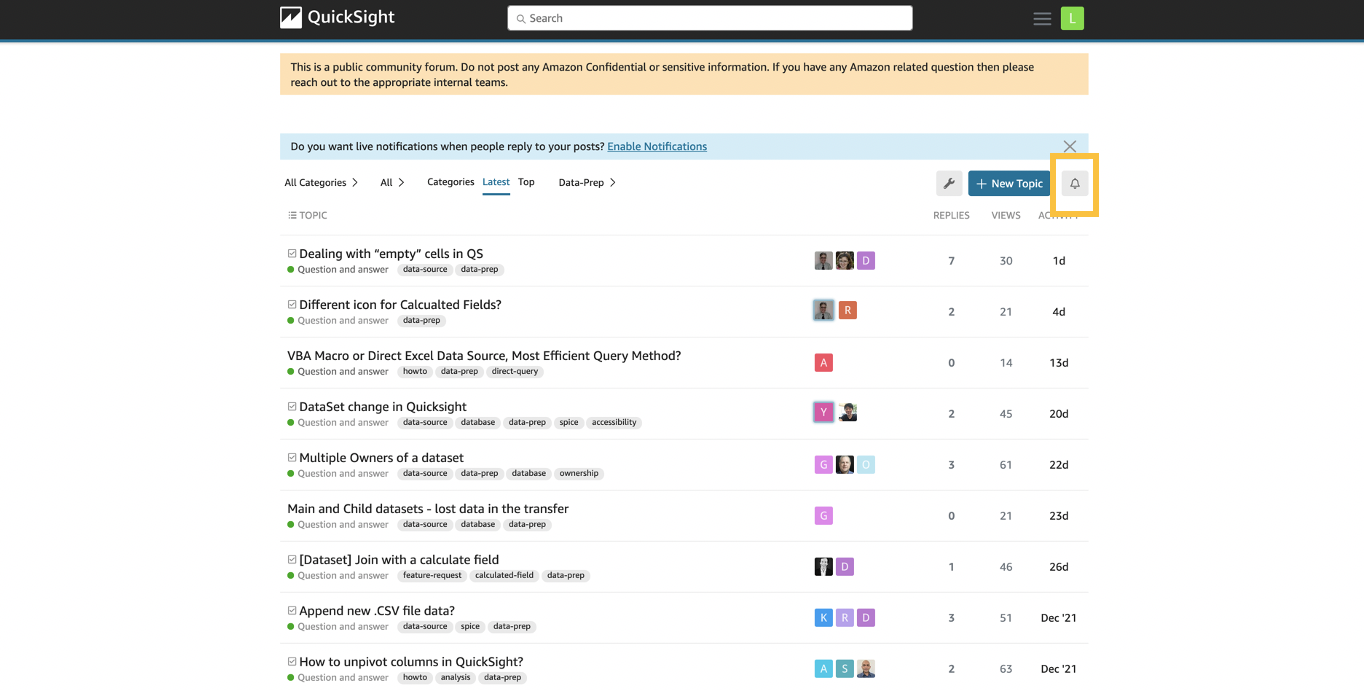
You can also get to this pane from the upper right alert button on the dashboard.

Create Alert through the icon on dashboard

If you have no alerts, this will automatically drop you into the creation pane. There you will be asked to select a visual that supports alerts to begin creating an alert. If you already have alerts (as previously demonstrated), then all you need to do is choose Create Alert.

Then select a visual and choose Next.

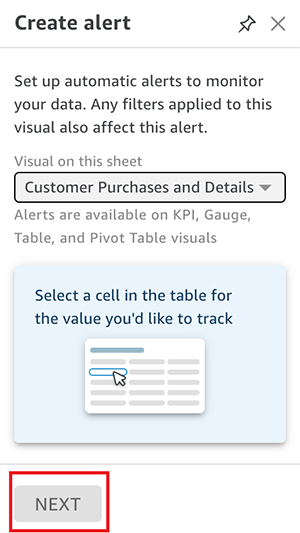
You’re prompted to select a cell if you have picked a table or pivot table visual.

Then you repeat the same steps as creating off a cell within a table or pivot table.

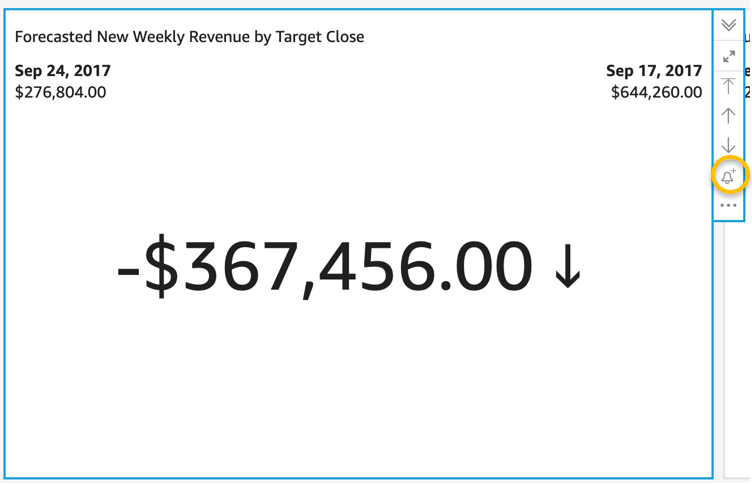
Finally, you can start creating an alert from the bell icon on the pivot table or table. This is the third way to create an alert.

bell icon

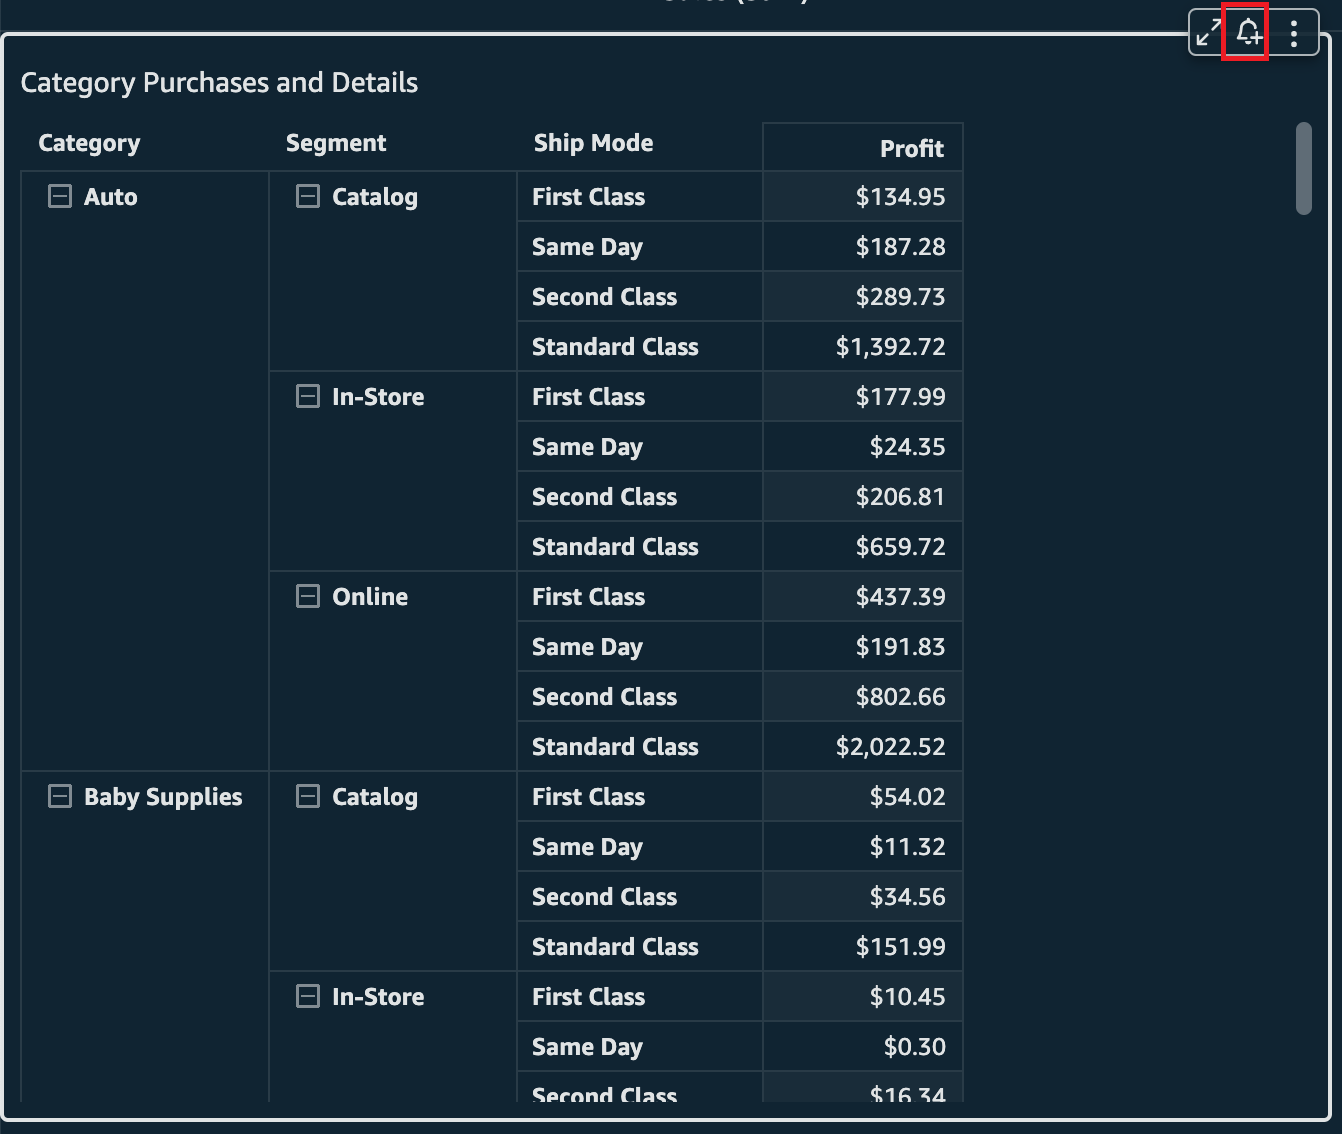
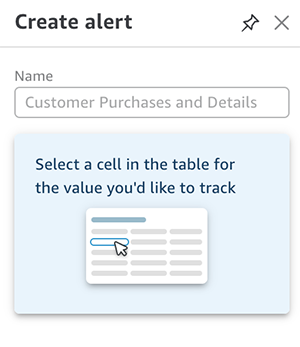
You’ll be prompted to select a cell from the table, and the creation pane appears.

After you choose the cell that you want to track, you start the creation process just like the first two examples.

Update and delete alerts

To update or delete an alert, you need to navigate back to the Manage alerts pane. You get there from the bell icon on the top right corner of the dashboard.

Create Alert through the icon on dashboard

You can then choose the options menu (three dots) on the alert you want to manage. Three options appear: Edit alert, View history (to view recent times the alert has breached and notified you), and Delete.

Notifications

You’ll receive an email when your alert breaches the rule you set. The following is an example of what that looks like (the alert has been adjusted to be alerted if profit is over $100 and to be notified as frequently as possible).

notification if alert is breached

The current profit breach is highlighted and the historical numbers are shown along with the date and time of the recorded breaches. You can also navigate to the dashboard by choosing View Dashboard.

Evaluate alerts

The evaluation schedule for threshold alerts is based on the dataset. For SPICE datasets, alert rules are checked against the data after a successful data refresh. With datasets querying your data sources directly, alerts are evaluated daily at a random time between 6:00 PM and 8:00 AM. This is based on the the timezone of the AWS Region your dataset was created in. Dataset owners can set up their own schedules for checking alerts and increase the frequency up to hourly (to learn more, refer to Working with threshold alerts in Amazon QuickSight).

Restrict alerts

The admin for the QuickSight account can restrict who has access to set threshold alerts through custom permissions. For more information, see the section Customizing user permissions in Embed multi-tenant analytics in applications with Amazon QuickSight.

Pricing

Threshold alerts are billed for each evaluation, and follow the familiar pricing used for anomaly detection, starting at $0.50 per 1,000 evaluations. For example, if you set up an alert on a SPICE dataset that refreshes daily, you have 30 evaluations of the alert rule in a month, which costs 30 * $0.5/1000 = $0.015 in a month. For more information, refer to Amazon QuickSight Pricing.

Conclusion

In this post, you learned how to create threshold alerts on tables and pivot tables within QuickSight dashboards so that you can track important metrics. For more information about how to create threshold alerts on KPIs or gauge charts, refer to Create threshold-based alerts in Amazon QuickSight. Additional information is available in the Amazon QuickSight User Guide.


About the Author

Lillie Atkins is a Product Manager for Amazon QuickSight, Amazon Web Service’s cloud-native, fully managed BI service.

Announcing the new Amazon QuickSight Community

Post Syndicated from Lillie Atkins original https://aws.amazon.com/blogs/big-data/announcing-the-new-amazon-quicksight-community/

On February 22, 2022, we launched our new Amazon QuickSight Community. Here you can ask and answer questions, network with and learn from other Business Intelligence (BI) users from across the globe, access learning content, and stay up to date with what’s new on Amazon QuickSight—all in one place!

In this post, we discuss some of the features of the QuickSight Community and show you how to sign up, start posting, create a profile and set up notifications.

Content on the Community

The QuickSight Community has three main sections:

  1. Question and Answer – A discussion forum where you can ask your QuickSight questions and get answers from community experts. You can also showcase your QuickSight expertise by sharing your knowledge with others.
  2. Learning Center – A hub for on-demand QuickSight content, including how-to videos workshop videos, articles, and additional educational resources.
  3. Announcements – Stay up-to-date on the latest QuickSight launches, blogs, feature demo videos, and monthly newsletters. We continuously update this section as new content related to QuickSight is added.

Join the QuickSight Community

This QuickSight Community does not require any login to search or browse existing content. You only need to create an account if you want to interact with the community (such as liking posts, replying to posts, and posting your own questions).

This is a public community, so be careful not to post any confidential or private information.

Sign up for the Community

To sign up, complete the following steps:

  1. On the QuickSight Community home page, choose Sign Up.
  2. You can either use your existing Amazon.com account, or create a new login.
  3. Read the Community guidelines.

You can now contribute to the Community. Welcome!

Post a question

You need to be logged in with an account to start asking questions. Before you post a question, search the recommended questions to make sure your question hasn’t already been answered.

To post a question, complete the following steps:

  1. On the Question and answer page, choose New Question.
  2. Enter the information to create your post, including a title and tag.
  3. Choose New Question.

Set up your profile

To view your profile and change the settings, complete the following steps:

  1. Choose your user icon at the top of the page and choose the person icon.
  2. Select the section you are interested in:
  3. If you chose Preferences, you can control security and notification preferences, and update your profile details.

Set up notifications

You can set up notification preferences to be alerted on a specific post, channel, or tag.

To set up notifications on a post, choose the post and then choose the notification icon to set your notification preferences.

To get notified on a specific channel, go to the channel (in this case the Question and answer channel) and choose the notification bell to set your notification preferences.

To get notified on a specific tag, complete the following steps:

  1. Choose the additional options icon.
  2. Choose Tags.
  3. Choose the tag you are interested in.
  4. Choose the notification icon and set your notification preferences.

Conclusion

In this post, we discussed the new Amazon QuickSight Community, and how you can sign up for it, create a post, edit your profile, and set up notifications. The QuickSight Community is a one-stop shop for all of your QuickSight learning needs, and a place to network with other BI users from around the globe. Start exploring today!


About the Authors

Lillie Atkins is a Product Manager for Amazon QuickSight, Amazon Web Service’s cloud-native, fully managed BI service.

Mia Heard is a Product Marketing Manager for Amazon QuickSight, AWS’ cloud-native, fully managed BI service.

Create threshold-based alerts in Amazon QuickSight

Post Syndicated from Lillie Atkins original https://aws.amazon.com/blogs/big-data/create-threshold-based-alerts-in-amazon-quicksight/

Every business has a set of key metrics that stakeholders focus on to make the most accurate, data-driven decisions, such as sales per week, inventory turnover rate, daily website visitors, and so on. With threshold-based alerts in Amazon QuickSight, we’re making it simpler than ever for consumers of QuickSight dashboards to stay informed about their key metrics. This blog post walks you through the process of setting up threshold-based alerts to track important metrics on QuickSight dashboards.

Set up an alert

Threshold alerts are set up on dashboards and can be created from KPIs or gauge charts. To set a threshold alert, choose the visual and then choose the alert icon. The alert takes into account all of the filters currently applied to the visual and creates a new alert rule.

The following two screenshots show first a KPI visual and then a gauge visual as well as where to locate the alert icon:

You can set up multiple alerts from a visual, which lets you monitor the data for different sets of changes or conditions.

After you choose the alert icon, you must provide a few configuration details. The alert name auto-fills to the name of the visual. The Alert value is the value in the data that the threshold is checked against based on your rule; this defaults to the primary value of the visual. For the gauge, this means the percent of the goal already achieved (currently 79.81%). In the following screenshot, we see for the KPI it means the week over week difference in the forecasted revenue (currently -$367,456).

Let’s say you want to be alerted whenever the forecasted new monthly revenue dips below $300,000—even if that is multiple times a day. To configure this alert, complete the following steps:

  1. For Alert value¸ choose the actual value rather than the difference value (which was the default).
  2. For Condition, choose Is below.
  3. Enter the value 300,000.
  4. For Notification preference, choose As frequently as possible.
  5. Choose Save.

Let’s now say you change your mind and only want to get notified once a week at most when this alert is going off. This is controlled through the notification preference. To make changes to the alert, you go to the management portal, which can be found by choosing Alerts on the navigation bar.

Here is where you can edit, delete, enable, or disable the alert. When the alert has triggered, you will be able to see a list along with other historical (90-day) alerts. This alert doesn’t have any history, because it hasn’t been triggered yet.

To update your notification preference, choose Edit, under Notification Preference pick Weekly at most, then hit Save.

When an alert is triggered, you receive an email notification customized to what Alert Value you have the alert configured for. You can quickly get to the dashboard by choosing View Dashboard.

Alerts are created based on the visual at that point in time and don’t update with changes to the visual in the future. This means the visual can change or be deleted and the alert continues to work as long as the data in the dataset remains valid.

The evaluation schedule for threshold alerts is based on the dataset. For SPICE datasets alert rules are checked against the data after a successful data refresh. With datasets querying your data sources directly, alerts are evaluated daily at a random time between 6PM to 8AM based on the region of the dataset. We’re working on a control for direct query dataset owners to be able to set up their own schedules for checking alerts and increase the frequency up to hourly.

The admin for the QuickSight account can restrict who has access to set threshold alerts through custom permissions. For more information, see Customizing user permissions in Embed multi-tenant analytics in applications with Amazon QuickSight.

Pricing and availability

Threshold alerts are billed for each evaluation, and follow the familiar pricing used for anomaly detection, starting at $0.50 per 1,000 evaluations. For example, if you set up an alert on a SPICE dataset that refreshes daily, you have 30 evaluations of the alert rule in a month, which costs 30 * $0.5/1000 = $0.015 in a month. For more information, see Amazon QuickSight Pricing.

Threshold alerts are a QuickSight Enterprise Edition feature and available for dashboards consumed in the QuickSight website. Threshold alerts aren’t yet available in embedded QuickSight dashboards or on the mobile app.

Conclusion

In this post, we demonstrated how to set up threshold-based alerts to track important metrics on QuickSight dashboards. This makes it even easier for consumers of QuickSight dashboards to stay up to date on their key metrics. For more information see, Amazon QuickSight Documentation.


About the Author

Lillie Atkins is a Product Manager for Amazon QuickSight, Amazon Web Service’s cloud-native, fully managed BI service.