Post Syndicated from Mei Qu original https://aws.amazon.com/blogs/big-data/customize-amazon-quicksight-dashboards-with-the-new-bookmarks-functionality/
Amazon QuickSight users now can add bookmarks in dashboards to save customized dashboard preferences into a list of bookmarks for easy one-click access to specific views of the dashboard without having to manually make multiple filter and parameter changes every time. Combined with the “Share this view” functionality, you can also now share your bookmark views with other readers for easy collaboration and discussion.
In this post, we introduce the bookmark functionality and its capabilities, and demonstrate typical use cases. We also discuss several scenarios extending the usage of bookmarks for sharing and presentation.
Create a bookmark
Open the published dashboard that you want to view and make changes to the filters, controls, or select the sheet that you want. For example, you can filter to the Region that interests you, or you can select a specific date range using a sheet control on the dashboard.
To create a bookmark of this view, choose the bookmark icon, then choose Add bookmark.
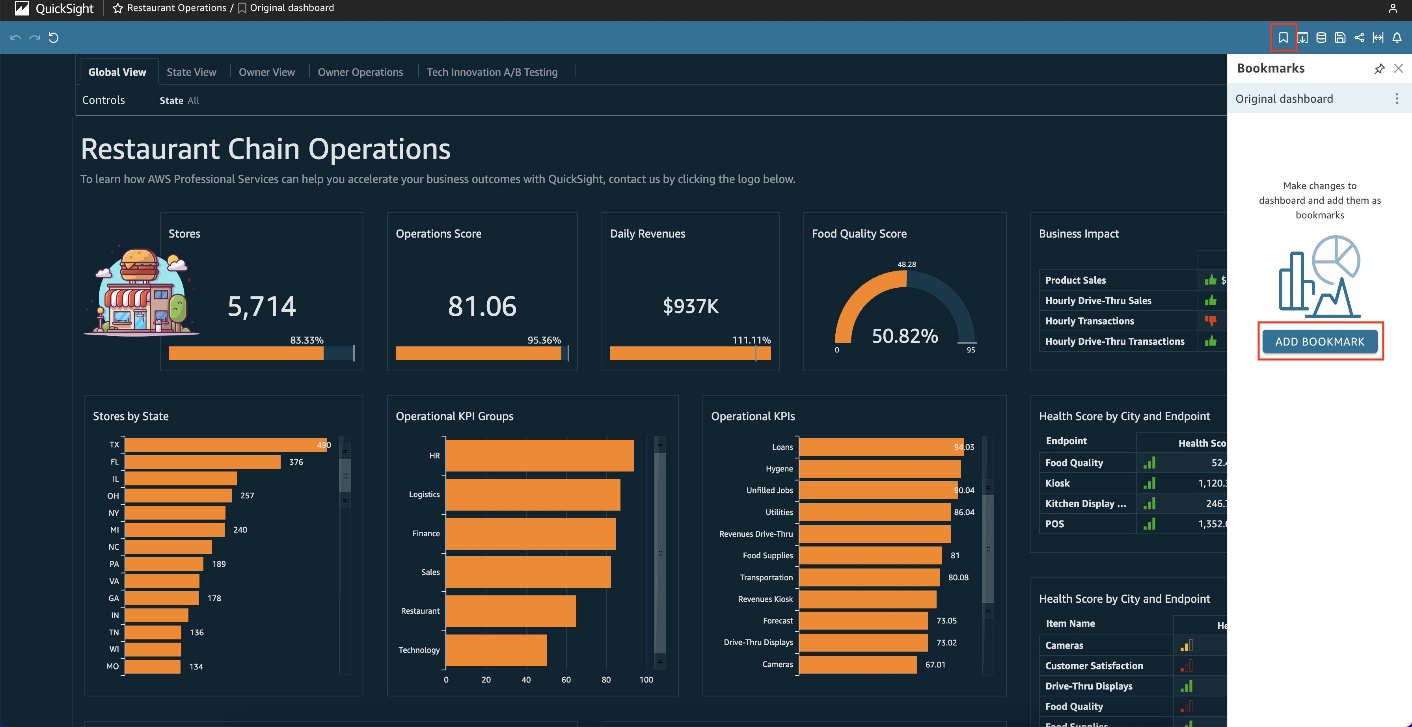
Enter a name, then choose Save.

The bookmark is saved, and the dashboard name on the banner updates with the bookmark name.
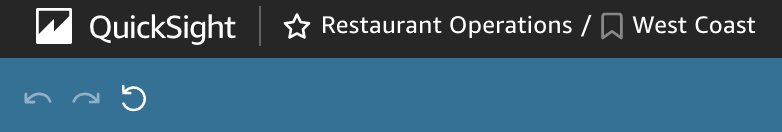
You can return to the original dashboard view that the author published at any time by going back to the bookmark icon and choosing Original dashboard.

Rename or delete a bookmark
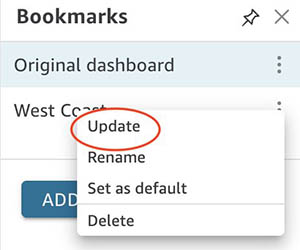
To rename or delete a bookmark, on the bookmark pane, choose the context menu (three vertical dots) and choose Rename or Delete.

Although you can make any of these edits to bookmarks you have created, the Original dashboard view can’t be renamed, deleted, or updated, because it’s what the author has published.

Update a bookmark
At any time, you can change a bookmark dashboard view and update the bookmark to always reflect those changes.
After you make your edits, on the banner, you can see Modified next to the bookmark you’re currently editing.
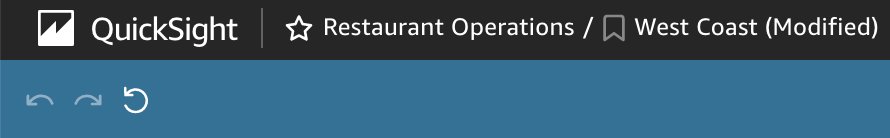
To save your updates, on the bookmarks pane, choose the context menu and choose Update.
Make a bookmark the default view
After you create a bookmark, you can set it as the default view of the dashboard that you see when you open the dashboard in a new session. This doesn’t affect anyone else’s view of the dashboard. You can also set the Original dashboard that the author published as the default view. When a default view is set, any time that you open the dashboard, the bookmark view is presented to you, regardless of the changes you made during your last session. However, if no default bookmark has been set, QuickSight will persist your current filter selections when you leave the dashboard. This way, readers can still pick up where they left off and don’t have to re-select filters.
To do this, in the Bookmarks pane, choose the context menu (the three dots) for the bookmark that you want to set as your default view, then choose Set as default.

Share a bookmark
After you create a bookmark, you can share a URL link for the view with others who have permission to view the dashboard. They can then save that view as their own bookmark. The shared view is a snapshot of your bookmark, meaning that if you make any updates to your bookmark after generating the URL link, the shared view doesn’t change.
To do this, choose the bookmark that you want to share so that the dashboard updates to that view. Choose the share icon, then choose Share this view. You can then copy the generated URL to share it with others.

Presentation with bookmarks
One extended use case of the new bookmarks feature is the ability to create a presentation through visuals in a much more elegant fashion. Previously, you may have had to change multiple filters and controls before arriving at your next presentation. Now you can save each presentation as a bookmark beforehand and just go through each bookmark like a slideshow. By creating a snapshot for each of the configurations you want to show, you create a smoother and cleaner experience for your audience.
For example, let’s prepare a presentation through bookmarks using a Restaurant Operations dashboard. We can start with the global view of all the states and their related KPIs.

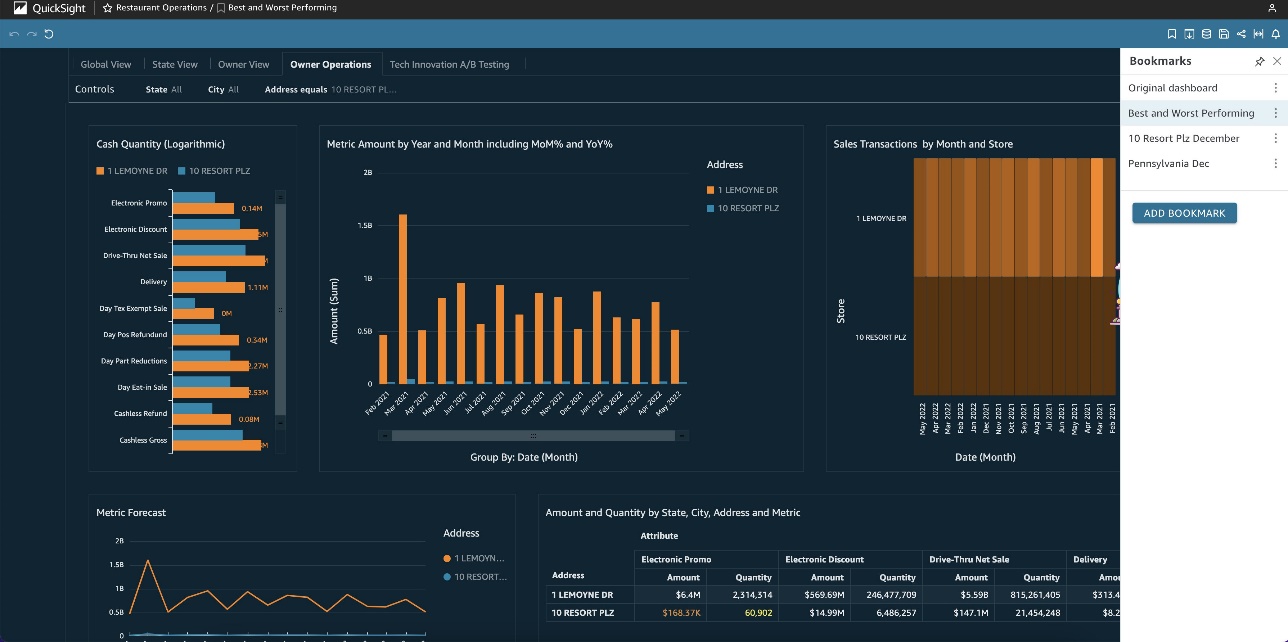
Best vs. worst performing restaurant
We’re interested in analyzing the difference between the best performing and worst performing store based on revenue. If we had to filter this dashboard on the fly, it would be much more time-consuming because we would have to manually enter both store names into the filter. However, with bookmarks, we can pre-filter to the two addresses, save the bookmark, and be automatically directed to the desired stores when we select it.
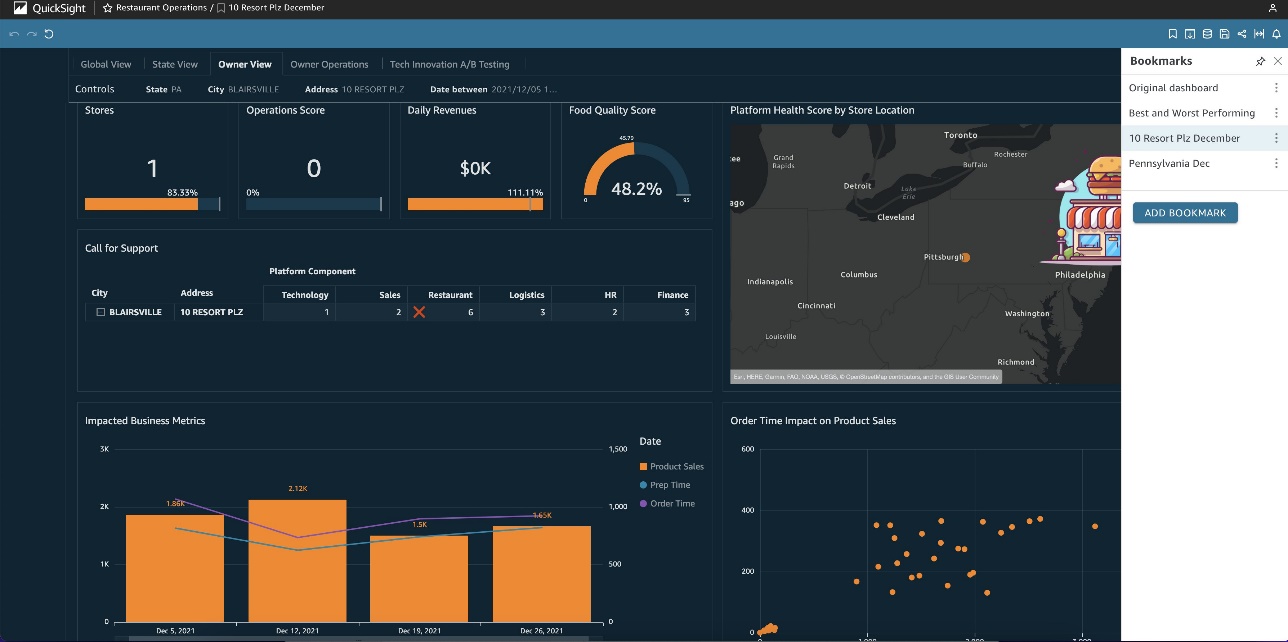
Worst performing restaurant analysis
When comparing the best and worst performing stores, we see that the worst performing store (10 Resort Plz) had a below average revenue amount in December 2021. We’re interested in seeing how we can better boost sales around the holiday season and if there is something the owner lacked in that month. We can create a bookmark that directs us to the Owner View with the filters selected to December 2021 and the address and city pre-filtered.
Pennsylvania December 2021 analysis
After looking at this bookmark, we found that in the month of December, the call for support score in the restaurant category was high. Additionally, in the week of December 19, 2021 product sales were at the monthly low. We want to see how these KPIs compare to other stores in the same state for that week. Is it just a seasonal trend, or do we need to look even deeper and take action? Again, we can create a bookmark that gives us this comparison on a state level.
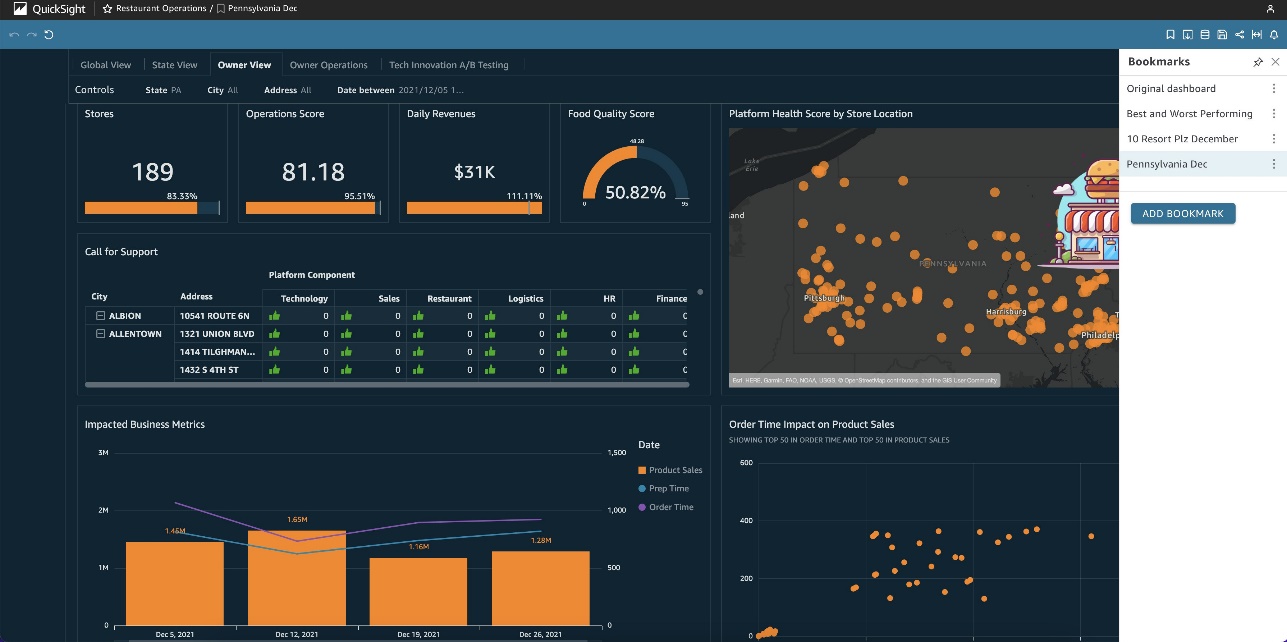
From the last bookmark, we can see that the other store in the same state (Pennsylvania) also had lower than average product sales in the week of December 19, 2021. For the purpose of this demo, we can go ahead and stop here, but we could create even more bookmarks to help answer additional questions, such as if we see this trend across other cities and states.
With these three bookmarks, we have created a top-down presentation looking at the worst performing store and its relevant metrics and comparisons. If we wanted to present this, it would be as simple as cycling through the bookmarks we’ve created to put together a cohesive presentation instead of having distracting onscreen filtering.
Conclusion
In this post, we discussed how we can create, modify, and delete bookmarks, along with setting it as a default view and sharing bookmarks. We also demonstrated an extended use case of presentation with bookmarks. The new bookmarks functionality is now generally available in all supported QuickSight Regions.
We’re looking forward to your feedback and stories on how you apply these calculations for your business needs.
Did you know that you can also ask questions of you data in natural language with QuickSight Q? Watch this video to learn more.
About the Authors
 Mei Qu is a Business Intelligence Engineer on the AWS QuickSight ProServe Team. She helps customers and partners leverage their data to develop key business insights and monitor ongoing initiatives. She also develops QuickSight proof of concept projects, delivers technical workshops, and supports implementation projects.
 Emily Zhu is a Senior Product Manager at Amazon QuickSight, AWS’s cloud-native, fully managed SaaS BI service. She leads the development of QuickSight analytics and query capabilities. Before joining AWS, she was working in the Amazon Prime Air drone delivery program and the Boeing company as senior strategist for several years. Emily is passionate about potentials of cloud-based BI solutions and looks forward to helping customers advance in their data-driven strategy-making.