All posts by Ricardo Marques

AWS Lambda Durable Functions observability with OpenTelemetry

Post Syndicated from Ricardo Marques original https://aws.amazon.com/blogs/compute/aws-lambda-durable-functions-observability-with-opentelemetry/

Gaining observability into AWS Lambda Durable Functions, a capability of AWS Lambda, can be challenging. A single workflow can span multiple invocations, queues, and downstream services, with no persistent host or centralized log file to inspect. With OpenTelemetry, you can close that gap by generating and correlating traces, metrics, and logs through an open specification. You can instrument once and export anywhere, which avoids vendor lock-in and establishes a baseline for operating serverless systems at scale.

With AWS Lambda Durable Functions, you can construct resilient workflows with multiple steps, which save their state and automatically recover from errors by replaying. A single durable execution can persist across several Lambda calls. It can continue after pauses, recover from errors, and restart from saved checkpoints. Although this model delivers fault tolerance, it introduces an observability challenge. Each invocation generates its own trace, fragmenting the end-to-end view of a single logical workflow.

This post introduces the OpenTelemetry plugin for the AWS Durable Execution SDK (aws-durable-execution-sdk-python-otel). With this plugin, you can generate deterministic trace IDs that unify all invocations of a single durable execution into one coherent distributed trace. In this post, you learn how to set up the plugin, see the traces it produces for the happy-path workflow, and apply foundational best practices.

The complete application code is available in our GitHub repository, so this post uses code snippets to illustrate the examples.

The problem: fragmented traces across invocations

Consider a document review workflow with a human approval gate:

import json

from aws_durable_execution_sdk_python import (
    DurableContext,
    durable_execution,
    durable_step,
)
from aws_durable_execution_sdk_python.types import WaitForCallbackContext


@durable_step
def extract_text(step_context, doc_id):
    step_context.logger.info(f"Extracting text from document: {doc_id}")
    return {"doc_id": doc_id, "text": "extracted content"}


@durable_step
def summarize(step_context, extracted):
    step_context.logger.info(f"Summarizing document: {extracted['doc_id']}")
    return {"summary": "Document summary here"}


@durable_step
def publish(step_context, summary, approval):
    step_context.logger.info(f"Publishing with approval from: {approval.get('reviewer')}")
    return {"status": "published"}


@durable_execution
def handler(event: dict, context: DurableContext) -> dict:
    extracted = context.step(extract_text(event["doc_id"]), name="extract-text")
    summary = context.step(summarize(extracted), name="summarize")

    def submit_for_review(callback_id: str, ctx: WaitForCallbackContext) -> None:
        notify_reviewer(callback_id, summary)

    approval = context.wait_for_callback(submitter=submit_for_review, name="human-review")
    if isinstance(approval, str):
        approval = json.loads(approval)

    if not approval.get("approved"):
        return {"status": "rejected", "reason": approval.get("feedback")}

    context.step(publish(summary, approval), name="publish")
    return {"status": "published"}

This workflow runs across at least two Lambda invocations. The first invocation executes extract-text and summarize, then suspends at human-review with zero compute cost while waiting. Hours later, when the reviewer responds, Lambda invokes the function again. It replays the completed steps and executes publish.

The following diagram illustrates the difference between the default behavior and the plugin’s unified tracing. On the left side, two independent traces are generated: Trace A captures the first invocation (totaling 2.69 seconds), while Trace B captures the second invocation after the callback resumes (replaying and publishing in 0.37 seconds). These traces have different trace IDs and no correlation between them. On the right side, with the OTel plugin, all operations appear under a single deterministic trace ID. The human-review wait (6 hours and 8 minutes at zero compute cost) is represented as a continuous span connecting both invocations, giving operators a complete timeline from start to finish. You can compare the total wall-clock duration of 152 seconds against only 0.019 seconds of actual compute time billed.
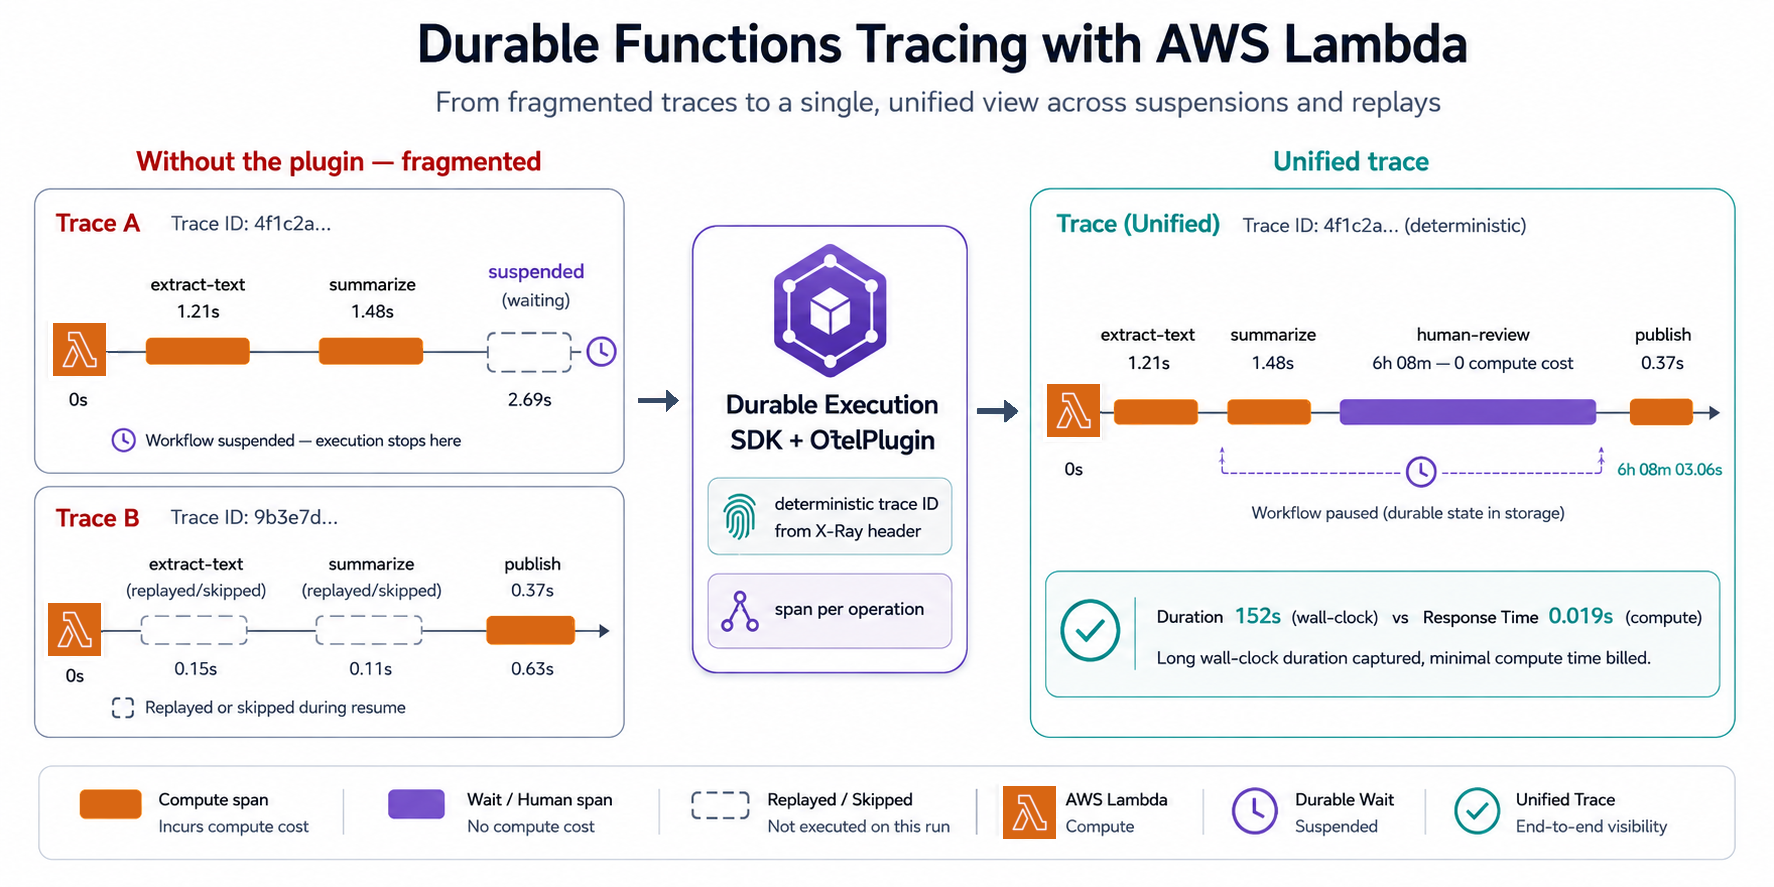
Figure 1. race comparison of fragmented traces without the plugin (left) versus a single unified trace with the OTel plugin.

Figure 1. Trace comparison of fragmented traces without the plugin (left) versus a single unified trace with the OTel plugin (right), showing how the Durable Execution SDK merges multiple Lambda invocations into one end-to-end trace.

The plugin achieves this through:

Capability What it does
Deterministic trace IDs Derives a stable trace ID from the AWS X-Ray header, so all invocations share one trace
Span-per-operation Each step, wait, or wait_for_callback gets its own span with real timing
Continuation spans Operations completing in a later invocation link back to the original span
Log correlation Stamps traceId and spanId onto every log record automatically
Configurable sampling Standard OpenTelemetry sampling to control trace volume
Figure 2. Amazon CloudWatch Application Signals Traces view. The durable execution appears as a single trace with OK status. The Duration column (152s) reflects the total wall-clock time including the human-review wait, while Response Time (0.019s) shows only the compute time.

Figure 2. Amazon CloudWatch Application Signals Traces view. The durable execution appears as a single trace with OK status. The Duration column (152s) reflects the total wall-clock time including the human-review wait, while Response Time (0.019s) shows only the compute time.

Choose execution view to see all operations grouped under the Workflow span. Use this view when the full execution, including waits and retries, finishes within your tracing vendor’s span ingestion window. For example, if your vendor rejects spans that started more than 8 hours ago, use execution view only for workflows that reliably finish well under 8 hours.Choose invocation view if an execution might exceed your vendor’s ingestion window, or if you want to see progress as each function execution terminates. Operations appear under the invocation that ran them. A wait’s first segment appears under the invocation that started it, even while the wait is still pending.In both views, the Workflow span covers the full execution, so the vendor’s ingestion window still applies to it. If an execution runs longer than the window, your vendor might reject the Workflow span even in invocation view.

The plugin sends Workflow as one span when the execution succeeds or fail. It doesn’t send that span in pieces. The vendor can, however, accept earlier spans from the same trace.

Why do we recommend someone to use invocation view for long running ones?Suppose a workflow waits 10 hours and the vendor rejects spans that started more than 8 hours ago. In invocation view, the invocation that starts the wait can export the wait’s initial span before the wait finishes. The invocation that resumes the workflow can later export the wait’s completion span. Those short spans can be accepted even if the vendor rejects the final Workflow span.

Getting started

In the following walkthrough, you configure your Lambda durable function to trace requests end-to-end.

Prerequisites

  • Python 3.11 or later.
  • An existing Lambda durable function (or a new one you want to instrument).
  • An AWS account with permissions to enable Amazon CloudWatch Application Signals tracing and add Lambda layers.

Step 1: Install the plugin

Add the plugin to your function’s dependencies:

pip install aws-durable-execution-sdk-python-otel

Or in your requirements.txt:

aws-durable-execution-sdk-python==3.0.2 
aws-durable-execution-sdk-python-otel==2.1.0

Step 2: Add the ADOT Lambda layer

With the AWS Distro for OpenTelemetry (ADOT) Lambda layer, you can export traces from your function.

MyDurableFunction:
  Type: AWS::Serverless::Function
  Properties:
    Runtime: python3.13
    Handler: index.handler
    Architectures:
      - x86_64
    DurableConfig:
      ExecutionTimeout: 31622400
    Layers:
      - !Sub arn:aws:lambda:us-east-1:615299751070:layer:AWSOpenTelemetryDistroPython:33
    Environment:
      Variables:
        AWS_LAMBDA_EXEC_WRAPPER: /opt/otel-instrument

Note: The examples in this post use AWS Serverless Application Model (AWS SAM) for brevity. You can achieve the same configuration using the AWS Command Line Interface (AWS CLI), AWS Cloud Development Kit (AWS CDK), Terraform, or AWS CloudFormation directly. Refer to the ADOT Lambda Layer ARNs page for the latest layer version and supported architectures. Pin the layer version in production deployments to avoid unexpected behavior from automatic version changes.

Step 3: Turn on X-Ray active tracing

The plugin uses the _X_AMZN_TRACE_ID environment variable to derive deterministic trace IDs. Turn on active tracing on your function:

MyDurableFunction:
  Type: AWS::Serverless::Function
  Properties:
    Tracing: Active

Also verify your function’s execution role includes the AWSXRayDaemonWriteAccess managed policy (or equivalent xray:PutTraceSegments and xray:PutTelemetryRecords permissions).

Step 4: Add the OTel plugin to your handler

Import InvocationOtelPlugin and pass it to the plugins parameter of @durable_execution:

from aws_durable_execution_sdk_python import DurableContext, durable_execution
from aws_durable_execution_sdk_python.config import Duration
from aws_durable_execution_sdk_python_otel import create_otel_plugin_factory
@durable_execution(plugins=[create_otel_plugin_factory()])
def handler(event: dict, context: DurableContext) -> str:
    data = context.step(lambda ctx: event["id"], name="fetch-data")
    context.wait(Duration.from_seconds(5), name="cooldown")
    return context.step(lambda ctx: f"processed {data}", name="process")

The plugin handles Tracer Provider setup, deterministic ID generation, and span lifecycle internally.

Testing and results

After you configure the plugin, deploy the function, invoke it, and confirm the unified trace appears in Amazon CloudWatch.

Testing the setup

Build and deploy your function:

sam build
sam deploy --guided

Then publish a function version (durable functions require a qualified ARN, not $LATEST):

aws lambda publish-version --function-name my-durable-function --region us-east-1

Invoke the function asynchronously (required when using wait_for_callback, since the function suspends mid-execution):

aws lambda invoke \
    --function-name my-durable-function \
    --qualifier 1 \
    --invocation-type Event \
    --region us-east-1 \
    --cli-binary-format raw-in-base64-out \
    --payload '{"doc_id": "test-doc-001"}' \
    response.json

Monitor the logs to get the callback ID:

aws logs tail /aws/lambda/my-durable-function --follow --region us-east-1

Wait 2-3 minutes (so the human-review span has visible duration in the trace), then send the callback:

aws lambda send-durable-execution-callback-success \
    --cli-binary-format raw-in-base64-out \
    --callback-id "<CALLBACK_ID_FROM_LOGS>" \
    --region us-east-1 \
    --result '{"approved": true, "reviewer": "alice"}'

Note: The send-durable-execution-callback-success command does not require --function-name. The callback ID already contains the reference to the execution.

What you see in Amazon CloudWatch Application Signals

After you invoke this function, open the Amazon CloudWatch console and choose Application Signals (APM), then Traces. You see a single unified trace containing:

  1. One root span representing the entire durable execution.
  2. Child spans for each named operation: extract-text, summarize, human-review, and publish.
  3. Accurate timing: each span reflects the actual wall-clock time of the operation, not replay time.
  4. Continuation links: if human-review completes in a different invocation (after the reviewer approves hours later), the span is linked back to the original trace.
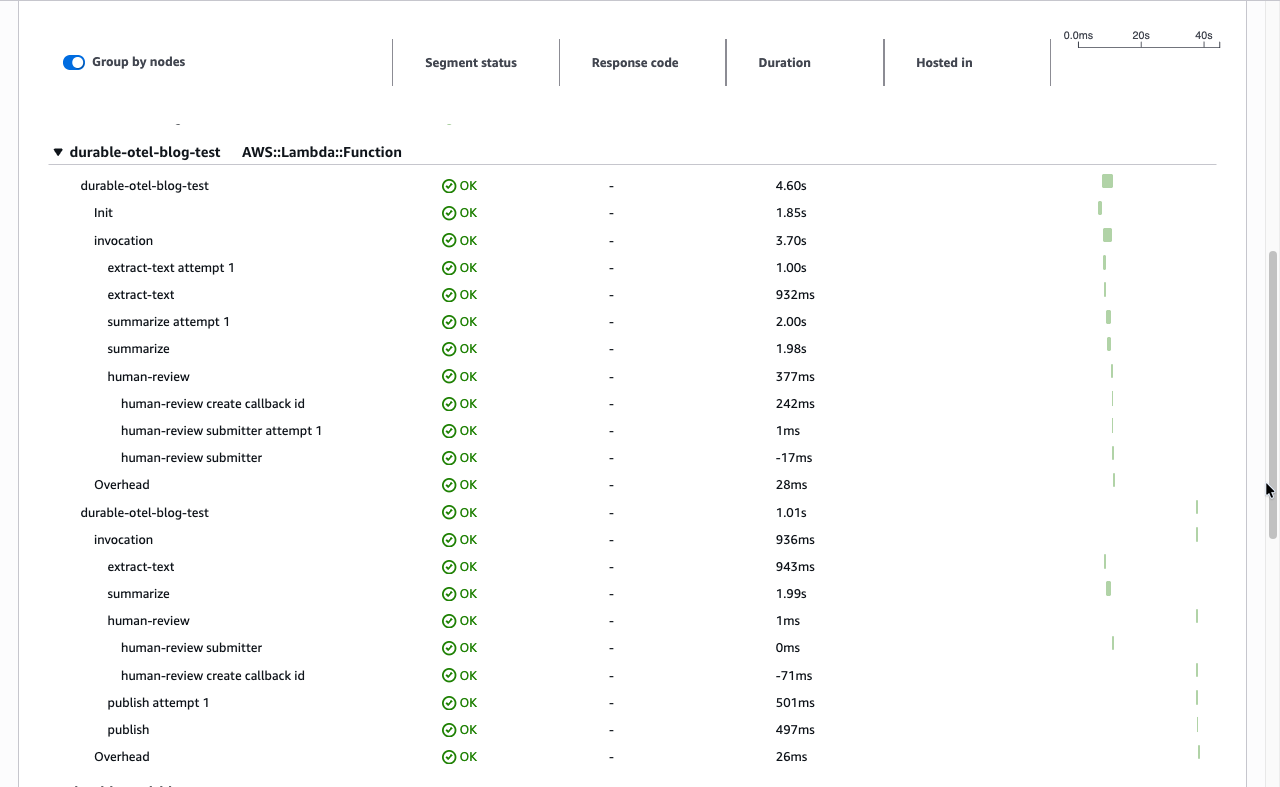
Figure 3. Trace details view. The service map shows the flow: Client to Lambda Context (first invocation), then Lambda Function (second invocation after callback resume). Both invocations appear under a single trace ID with total duration of 4.55 sec.

Figure 3. Trace details view. The service map shows the flow: Client to Lambda Context (first invocation), then Lambda Function (second invocation after callback resume). Both invocations appear under a single trace ID with total duration of 4.55 sec.

Correlated logs

Because the plugin sets enrich_logger=True by default, your application logs are automatically stamped with traceId and spanId.
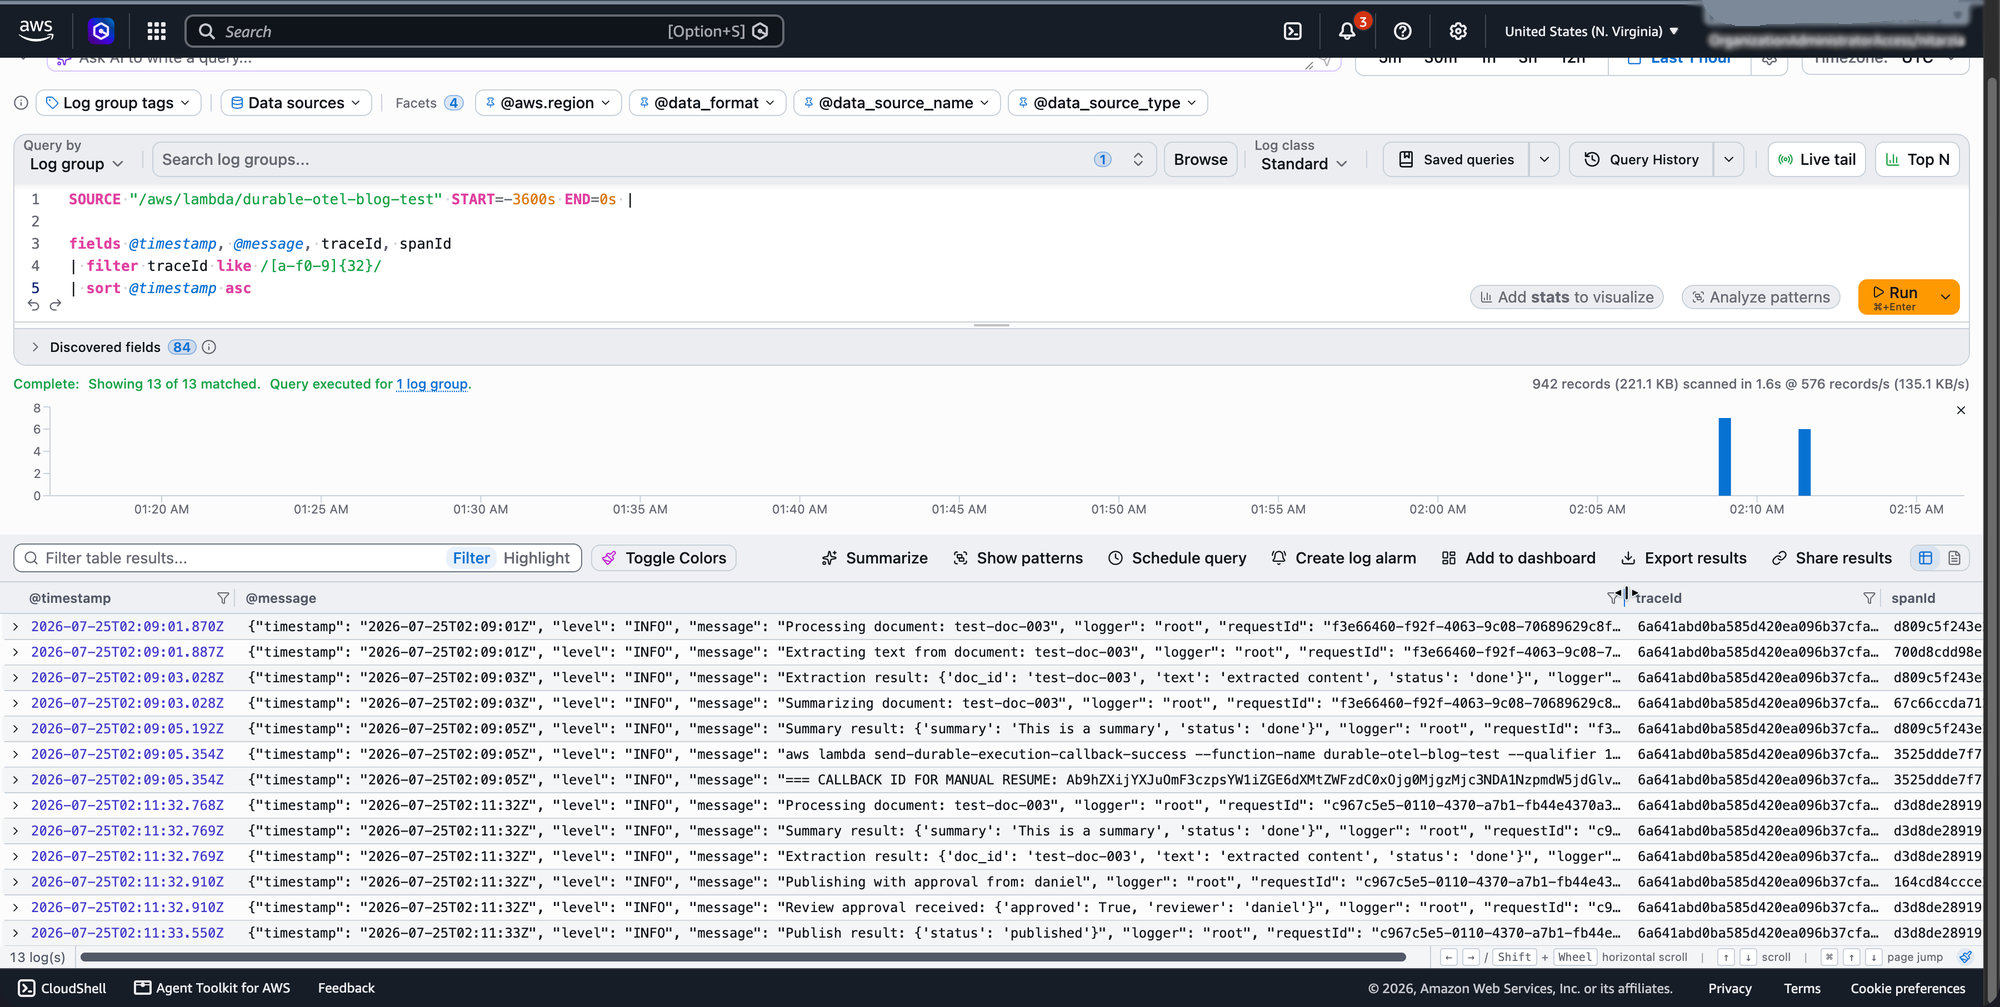
Figure 4. Expanded log entry in CloudWatch. Each log record includes traceId, spanId, and otelTraceSampled: true, which lets you correlate logs across all invocations of the same execution.

Figure 4. Expanded log entry in CloudWatch. Each log record includes traceId, spanId, and otelTraceSampled set to true, which lets you correlate logs across all invocations of the same execution.

You can combine the plugin’s log correlation with structured JSON logging to run powerful queries in Amazon CloudWatch Logs Insights:

fields @timestamp, @message, traceId, spanId
| filter traceId = "abcd1234567890abcdef1234567890ab"
| sort @timestamp asc

This returns logs from all invocations in chronological order, correlated to their respective spans.

Best practices

When you run the OTel plugin in production, keep the following performance, operational, and cost considerations in mind.

Performance considerations

  • Cold start impact: The ADOT layer adds overhead to cold starts and memory consumption. Measure the impact for your workload using Lambda Power Tuning. For latency-sensitive functions, consider using provisioned concurrency to keep warm environments available.
  • Memory overhead: The plugin and ADOT layer consume approximately 40–60 MB of additional memory. Verify your function has sufficient memory allocated.
  • Replay efficiency: During replay, the plugin correctly identifies replayed operations and does not emit duplicate spans. Only new operations generate new spans.

Operational guidelines

  • Name your operations: Always pass the name parameter to context.step(), context.wait_for_callback(), and other durable operations. These names appear as span names in your traces, making them human-readable.
  • Use structured logging: Combine the plugin’s log correlation with structured JSON logging to unlock powerful Amazon CloudWatch Logs Insights queries.
  • Monitor trace gaps: If you see traces with missing spans, check that X-Ray active tracing is enabled and the ADOT layer is correctly configured.

Cost management

  • Amazon CloudWatch Application Signals pricing: You are charged per trace recorded and per trace scanned. At high volumes, configure sampling to control costs. See Amazon CloudWatch Application Signals pricing.
  • Log volume: With enrich_logger=True, every log record includes trace context fields, slightly increasing log volume. This overhead is typically negligible but worth noting for high-throughput functions.

Pricing

The plugin is open source (Apache 2.0). Costs come from AWS X-Ray traces recorded and the ADOT Lambda layer overhead. The layer increases both the memory consumption and the cold start duration of your function. Lambda pricing is based on GB-seconds, so the additional memory allocated (rounded up to the nearest MB) multiplied by the additional execution time per invocation determines the cost impact. Each durable execution produces one trace regardless of invocation count, so X-Ray cost scales with executions, not invocations. Measure the overhead for your workload using Lambda Power Tuning and see AWS X-Ray pricing for current rates.

Beyond this post

This post focused on a single, representative workflow (sequential steps plus a human-approval callback) to keep the walkthrough concrete. It is not an exhaustive tour of the SDK. The Durable Execution SDK offers many other primitives that also produce spans and are worth exploring: durable timers (context.wait), condition polling (context.wait_for_condition), durable Lambda-to-Lambda calls (context.invoke), parallel and fan-out execution (context.parallel, context.map), nested child contexts, and automatic retries (with_retry and StepConfig), where each attempt and each parallel branch surfaces as its own span. We also did not cover failure paths, such as step errors and failure callbacks, which is where unified tracing is often most valuable.

Likewise, the OTel plugin exposes configuration we did not exercise here: toggling log enrichment (InvocationOtelPlugin(OtelPluginConfig(enrich_logger=False))), supplying a custom Tracer Provider via OtelPluginConfig(tracer_provider=...), and controlling trace volume through standard OpenTelemetry sampling (OTEL_TRACES_SAMPLER). This walkthrough sampled 100% of traces. Consult the SDK documentation for the full surface area, or access the GitHub repository.

Sending Lambda durable functions traces to Observability partners. The OpenTelemetry plugin exports telemetry data to Amazon CloudWatch and can work with any observability solution that supports OpenTelemetry. Dash0 is an OpenTelemetry-native observability platform that supports Lambda durable functions without custom configuration. Dash0 worked with AWS to validate the OpenTelemetry plugin for the AWS Durable Execution SDK for JavaScript prior to launch, Dash0 coordinates logs and spans. In Dash0, spans for the durable execution, each invocation, and each durable operation appear alongside the function’s inputs and outputs and the payloads of its AWS SDK calls. To learn more, visit About AWS Lambda Monitoring.

Clean up

To avoid ongoing charges, delete the resources created in this walkthrough:

sam delete --stack-name <your-stack-name>

This removes the Lambda function, AWS Identity and Access Management (IAM) roles, and any associated resources created by the SAM template.

If you manually added the ADOT Lambda layer or X-Ray tracing policies outside of your SAM template, remove those separately using the AWS CLI or console.

Trace data retained in X-Ray does not incur storage charges and expires automatically after 30 days.

Conclusion

In this post, we showed how to unify fragmented traces across multiple Lambda invocations using the OpenTelemetry plugin for the Durable Execution SDK. To explore the full SDK surface area, including parallel execution, durable timers, and failure-path tracing, see the AWS Durable Execution SDK Developer Guide. For more observability patterns, visit the AWS Observability Best Practices guide.

Modernizing applications with AWS AppSync Events

Post Syndicated from Ricardo Marques original https://aws.amazon.com/blogs/compute/modernizing-applications-with-aws-appsync-events/

In today’s fast-paced digital world, organizations are facing challenges for modernizing their applications. A common problem is the smooth shift from synchronous to asynchronous communication without substantial client or frontend alterations. When modernizing applications, it is often necessary to move from a synchronous communication model to an asynchronous one. However, this transition can be complex, especially when the client or frontend communicates synchronously. Adapting the current code for asynchronous communication demands significant time and resources.

AWS AppSync Events helps address this challenge by enabling you to build event-driven APIs that can bridge between synchronous and asynchronous communication models. With AppSync Events, you can modernize your backend architecture to leverage asynchronous patterns while maintaining compatibility with existing synchronous clients.

Overview

The solution comprises an API that converts client synchronous requests to asynchronous backend requests using AppSync Events.

For demonstrating the integration between the API and the backend, I’m simulating the backend processing using an asynchronous AWS Step Functions workflow. This workflow receives a Name and Surname event, waits 10 seconds, and posts a full-name event to the AppSync Event channel. To receive event notifications, the API subscribes to the AppSync channel. At the same time, the backend handles events asynchronously.

Figure 1: Representation of an API integrating a synchronous frontend with an asynchronous backend using AWS AppSync Events.

Figure 1: Representation of an API integrating a synchronous frontend with an asynchronous backend using AWS AppSync Events.

  1. The Amazon API Gateway makes a synchronous request to AWS Lambda and waits for the response.
  2. Lambda function starts the execution of the asynchronous workflow.
  3. After starting the workflow execution, Lambda connects to AppSync and creates a channel to receive asynchronous notifications (channels are ephemeral and unlimited. Here it creates one channel per request using the workflow execution ID).
  4. The workflow executes asynchronously, calling other workflows.
  5. Upon completion of the main workflow, it sends a POST request to the AppSync events API with the processing result. The POST is made to the channel that was created by the Lambda function using the workflow execution ID.
  6. AppSync receives the POST request and sends a notification to the subscriber, which in this case is the Lambda function. The entire process must be finished within the Lambda functions’s timeout limit you defined.
  7. Lambda sends the response to the API Gateway, which has been waiting for the synchronous response.

To better understand the Event API WebSocket Protocol used in this solution, refer to this AppSync documentation.

You can access the GitHub repo through this link: AppSync_Sync_Async_Integration.

The repository includes a comprehensive README file that walks you through the process of setting up and configuring the preceding solution.

Prerequisites

To follow this walkthrough, you need the following prerequisites:

With the full code, including API Gateway and Step Functions, on GitHub, this post only covers the core components: the AppSync Events API and the Lambda function.

Walkthrough

The following steps walk you through this solution.

Creating an AppSync event API with API Key Authorization

An AppSync Event API allows calls using API key, Amazon Cognito user pools, Lambda authorizer, OIDC, or AWS identity and Access Management (IAM). This solution uses API Key.

The infrastructure as code (IaC) has been created using Terraform. However, as of writing this post, there weren’t Terraform AppSync Event API resource available. Therefore, the AppSync Event API resources were made with AWS CloudFormation, which is imported and implemented by Terraform.

In the resource AWS:AppSync:Api, define the API name and Auth method:

Resources:
  #Creating the AppSync Events API
  EventAPI:
    Type: AWS::AppSync::Api
    Properties:
      Name: SyncAsyncAPI
      EventConfig:
        AuthProviders:
          - AuthType: API_KEY
        ConnectionAuthModes:
          - AuthType: API_KEY
        DefaultPublishAuthModes:
          - AuthType: API_KEY
        DefaultSubscribeAuthModes:
          - AuthType: API_KEY
#Creating the Events API Namespace
  DefaultNamespace:
    Type: AWS::AppSync::ChannelNamespace
    Properties:
      Name: AsyncEvents
      ApiId: !GetAtt EventAPI.ApiId
  
  #Creating the Events API APIKey
  EventAPIKey:
    Type: AWS::AppSync::ApiKey
    Properties:
      ApiId: !GetAtt EventAPI.ApiId
      Expires: 1748950672
      Description: 'API Key for Event API'

  #Creating the SecretsManager to store the APIKey
  SecretsManagerAPIKey:
    Type: AWS::SecretsManager::Secret
    Properties:
      Name: 'AppSyncEventAPIKEY'
      SecretString: !GetAtt EventAPIKey.ApiKey

To have the Host DNS, Realtime Endpoint, and Secret Manager created referenced by the Terraform template, output them:

Outputs:
  ApiARN:
    Description: 'The ARN ID'
    Value: !GetAtt EventAPI.ApiArn

  AppSyncHost:
    Description: 'The API Endpoint'
    Value: !GetAtt EventAPI.Dns.Http

  AppSyncRealTimeEndpoint:
    Description: 'The Real-time Endpoint'
    Value: !GetAtt EventAPI.Dns.Realtime

  SecretsManagerARN:
    Description: 'The ARN of the Secrets Manager entry'
    Value: !Ref SecretsManagerAPIKey

The key information needed from the AppSync Event API is:

  1. Host DNS: This DNS is used to send events to the API Channel through HTTP Post requests.
  2. Realtime endpoint: This endpoint is a WebSocket endpoint where the Lambda function connects to receive the events posted in the AppSync Channel.
  3. API Key: This key is used not only in the Post HTTP requests, but also to connect and subscribe to the AppSync channel.

Lambda Sync/Async API

In this solution, the Lambda function runs two tasks:

  1. Start an asynchronous workflow
  2. Subscribe to an event channel through WebSocket

To handle the WebSocket connection, use the websocket-client lib, which is a powerful Python lib developed for working with WebSockets.

Request isolation is maintained by using the same UUID for workflow name and AppSync channel name.

try:
        handler = WebSocketHandler()
        sfn_response = wf.start_workflow_async(event["body"])
        
        if sfn_response["status"] == "started":
            handler.execution_name = sfn_response["id"]
            handler.start_websocket_connection()
            
            return {
                'statusCode': 200,
                'body': json.dumps({ 
                        "id": handler.execution_name,
                        "nome completo": handler.final_name
                        })
            }
        else:
            raise ValueError("Workflow failed to start")

First, to initialize the WebSocket Connection, the subprotocols must be defined:

  • WEBSOCKET_PROTOCOL
  • Headers:
    • Host: The AppSync Host DNS (even with a WebSocket Connection, the HTTP Host must be sent)
    • x-api-key: The API key create fot the Event API.
    • Sec-Websocket-Protocol: WEBSOCKET_PROTOCOL
def start_websocket_connection(self) -> None:
        try: 
            """Initialize and start WebSocket connection."""
            header_str = self._create_connection_header()
            
            self.ws = websocket.WebSocketApp(
                os.environ["API_URL"],
                subprotocols=[WEBSOCKET_PROTOCOL, f'header-{header_str}'],
                on_open=self.on_open,
                on_message=self.on_message,
                on_error=self.on_error,
                on_close=self.on_close
)
            self.ws.run_forever()
        except Exception as e:
            return e
def _create_connection_header(self) -> str:
        """Create and encode connection header."""
        connection_header = {
            "host": os.environ["API_HOST"],
            "x-api-key": APIKEY,
            "Sec-WebSocket-Protocol": WEBSOCKET_PROTOCOL
        }
        return base64.b64encode(json.dumps(connection_header).encode()).decode()

Once the WebSocket connection is established, a first message with the type CONNECTION_INIT_TYPE must be sent.

To subscribe to the channel by which our function is notified when the Step Functions workflow finishes, send a second message with the type SUBSCRIBE_TYPE, an ID, the channel name and authorization.

For more information about types of message, read this AppSync documentation.

def on_open(self, ws: websocket.WebSocketApp) -> None:
        try:
            """Handle WebSocket connection opening and send initial messages."""
            logger.info("Connection opened")
            
            # Send connection initialization
            connection_init = {"type": CONNECTION_INIT_TYPE}
            ws.send(json.dumps(connection_init))

            # Send subscription
            subscription_msg = {
                "type": SUBSCRIBE_TYPE,
                "id": self.execution_name,
                "channel": f"{os.environ["APPSYNC_NAMESPACE"]}/{self.execution_name}",
                "authorization": {
                    "x-api-key": APIKEY,
                    "host": os.environ["API_HOST"]
                }
            }
            
            logger.info("Sending subscription")
            ws.send(json.dumps(subscription_msg))
        except Exception as e:
            self.on_error = e

After receiving the message confirming the subscription, wait for messages with the type data. Whenever a message with this type arrives, execute the logic to identify if the workflow was successfully executed, and then close the connection.

def on_message(self, ws: websocket.WebSocketApp, message: str) -> None:
        """Handle incoming WebSocket messages."""
        logger.info("Message received: %s", message)
        try:
            message_dict = json.loads(message)
            required_keys = ["id", "type", "event"]
            
            if all(key in message_dict for key in required_keys):
                event_json = json.loads(message_dict["event"])
                
                if (message_dict["id"] == self.execution_name and 
                    message_dict["type"] == "data"):
                    
                    self.final_name = event_json["nome_completo"]
                    logger.info("Message received: %s", self.final_name)
                    logger.info("Successfully received return message")
                    logger.info("Ending processing")
                    
                    self.message_queue = {
                        "status": SUCCESS_STATUS,
                        "executionID": message_dict["id"]
                    }
                    ws.close()
        except json.JSONDecodeError as e:
            logger.error("Failed to parse message: %s", str(e))
        except Exception as e:
            logger.error("Error processing message: %s", str(e))

Conclusion

In this post, you learned how to use event-driven architectures and the capabilities of AWS AppSync Events to integrate synchronous and asynchronous communication patterns in your applications. This allows you to modernize your systems without the need for extensive modifications to your existing frontend codebase. Explore the demonstrations and documentation provided in the GitHub repository to gain a deeper understanding of how AppSync Events can be applied to your specific use cases.

To learn more about serverless architectures and asynchronous invocation patterns, see Serverless Land.
