Post Syndicated from Shruthi Panicker original https://aws.amazon.com/blogs/big-data/showpad-accelerates-data-maturity-to-unlock-innovation-using-amazon-quicksight/
Showpad aligns sales and marketing teams around impactful content and powerful training, helping sellers engage with buyers and generate the insights needed to continuously improve conversion rates. In 2021, Showpad set forth the vision to use the power of data to unlock innovations and drive business decisions across its organization. Showpad’s legacy solution was fragmented and expensive, with different tools providing conflicting insights and lengthening time to insight. The company decided to use AWS to unify its business intelligence (BI) and reporting strategy for both internal organization-wide use cases and in-product embedded analytics targeted at its customers.
Showpad built new customer-facing embedded dashboards within Showpad eOSTM and migrated its legacy dashboards to Amazon QuickSight, a unified BI service providing modern interactive dashboards, natural language querying, paginated reports, machine learning (ML) insights, and embedded analytics at scale.
In this post, we share how Showpad used QuickSight to streamline data and insights access across teams and customers. Showpad migrated over 70 dashboards with over 1,000 visuals. They have rolled out the solution to all its 600 employees, increased dashboard development activity by three times, and reduced dashboard turnaround time from months to weeks. Showpad also launched dashboards and reports to over 1,300 customers worldwide, providing access to tens of thousands of users across all its customers.
Streamlining data-driven decisions by defragmenting the data and reporting architecture
Founded in 2011, dual headquartered in Belgium and Chicago and with offices around the world, Showpad provides a single destination for sales representatives to access all sales content and information, along with coaching and training tools to create informed, upskilled, and trusted buying teams. The platform also provides analytics and insights to support successful information sharing and fuel continuous improvement. In 2021, Showpad decided to take the next step in its data evolution and set forth the vision to power innovation, product decisions, and customer engagement using data-driven insights. This required Showpad to accelerate its data maturity as a company by mindfully using data and technology holistically to help its customers.
But the company’s legacy BI solution and data were fragmented across multiple tools, some with proprietary logic. “Each of these tools were getting data from a different place, and that’s where it gets difficult,” says Jeroen Minnaert, head of data at Showpad. “If each tool tells a different story because it has different data, we won’t have alignment within the business on what this data means.” Showpad also struggled with data quality issues in terms of consistency, ownership, and insufficient data access across its targeted user base due to a complex BI access process, licensing challenges, and insufficient education.
Showpad wanted to unify all the data into a single unified interface through a data lake, democratize that data through a BI solution such that autonomous teams across the company could effectively use data, and drive and unlock innovation in the company through advanced insights data, artificial intelligence, and ML. The company already used AWS in other aspects of its business and found that QuickSight would not only meet all its BI and reporting needs with seamless integrations into the AWS stack, but also bring with it several unique benefits unlike incumbents and other tools evaluated. “We chose QuickSight because of its embedded analytic capabilities, serverless architecture, and consumption-based pricing,” says Minnaert. “Using QuickSight to launch interactive dashboards and reporting for our customers, along with the ability for our customer success teams to create or alter dashboard prototypes on our internal-facing QuickSight instance and then promote those dashboards to customers through the product, was a very compelling use case.”
QuickSight would help local data stewards, who weren’t technical but knew the use cases intimately, to create their own dashboards and prototype them with their customers before promoting them through the product. “The serverless model was also compelling because we did not have to pay for server instances nor license fees per reader. With QuickSight, we pay for usage. This makes it easy for us to provide access to everyone by default. This is a key pillar in our ability to democratize data,” says Minnaert.
Architecting a portable data layer and migrating to QuickSight to accelerate time to value
After choosing QuickSight as its solution in November 2021, Showpad took on two streams of development: migrating internal organization-wide BI reporting and building in-product reporting using embedded analytics. Showpad worked closely alongside the QuickSight team to have a smooth rollout. The company involved members of the QuickSight team in its internal communications and set up meetings every 2 weeks to resolve difficult issues quickly.
On the internal reporting front, the data team took a “working backwards” approach to make sure it had the right approach before going all in with all existing dashboards. Showpad selected five difficult and complex dashboards and took 3 months to explore various possibilities using QuickSight. For example, the team determined that user log-in would be automated with single sign-on and Okta and built a plan for assets organization, asset promotion, and access controls. The company also used the opportunity to reimagine its data pipeline and architecture. A key architectural decision that Showpad took during this time was to create a portable data layer by decoupling the data transformation from visualization, ML, or ad hoc querying tools and centralizing its business logic. The portable data layer facilitated the creation of data products for varied use cases, made available within various tools based on the need of the consumer—be it a business analyst, data scientist, or business user.
After the solution approach was decided on and the foundation was built, the team wanted to scale. However, with 70 dashboards with over 1,000 visuals with varying levels of complexities, including proprietary logic unique to certain tools, and data from over 1,000 tables ingesting data from over 20 data sources, the team decided to take a measured approach to the migration. The entire data team of 20 people were “all on hands on deck” for the project.
First, Showpad created a landscape of all the dashboards, connecting data sources and dependencies before prioritizing the migration order. The company decided to start with dashboards with the fewest dependencies, like product and engineering dashboards that had a single data source, followed by revenue operations dashboards with a couple of data sources, and lastly with customer success and marketing dashboards that combined product and engineering and revenue operations data. After migration was complete, Showpad validated all the numbers and worked with business stakeholders for quality assurance. It launched the first set of dashboards in April 2022, followed by customer success and marketing dashboards in July 2022. As of January 2023, Showpad’s QuickSight instance includes over 2,433 datasets and 199 dashboards.
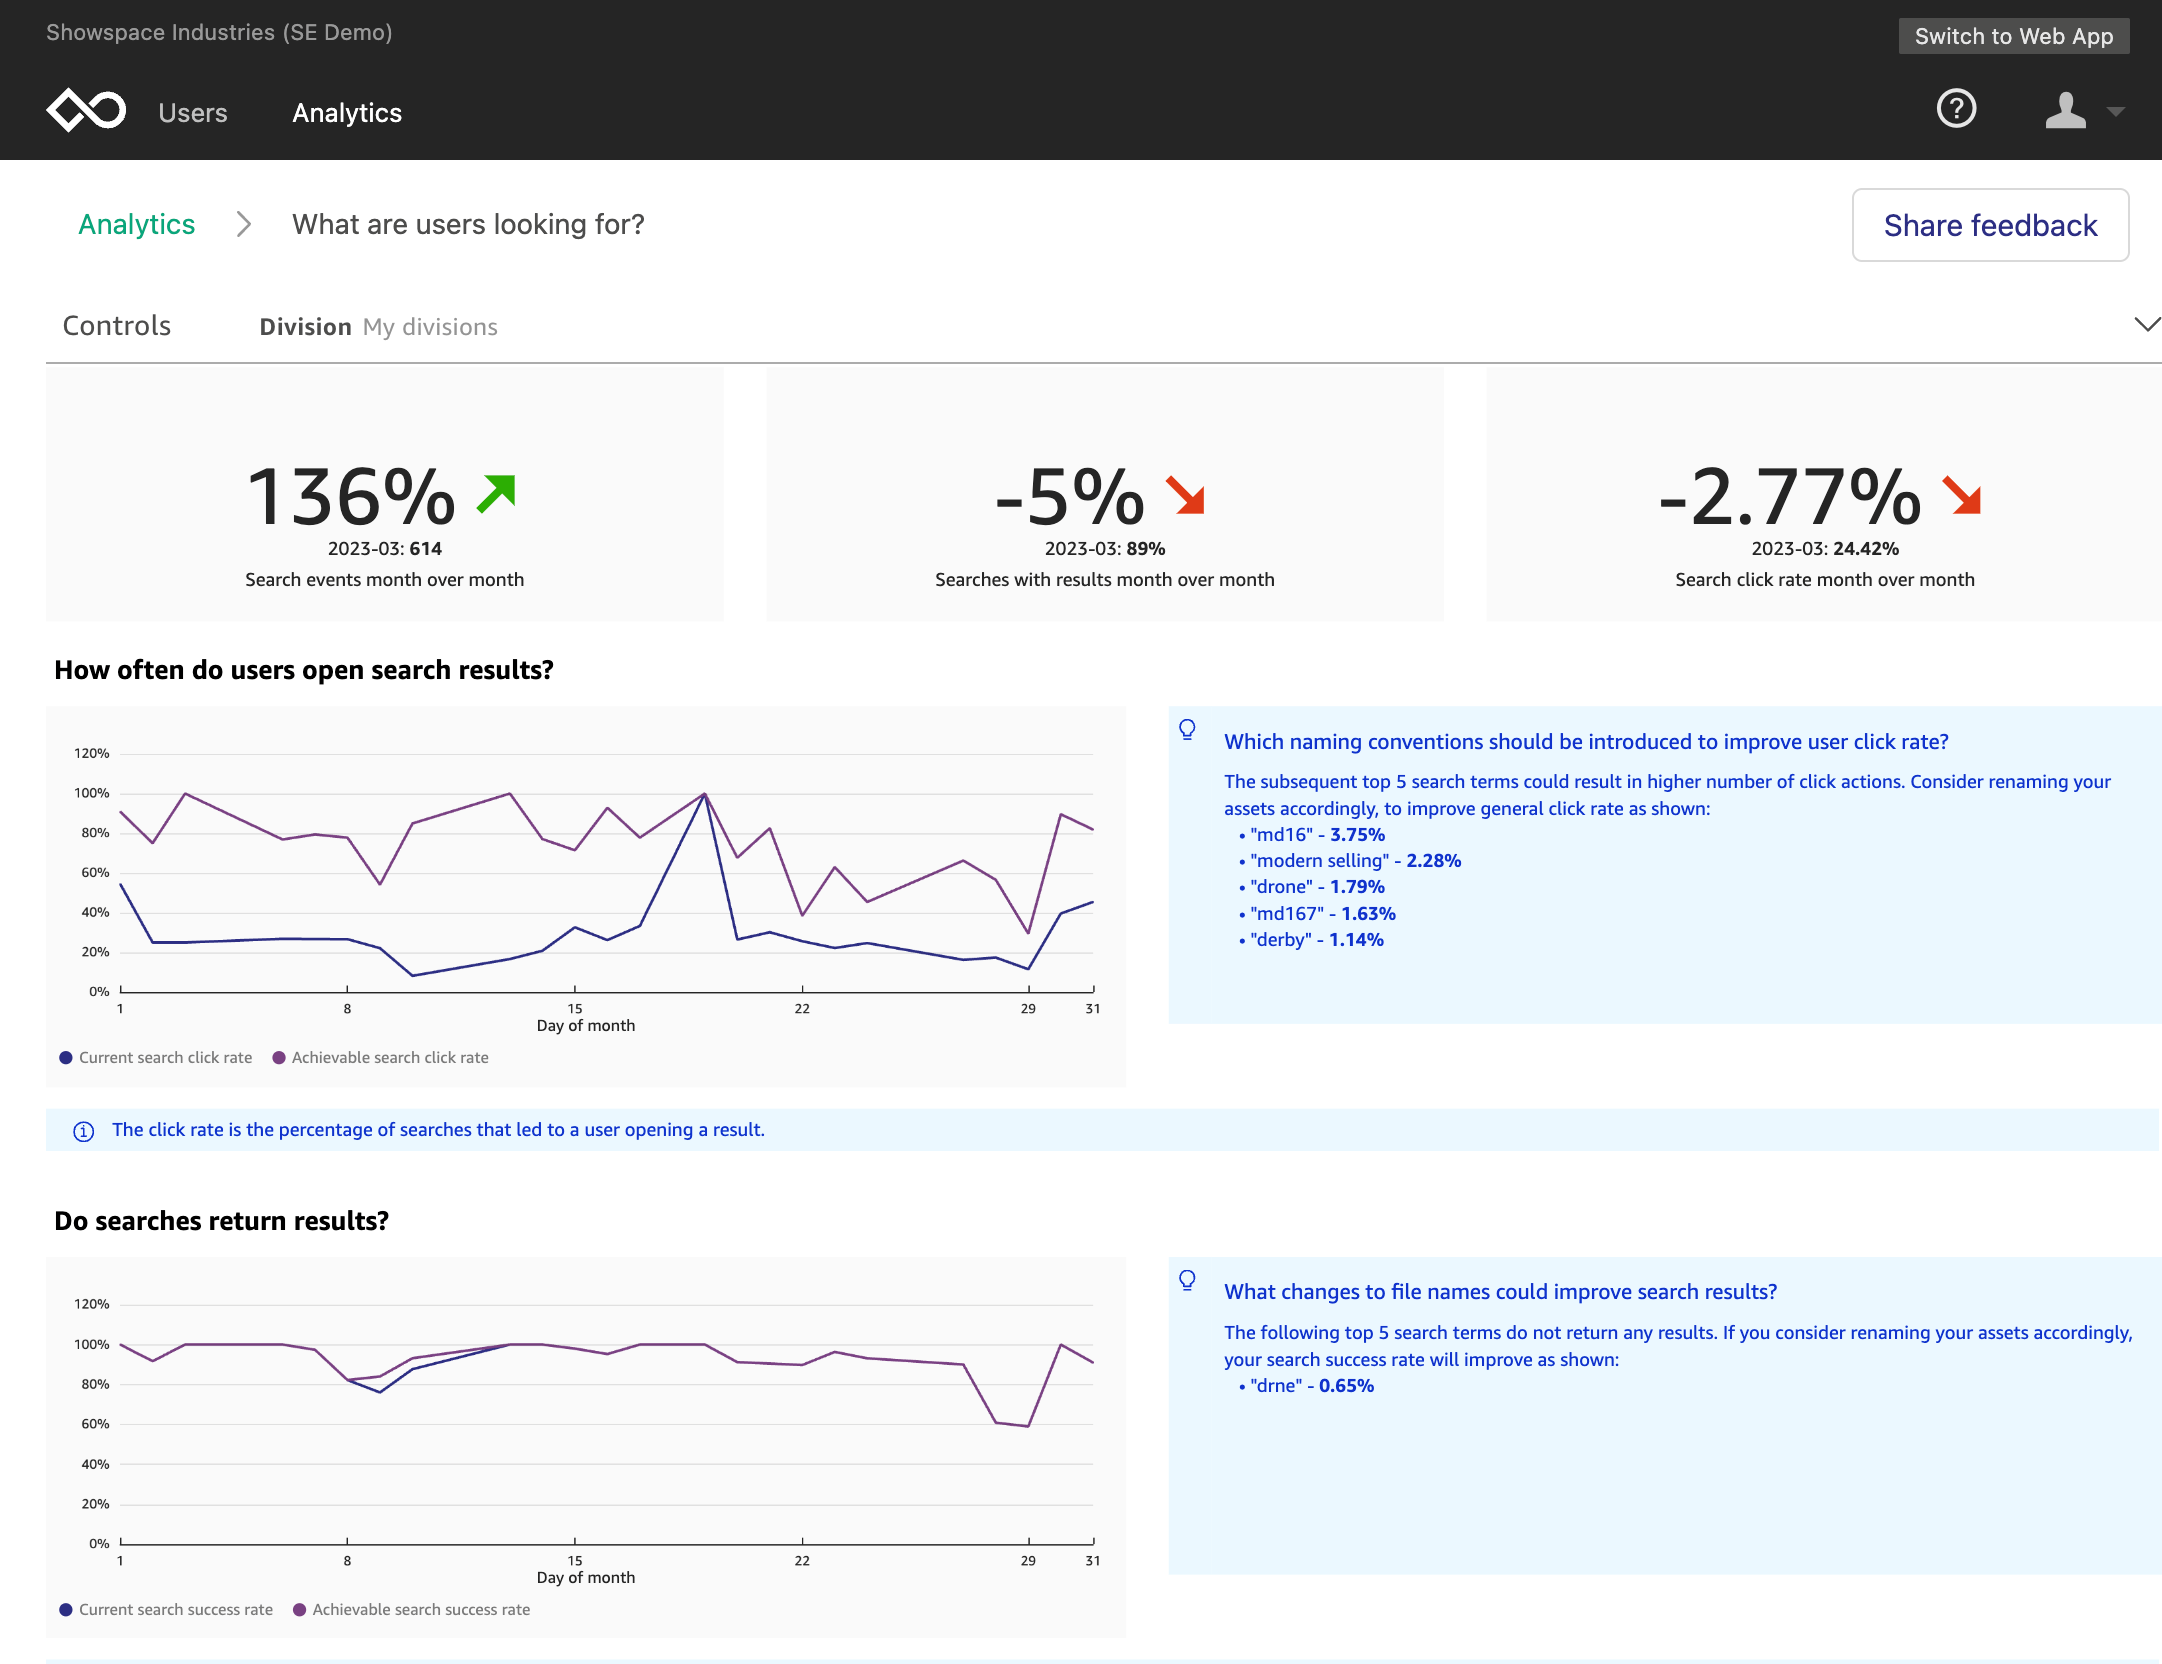
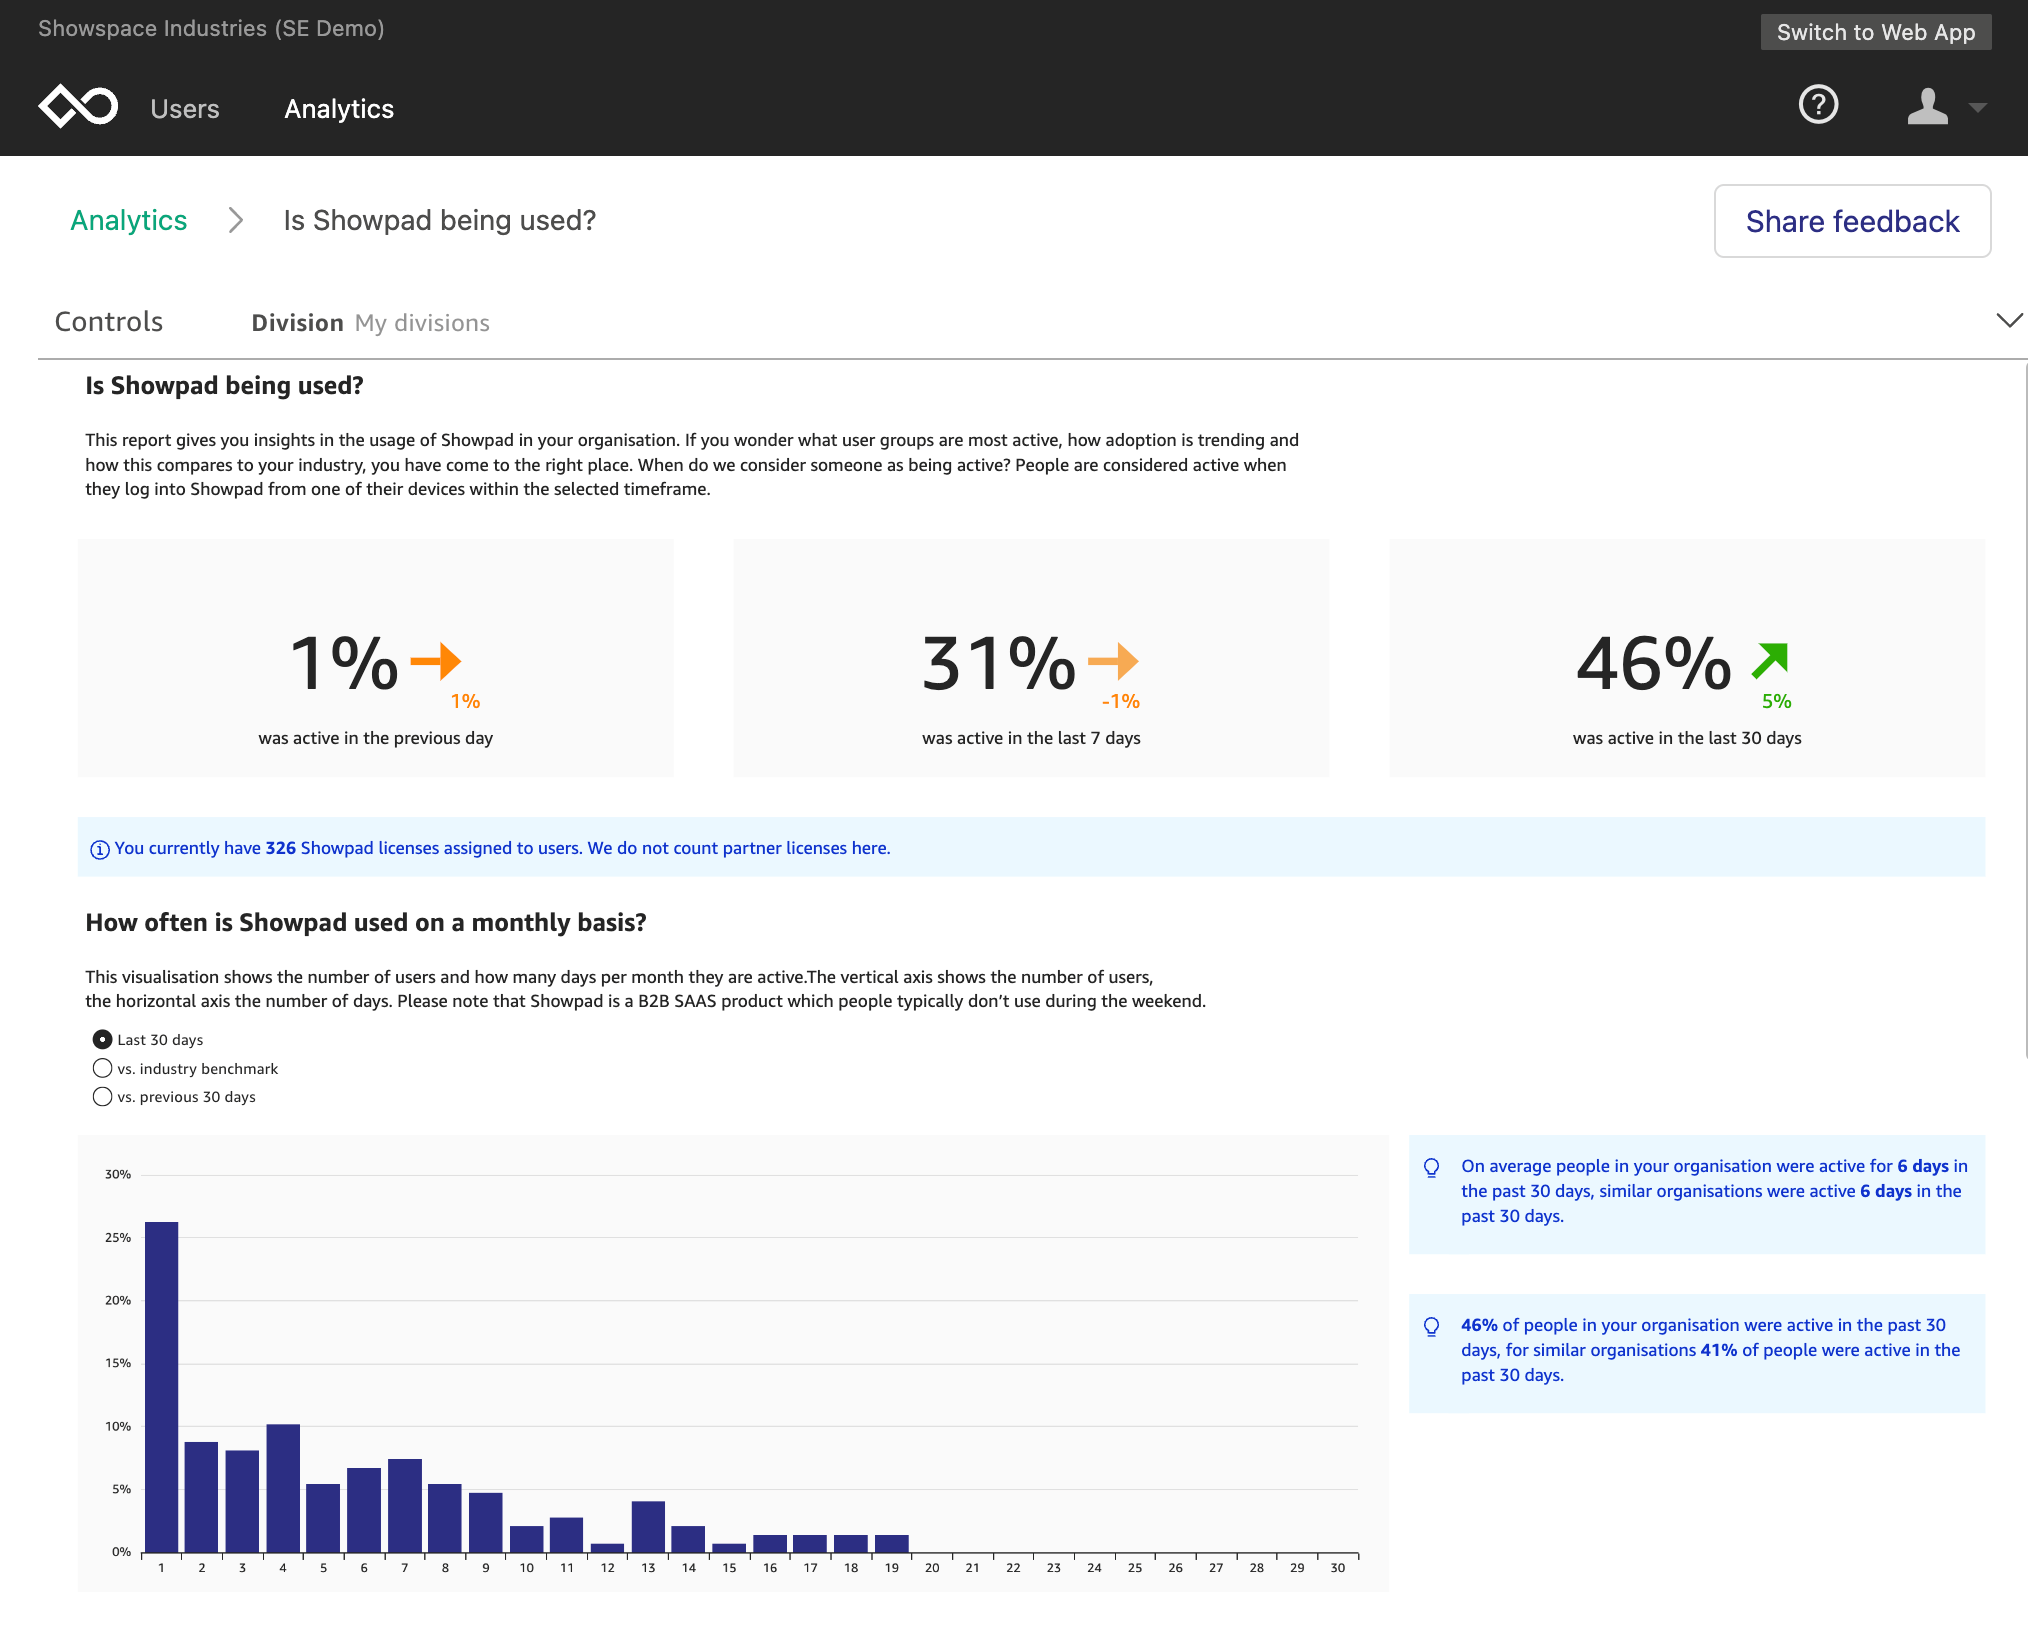
Showpad also achieves benefits for its customers by using QuickSight to deliver a wide variety of insights, including usage dashboards, industry comparisons, user comparison, group comparison, and revenue attribution. On the second workstream of in-product customer-facing reporting, Showpad released its first version of QuickSight reporting to customers in June 2022. “We went through user research, development, and beta tests in a span of 6 months, which was a fast turnaround and a big win for us,” says Minnaert. And Showpad aims to further accelerate the turnaround time to make a report and ship it to a customer.
With the foundational architecture now in place, shipping to a customer can happen in a few sprints, with most of the time spent on iterating and fine-tuning insights instead of engineering a scalable reporting solution. Showpad can also improve the insights it offers to customers. “Using QuickSight in our product makes it a powerful tool,” says Minnaert. “We can launch reporting for our customers so that they can look at and interpret data by themselves.” Showpad can then follow up with tailor-made reporting for each customer using the same data so that it tells a consistent story.
After a dashboard is agreed on, the dashboard can go through Showpad’s automated dashboard promotion process that can take an idea from development to production to a smile on a customer’s face in weeks, not months.
Unlocking innovation with self-service BI and rapid prototyping
By providing dashboard and report building to analysts and nontechnical users, Showpad drastically reduced overall turnaround time to build and deliver insights, down from months to weeks. Showpad also increased dashboard development activity by three times across the organization.
Showpad users can quickly prototype reports in a well-known environment—building reports using QuickSight, and then testing them with customers by helping customers understand how the reporting would look and function. “After we settle on reports or dashboards, it does not take much engineering effort to bring them to production,” says Minnaert. “We can make a lot of innovation happen by quickly prototyping and bringing validated prototypes to production.” Showpad’s users and customers also benefit from performance gains with 10 times increased speed when using SPICE (Super-fast, Parallel, In-memory Calculation Engine), which is the robust in-memory engine that QuickSight uses. It takes only seconds to load dashboards.
Because QuickSight is serverless and uses a session-based pricing model, Showpad expects to see cost savings. By paying per use, Showpad can easily provide access to all its users and customers without purchasing expensive per-reader licenses. Showpad also doesn’t need to pay for server instances or maintain infrastructure for BI. In addition, Showpad can deprecate custom reporting, infrastructure, and multiple tools with the new data architecture and QuickSight. “Much of our cost savings will come from being able to deprecate the custom reporting that we’ve made in the past,” says Minnaert. “The custom reporting used a lot of infrastructure that we no longer need to maintain.” Showpad expects to see a three times increase in projected return on investment in the upcoming year.
Showpad completed its internal BI migration to QuickSight by the end of 2022. Showpad also continues to expand the in-product reporting while continuing to optimize performance for the best customer experience. Showpad hopes to further reduce the time it takes to load a dashboard to under 1 second.
In conjunction with Showpad’s new portable data layer, QuickSight helps users of all types across its organization and customers self-serve data and insights rapidly. Everyone in Showpad gets access to data and insights the day they onboard with Showpad. To make self-service even easier, Showpad will soon launch embedded Amazon QuickSight Q so anyone can ask questions in natural language and receive accurate answers with relevant visualizations that help them gain insights from the data. By helping business users and experts rapidly prototype dashboards and reports in line with user and customer needs, Showpad uses the power of data to unlock innovation and drive growth across its organization. “QuickSight has become our go-to tool for any BI requirement at Showpad—both internal and external customer facing, especially when it comes to correlating data across departments and business units,” says Minnaert.
Get started with QuickSight
Migrating to QuickSight enabled Showpad to streamline data and insights access across teams and customers and reduced overall turnaround time to build and deliver insights from months to weeks.
Learn more about unleashing your organization’s ability to accelerate revenue growth with Showpad. To learn more about how QuickSight can help your business with dashboards, reports, and more, visit Amazon QuickSight.
About the Author
 Shruthi Panicker is a Senior Product Marketing Manager with Amazon QuickSight at AWS. As an engineer turned product marketer, Shruthi has spent over 15 years in the technology industry in various roles from software engineering, to solution architecting to product marketing. She is passionate about working at the intersection of technology and business to tell great product stories that help drive customer value.