Post Syndicated from Stefan Gromoll original https://aws.amazon.com/blogs/big-data/amazon-redshift-lower-price-higher-performance/
Like virtually all customers, you want to spend as little as possible while getting the best possible performance. This means you need to pay attention to price-performance. With Amazon Redshift, you can have your cake and eat it too! Amazon Redshift delivers up to 4.9 times lower cost per user and up to 7.9 times better price-performance than other cloud data warehouses on real-world workloads using advanced techniques like concurrency scaling to support hundreds of concurrent users, enhanced string encoding for faster query performance, and Amazon Redshift Serverless performance enhancements. Read on to understand why price-performance matters and how Amazon Redshift price-performance is a measure of how much it costs to get a particular level of workload performance, namely performance ROI (return on investment).
Because both price and performance enter into the price-performance calculation, there are two ways to think about price-performance. The first way is to hold price constant: if you have $1 to spend, how much performance do you get from your data warehouse? A database with better price-performance will deliver better performance for each $1 spent. Therefore, when holding price constant when comparing two data warehouses that cost the same, the database with better price-performance will run your queries faster. The second way to look at price-performance is to hold performance constant: if you need your workload to finish in 10 minutes, what will it cost? A database with better price-performance will run your workload in 10 minutes at a lower cost. Therefore, when holding performance constant when comparing two data warehouses that are sized to deliver the same performance, the database with better price-performance will cost less and save you money.
Finally, another important aspect of price-performance is predictability. Knowing how much your data warehouse is going to cost as the number of data warehouse users grows is crucial for planning. It should not only deliver the best price-performance today, but also scale predictably and deliver the best price-performance as more users and workloads are added. An ideal data warehouse should have linear scale—scaling your data warehouse to deliver twice the query throughput should ideally cost twice as much (or less).
In this post, we share performance results to illustrate how Amazon Redshift delivers significantly better price-performance compared to leading alternative cloud data warehouses. This means that if you spend the same amount on Amazon Redshift as you would on one of these other data warehouses, you will get better performance with Amazon Redshift. Alternatively, if you size your Redshift cluster to deliver the same performance, you will see lower costs compared to these alternatives.
Price-performance for real-world workloads
You can use Amazon Redshift to power a very wide diversity of workloads, from batch-processing of complex extract, transform, and load (ETL)-based reports, and real-time streaming analytics to low-latency business intelligence (BI) dashboards that need to serve hundreds or even thousands of users at the same time with subsecond response times, and everything in between. One of the ways we continually improve price-performance for our customers is to constantly review the software and hardware performance telemetry from the Redshift fleet, looking for opportunities and customer use cases where we can further improve Amazon Redshift performance.
Some recent examples of performance optimizations driven by fleet telemetry include:
- String query optimizations – By analyzing how Amazon Redshift processed different data types in the Redshift fleet, we found that optimizing string-heavy queries would bring significant benefit to our customers’ workloads. (We discuss this in more detail later in this post.)
- Automated materialized views – We found that Amazon Redshift customers often run many queries that have common subquery patterns. For example, several different queries may join the same three tables using the same join condition. Amazon Redshift is now able to automatically create and maintain materialized views and then transparently rewrite queries to use the materialized views using the machine-learned automated materialized view autonomics feature in Amazon Redshift. When enabled, automated materialized views can transparently increase query performance for repetitive queries without any user intervention. (Note that automated materialized views were not used in any of the benchmark results discussed in this post).
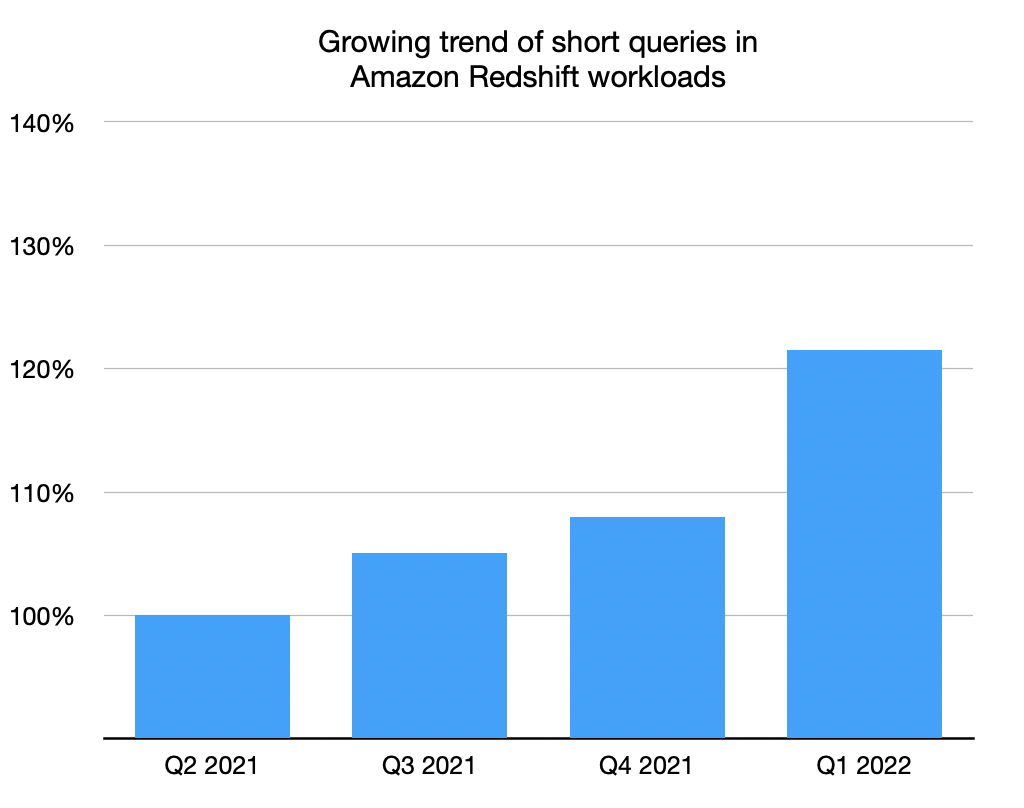
- High-concurrency workloads – A growing use case we see is using Amazon Redshift to serve dashboard-like workloads. These workloads are characterized by desired query response times of single-digit seconds or less, with tens or hundreds of concurrent users running queries simultaneously with a spiky and often unpredictable usage pattern. The prototypical example of this is an Amazon Redshift-backed BI dashboard that has a spike in traffic Monday mornings when a large number of users start their week.
High-concurrency workloads in particular have very broad applicability: most data warehouse workloads operate at concurrency, and it’s not uncommon for hundreds or even thousands of users to run queries on Amazon Redshift at the same time. Amazon Redshift was designed to keep query response times predictable and fast. Redshift Serverless does this automatically for you by adding and removing compute as needed to keep query response times fast and predictable. This means a Redshift Serverless-backed dashboard that loads quickly when it’s being accessed by one or two users will continue to load quickly even when many users are loading it at the same time.
To simulate this type of workload, we used a benchmark derived from TPC-DS with a 100 GB data set. TPC-DS is an industry-standard benchmark that includes a variety of typical data warehouse queries. At this relatively small scale of 100 GB, queries in this benchmark run on Redshift Serverless in an average of a few seconds, which is representative of what users loading an interactive BI dashboard would expect. We ran between 1–200 concurrent tests of this benchmark, simulating between 1–200 users trying to load a dashboard at the same time. We also repeated the test against several popular alternative cloud data warehouses that also support scaling out automatically (if you’re familiar with the post Amazon Redshift continues its price-performance leadership, we didn’t include Competitor A because it doesn’t support automatically scaling up). We measured average query response time, meaning how long a user would wait for their queries to finish (or their dashboard to load). The results are shown in the following chart.

Competitor B scales well until around 64 concurrent queries, at which point it is unable to provide additional compute and queries begin to queue, leading to increased query response times. Although Competitor C is able to scale automatically, it scales to lower query throughput than both Amazon Redshift and Competitor B and is not able to keep query runtimes low. In addition, it doesn’t support queueing queries when it runs out of compute, which prevents it from scaling beyond around 128 concurrent users. Submitting additional queries beyond this are rejected by the system.
Here, Redshift Serverless is able to keep the query response time relatively consistent at around 5 seconds even when hundreds of users are running queries at the same time. The average query response times for Competitors B and C increase steadily as load on the warehouses increases, which results in users having to wait longer (up to 16 seconds) for their queries to return when the data warehouse is busy. This means that if a user is trying to refresh a dashboard (which may even submit several concurrent queries when reloaded), Amazon Redshift would be able to keep dashboard load times far more consistent even if the dashboard is being loaded by tens or hundreds of other users at the same time.
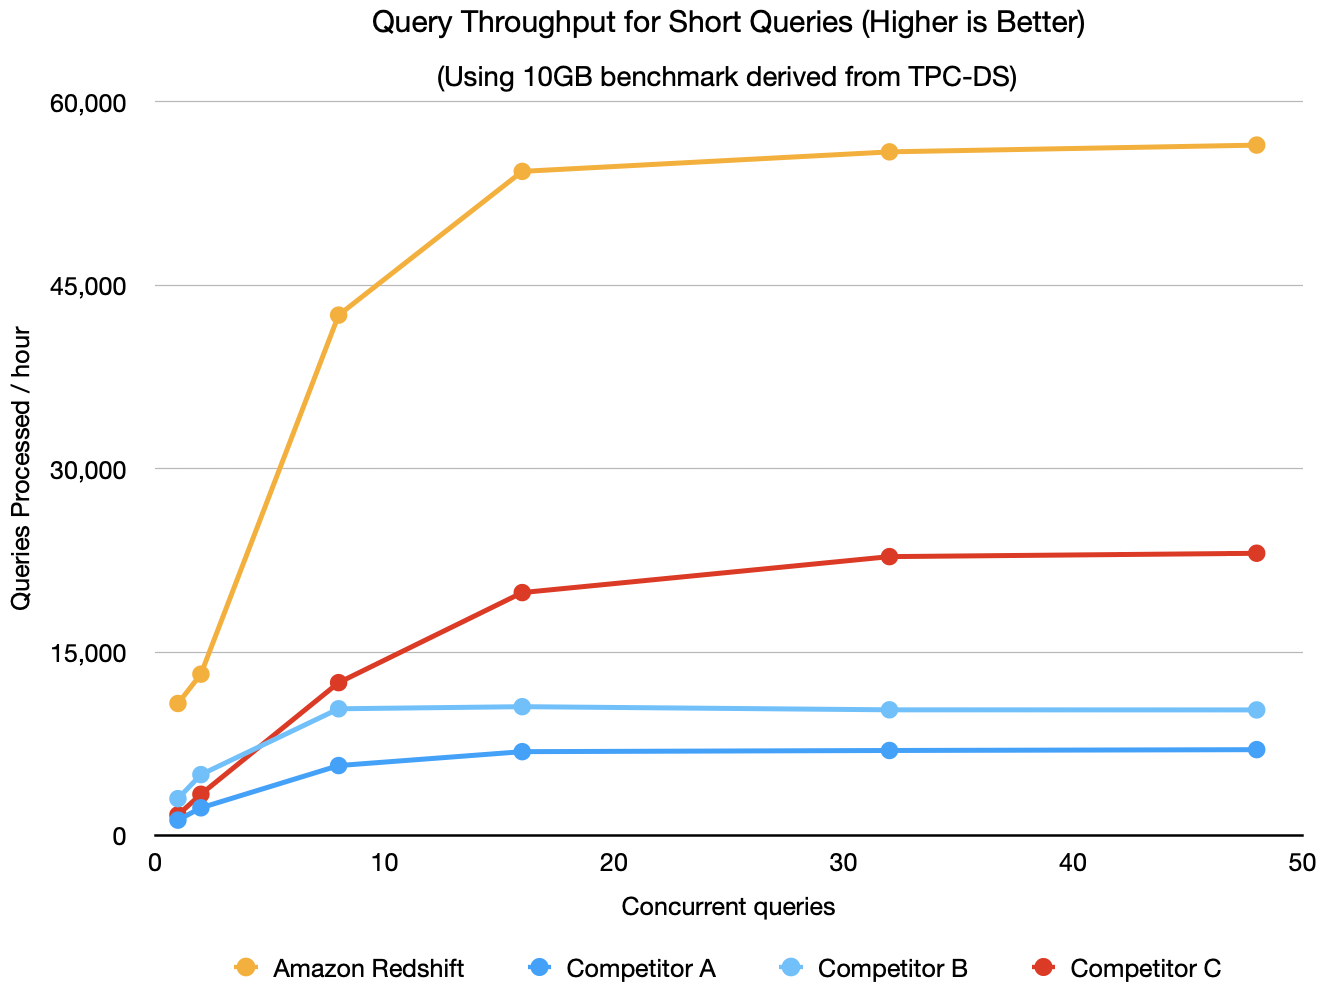
Because Amazon Redshift is able to deliver very high query throughput for short queries (as we wrote about in Amazon Redshift continues its price-performance leadership), it’s also able to handle these higher concurrencies when scaling out more efficiently and therefore at a significantly lower cost. To quantify this, we look at the price-performance using published on-demand pricing for each of the warehouses in the preceding test, shown in the following chart. It’s worth noting that using Reserved Instances (RIs), especially 3-year RIs purchased with the all upfront payment option, has the lowest cost to run Amazon Redshift on Provisioned clusters, resulting in the best relative price-performance compared to on-demand or other RI options.
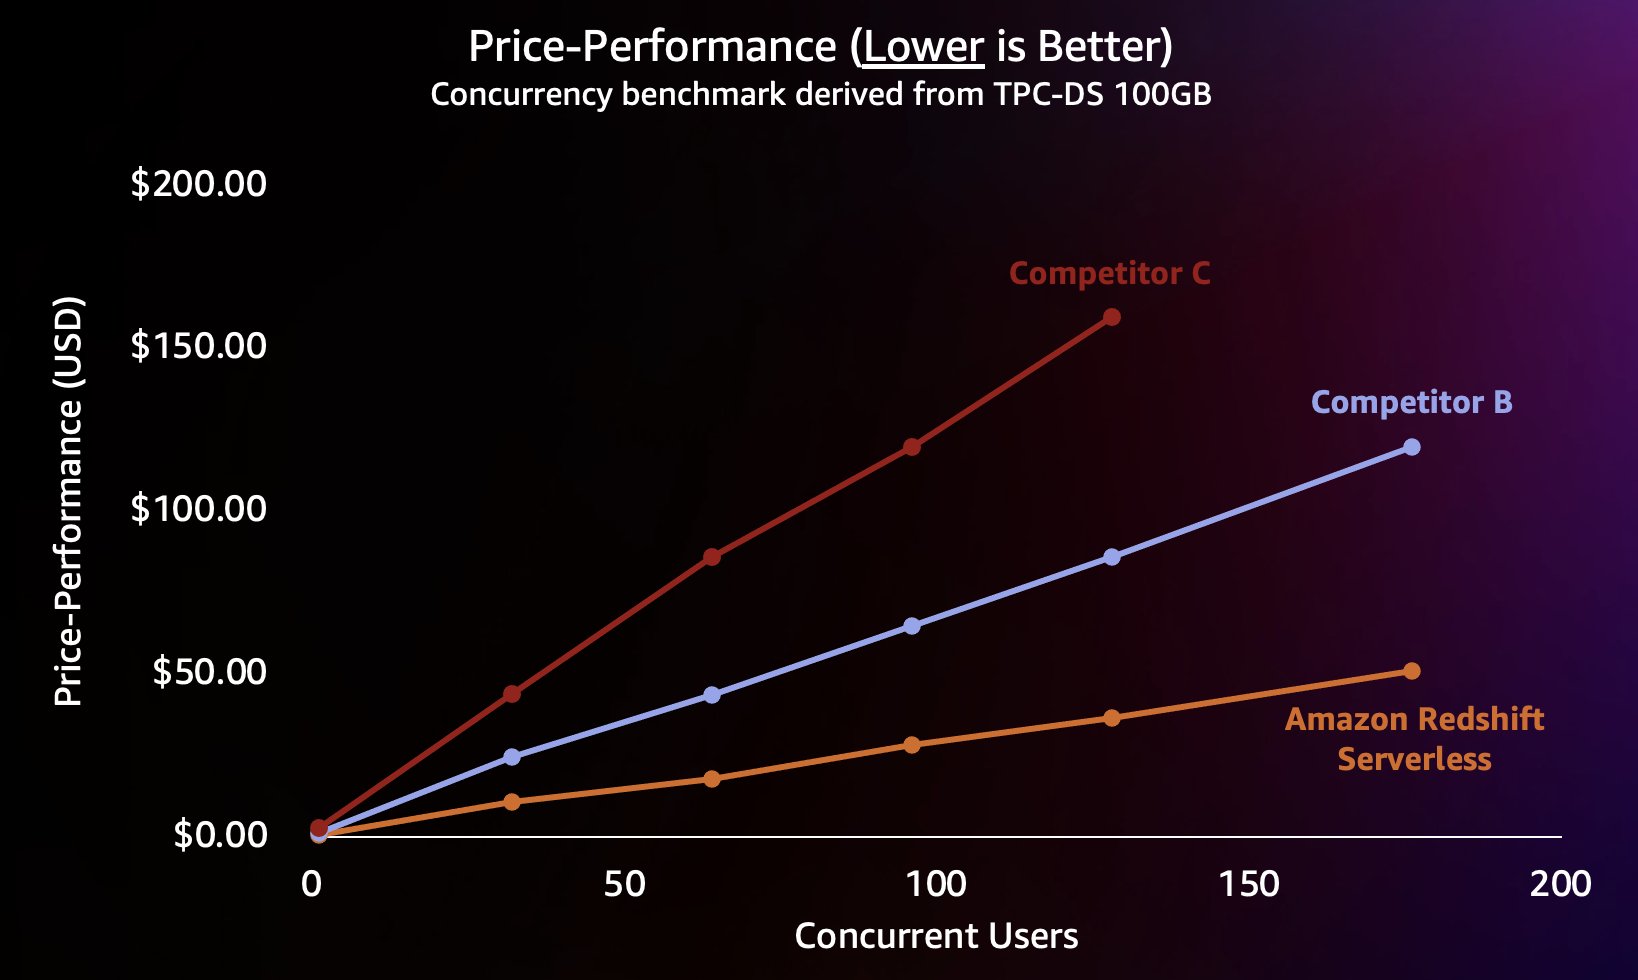
So not only is Amazon Redshift able to deliver better performance at higher concurrencies, it’s able to do so at significantly lower cost. Each data point in the price-performance chart is equivalent to the cost to run the benchmark at the specified concurrency. Because the price-performance is linear, we can divide the cost to run the benchmark at any concurrency by the concurrency (number of Concurrent Users in this chart) to tell us how much adding each new user costs for this particular benchmark.

The preceding results are straightforward to replicate. All queries used in the benchmark are available in our GitHub repository and performance is measured by launching a data warehouse, enabling Concurrency Scaling on Amazon Redshift (or the corresponding auto scaling feature on other warehouses), loading the data out of the box (no manual tuning or database-specific setup), and then running a concurrent stream of queries at concurrencies from 1–200 in steps of 32 on each data warehouse. The same GitHub repo references pregenerated (and unmodified) TPC-DS data in Amazon Simple Storage Service (Amazon S3) at various scales using the official TPC-DS data generation kit.
Optimizing string-heavy workloads
As mentioned earlier, the Amazon Redshift team is continuously looking for new opportunities to deliver even better price-performance for our customers. One improvement we recently launched that significantly improved performance is an optimization that accelerates the performance of queries over string data. For example, you might want to find the total revenue generated from retail stores located in New York City with a query like SELECT sum(price) FROM sales WHERE city = ‘New York’. This query is applying a predicate over string data (city = ‘New York’). As you can imagine, string data processing is ubiquitous in data warehouse applications.
To quantify how often customers’ workloads access strings, we conducted a detailed analysis of string data type usage using fleet telemetry of tens of thousands of customer clusters managed by Amazon Redshift. Our analysis indicates that in 90% of the clusters, string columns constitute at least 30% of all the columns, and in 50% of the clusters, string columns constitute at least 50% of all the columns. Moreover, a majority of all queries run on the Amazon Redshift cloud data warehouse platform access at least one string column. Another important factor is that string data is very often low cardinality, meaning the columns contain a relatively small set of unique values. For example, although an orders table representing sales data may contain billions of rows, an order_status column within that table might contain only a few unique values across those billions of rows, such as pending, in process, and completed.
As of this writing, most string columns in Amazon Redshift are compressed with LZO or ZSTD algorithms. These are good general-purpose compression algorithms, but they aren’t designed to take advantage of low-cardinality string data. In particular, they require that data be decompressed before being operated on, and are less efficient in their use of hardware memory bandwidth. For low-cardinality data, there is another type of encoding that can be more optimal: BYTEDICT. This encoding uses a dictionary-encoding scheme that allows the database engine to operate directly over compressed data without the need to decompress it first.
To further improve price-performance for string-heavy workloads, Amazon Redshift is now introducing additional performance enhancements that speed up scans and predicate evaluations, over low-cardinality string columns that are encoded as BYTEDICT, between 5–63 times faster (see results in the next section) compared to alternative compression encodings such as LZO or ZSTD. Amazon Redshift achieves this performance improvement by vectorizing scans over lightweight, CPU-efficient, BYTEDICT-encoded, low-cardinality string columns. These string-processing optimizations make effective use of memory bandwidth afforded by modern hardware, enabling real-time analytics over string data. These newly introduced performance capabilities are optimal for low-cardinality string columns (up to a few hundred unique string values).
You can automatically benefit from this new high performance string enhancement by enabling automatic table optimization in your Amazon Redshift data warehouse. If you don’t have automatic table optimization enabled on your tables, you can receive recommendations from the Amazon Redshift Advisor in the Amazon Redshift console on a string column’s suitability for BYTEDICT encoding. You can also define new tables that have low-cardinality string columns with BYTEDICT encoding. String enhancements in Amazon Redshift are now available in all AWS Regions where Amazon Redshift is available.
Performance results
To measure the performance impact of our string enhancements, we generated a 10TB (Tera Byte) dataset that consisted of low-cardinality string data. We generated three versions of the data using short, medium, and long strings, corresponding to the 25th, 50th, and 75th percentile of string lengths from Amazon Redshift fleet telemetry. We loaded this data into Amazon Redshift twice, encoding it in one case using LZO compression and in another using BYTEDICT compression. Finally, we measured the performance of scan-heavy queries that return many rows (90% of the table), a medium number of rows (50% of the table), and a few rows (1% of the table) over these low-cardinality string datasets. The performance results are summarized in the following chart.
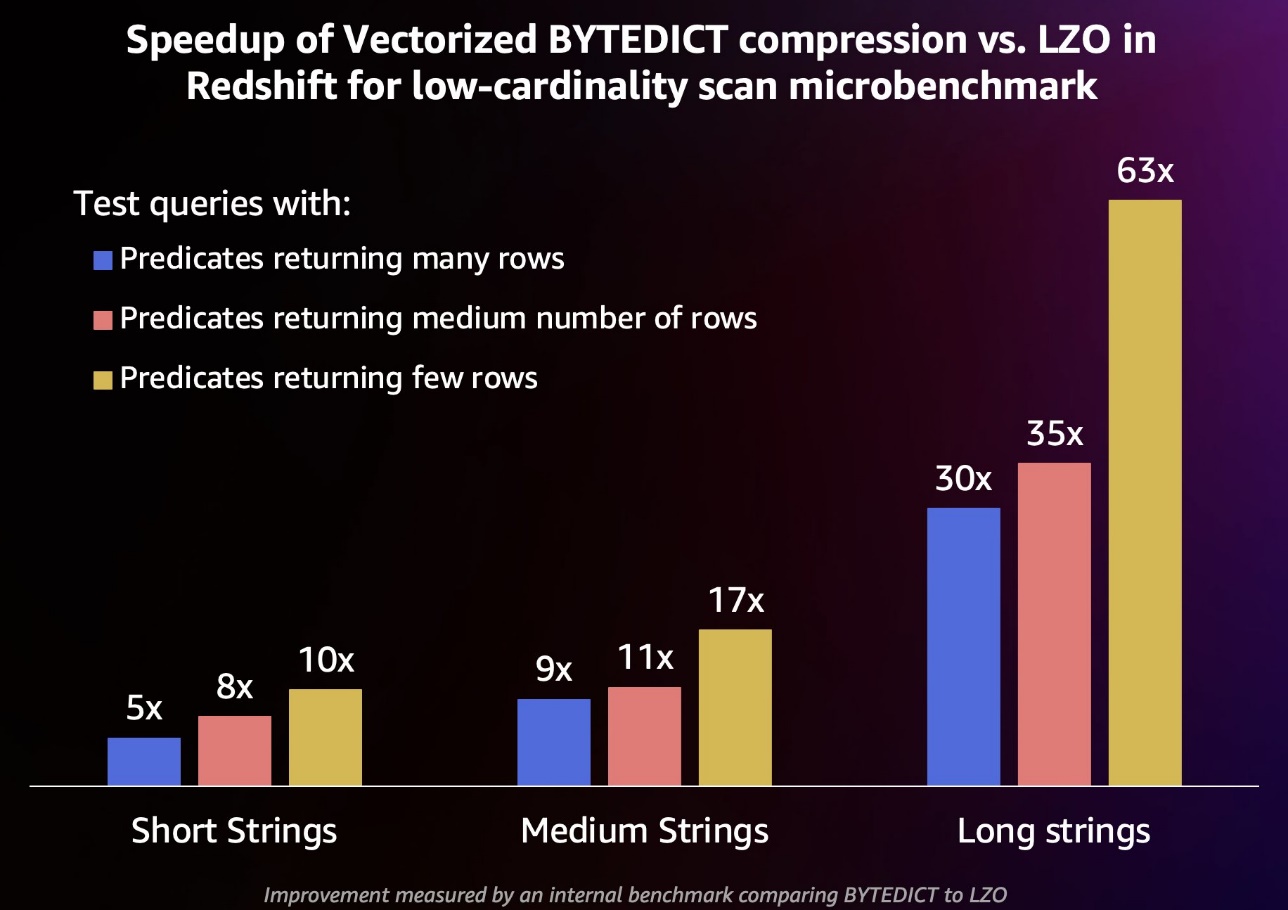
Queries with predicates that match a high percentage of rows saw improvements of 5–30 times with the new vectorized BYTEDICT encoding compared to LZO, whereas queries with predicates that match a low percentage of rows saw improvements of 10–63 times in this internal benchmark.
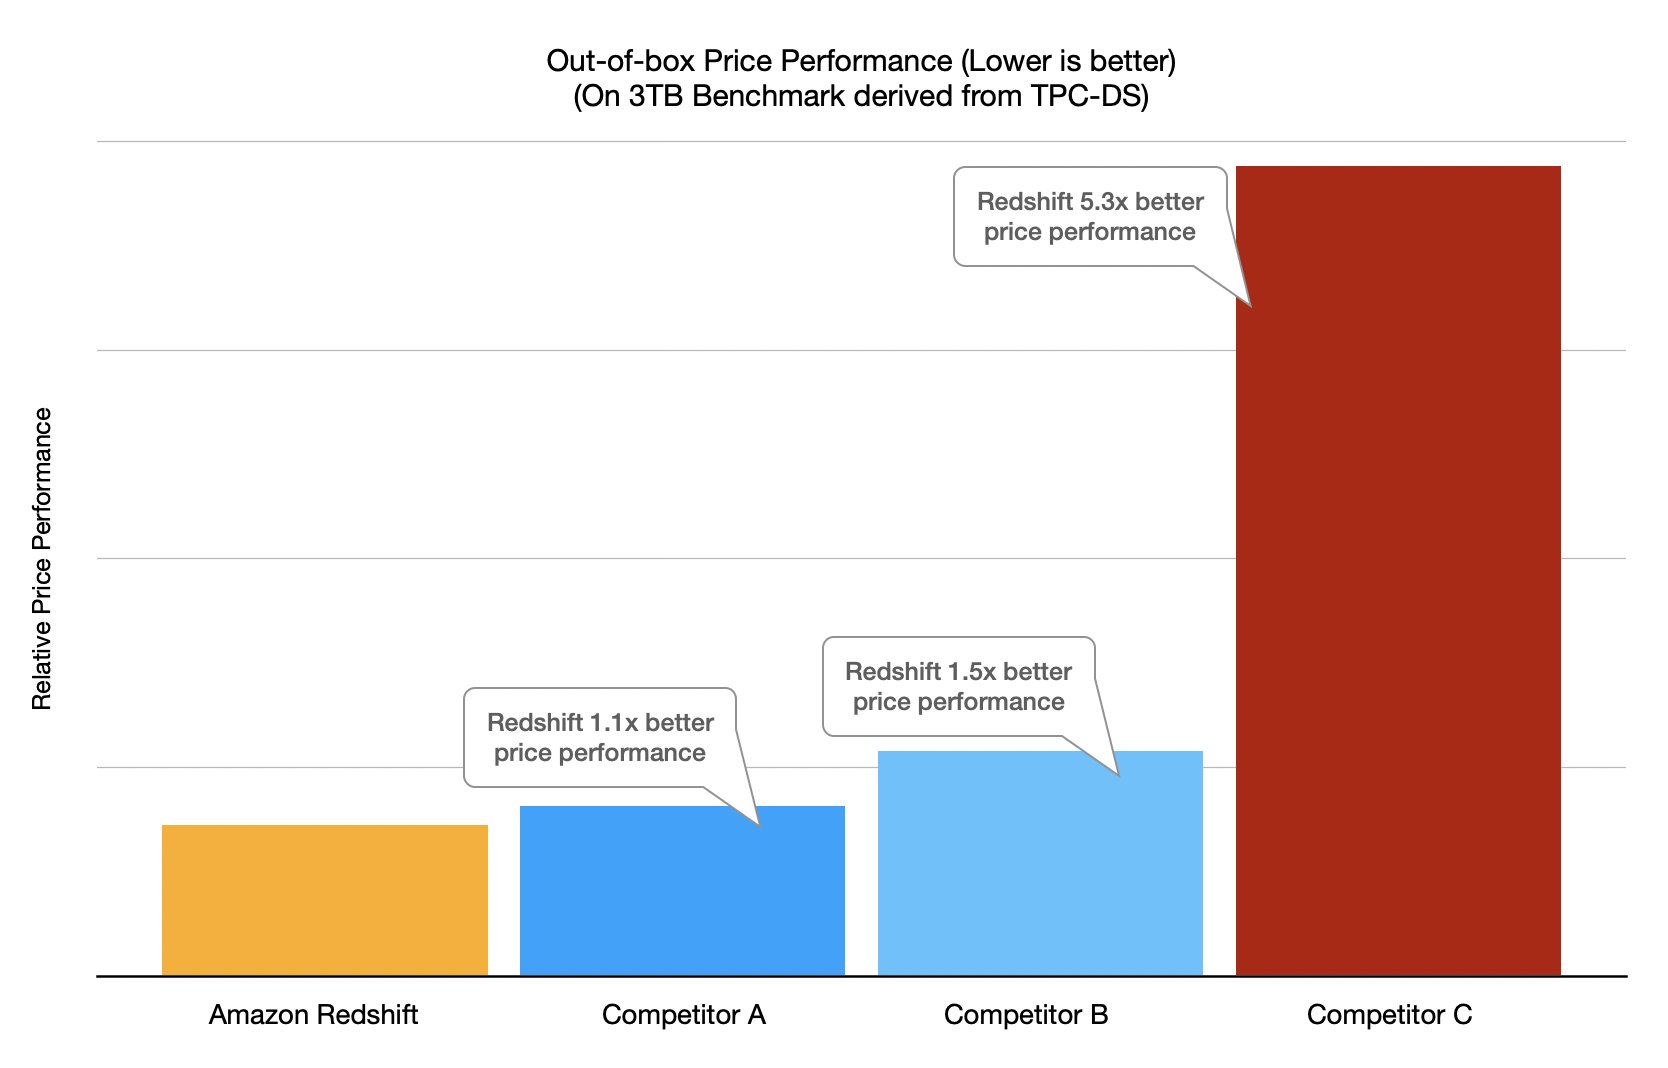
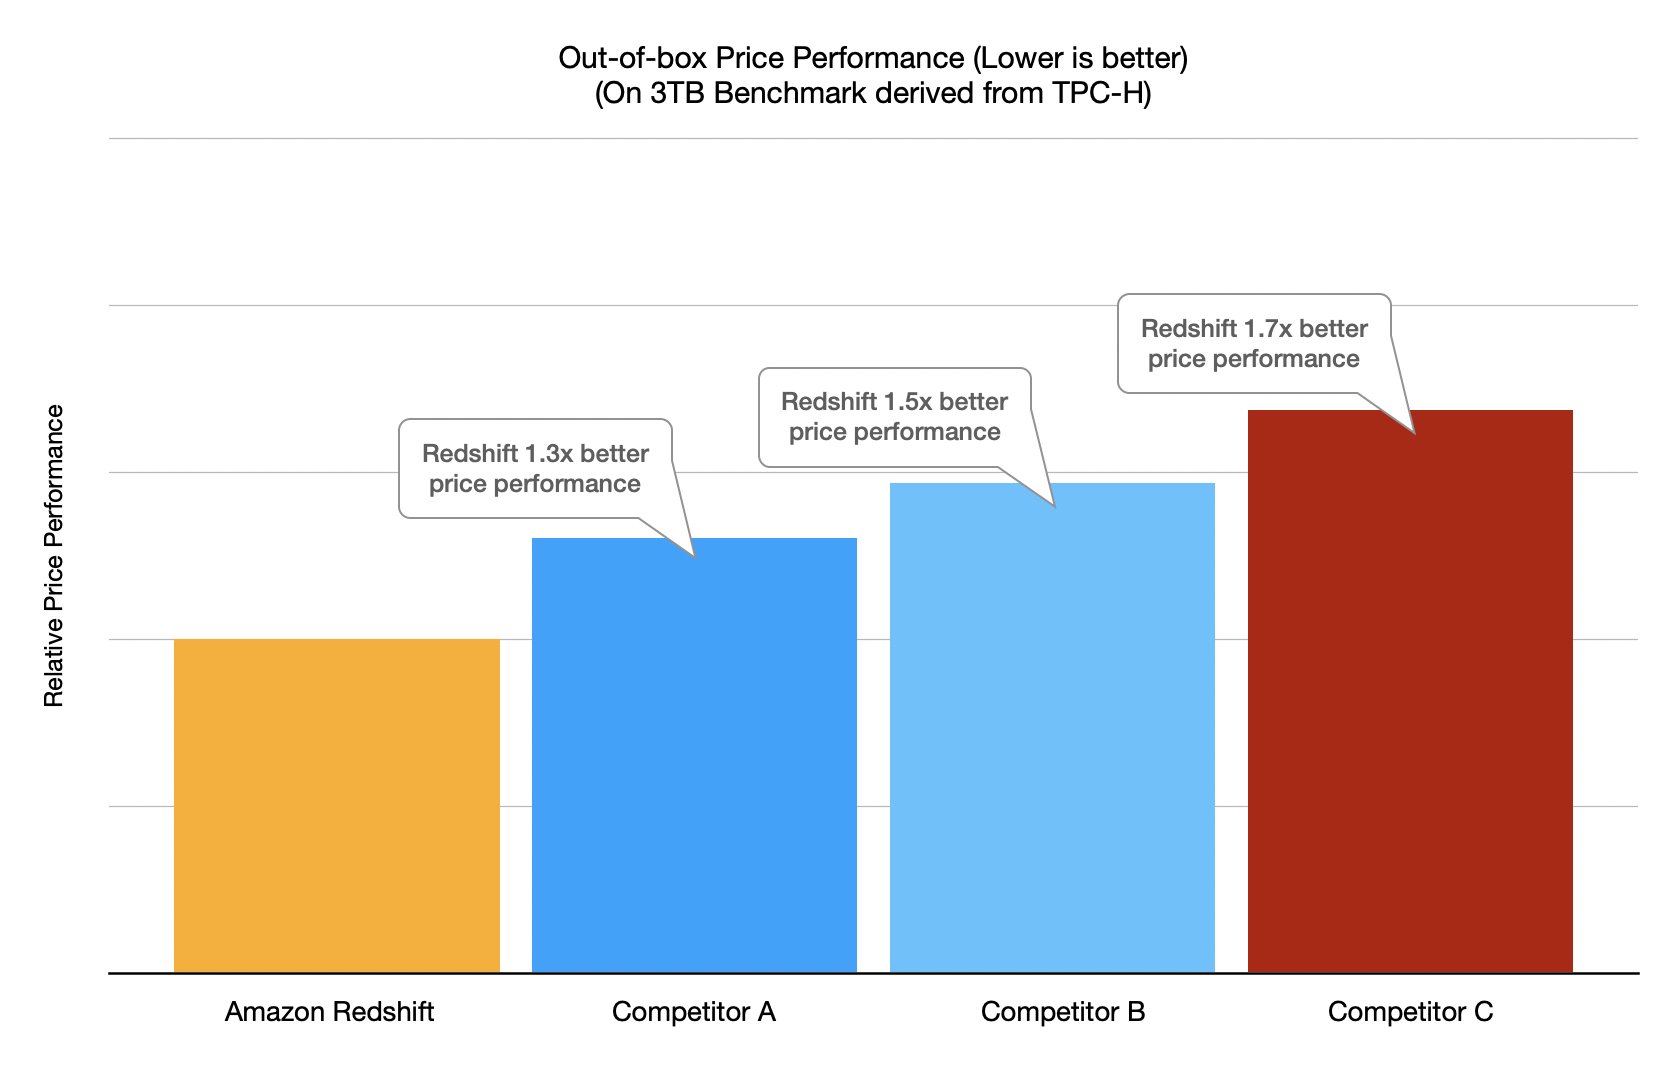
Redshift Serverless price-performance
In addition to the high-concurrency performance results presented in this post, we also used the TPC-DS-derived Cloud Data Warehouse benchmark to compare the price-performance of Redshift Serverless to other data warehouses using a larger 3TB dataset. We chose data warehouses that were priced similarly, in this case within 10% of $32 per hour using publicly available on-demand pricing. These results show that, like Amazon Redshift RA3 instances, Redshift Serverless delivers better price-performance compared to other leading cloud data warehouses. As always, these results can be replicated by using our SQL scripts in our GitHub repository.

We encourage you to try Amazon Redshift using your own proof of concept workloads as the best way to see how Amazon Redshift can meet your data analytics needs.
Find the best price-performance for your workloads
The benchmarks used in this post are derived from the industry-standard TPC-DS benchmark, and have the following characteristics:
- The schema and data are used unmodified from TPC-DS.
- The queries are generated using the official TPC-DS kit with query parameters generated using the default random seed of the TPC-DS kit. TPC-approved query variants are used for a warehouse if the warehouse doesn’t support the SQL dialect of the default TPC-DS query.
- The test includes the 99 TPC-DS SELECT queries. It doesn’t include maintenance and throughput steps.
- For the single 3TB concurrency test, three power runs were run, and the best run is taken for each data warehouse.
- Price-performance for the TPC-DS queries is calculated as cost per hour (USD) times the benchmark runtime in hours, which is equivalent to the cost to run the benchmark. The latest published on-demand pricing is used for all data warehouses and not Reserved Instance pricing as noted earlier.
We call this the Cloud Data Warehouse benchmark, and you can easily reproduce the preceding benchmark results using the scripts, queries, and data available in our GitHub repository. It is derived from the TPC-DS benchmarks as described in this post, and as such is not comparable to published TPC-DS results, because the results of our tests don’t comply with the official specification.
Conclusion
Amazon Redshift is committed to delivering the industry’s best price-performance for the widest variety of workloads. Redshift Serverless scales linearly with the best (lowest) price-performance, supporting hundreds of concurrent users while maintaining consistent query response times. Based on test results discussed in this post, Amazon Redshift has up to 2.6 times better price-performance at the same level of concurrency compared to the nearest competitor (Competitor B). As mentioned earlier, using Reserved Instances with the 3-year all upfront option gives you the lowest cost to run Amazon Redshift, resulting in even better relative price-performance compared to on-demand instance pricing that we used in this post. Our approach to continuous performance improvement involves a unique combination of customer obsession to understand customer use cases and their associated scalability bottlenecks coupled with continuous fleet data analysis to identify opportunities to make significant performance optimizations.
Each workload has unique characteristics, so if you’re just getting started, a proof of concept is the best way to understand how Amazon Redshift can lower your costs while delivering better performance. When running your own proof of concept, it’s important to focus on the right metrics—query throughput (number of queries per hour), response time, and price-performance. You can make a data-driven decision by running a proof of concept on your own or with assistance from AWS or a system integration and consulting partner.
To stay up to date with the latest developments in Amazon Redshift, follow the What’s New in Amazon Redshift feed.
About the authors
 Stefan Gromoll is a Senior Performance Engineer with Amazon Redshift team where he is responsible for measuring and improving Redshift performance. In his spare time, he enjoys cooking, playing with his three boys, and chopping firewood.
 Ravi Animi is a Senior Product Management leader in the Amazon Redshift team and manages several functional areas of the Amazon Redshift cloud data warehouse service including performance, spatial analytics, streaming ingestion and migration strategies. He has experience with relational databases, multi-dimensional databases, IoT technologies, storage and compute infrastructure services and more recently as a startup founder using AI/deep learning, computer vision, and robotics.
 Aamer Shah is a Senior Engineer in the Amazon Redshift Service team.
 Sanket Hase is a Software Development Manager in the Amazon Redshift Service team.
 Orestis Polychroniou is a Principal Engineer in the Amazon Redshift Service team.