Post Syndicated from Stuti Deshpande original https://aws.amazon.com/blogs/big-data/getting-started-with-aws-glue-data-quality-from-the-aws-glue-data-catalog/
AWS Glue is a serverless data integration service that makes it simple to discover, prepare, and combine data for analytics, machine learning (ML), and application development. You can use AWS Glue to create, run, and monitor data integration and ETL (extract, transform, and load) pipelines and catalog your assets across multiple data stores.
Hundreds of thousands of customers use data lakes for analytics and ML to make data-driven business decisions. Data consumers lose trust in data if it isn’t accurate and recent, making data quality essential for undertaking optimal and correct decisions.
Evaluation of the accuracy and freshness of data is a common task for engineers. Currently, various tools are available to evaluate data quality. However, these tools often require manual processes of data discovery and expertise in data engineering and coding.
AWS Glue Data Quality is a new feature of AWS Glue that measures and monitors the data quality of Amazon Simple Storage Service (Amazon S3)-based data lakes, data warehouses, and other data repositories. AWS Glue Data Quality can be accessed in the AWS Glue Data Catalog and in AWS Glue ETL jobs.
This is Part 1 of a five-part series of posts to explain how AWS Glue Data Quality works. Check out the next posts in the series:
- Part 1: Getting started with AWS Glue Data Quality from the AWS Glue Data Catalog
- Part 2: Getting started with AWS Glue Data Quality for ETL Pipelines
- Part 3: Set up data quality rules across multiple datasets using AWS Glue Data Quality
- Part 4: Set up alerts and orchestrate data quality rules with AWS Glue Data Quality
- Part 5: Visualize data quality score and metrics generated by AWS Glue Data Quality
In this post, we explore using the AWS Glue Data Quality feature by generating data quality recommendations and running data quality evaluations on your table in the Data Catalog. Then we demonstrate how to analyze your AWS Glue Data Quality run results through Amazon Athena.
Solution overview
We guide you through the following steps:
- Provision resources with AWS CloudFormation.
- Explore the generated recommendation rulesets and define rulesets to evaluate your table in the Data Catalog.
- Review the AWS Glue Data Quality recommendations.
- Analyze your AWS Glue Data Quality evaluation results with Athena.
- Operationalize the solution by setting up alerts and notifications using integration with Amazon EventBridge and Amazon Simple Notification Service (Amazon SNS).
For this post, we use the NYC Taxi dataset yellow_tripdata_2022-01.parquet.
Set up resources with AWS CloudFormation
The provided CloudFormation template creates the following resources for you:
- The AWS Identity and Access Management (IAM) role required to run AWS Glue Data Quality evaluations
- An S3 bucket to store the NYC Taxi dataset
- An S3 bucket to store and analyze the results of AWS Glue Data Quality evaluations
- An AWS Glue database and table created from the NYC Taxi dataset
Launch your CloudFormation stack
To create your resources for this use case, complete the following steps:
- Launch your CloudFormation stack in
us-east-1:

- Under Parameters:
- For Stack name, proceed with the default value
myDQStack. - For DataQualityDatabase, proceed with the default value
data_quality_catalog. - For DataQualityS3BucketName, provide a bucket name of your choice.
- For DataQualityTable, proceed with the default value
data_quality_tripdata_table

- For Stack name, proceed with the default value
- Select I acknowledge that AWS CloudFormation might create IAM resources with custom names.
- Choose Create stack.

After the stack is successfully created, you can see all the resources created on the Resources tab.

- Navigate to the S3 bucket created by the stack and upload the yellow_tripdata_2022-01.parquet file.
Explore recommendation rulesets and define rulesets to evaluate your table
In this section, we generate data quality rule recommendations from AWS Glue Data Quality. We use these recommendations to run a data quality task against our dataset to obtain an analysis of our data.
Complete the following steps:
- On the AWS Glue console, under Data Catalog in the navigation pane, choose Tables.
- Choose the
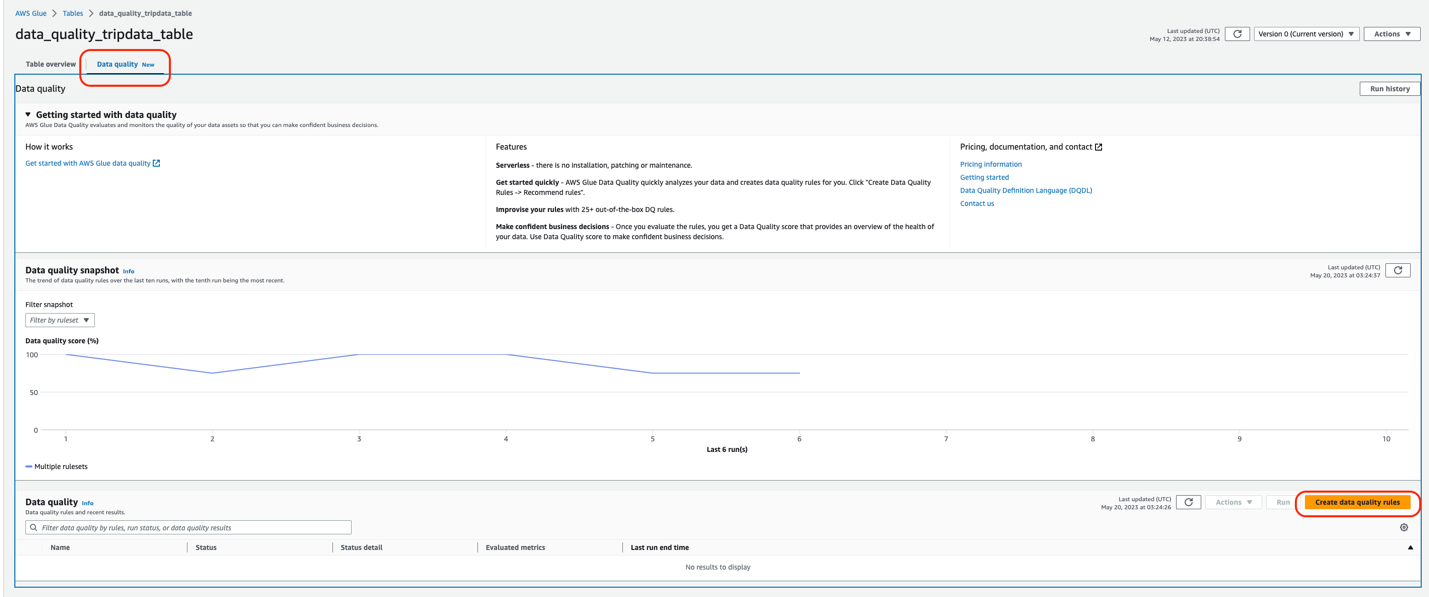
data_quality_tripdata_tabletable created via the CloudFormation stack. - Choose the Data quality tab.
In this section, you will find a video to get you started with AWS Glue Data Quality. It also lists features, pricing, and documentation.
- Choose Create data quality rules.

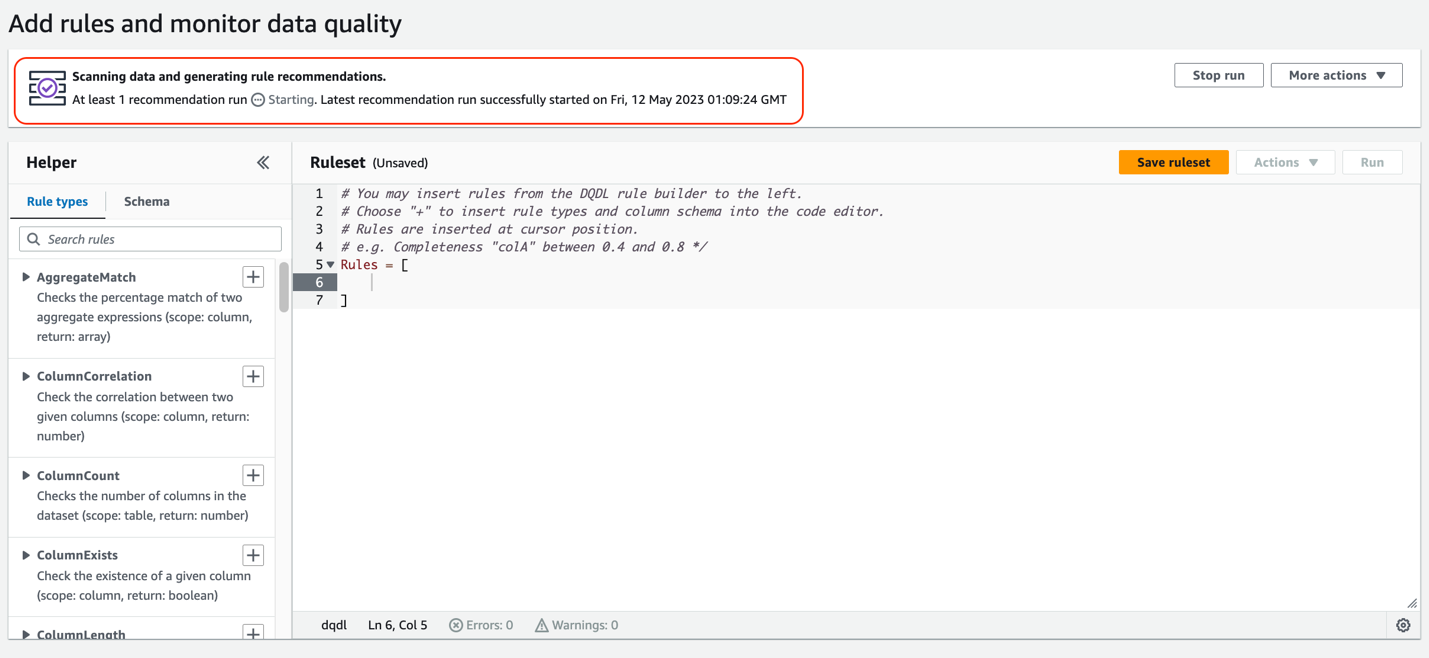
This is the ruleset console. You will find a Request data quality rule recommendations banner at the top. AWS Glue will scan your data and automatically generate rule recommendations.
- Choose Recommend rules.

- For IAM role, choose the IAM role created as part of the Cloud Formation template (
GlueDataQualityBlogRole). - Optionally, you can filter your data before reading on column values. This feature is available for Amazon S3-based data sources.
- For Requested number of workers, allocate the number of workers to run the recommendation task. For this post, we use the default value of 5.
- For Task timeout, set the runtime for this task. For this post, we use the default of 120 minutes.
- Choose Recommend rules.


The recommendation task will start instantly, and you will observe the status on the top changes to Starting.
Next, we add some of these recommended rules into our ruleset.
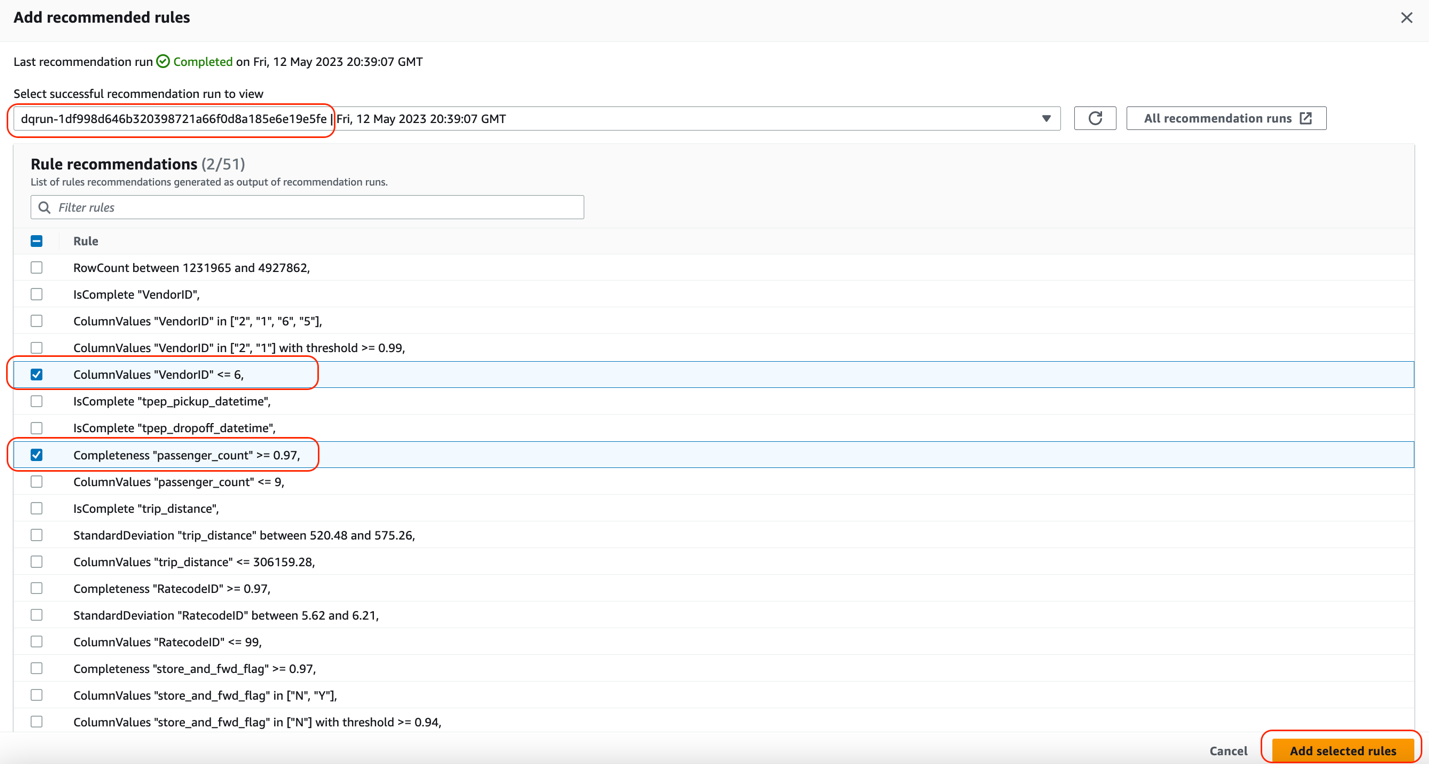
- When you see the recommendation run as Completed, choose Insert rule recommendations to select the rules that are recommended for you.
Make sure to place the cursor inside the brackets Rules = [ ].

- Select the following rules:
ColumnValues “VendorID” <=6Completeness “passenger_count”>=0.97
- Choose Add selected rules.
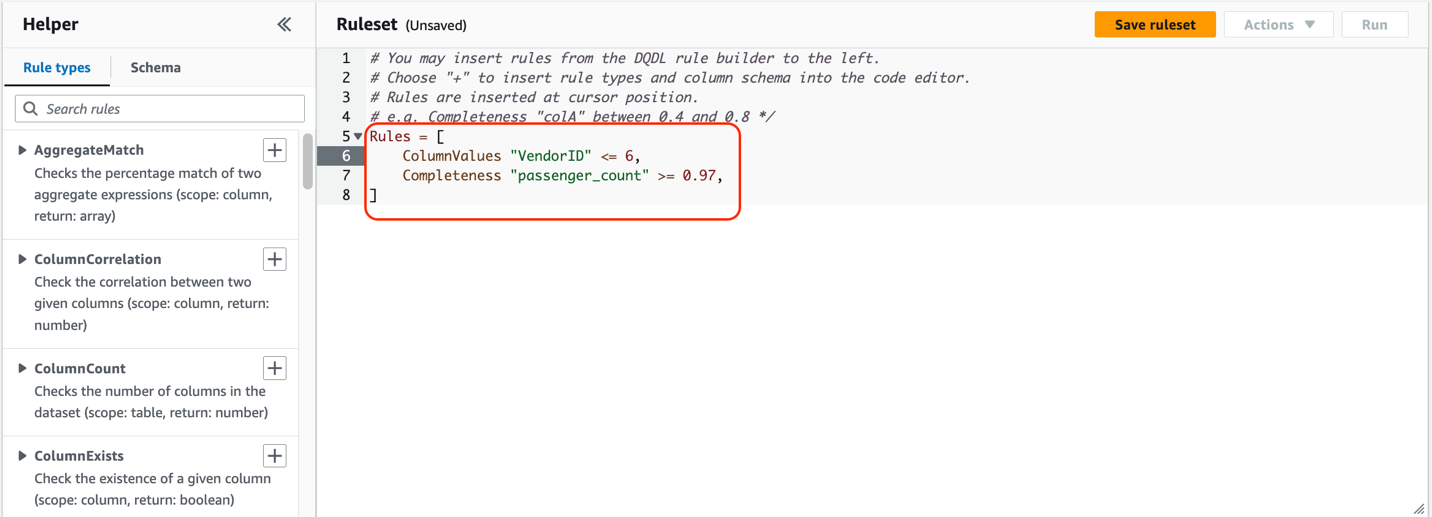
You can see that these rules were automatically added to the ruleset.
Understanding AWS Glue Data Quality recommendations
AWS Glue Data Quality recommendations are suggestions generated by the AWS Glue Data Quality service and are based on the shape of your data. These recommendations automatically take into account aspects like row counts, mean, standard deviation, and so on, and generate a set of rules for you to use as a starting point.
The dataset used here was the NYC Taxi dataset. Based on this, the columns in this dataset, and the values of those columns, AWS Glue Data Quality recommends a set of rules. In total, the recommendation service automatically took into consideration all the columns of the dataset, and recommended 55 rules.
Some of these rules are:
- ColumnValues “VendorID” <=6 – The
ColumnValuesrule type checks the percentage of complete (non-null) values in a column against a given expression. This rule resolves to true if the rule type response is less than or equal to value 6. - Completeness “passenger_count”>=0.97 – The
Completenessrule type checks the percentage of complete (non-null) values in a column against a given expression. In this case, the rule checks if more than 97% of the values in a column are complete.

In addition to adding auto-generated recommendation rules, we manually add some rules to the ruleset. AWS Glue Data Quality provides some out-of-the-box rule types to choose from. For this post, we manually add the IsComplete rule for VendorID.
- In the left pane, on the Rule types tab, search
IsCompleterule type and choose the plus sign next toIsCompleteto add this rule. - For the value within the quotation marks, enter
VendorID.
Conversely, you could navigate to the Schema tab and add IsComplete to VendorID.
- Choose Save ruleset.


Next, we add a CustomSQL rule by selecting the rule type CustomSql, that validates that there are no fares charged for a trip if there are no passengers. This is to identify if there are any fraudulent transactions for fare_amount > 0 where passenger_count = 0. The rule is:
There are two ways to provide the table name:
- Either you can use the keyword “primary” for the table under consideration
- You can use the full path such as
database_name.table_name
- On the Rule types tab, choose the plus sign next to CustomSQL and enter the SQL statement.

The final ruleset looks like the following screenshot.

- Choose Save ruleset.
- For Ruleset name, enter a name.
- Choose Save ruleset.

- On the ruleset page, choose Run.

- For IAM role¸ choose
GlueDataQualityBlogRole. - Select Publish run metrics to Amazon CloudWatch.
- For Data quality result location, enter the S3 bucket location for the data quality results which is already created for you as part of Cloud Formation template (for this post,
data-quality-tripdata-results). - For Run frequency, choose On demand.

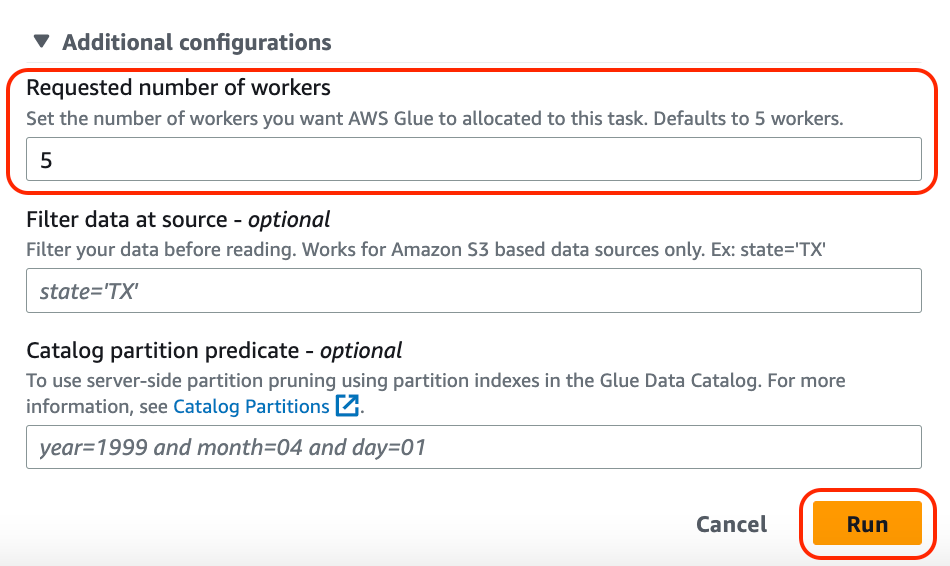
- Expand Additional configurations.
- For Requested number of workers, enter
5. - Leave the remaining fields as is and choose Run.


The status changes to Starting.

- When it’s complete, choose the ruleset and choose Run history.
- Choose the run ID to find more about the run details.

Under Data quality result, you will also observe the result shows as DQ passed or DQ failed.

In the Evaluation run details section, you will find all the details about the data quality task run and rules that passed or failed. You can either view these results by navigating to the S3 bucket or downloading the results. Observe that the data quality task failed because one of the rules failed.
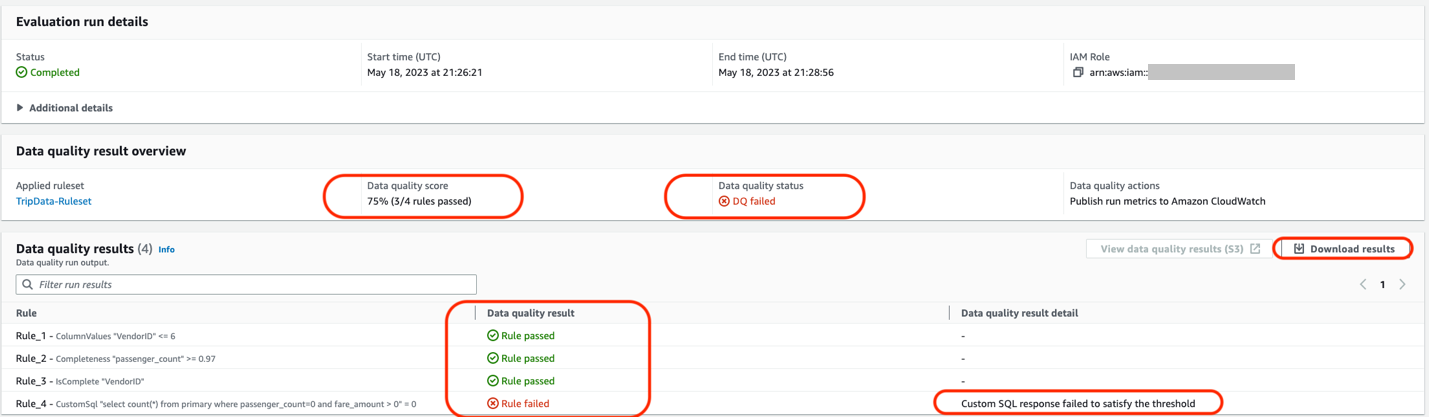
For the first section, AWS Glue Data Quality suggested 51 rules, based on the column values and the data within our NYC Taxi dataset. We selected a few rules out of the 51 rules into a ruleset and ran an AWS Glue Data Quality evaluation task using our ruleset against our dataset. In our results, we see the status of each rule within the run details of the data quality task.
You can also utilize the AWS Glue Data Quality APIs to carry out these steps.
Analyze your AWS Glue Data Quality evaluation results with Athena
If you have multiple AWS Glue Data Quality evaluation results against a dataset, you might want to track the trends of the dataset’s quality over a period of time. To achieve this, we can export our AWS Glue Data Quality evaluation results to Amazon S3, and use Athena to run analytical queries against the exported results. You could further use the results in Amazon QuickSight to build dashboards to have a graphical representation of your data quality trends
In Part 3 of this series, we show the steps needed to start tracking data on your dataset’s quality.
For our data quality runs that we set up in the previous sections, we set the Data quality results location parameter to the bucket location specified by the CloudFormation stack. After each successful run, you should see a Parquet format file that contains a single JSONL file being exported to your selected S3 location, corresponding to that particular run.
Complete the following steps to analyze the data:
- Navigate to Amazon Athena and on the console, navigate to Query Editor.
- Run the following CREATE TABLE statement (replace the <my_table_name> with a relevant value of your choice and <GlueDataQualityResultsS3Bucket_from_cfn> with the S3 bucket name to store data-quality results; the bucket name will have trailing keyword
results, for example <given-name-results>. For this post, it isdata-quality-tripdata-results.
After you create the table, you should be able to run queries to analyze your data quality results.
For example, consider the following query that shows the passed AWS Glue Data Quality evaluations against the table data_quality_tripdata_table within a certain time window. You can select the datetime values from the data quality results table (that you created above) <my_table_name> from the columns evaluationcompletedon to specify values for parse_datetime() within a certain duration in the following query:
The output of the preceding query shows us details about all the runs with “outcome” = ‘Passed’ that ran against the NYC Taxi dataset table (“tablename” = ‘data_quality_tripdata_table’). The output also provides details about the rules passed and evaluated metrics.
As you can see, we are able to get detailed information about our AWS Glue Data Quality evaluations via the results uploaded to Amazon S3 and perform more detailed analysis.
Set up alerts and notifications using EventBridge and Amazon SNS
Alerts and notifications are important for data quality to enable timely and effective responses to data quality issues that arise in the dataset. By setting up alerts and notifications, you can proactively monitor the data quality and be alerted as soon as any data quality issues are detected. This reduces the risk of making decisions based on incorrect information.
AWS Glue Data Quality also offers integration with EventBridge for alerting and notification by triggering an AWS Lambda function that sends a customized SNS notification when the AWS Glue Data Quality ruleset evaluation is complete. Now you can receive event-driven alerts and email notifications via Amazon SNS. This integration significantly enhances the accuracy and reliability of data.
Clean up
To clean up your resources, complete the following steps:
- On the Athena console, delete the table created for data quality analysis.
- On the CloudWatch console, delete the alarms created.
- If you deployed the sample CloudFormation stack, delete the stack via the AWS CloudFormation console. You will need to empty the S3 bucket before you delete the bucket.
- If you enabled your AWS Glue Data Quality runs to output to Amazon S3, empty those buckets as well.
Conclusion
In this post, we talked about the ease and speed of incorporating data quality rules using AWS Glue Data Quality into your Data Catalog tables. We also talked about how to run recommendations and evaluate data quality against your tables. We then discussed analyzing the data quality results via Athena, and discussed integrations with EventBridge and Amazon SNS for alerts and notifications to get notified for data quality issues.
To dive into the AWS Glue Data Quality APIs, refer to Data Quality API documentation. To learn more about AWS Glue Data Quality, check out AWS Glue Data Quality.
About the authors
 Stuti Deshpande is an Analytics Specialist Solutions Architect at AWS. She works with customers around the globe, providing them strategic and architectural guidance on implementing analytics solutions using AWS. She has extensive experience in Big Data, ETL, and Analytics. In her free time, Stuti likes to travel, learn new dance forms, and enjoy quality time with family and friends.
 Aniket Jiddigoudar is a Big Data Architect on the AWS Glue team. He works with customers to help improve their big data workloads. In his spare time, he enjoys trying out new food, playing video games, and kickboxing.
 Joseph Barlan is a Frontend Engineer at AWS Glue. He has over 5 years of experience helping teams build reusable UI components and is passionate about frontend design systems. In his spare time, he enjoys pencil drawing and binge watching tv shows.
 Jesus Max Hernandez is a Software Development Engineer at AWS Glue. He joined the team in August after graduating from The University of Texas at El Paso. Outside of work, you can find him practicing guitar or playing softball in Central Park.
 Divya Gaitonde
is a UX designer at AWS Glue. She has over 8 years of experience driving impact through data-driven products and seamless experiences. Outside of work, you can find her catching up on reading or people watching at a museum.