Post Syndicated from Viqash Adwani original https://aws.amazon.com/blogs/architecture/setup-a-high-availability-design-for-oracle-data-guard-fast-start-failover-using-amazon-route-53/
Many customers use Oracle Database deployed on Amazon Elastic Compute Cloud (Amazon EC2) to run their Oracle E-Business Suite applications. They rely on Oracle Data Guard for high availability databases, with a standby database running in a different availability zone. Oracle Data Guard can switch a standby database to the primary role in case a production database becomes unavailable due to planned/unplanned outage.
Oracle E-Business Suite has AutoConfig Database Context files that points to Domain Name System (DNS), like a private IP DNS name or IP address on Amazon EC2. In case of switchover/failover, Database Context files in Oracle E-Business Suite need to be updated. With this solution, database context files do not need to be updated in case of switchover/failover. This is achieved by providing a single DNS name hosted on Amazon Route 53, always pointing to a primary database irrespective of running on any node.
This post demonstrates setting up a Route 53 hosted zone that points to primary and standby databases and will route requests to the database having a primary role. We will setup Route 53 health checks to monitor Amazon CloudWatch alarms, based on Oracle Data Guard Fast-Start Failover (FSFO) logs pushed from Oracle Database using CloudWatch agent.
Prerequisites
Before getting started, you must have the following:
- Oracle databases running on two separate EC2 instances for 1\Primary and 2\Standby node
- EC2 instance for 3\Observer node, with either Oracle Client Administrator software or the full Oracle Database software stack
- Oracle Data Guard configured to maintain standby databases as transactional consistent copy of the primary database
- Oracle Data Guard Command-Line Interface (DGMGRL) configured with observer process to facilitate FSFO
- FSFO enabled with observer configuration
Solution overview
Figure 1 depicts AWS services that are used build an architecture using a single Domain Name System (DNS) and Route 53 to have requests route to the primary database for Oracle Data Guard deployed on EC2 instances.
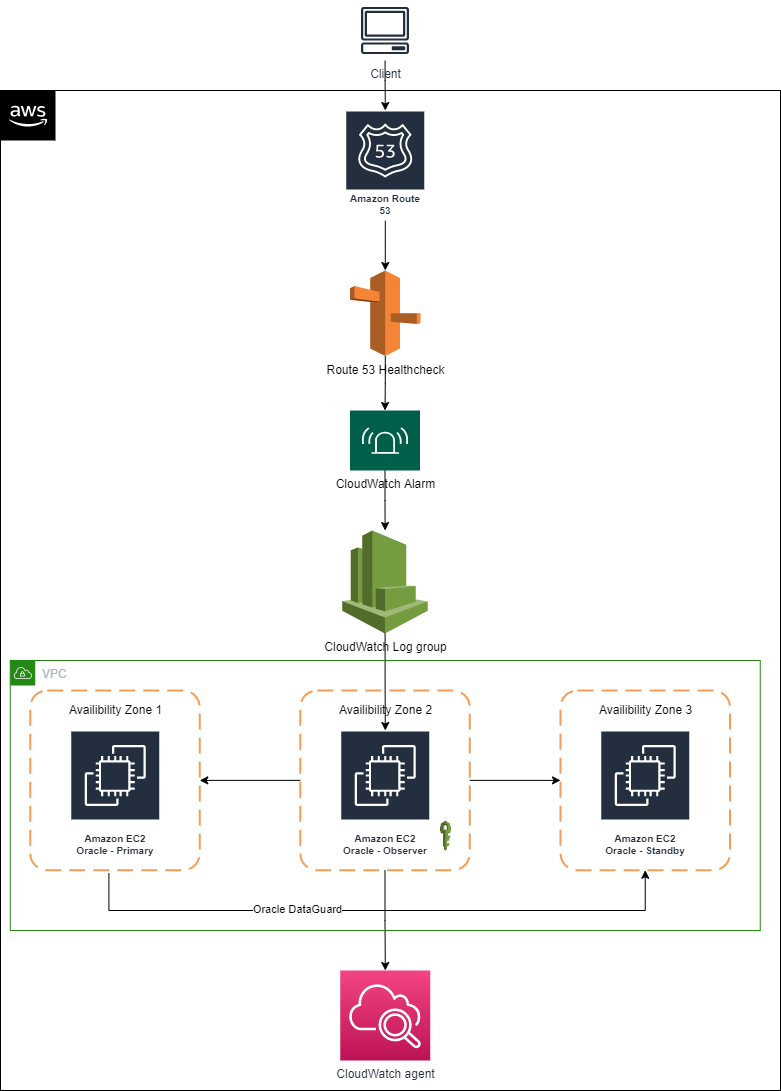
Figure 1. Using a single DNS and Amazon Route 53 to route requests
We encourage you to explore these articles prior to launching this architecture:
- Amazon EC2 for Oracle
- How to Create and Enable an Oracle Data Guard Broker Configuration Procedure
- Configure and Deploy Oracle Data Guard
- Oracle Data Guard Broker
Architecture components
- Primary node: An Oracle Data Guard configuration contains one production database (primary database) that functions in the primary role. This is the database that is accessed by most of your applications.
- Standby node: A standby database is a transactional consistent copy of the primary database. Once created, Oracle Data Guard automatically maintains each standby database by transmitting redo data from the primary database and applying it to the standby database.
- Observer node: A component of DGMGRL that is configured on a separate server with Oracle Client Interface outside the systems running the Oracle Data Guard configuration, which monitors the availability of the primary database. We recommend it is in a separate availability zone than the primary and standby databases. Should it detect that the primary database is unavailable or the connection cannot be made, it will issue a failover after waiting for the 30 seconds or specified by the FastStartFailoverThreshold property.
Note: This solution was tested on Oracle Database 19c Enterprise Edition Release 19.0.0.0.0 and Oracle Enterprise Linux OL7.5-x86_64. Select the required combination of operating system and database by referring to E-Business Suite Database Certifications. Active Oracle Data Guard configuration is not used in this solution; therefore, the database stays in mount state and unavailable for customer reads. However, this solution can be used with an active Oracle Data Guard configuration as well.
Infrastructure setup
This table details the lab environment and the database instance names used throughout this post.
| Database role | IP address | Instance name | Database unique name | Database open mode | Database port |
|---|---|---|---|---|---|
| Primary node | 172.31.xx.xx | ORCLVIQ | orclviq | Read write | 1522 |
| Secondary node | 172.31.xx.xx | ORCLVIQ | orclviq | Mounted | 1522 |
| FSFO observer node | 172.31.xx.xx | – | – | – | – |
| Route 53 hosted zone | Dataguardviq.com | Dataguardviq.com | – | – | – |
Solution implementation
1. IAM policy
To configure the CloudWatch agent on an EC2 instance, create an IAM role via the console, AWS Command Line Interface, or AWS API. By default, an IAM role does not have any privileges and cannot access AWS resources. Before creating an IAM role, create an IAM policy with the permissions required to access CloudWatch logs, specifying the CloudWatch resources you want to monitor or *, which will allow access to CloudWatch logs.
Create the IAM policy using the following JSON and give it a name, like dgpolicy, which grants specific permissions. In this case, the permissions include creating log groups and log streams, inputting log events, and describing log stream for all logs.
{
    "Version": "2012-10-17",
    "Statement": [
        {
            "Action": [
                "logs:DescribeLogGroups",
                "logs:DescribeLogStreams",
                "logs:GetLogEvents",
                "s3:GetBucketLocation"
            ],
            "Effect": "Allow",
            "Resource": "*"
        }
    ]
}
2. IAM role
Create the IAM role (for example, dgrole) and attach the policy created in Step 1.
3. Associate IAM role with Amazon EC2 having FSFO observer node running on it
Associate the IAM role with Amazon EC2 from AWS console:
- Open the Amazon EC2 console.
- In the navigation pane, choose Instances.
- Select the instance, and choose Action, Security, Modify IAM role.
- Select the IAM role to attach to your instance; choose Save.
You also can use the associate-iam-instance-profile command to attach the IAM role to the instance by specifying the instance profile:
aws ec2 associate-iam-instance-profile \
    --instance-id i-1234567890lmnopq1 \
    --iam-instance-profile Name=" dgrole"
4. Install CloudWatch log agent on observer node
Install CloudWatch Logs agent on the observer node that already has FSFO log configuration setup on it. After installation is complete, logs will automatically flow from the instance to the log stream you created while installing the agent, as depicted in Figures 2 and 3.
$curl https://s3.amazonaws.com/aws-cloudwatch/downloads/latest/awslogs-agent-setup.py -O
$sudo python ./awslogs-agent-setup.py --region ap-southeast-2

Figure 2. Steps to install Amazon CloudWatch agent
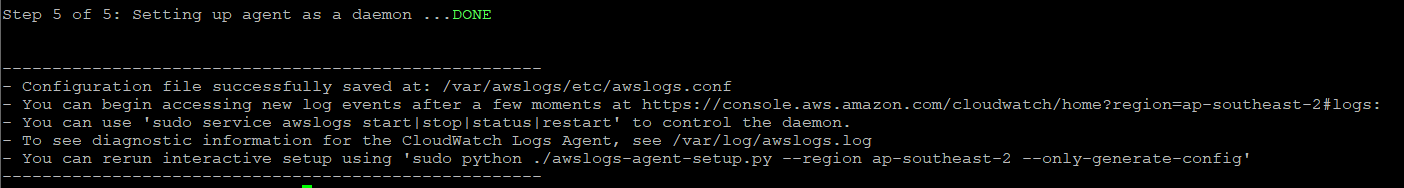
Figure 3. Example of output
At this point, FSFO logs are visible in CloudWatch logs. Perform a database switchover to confirm that logs are being published to CloudWatch logs.
5. Create CloudWatch metric filter
Create primary metric filter
- Create metric filter on “Standby database has changed to orclviq” and set value to “1”.
- Open the CloudWatch log group and search for “Standby database has changed to orclviq“. Once results are displayed, “Create Metric Filter” button will appear at top right (as demonstrated in Figure 4).
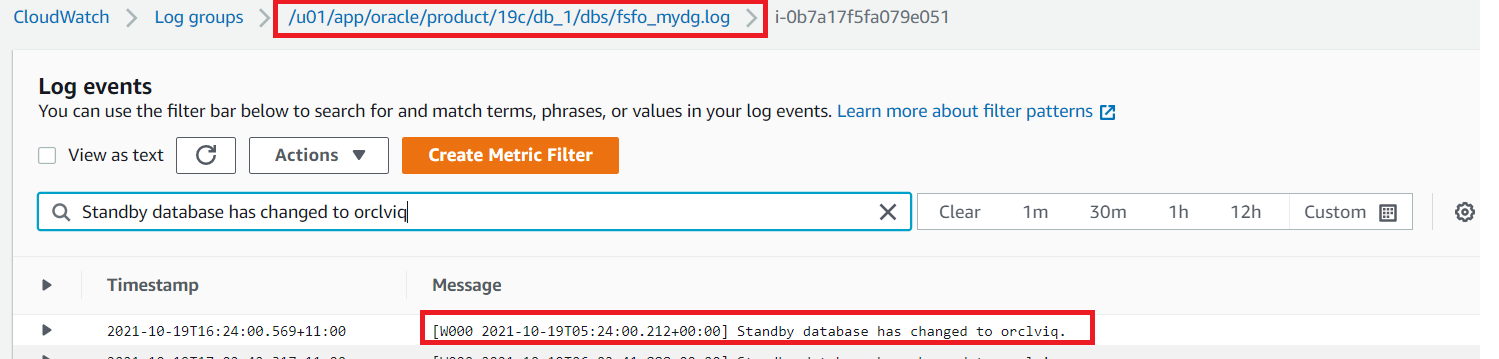
Figure 4. Amazon CloudWatch log group
- “Filter name” and “Filter pattern” are filled automatically, as we already filtered that while accessing the CloudWatch log. Create a new name space in the metric, which we will later use in second metric filter. Specify “Metric namespace”, which will also be the same for the second metric filter. “Metric value” is “1”, as detailed in Figure 5.
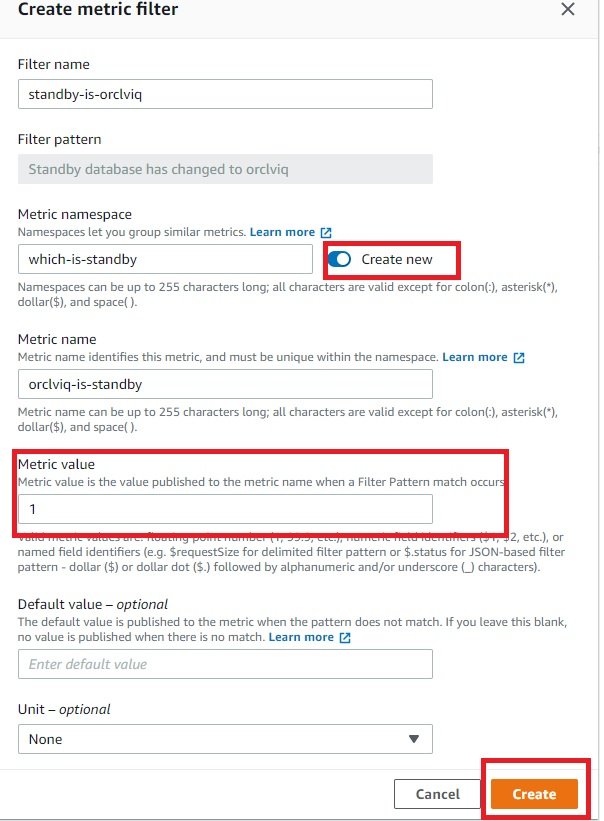
Figure 5. Amazon CloudWatch metric filter
Create secondary metric filter
- To create a second metric filter, follow steps to create the primary metric filter but the filter pattern will be “Standby database has changed to orclstd“. The only difference in this step will be setting the “Metric value” to “0”.
- Verify the metric filter is working and able to find desired entries in the FSFO logs that will decide which instance is the primary database by:
- Click on one of the metric filters
- Select log data to test, and choose and EC2 instance ID
- Testing the pattern to verify if metric filters are working properly
- Select “Next”
- Save changes
6. Create a CloudWatch alarm
Create a CloudWatch alarm that will monitor CloudWatch metrics and perform actions based on the value of the metric.
- Within CloudWatch Alarms section (Step 1), select “Create alarm” and then select “Metric”, as in Figure 6.
- In Step 2, you can create a new topic and specify the email address where you would like to receive notifications regarding changes in primary or standby database.
- In Step 3, you can specify the alarm name and optional alarm description.
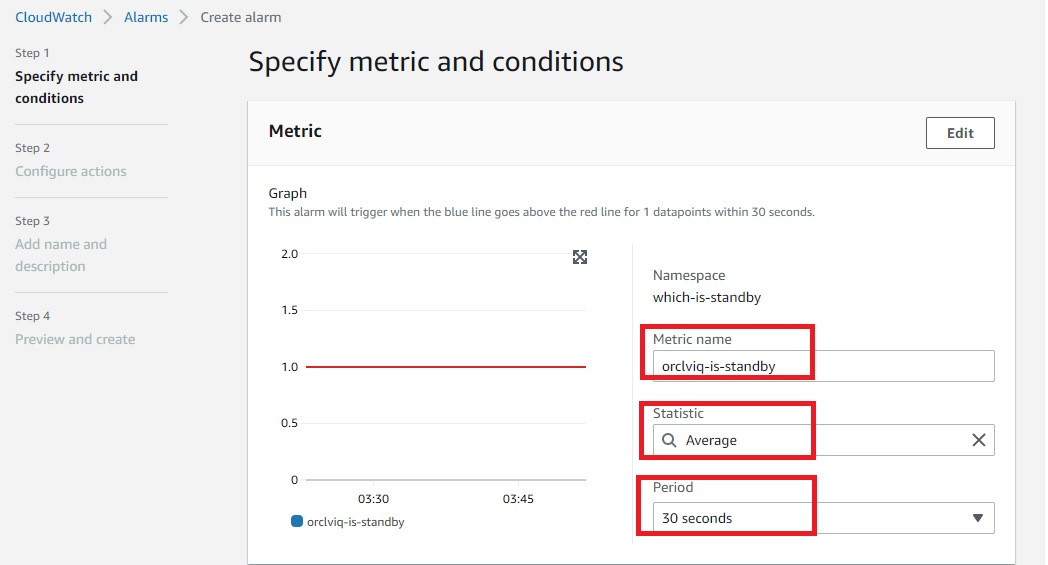
Figure 6. Amazon CloudWatch alarm
- To configure Conditions, as detailed in Figure 7, be sure the threshold type is set to “Static”, the alarm condition is “Greater/Equal”, and the threshold value is “1”.
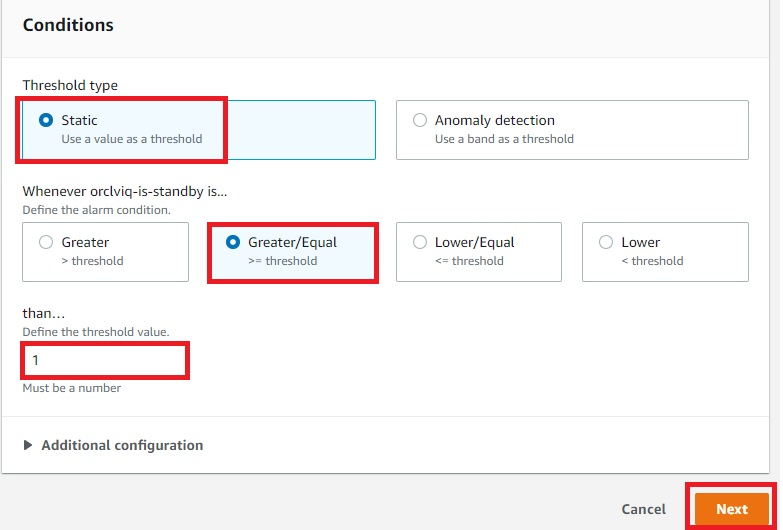
Figure 7. Amazon CloudWatch alarm condition
- Figure 8 demonstrates the summary of the ready CloudWatch metrics and configured alarm. At this point, “orclviq” is the primary database, so the alarm state will be “Insufficient data”. Try to do a switchover and the alarm state should be changed to “In alarm”.
- Switch it back to original primary before proceeding further
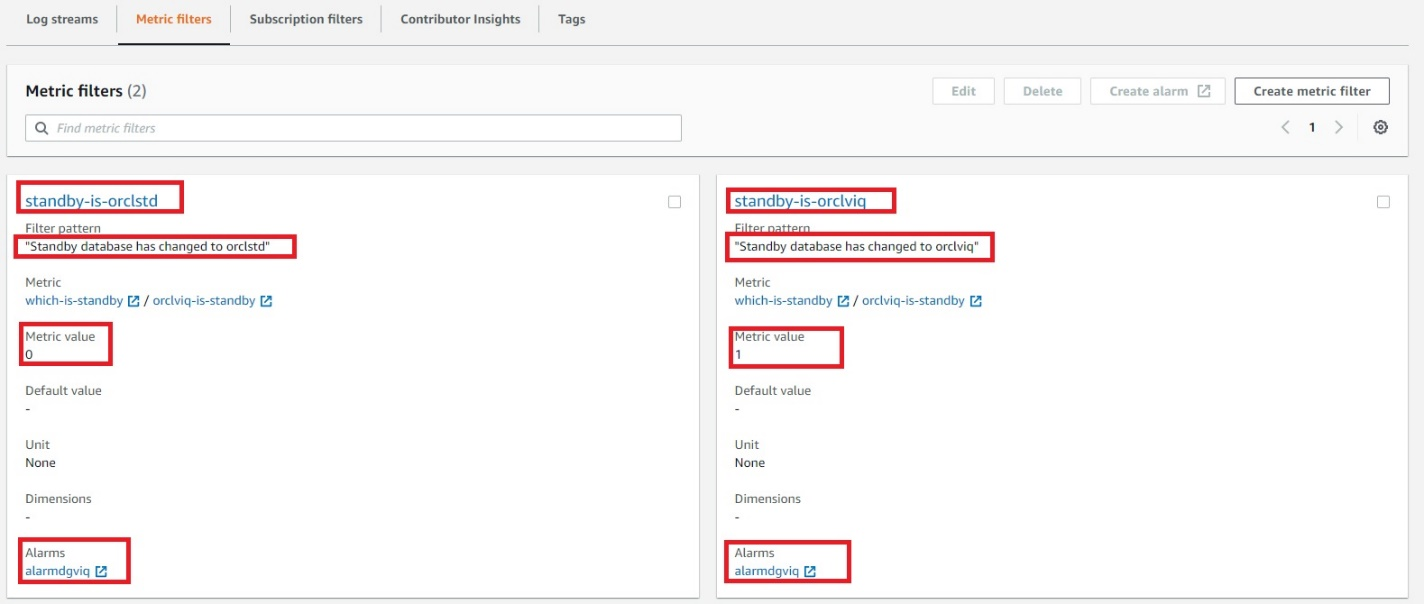
Figure 8. Final view of both metric filters combined
7. Create Route 53 health checks
Creating Route 53 health checks based on the CloudWatch alarm identifies DNS failover. Health checks can be created on public IP directly without creating above metric filters and alarms, but it is unlikely that customers will have a public IP on database servers. Route 53 cannot check the health of an IP address endpoint despite if it is local, private, non-routable, or multi-cast ranges. Therefore, health checks will have to be created on the state of CloudWatch alarm (Figure 9):
- Within the Route 53 console, select “Configure health check”.
- Select “State of CloudWatch alarm”, then select the region of your CloudWatch metrics and choose the CloudWatch alarm that was created earlier from the dropdown menu.
- Skip creating an alarm for health check, as the alarm is already configured for CloudWatch metric filter.
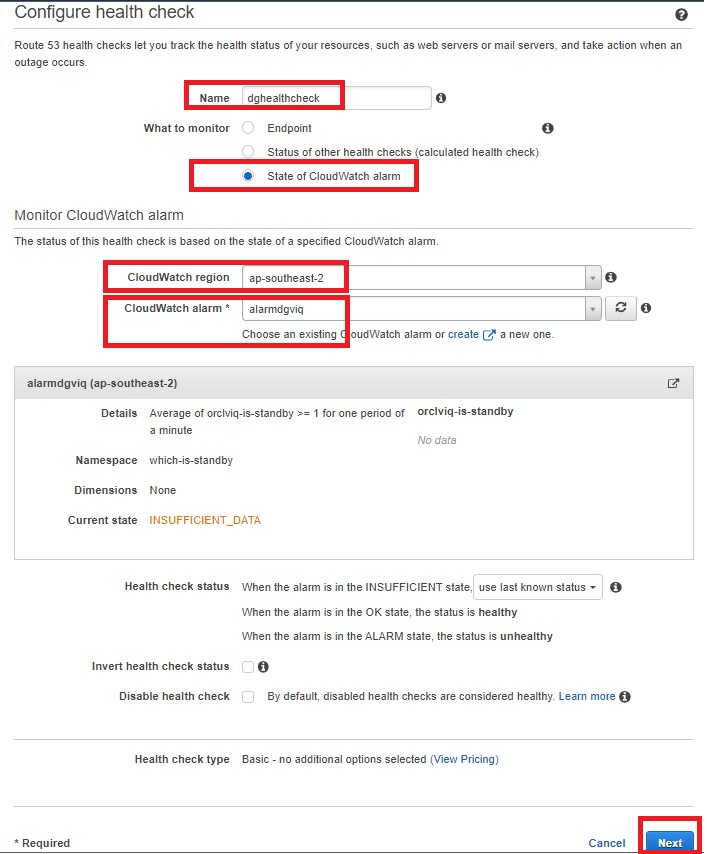
Figure 9. Amazon Route 53 health check parameters
- The health check is now ready and status will be “Unknown”. It will change to “Healthy”, as it is currently having primary orclviq, which means it’s satisfying “Standby database has changed to orclstd“.
- At this point, try doing a failover and observe if health check status changes to “Unhealthy”. Switch it back to the original primary before proceeding.
- The health check should return to “Healthy” state.
- Check the status of the alarm:
- OK: the status is healthy
- ALARM: the status is unhealthy
- INSUFFICIENT: use last known status
8. Create Route 53 hosted zone
A Route 53 hosted zone in this solution will have failover routing based on records pointing to IP addresses of primary and standby database server. When the Route 53 health check is in an “Unhealthy” state, failover routing kicks in and the hosted zone starts routing requests to the IP address of the standby database server.
- A Route 53 hosted zone will have records of your primary and standby database instance private IP. Because it is a private hosted zone, it will use the same VPC as the observer node on which we deployed the CloudWatch agent (Figure 10).
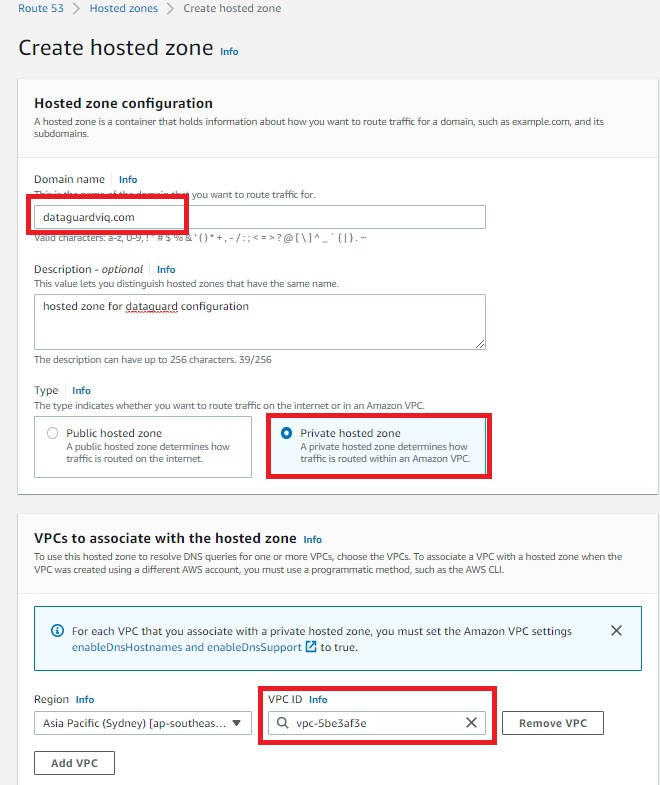
Figure 10. Amazon Route 53 hosted zone
- Once the Route 53 hosted zone is ready, the last step is to create records by adding private IP addresses of primary and secondary database servers (Figures 11 and 12). Routing policy is set as a failover. That means, if the Route 53 health check fails, the hosted zone does a DNS failover to standby server IP.
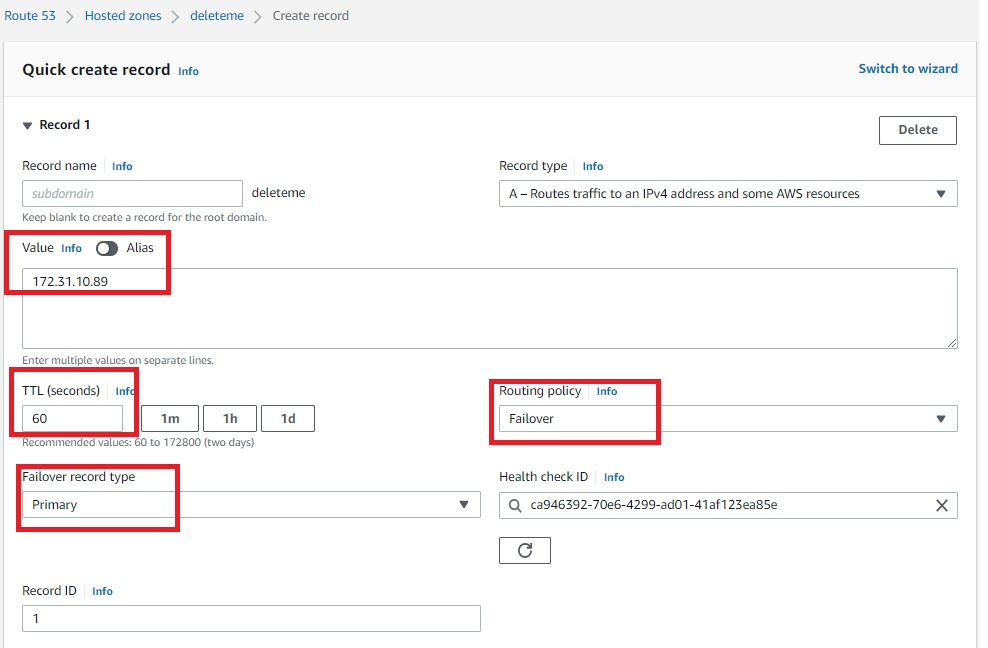
Figure 11. Amazon Route 53 hosted zone record for primary servers
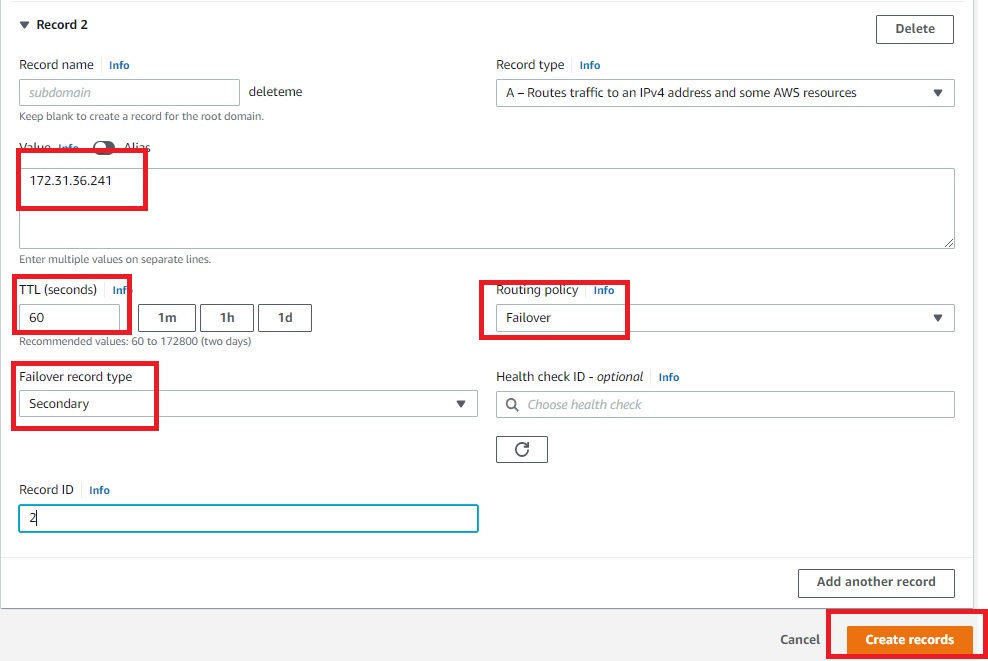
Figure 12. Amazon Route 53 hosted zone record for secondary servers
Once the records are created, the hosted zone will have an IP address of primary and secondary database servers, as demonstrated in Figure 13.
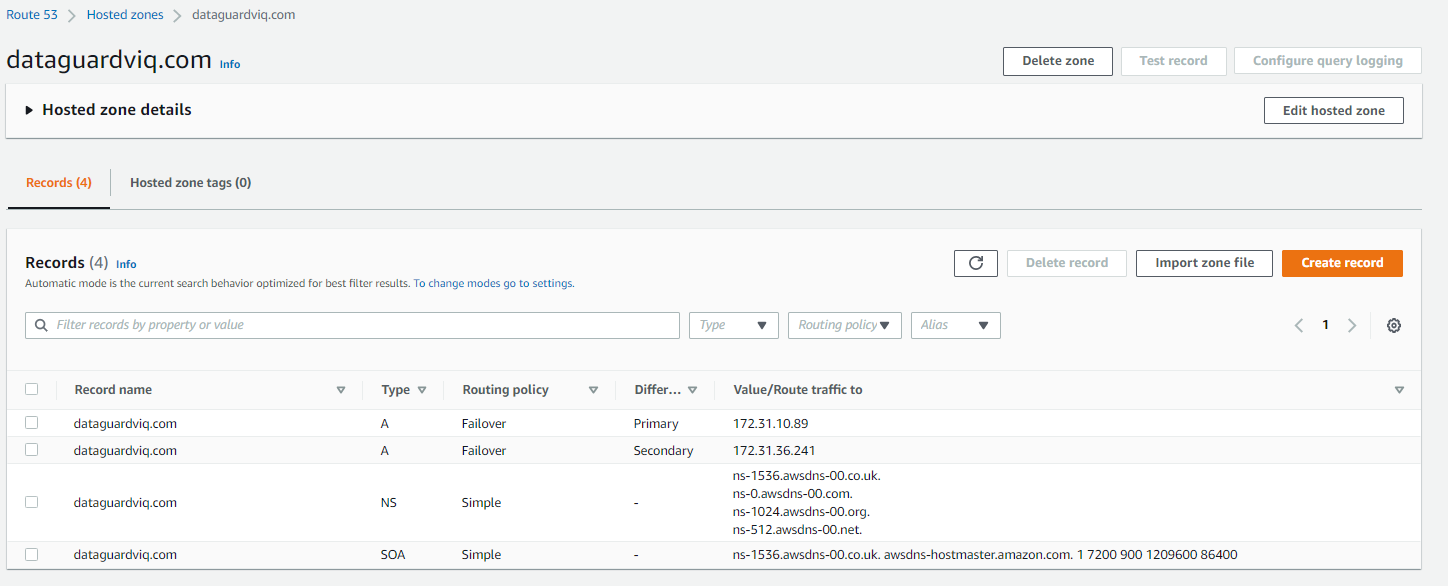
Figure 13. Final view of Amazon Route 53 hosted zone
Solution testing
To test the solution, do a telnet utility test to evaluate network connectivity on the Route 53 hosted zone that was created. It should display the IP address of the primary database server: 172.31.10.89.
[ec2-user@ip-172-xx-xx-xx ~]$ telnet dataguardviq.com 1522
Trying 172.31.10.89…
Connected to dataguardviq.com.
Escape character is ‘^]’.
Next, perform a switchover or failover of the primary to secondary database server. This can be done with the DGMGRL command “switchover to orclstd”. Output will be:
DGMGRL> switchover to orclstd;
Performing switchover NOW, please wait…
Operation requires a connection to database “orclstd”
Connecting …
Connected to “orclstd”
Connected as SYSDBA.
New primary database “orclstd” is opening…
Oracle Clusterware is restarting database “orclviq” …
Connected to an idle instance.
Connected to an idle instance.
Connected to an idle instance.
Connected to an idle instance.
Connected to “orclviq”
Connected to “orclviq”
Switchover succeeded, new primary is “orclstd”
Now, the new primary is “orclstd”. In the backend, the Route 53 health check will be initiated and cause a failover. This means the telnet Route 53 hosted zone will give the IP address of the new primary (old secondary), which is 172.31.36.241.
[ec2-user@ip-172-xx-xx-xx ~]$ telnet dataguardviq.com 1522
Trying 172.31.36.241…
Connected to dataguardviq.com.
Escape character is ‘^]’.
Cleanup
To cleanup, remove:
- Route 53 host zone
- CloudWatch metric filter
- CloudWatch alarm
- CloudWatch agent from observer node
- IAM role and policy created specifically for this solution
Conclusion
This solution demonstrated how to use a Route 53 hosted zone to route requests to the active primary node for Oracle Data Guard on Amazon EC2.