Post Syndicated from Matt Granger original https://www.youtube.com/watch?v=ooWTn2RIfPk
Интервю на “Биволъ” „Да бъда застрелян“. Министър със заплаха за убийство заради тютюневите складове
Post Syndicated from Николай Марченко original https://bivol.bg/%D0%B4%D0%B0-%D0%B1%D1%8A%D0%B4%D0%B0-%D0%B7%D0%B0%D1%81%D1%82%D1%80%D0%B5%D0%BB%D1%8F%D0%BD-%D0%BC%D0%B8%D0%BD%D0%B8%D1%81%D1%82%D1%8A%D1%80-%D1%81%D1%8A%D1%81-%D0%B7%D0%B0%D0%BF.html
събота 10 септември 2022

Служебният министър на културата проф. Велислав Минеков подава официални жалби до МВР и Прокуратурата на Република България (ПРБ) заради заплаха за убийство покрай скандала с тютюневите складове в Пловдив. Той…
Derek’s Office Hours
Post Syndicated from The Atlantic original https://www.youtube.com/watch?v=5ascfj-SbGA
Friday Squid Blogging: Colossal Squid in New Zealand Museum
Post Syndicated from Bruce Schneier original https://www.schneier.com/blog/archives/2022/09/friday-squid-blogging-colossal-squid-in-new-zealand-museum.html
It’s in Timaru.
As usual, you can also use this squid post to talk about the security stories in the news that I haven’t covered.
Read my blog posting guidelines here.
Седмицата (5–10 септември)
Post Syndicated from Йовко Ламбрев original https://toest.bg/editorial-5-10-september-2022/
Вече не съжалявам
за ненаписаните стихотворения
заради писането за другите.Марин Бодаков („Битката за теб“, 2016)
На 8 септември м.г. ни напусна Марин. Няма друга тема, с която да можем да започнем първия си редакционен материал след лятната пауза. Тази една година беше трудна за „Тоест“ и по много други причини, но липсата на Марин беше сред ключовите от тях. Въпреки всичко продължаваме…

Предизборните кампании напоследък и бездруго не блестяха с особена оригиналност, но след като зачестиха от миналата година насам, съвсем не успяват да привлекат общественото внимание. А и у нас по традиция, която не носи никаква полза, хората започват да се чудят за кого биха гласували, едва в последните дни и часове преди вота. Емилия Милчева коментира с критичен поглед началото на новата предизборна кампания в България. Текстът ѝ носи заглавието „Елегия за пасти и избиратели“.
В същия момент обществото ни е изправено пред важен избор. Неясно е дали ще го направим на тези, или на други избори, но все по-сериозно натежава въпросът да препотвърдим геополитическата си ориентация и принадлежността си към развития и богат свят. Никога от началото на Прехода до днес не е било толкова второстепенно значението на класическите политически координатни оси – като ляво и дясно или дори либерално и консервативно – на фона на цивилизационния избор между Европа и Русия. И трудното пред днешния политически елит е как да обясни на повече българи, че досегашната ни посока е правилна и само трябва да ускорим крачката и да държим изкъсо каишката на управляващите ни. Които и да са те.

Продължаваме с нов епизод от поредицата „Украйна не е загубена“, която е част от подкаста ни „Мястото“ с Николета Атанасова. Четири месеца след началото на войната главната ни героиня Алла се върна в родината си и разказва оттам за разрушените градове, за погубените човешки съдби и за тревожното бъдеще пред украинците. В епизода се включва и 19-годишният Юри от Мариупол, който преди войната живее и учи в Москва, но бяга оттам още в първите дни след нахлуването на руските войски в Украйна. Юри разказва как режимът на Путин потиска всеки опит за протест, използвайки скрити из цяла Москва камери, военизирани отряди и „автобуси затвори“ за арестуване на граждани.

През лятото една тема, която иначе има потенциал да възпали определени кръгове от обществото, някак бе посрещната с… „мижав интерес“. Светла Енчева обаче реши да върне вниманието върху нея с аргумента, че дори класически образи от литературата (и от изкуството като цяло) търпят развитие по отношение на оценките за тях от перспективата на съвремието. Защото дори те да са такива, каквито са от десетилетия, тяхната публика се е променила заедно с гледните си точки. Затова, ако ви е любопитно какво е общото между Винету, Мелиса от Херне и Мартин от Стара Загора, прочетете материала на Светла, озаглавен „Че какво му е на Винету?“.

В рубриката ни за позабравени интересни книги „На второ четене“ Севда Семер този път избра да ни представи епистоларния роман „Черният кабинет“ на Макс Жакоб. Книгата му е интересен поглед към френското общество, написана сякаш от наблюдател от първия ред, макар в действителност Жакоб да е маргинализиран аутсайдер, бидейки хомосексуален французин от еврейски произход, който впоследствие умира в лагер през Втората световна война. „Четенето на тези писма е особен поглед към миналото – към голямата история, движена от индивидуалните човешки истории, както вълната е съставена от капки“, споделя Севда в своята рецензия.
Иначе сред другите по-важни теми напоследък е обратното отвоюване на територии от Въоръжените сили на Украйна, които атакуваха руските нашественици и ги принуждават да отстъпват. Междувременно Европейската централна банка очаквано, но доста рязко, повиши основните лихвени проценти в опит за овладяване на инфлацията в ЕС. Икономистите очакват още няколко такива стъпки в близко бъдеще. И докато ключова тема за Европа е как да се подсигури енергийно преди зимата, у нас служебният кабинет на Румен Радев с премиер Гълъб Донев се държи неадекватно и по тази, и по други важни теми. С което дава основание инструментът за управление чрез служебни правителства да бъде дълбоко преосмислен.
Междувременно в рамките на само една седмица Великобритания осъмна с нов премиер и нов крал.
Приятно четене и слушане!
Че какво му е на Винету?
Post Syndicated from Светла Енчева original https://toest.bg/winnetou/
Посред летните отпуски и политическите сътресения в България една новина мина и замина без особен публичен отзвук, какъвто сме свикнали да наблюдаваме в подобни случаи: немското издателство „Равенсбург“ е изтеглило от каталога си две книги за Винету, подготвени за публикуване. Става въпрос не за оригиналния „Винету“ на германския писател Карл Май, а за детски книжки, базирани върху филм, посветен на обичания вожд на апачите. Причината за издателското решение е в множеството критики в социалните медии, че индианските романи представят коренното американско население стереотипно, расистки и от гледна точка на колонизаторите.
Какъв расизъм, какви пет лева?
Решението на издателството среща негативни реакции от страна на някои дясноконсервативно настроени кръгове. Таблоидният вестник „Билд“ например нарича публичния дебат за книгите „истерия“, а изтеглянето им – „изгаряне на клада на героя от нашето детство“. Все пак Винету не е бил забраняван дори по времето на нацисткия режим.
В българския контекст решението на издателство „Равенсбург“ изглежда още по-необяснимо. Не защото „Винету“ е любимата книга на бившия премиер Бойко Борисов, а защото главният герой в нея е безспорно положителен. Благодарение на книгите на Карл Май поколения европейски деца израстват, симпатизирайки на индианците. Как тогава е възможно книгите за Винету да са расистки?
За разбирането на контекста в Германия, направил възможен спирането на книгите, както и на липсата на такъв контекст в България, може да помогнат две аналогични истории, но с различни последствия. Става дума за поведението на журито при представянето на двама участници в риалити шоу за таланти съответно в Германия и в България.
Мелиса от Херне, откъде си родом?
През 2018 г. на сцената на Das Supertalent (немското риалити шоу от франчайза Got Talent, към който принадлежи „България търси талант“) излиза 5-годишно момиченце с азиатски черти, което се представя като Мелиса. Сред членовете на журито е Дитер Болен от популярния през 80-те години дует Modern Talking.
– Откъде си, Мелиса? – пита Болен.
– От Херне – отговаря детето.
Позалязлата попзвезда очевидно не приема за валиден отговор името на град в Северозападна Германия, затова продължава да пита:
– А мама и татко откъде са, от Филипините ли?
– И те са от Херне – казва Мелиса за учудване на Болен, който не се отказва:
– Откъде сте [цялото семейство], от коя страна, родом?
– Не знам – предава се момиченцето, схванало, че от него се очаква да посочи различно населено място от Херне, но нямащо представа кое е то.
– А баба и дядо? – упорства певецът.
Докато другите членове на журито сконфузено мълчат, Болен насочва въпроса си към майката на момичето. Мирясва чак след като получава от нея отговора, че корените на семейството ѝ са в Тайланд.
Макар Дитер Болен да се държи добронамерено с детето, случаят предизвиква масово възмущение. Упрекът към музиканта е, че е постъпил расистки, отказвайки правото на Мелиса да се идентифицира като германка от Херне единствено заради външния ѝ вид. По този начин той индиректно оспорва идентичността на една пета от населението на Германия, което е с миграционен произход. Значителна част от тази група живее в страната от поколения и членовете ѝ не биха искали да се съди за идентичността им по външния вид, имената или по това откъде са бабите и дядовците им.
Мартин от Стара Загора, откъде идваш с такъв екзотичен тен?
През 2021 г. на сцената на „Гласът на България“ излиза мъж с неевропейски черти. Членове на журито са фолкпевицата Галена, поппевците Дара и Любо Киров и китаристът Иван Лечев. След изпълнението Галена пита:
– Толкова екзотичен, откъде идваш ти с такъв тен?
– Казвам се Мартин Айоделе Акинреми и съм на 32. От Стара Загора по принцип съм родом – гласи отговорът.
– Това е точно Стара Загора някъде – иронизира Дара.
– Да-да, близо до Стара Загора – влиза в тона ѝ Любо Киров.
– Там, в централната част, да – отговаря участникът в шоуто и допълва, че името му е нигерийско, при което се включва и Иван Лечев:
– Щях да кажа, че е от Нигерия, да.
Мартин Акинреми уточнява, че майка му е наполовина кубинка (въпреки името той няма нигерийска кръв). Според Любо „тази екзотика“ се е отразила на гласа на участника. Старозагорецът разказва, че е археолог по професия, и намира за нужно да добави, че тенът му се дължи факта, че идва от разкопки на магистрала „Хемус“, а не е „чак толкова мургав по принцип“. Обяснението му предизвиква бурен смях у членовете на журито, а Любо Киров подмята: „Това е от магистралата.“
За разлика от случая с малката Мелиса в Германия, този не предизвиква обществена реакция. А в него расизмът дори е повече. Защото и четиримата членове на журито, колкото и да харесват участника, отказват да приемат, че е възможно да се казваш Мартин Акинреми, да изглеждаш като Мартин Акинреми, а да си роден в Стара Загора и да се идентифицираш като старозагорец. И защото го свеждат, заедно с музикалния му талант, до „екзотичния“ произход.
Какво е общото между казусите с Винету, Мелиса от Херне и Мартин от Стара Загора?
На пръв поглед историята със спрените книги за Винету няма връзка със случаите с малката Мелиса и Мартин Акинреми. Под повърхността обаче те са следствие от една и съща нагласа – че доминиращото и привилегировано мнозинство в една култура „знае“ какви са другите, непривилегированите, по-добре от самите тях. И затова не смята за нужно да ги остави да говорят със собствените си гласове.
Карл Май е писал романите си, без да е виждал, а още по-малко – общувал с жив представител на коренното американско население. Представата му за индианците (впрочем наречени така от Христофор Колумб, погрешно взел Америка за Индия) е плод на европоцентричната християнска култура. Неслучайно в края на живота си Винету приема християнството.
Представете си мюсюлмански автор, който никога не е бил по българските земи, да напише поредица от книги за симпатичен български герой по времето на Османската империя, който има за най-добър приятел мюсюлманин и в края на живота си приема исляма. Как биха се чувствали българите, ако доминиращата представа в света за тях ги асоциира именно с този персонаж?
Защо книгите за Винету станаха проблем в Германия?
Винету си е същият, но германските читатели вече не са. Чувствителността към другия е нещо, което се развива бавно, при това – не навсякъде по света. Германия преживява „челен сблъсък“ с необходимостта да развие такава чувствителност след края на Втората световна война и краха на нацисткия режим. Въпреки това тя десетилетия наред, откакто започва да кани „гастарбайтери“, отказва да се възприема като страна, приемаща имигранти. Очаква се, че те ще си тръгнат, но много от тях остават.
Днес тези хора и наследниците им са неразделна част от германското общество, култура и политика. Признанието на тяхната идентичност е свързано с приемането и уважаването на ценността на другия, различния по принцип. А това неизбежно оказва влияние и върху възприемането на литературните произведения. И ако преди Винету е олицетворявал добрите индианци, образът му вече е представителен за високомерното отношение на европейците, отговорни за унищожаването на коренното население на Америка. Затова да се правят нови и нови филми и да се пишат нови и нови книжки за него изглежда като проява на лош вкус.
Даваш ли, даваш… Ботев, Вазов и Баташкото клане?
В България на този етап е трудно да си представим подобна трансформация поради ред причини. В страната ни трудно се възприема не само наличието на хора с миграционен произход като част от населението ѝ, а и фактът, че собствените ни етнически малцинства са български граждани. За сметка на това се приема, че е в реда на нещата представители на доминиращата група да „знаят“ най-добре какви са „другите“, били те роми, мюсюлмани, бежанци, хомосексуални… или старозагорски археолог с една четвърт кубинска кръв.
В същото време (и не без връзка с горното) литературните и историческите канони у нас са непоклатими. И най-малкият опит за реформа или дори само за критичен прочит води до масови истерии – „махат Ботев/Вазов от учебниците“, „отричат Баташкото клане/турското робство“. Тази канонизираща нагласа възприема като кощунствен всеки опит за преоценка и на световното литературно наследство.
Да си припомним какво възмущение настана, когато наследниците на Астрид Линдгрен решиха, че бащата на Пипи Дългото чорапче вече няма да е „негърски крал“, а „крал на Южните морета“. Защото вярват, че шведската писателка не би допуснала никое дете да се почувства наранено от нейно произведение. А съвременните чернокожи деца възприемат думата „негър“ по начин, различен от значението ѝ по времето на написването на романа.
Расизмът и неговото разпознаване
Обикновено в България нещо се признава за расизъм само ако някой е претърпял физическо насилие или е обиждан на расистка основа. И то невинаги. Обидите към роми например, особено от страна на политици, обикновено минават без последствия. Петър Москов беше оправдан за твърдението си, че ромите са „скотове“ и по-лоши от диви животни, а Валери Симеонов – че са „озверели човекоподобни“, а ромските жени са „с инстинкти на улични кучки“. Още по-безнаказани остават расистките обиди и насилието по адрес на бежанци.
А расизмът всъщност има и далеч по-тънки измерения – съденето за някого само по външния вид или името, свеждането на група хора до стереотипни характеристики, били те и положителни, натискът „да се впишеш“, тоест да не се отличаваш от мнозинството, в степента, в която това изобщо е възможно. Или обратното – натискът да си различен дори когато се чувстваш част от мнозинството. Накратко – неприемането на собствения разказ на някого за себе си.
Затова и Винету все повече ще бъде част от миналото.
Заглавна снимка: Сцена от постановката „Винету: Кръвни братя“ на фестивала „Карл Май“ в северногерманския град Бад Зегеберг, с участието на Ян Сосниок (Винету) и Уейн Карпендел (Поразяващата ръка) / Julius Beckmann, 2013, CC BY-SA 2.0 / Flickr
На второ четене: „Черният кабинет“ от Макс Жакоб
Post Syndicated from Севда Семер original https://toest.bg/na-vtoro-chetene-cherniyat-kabinet/
Никой от нас не чете единствено най-новите книги. Тогава защо само за тях се пише? „На второ четене“ е рубрика, в която отваряме списъците с книги, публикувани преди поне година, четем ги и препоръчваме любимите си от тях. Рубриката е част от партньорската програма Читателски клуб „Тоест“. Изборът на заглавия обаче е единствено на авторите – Стефан Иванов и Севда Семер, които биха ви препоръчали тези книги и ако имаше как веднъж на две седмици да се разходите с тях в книжарницата.
„Черният кабинет“ от Макс Жакоб
превод от френски Ния Трейман, изд. „Ерго“, 2017
 Макс Жакоб е писател, поет и художник, роден през 1876 г. в Кемпер, Франция, в семейство с еврейски произход. В началото на ХХ век той е сред първите приятели на Пабло Пикасо в Париж – двамата споделят жилище и един и същ бохемски приятелски кръг. Пикасо го включва в двете си картини с общо заглавие „Трима музиканти“, където Жакоб (изобразен като монах) е редом до френския поет Гийом Аполинер (като трагик) и до самия художник (като палячо). В друг, по-ранен портрет от Амедео Модиляни, също приятел на Жакоб, виждаме писателя с цилиндър, тънка иронична усмивка и характерните за стила на художника изцяло запълнени очи.
_-_Ritratto_di_Max_Jacob_(1876-1944)_2.jpg)
Както пише Ния Трейман във въведението си към „Черният кабинет“, през 1909 г. Макс Жакоб „получава божествено видение, благодарение на което решава да се обърне към католическата вяра, като избира Пикасо за свой кръстник“. По-късно писателят се оттегля в манастир, надявайки се това да отслаби хомосексуалността му. Около този период той пише „Черният кабинет“.
Заглавието идва от историята за министър, на когото му хрумнало да отвори личната си кореспонденция и да долага идеи от писмата в нея на тогавашния крал Луи XIV. В книгата Жакоб също сякаш отваря писма от (измислени) хора до техни роднини, обожатели или работодатели. Текстовете са вид наблюдение върху различни социални кръгове; почти като в научнопопулярна литература – наблюдение в естествен хабитат. Авторът задълбочава играта на воайорство, включвайки в края на повечето писма и свои коментари. В тях той обяснява какво мисли за написаното, разказва за реакцията на получателя или пък как са протекли интригите от кореспонденцията. В коментарите му се усеща същата иронична усмивка, изобразена в портрета на Модиляни.
Тази преструвка с читателите, че писателят коментира сякаш някакви съвсем доказуеми факти, на моменти напомня на похвата на „всевиждащото око на автора“ в някои детски книги. В други случаи пък като че тайно ни се прошепва апетитна клюка – момент на интимност с Жакоб. В коментарите си той издава тайните недостатъци на героите, разказва за техните изневери, глупост или честолюбие, добавяйки и мнението си за всичко това.
Писателят говори от една интересна позиция: като хомосексуален, като евреин, като бохем и писател, работил какво ли не, за да се издържа, той е маргинализиран аутсайдер. Наблюдателността и вниманието му към френското общество обаче му дават авторитета на човек, който притежава тайна вътрешна информация.
Някои от най-забавните текстове са писмата, изпъстрени с къде поискани, къде непоискани поучения: приятел, който пише до младоженец как да бъде добър съпруг; лекар, който съветва племенника си за общата им професия. В този тип неформално обучение обществото си предава знания, предразсъдъци или пък… съвети за клинчене от работа. Ето част от най-важните съвети на доброжелателния лекар, ветеран в професията:
Пишеш ми, че още не си решил каква клиентела да търсиш и къде да се установиш. Пишеш ми: „Скъпи чичо, дай ми съвет, тъй като си работил в различни обществени среди и на различни места!“ Повярвай ми, средата на дребната буржоазия и състоятелната работническа класа все още са най-добрите. Там има движение! Часовете, Албер! Часовете, които ще посветим на болния у богатите клиенти! Представи си един вестибюл! Чакаш лакея! Чакаш госпожата! Госпожата се появява и начева поредица от безкрайни истории. Тя има време да говори и не мисли за това, че ти нямаш време да я слушаш. След половин час се осмеляваш да помолиш да прегледаш болния. После трябва да си придадеш изключително заинтересован вид, да се отнасяш към детето (ако става дума за детето у дома) като към една уникална малка личност, а към случая му – като към изключение.
Четенето на тези писма е особен поглед към миналото – към голямата история, движена от индивидуалните човешки истории, както вълната е съставена от капки. Понякога откриваш нещо странно или остаряло по днешните разбирания, но по-често виждаш дребни свади, всекидневие и всякакви притеснения. Периодът между двете световни войни почти не се споменава. Големите събития присъстват с наблюдения върху следите, които оставят върху обществото, както се казва в един коментар към писмо:
Г-н Х., с когото си обменяме хуманитарни текстове и разсъждения, ми писа във връзка с Викторин Лангле: „Следвоенните поколения търсят отговорности, не приемат нищо извън собствения си опит и са се научили да държат единствено на същината на желанията си – но държат здраво на нея. Не че отхвърлят обществените порядки и почести, но ги приемат единствено ако те ги удовлетворяват или им помагат: например или въобще не искат да знаят за лукса, за свръхестественото в религията или извън нея, за поезията и изкуствата, или се отнасят към тези неща като към самата действителност.
В началото на Втората световна война Макс Жакоб става жертва на антисемитска пропаганда, уличен е в заговор и е прехвърлен в лагера в Дранси, където умира от бронхопневмония. Жакоб се вълнува от социалните и историческите процеси, както личи от този епистоларен сборник. А както показва личната му история – същите тези процеси драстично повлияват на собствения му живот. Философът и психоаналитик Жак Лакан пише, че Макс Жакоб е автор на фразата „Истината е винаги нова“. Струва ми се вярно – може би затова четенето на този сборник се усеща и днес като откривателство вместо като нещо изцяло от миналото.
Заглавно изображение: Колаж от корицата на книгата (худ. Йоанна Иванова, изд. „Ерго“) и снимка на Rashtravardhan Kataria / Unsplash
Активните дарители на „Тоест“ получават постоянна отстъпка в размер на 20% от коричната цена на всички заглавия от каталога на „Ерго“, както и на няколко други български издателства в рамките на партньорската програма Читателски клуб „Тоест“. За повече информация прочетете на toest.bg/club.
Amazon migrates financial reporting to Amazon QuickSight
Post Syndicated from Chitradeep Barman original https://aws.amazon.com/blogs/big-data/amazon-migrates-financial-reporting-to-amazon-quicksight/
This is a guest post by from Chitradeep Barman and Yaniv Ackerman from Amazon Finance Technology (FinTech).
Amazon Finance Technology (FinTech) is responsible for financial reporting on Earth’s largest transaction dataset, as the central organization supporting accounting and tax operations across Amazon. Amazon FinTech’s accounting, tax, and business finance teams close books and file taxes in different regions.
Amazon FinTech had been using a legacy business intelligence (BI) tool for over 10 years, and with its dataset growing at 20% year over year, it was beginning to face operational and performance challenges.
In 2019, Amazon FinTech decided to migrate its data visualization and BI layer to AWS to improve data analysis capabilities, reduce costs, and improve its use of AWS Cloud–native services, which reduces risk and technical complexity. By the end of 2021, Amazon FinTech had migrated to Amazon QuickSight, which organizations use to understand data by asking questions in natural language, exploring through interactive dashboards, or automatically looking for patterns and outliers powered by machine learning (ML).
In this post, we share the challenges and benefits of this migration.
Improving reporting and BI capabilities on AWS
Amazon FinTech’s customers are in accounting, tax, and business finance teams across Amazon Finance and Global Business Services, AWS, and Amazon subsidiaries. It provides these teams with authoritative data to do financial reporting and close Amazon’s books, as well as file taxes in jurisdictions and countries around the world. Amazon FinTech also provides data and tools for analysis and BI.
“Over time, with data growth, we started facing operational and maintenance challenges with the legacy BI tool, resulting in a multifold increase in engineering overhead,” said Chitradeep Barman, a senior technical program manager with Amazon FinTech who drove the technical implementation of the migration to QuickSight.
To improve security, increase scalability, and reduce costs, Amazon FinTech decided to migrate to QuickSight on AWS. This transition aligned with the organization’s goal to rely on native AWS technology and reduce dependency on other third-party tools.
Amazon FinTech was already using Amazon Redshift, which can analyze exabytes of data and run complex analytical queries. It can run and scale analytics on data in seconds without the need to manage the data warehouse infrastructure for its cloud data warehouse. As an AWS-native data visualization and BI tool, QuickSight seamlessly connects with AWS services, including Amazon Redshift. The migration was sizable: after consolidating existing reports, there were about 2,000 financial reports in the legacy tool that were used by over 2,500 users. The reports pulled data from millions of records.
Innovating while migrating
Amazon FinTech migrated complex reports and simultaneously started multiple training sessions. Additional training modules were built to complement existing QuickSight trainings and calibrated to meet the specific needs of Amazon FinTech’s customers.
Amazon FinTech deals with petabytes of data and had built up a repository of 10,000 reports used by 2,500 employees across Amazon. Collaborating with the QuickSight team, they consolidated their reports to reduce redundancy and focus on what their finance customers needed. Amazon FinTech built 450 canned and over 1,800 ad hoc reports in QuickSight, developing a reusable solution with the QuickSight API. As shown in the following figure, on average per month, Amazon FinTech has over 1,300 unique QuickSight users run almost 2,500 unique QuickSight reports, with more than 4,600 total runs.

Amazon FinTech has been able to scale to meet customer requirements using QuickSight.
“AWS services come along with scalability. The whole point of migrating to AWS is that we do not need to think about scaling our infrastructure, and we can focus on the functional part of it,” says Barman.
QuickSight is cloud based, fully managed, and serverless, meaning you don’t have to build your own infrastructure to handle peak usage. It auto scales across tens of thousands of users who work independently and simultaneously.
As of May 2022, more than 2,500 Amazon Finance employees are using QuickSight for financial and operational reporting and to prepare Amazon’s tax statements.
“The advantage of Amazon QuickSight is that it empowers nontechnical users, including accountants and tax and financial analysts. It gives them more capability to run their reporting and build their own analyses,” says Keith Weiss, principal program manager at Amazon FinTech. According to Weiss, “QuickSight has much richer data visualization than competing BI tools.”
QuickSight is constantly innovating for customers, adding new features, and recently released the AI/ML service Amazon QuickSight Q, which lets users ask questions in natural language and receive accurate answers with relevant visualizations to help gain insights from the underlying data. Barman, Weiss, and the rest of the Amazon FinTech team are excited to implement Q in the near future.
By switching to QuickSight, which uses pay-as-you-go pricing, Amazon FinTech saved 40% without sacrificing the security, governance, and compliance requirements their account needed to comply with internal and external auditors. The AWS pricing structure makes QuickSight much more cost-effective than other BI tools on the market.
Overall, Amazon FinTech saw the following benefits:
- Performance improvements – Latency of consumer-facing reports was reduced by 30%
- Cost reduction – FinTech reduced licensing, database, and support costs by over 40%, and with the AWS pay-as-you-go model, it’s much more cost-effective to be on QuickSight
- Controllership – FinTech reports are global, and controlled accessibility to reporting data is a key aspect to ensure only relevant data is visible to specific teams
- Improved governance – QuickSight APIs to track and promote changes within different environments reduced manual overhead and improved change trackability
Seamless and reliable
At the end of each month, Amazon FinTech teams must close books in 5 days, and since implementing QuickSight for this purpose, Barman says that “reports have run seamlessly, and there have been no critical situations.”
Amazon FinTech’s account on QuickSight is now the source of truth for Amazon’s financial reporting, including tax filings and preparing financial statements. It enables Amazon’s own finance team to close its books and file taxes at the unparalleled scale at which Amazon operates, with all its complexity. Most importantly, despite initial skepticism, according to Weiss, “Our finance users love it.”
Learn more about Amazon QuickSight and get started diving deeper into your data today!
About the authors
 Chitradeep Barman is a Sr. Technical Program Manager at Amazon Finance Technology (FinTech). He led the Amazon wide migration of BI reporting from Oracle BI (OBIEE) to AWS QuickSight. Chitradeep started his career as a data engineer and over time grew as a data architect. Before joining Amazon, he lead the design and implementation to launch the BI analytics and reporting platform for Cisco Capital (a fully owned subsidiary of Cisco Systems).
 Yaniv Ackerman is a senior software development manager in Fintech org. He has over 20 years of experience building business critical, scalable and high-performance software. Yaniv’s team build data lakes, analytics and automation solutions for financial usage.
Using AWS Shield Advanced protection groups to improve DDoS detection and mitigation
Post Syndicated from Joe Viggiano original https://aws.amazon.com/blogs/security/using-aws-shield-advanced-protection-groups-to-improve-ddos-detection-and-mitigation/
Amazon Web Services (AWS) customers can use AWS Shield Advanced to detect and mitigate distributed denial of service (DDoS) attacks that target their applications running on Amazon Elastic Compute Cloud (Amazon EC2), Elastic Local Balancing (ELB), Amazon CloudFront, AWS Global Accelerator, and Amazon Route 53. By using protection groups for Shield Advanced, you can logically group your collections of Shield Advanced protected resources. In this blog post, you will learn how you can use protection groups to customize the scope of DDoS detection for application layer events, and accelerate mitigation for infrastructure layer events.
What is a protection group?
A protection group is a resource that you create by grouping your Shield Advanced protected resources, so that the service considers them to be a single protected entity. A protection group can contain many different resources that compose your application, and the resources may be part of multiple protection groups spanning different AWS Regions within an AWS account. Common patterns that you might use when designing protection groups include aligning resources to applications, application teams, or environments (such as production and staging), and by product tiers (such as free or paid). For more information about setting up protection groups, see Managing AWS Shield Advanced protection groups.
Why should you consider using a protection group?
The benefits of protection groups differ for infrastructure layer (layer 3 and layer 4) events and application layer (layer 7) events. For layer 3 and layer 4 events, protection groups can reduce the time it takes for Shield Advanced to begin mitigations. For layer 7 events, protection groups add an additional reporting mechanism. There is no change in the mechanism that Shield Advanced uses internally for detection of an event, and you do not lose the functionality of individual resource-level detections. You receive both group-level and individual resource-level Amazon CloudWatch metrics to consume for operational use. Let’s look at the benefits for each layer in more detail.
Layers 3 and 4: Accelerate time to mitigate for DDoS events
For infrastructure layer (layer 3 and layer 4) events, Shield Advanced monitors the traffic volume to your protected resource. An abnormal traffic deviation signals the possibility of a DDoS attack, and Shield Advanced then puts mitigations in place. By default, Shield Advanced observes the elevation of traffic to a resource over multiple consecutive time intervals to establish confidence that a layer 3/layer 4 event is under way. In the absence of a protection group, Shield Advanced follows the default behavior of waiting to establish confidence before it puts mitigation in place for each resource. However, if the resources are part of a protection group, and if the service detects that one resource in a group is targeted, Shield Advanced uses that confidence for other resources in the group. This can accelerate the process of putting mitigations in place for those resources.
Consider a case where you have an application deployed in different AWS Regions, and each stack is fronted with a Network Load Balancer (NLB). When you enable Shield Advanced on the Elastic IP addresses associated with the NLB in each Region, you can optionally add those Elastic IP addresses to a protection group. If an actor targets one of the NLBs in the protection group and a DDoS attack is detected, Shield Advanced will lower the threshold for implementing mitigations on the other NLBs associated with the protection group. If the scope of the attack shifts to target the other NLBs, Shield Advanced can potentially mitigate the attack faster than if the NLB was not in the protection group.
Note: This benefit applies only to Elastic IP addresses and Global Accelerator resource types.
Layer 7: Reduce false positives and improve accuracy of detection for DDoS events
Shield Advanced detects application layer (layer 7) events when you associate a web access control list (web ACL) in AWS WAF with it. Shield Advanced consumes request data for the associated web ACL, analyzes it, and builds a traffic baseline for your application. The service then uses this baseline to detect anomalies in traffic patterns that might indicate a DDoS attack.
When you group resources in a protection group, Shield Advanced aggregates the data from individual resources and creates the baseline for the whole group. It then uses this aggregated baseline to detect layer 7 events for the group resource. It also continues to monitor and report for the resources individually, regardless of whether they are part of protection groups or not.
Shield Advanced provides three types of aggregation to choose from (sum, mean, and max) to aggregate the volume data of individual resources to use as a baseline for the whole group. We’ll look at the three types of aggregation, with a use case for each, in the next section.
Note: Traffic aggregation is applicable only for layer 7 detection.
Case 1: Blue/green deployments
Blue/green is a popular deployment strategy that increases application availability and reduces deployment risk when rolling out changes. The blue environment runs the current application version, and the green environment runs the new application version. When testing is complete, live application traffic is directed to the green environment, and the blue environment is dismantled.
During blue/green deployments, the traffic to your green resources can go from zero load to full load in a short period of time. Shield Advanced layer 7 detection uses traffic baselining for individual resources, so newly created resources like an Application Load Balancer (ALB) that are part of a blue/green operation would have no baseline, and the rapid increase in traffic could cause Shield Advanced to declare a DDoS event. In this scenario, the DDoS event could be a false positive.

Figure 1: A blue/green deployment with ALBs in a protection group. Shield is using the sum of total traffic to the group to baseline layer 7 traffic for the group as a single unit
In the example architecture shown in Figure 1, we have configured Shield to include all resources of type ALB in a single protection group with aggregation type sum. Shield Advanced will use the sum of traffic to all resources in the protection group as an additional baseline. We have only one ALB (called blue) to begin with. When you add the green ALB as part of your deployment, you can optionally add it to the protection group. As traffic shifts from blue to green, the total traffic to the protection group remains the same even though the volume of traffic changes for the individual resources that make up the group. After the blue ALB is deleted, the Shield Advanced baseline for that ALB is deleted with it. At this point, the green ALB hasn’t existed for sufficient time to have its own accurate baseline, but the protection group baseline persists. You could still receive a DDoSDetected CloudWatch metric with a value of 1 for individual resources, but with a protection group you have the flexibility to set one or more alarms based on the group-level DDoSDetected metric. Depending on your application’s use case, this can reduce non-actionable event notifications.
Note: You might already have alarms set for individual resources, because the onboarding wizard in Shield Advanced provides you an option to create alarms when you add protection to a resource. So, you should review the alarms you already have configured before you create a protection group. Simply adding a resource to a protection group will not reduce false positives.
Case 2: Resources that have traffic patterns similar to each other
Client applications might interact with multiple services as part of a single transaction or workflow. These services can be behind their own dedicated ALBs or CloudFront distributions and can have traffic patterns similar to each other. In the example architecture shown in Figure 2, we have two services that are always called to satisfy a user request. Consider a case where you add a new service to the mix. Before protection groups existed, setting up such a new protected resource, such as ALB or CloudFront, required Shield Advanced to build a brand-new baseline. You had to wait for a certain minimum period before Shield Advanced could start monitoring the resource, and the service would need to monitor traffic for a few days in order to be accurate.

Figure 2: Deploying a new service and including it in a protection group with an existing baseline. Shield is using the mean aggregation type to baseline traffic for the group.
For improved accuracy of detection of level 7 events, you can cause Shield Advanced to inherit the baseline of existing services that are part of the same transaction or workflow. To do so, you can put your new resource in a protection group along with an existing service or services, and set the aggregation type to mean. Shield Advanced will take some time to build up an accurate baseline for the new service. However, the protection group has an established baseline, so the new service won’t be susceptible to decreased accuracy of detection for that period of time. Note that this setting will not stop Shield Advanced from sending notifications for the new service individually; however, you might prefer to take corrective action based on the detection for the group instead.
Case 3: Resources that share traffic in a non-uniform way
Consider the case of a CloudFront distribution with an ALB as origin. If the content is cached in CloudFront edge locations, the traffic reaching the application will be lower than that received by the edge locations. Similarly, if there are multiple origins of a CloudFront distribution, the traffic volumes of individual origins will not reflect the aggregate traffic for the application. Scenarios like invalidation of cache or an origin failover can result in increased traffic at one of the ALB origins. This could cause Shield Advanced to send “1” as the value for the DDoSDetected CloudWatch metric for that ALB. However, you might not want to initiate an alarm or take corrective action in this case.

Figure 3: CloudFront and ALBs in a protection group with aggregation type max. Shield is using CloudFront’s baseline for the group
You can combine the CloudFront distribution and origin (or origins) in a protection group with the aggregation type set to max. Shield Advanced will consider the CloudFront distribution’s traffic volume as the baseline for the protection group as a whole. In the example architecture in Figure 3, a CloudFront distribution fronts two ALBs and balances the load between the two. We have bundled all three resources (CloudFront and two ALBs) into a protection group. In case one ALB fails, the other ALB will receive all the traffic. This way, although you might receive an event notification for the active ALB at the individual resource level if Shield detects a volumetric event, you might not receive it for the protection group because Shield Advanced will use CloudFront traffic as the baseline for determining the increase in volume. You can set one or more alarms and take corrective action according to your application’s use case.
Conclusion
In this blog post, we showed you how AWS Shield Advanced provides you with the capability to group resources in order to consider them a single logical entity for DDoS detection and mitigation. This can help reduce the number of false positives and accelerate the time to mitigation for your protected applications.
A Shield Advanced subscription provides additional capabilities, beyond those discussed in this post, that supplement your perimeter protection. It provides integration with AWS WAF for level 7 DDoS detection, health-based detection for reducing false positives, enhanced visibility into DDoS events, assistance from the Shield Response team, custom mitigations, and cost-protection safeguards. You can learn more about Shield Advanced capabilities in the AWS Shield Advanced User Guide.
If you have feedback about this blog post, submit comments in the Comments section below. You can also start a new thread on AWS Shield re:Post to get answers from the community.
Want more AWS Security news? Follow us on Twitter.
Metasploit Weekly Wrap-Up
Post Syndicated from Navya Harika Karaka original https://blog.rapid7.com/2022/09/09/metasploit-weekly-wrap-up-175/
Authenticated command injection vulnerability of Cisco ASA-X with FirePOWER Services:

[jbaines-r7] (https://github.com/jbaines-r7) added a new module that exploits an authenticated command injection vulnerability CVE-2022-20828 of Cisco ASA-X with FirePOWER Services. This vulnerability affects all Cisco ASA appliances that support ASA FirePOWER module. Note that, although a patch has been added to most recent ASA FirePOWER module versions such as 6.2.3.19, 6.4.0.15, 6.6.7, and 7.0.21, some versions such as 6.2.2 and earlier, 6.3, 6.5, and 6.7 will not receive the patch. This exploit could allow the attacker to get root access and pivot to the inside network along with the outside network. This exploit takes advantage of the FirePower Services SFR module’s Linux virtual machine via ASA’s ASDM web server which also runs snort on the traffic. Therefore, an attacker can have access to the diverted traffic as well. Check out the (https://www.youtube.com/watch?v=_4FEU4GDtB8) of the exploit for more information!
Remote code execution vulnerability of Apache Spark:
KostyaKortchinsky and [h00die-gr3y] (https://github.com/h00die-gr3y) introduced a new module that exploits a remote code execution vulnerability CVE-2022-33891 in Apache Spark. This exploit affects several Apache Spark versions such as 3.0.3 and earlier, 3.1.1 to 3.1.2 and versions 3.2.0 to 3.2.1. Apache Spark allows its users to enable Access Control Lists (ACLs) via the configuration option spark.acls.enable. This was introduced in order to improve the security access within Apache Spark application but the code that’s triggered by this configuration option leads to a malicious shell command injection vulnerability. Check out this post by [HuskyHacks] (https://github.com/HuskyHacks) who provided more information along with great examples!
New module content (2)
- Apache Spark Unauthenticated Command Injection RCE by [KostyaKortchinsky] (https://twitter.com/crypt0ad?lang=en) and [h00die-gr3y] (https://github.com/h00die-gr3y), which exploits CVE-2022-33891 – This exploits an unauthenticated command injection vulnerability in Apache Spark. The
spark.acls.enablesetting permits command injection through theidcommand via a POST request to Apache Spark’s base endpoint containing arbitrary code in thedoAsparameter. The exploit achieves unauthenticated RCE as thesparkuser. - Cisco ASA-X with FirePOWER Services Authenticated Command Injection by [jbaines-r7] (https://github.com/jbaines-r7), which exploits CVE-2022-20828 – This adds an exploit module that leverages an authenticated command injection vulnerability in Cisco ASA-X with FirePOWER Services. This vulnerability is identified as CVE-2022-20828 and has been patched in ASA FirePOWER module versions 6.2.3.19, 6.4.0.15, 6.6.7, and 7.0.21. Note that versions 6.2.2 and earlier, 6.3, 6.5, and 6.7 won’t receive a patch.
Enhancements and features (7)
- #16901 from bcoles – The
post/windows/manage/killav.rbscript has been updated to support shell and PowerShell sessions and has undergone some code cleanup. Additionally, documentation has now been created to explain its operations and how to use it. - #16934 from bcoles – This adds support for dumping process memory by name in the
post/windows/gather/memory_dumpmodule. - #16947 from ILightThings – This adds support for formatting buffers for golang.
- #16948 from gwillcox-r7 – This adds arguments for specifying the username, password and database to the
#run_sqlpost method. - #16952 from bcoles – This PR improves the
domain_controller?method to allow lower-priv users to invoke it, extends it to support shell sessions, and adds additional useful domain controller enumeration methods to the library. - #16973 from HuskyHacks – This adds support for formatting buffers for nim.
- #16983 from bcoles – This PR adds documentation, references and a more complete description for the firefox_xpi_bootstrapped_addon module.
Bugs fixed (5)
- #16861 from adfoster-r7 – Fixes a bug in
cmd/unix/reverse_sshthat stopped reverse SSH sessions from opening. - #16926 from jmartin-r7 – Fixes a bug when using RPC service with the analyze command and specifying a workspace, i.e. within Metasploit RPC client –
rpc.call('db.analyze_host', { host: '<metasploitable3 ip>', workspace: 'other' } ). - #16968 from luisfso – This PR adds support for the new syntax of the
findcommand’spermparameter while also maintaining support for the deprecated syntax. - #16972 from cgranleese-r7 – Updates msfconsole’s tables to support word wrapping when colors are present.
- #16974 from jbaines-r7 – Updates
Rex::Proto::Http::Clientto rely on Ruby’s built in string comparison.
Get it
As always, you can update to the latest Metasploit Framework with msfupdate
and you can get more details on the changes since the last blog post from
GitHub:
If you are a git user, you can clone the Metasploit Framework repo (master branch) for the latest.
To install fresh without using git, you can use the open-source-only Nightly Installers or the
binary installers (which also include the commercial edition).
Dr. Moiya McTier | The Milky Way: An Autobiography of Our Galaxy | Talks at Google
Post Syndicated from Talks at Google original https://www.youtube.com/watch?v=kbnfKHMgGcg
EV charging thoughts for renters, multi-family buildings, on-street parking areas, etc.
Post Syndicated from Technology Connextras original https://www.youtube.com/watch?v=1WuJtcgExa8
New additions to line charts in Amazon QuickSight
Post Syndicated from Bhupinder Chadha original https://aws.amazon.com/blogs/big-data/new-additions-to-line-charts-in-amazon-quicksight/
Amazon QuickSight is a fully-managed, cloud-native business intelligence (BI) service that makes it easy to create and deliver insights to everyone in your organization or even with your customers and partners. You can make your data come to life with rich interactive charts and create beautiful dashboards to be shared with thousands of users, either directly within the QuickSight application, or embedded in web apps and portals.
Line charts are ubiquitous to the world of data visualization and are used to visualize change in data over a dimension. They are a great way to analyze trends and patterns where data points are connected with a straight line to visualize the overall trend. In this post, we look at some of the new improvements to our line charts:
- Support for missing data points for line and area charts
- Improved performance and increased data limit to 10,000 data points
Missing data points
Line charts in QuickSight expect you to have data for each X axis item. If data is missing for any X axis item, it can lead to broken lines (default behavior) because there is no line drawn connecting the missing data points.
Drawing lines with points of missing data could be misleading because it would represent incorrect data, and there are valid use cases to do so. For example, imagine a scenario of a retail sales report for a given time period where data is recorded during days of operation (Monday through Saturday). In such cases, instead of displaying a broken line chart that skips Sunday, you may want to show a continuous trend by directly connecting Saturday to Monday, hiding the fact that Sunday isn’t operational. Alternatively, you may want to view store traffic for Sunday as 0 instead of displaying a broken line.
Previously, line charts only supported treating missing data for date/time fields. Now, we have added support for categorical data for both line and area charts. The following are the different line treatment options:
- Continuous line – Display continuous lines by directly connecting the line to the next available data point in the series
- Show as zero – Interpolate the missing values with zero and display a continuous line
- Broken line – Retain the default experience to display disjointed lines over missing values
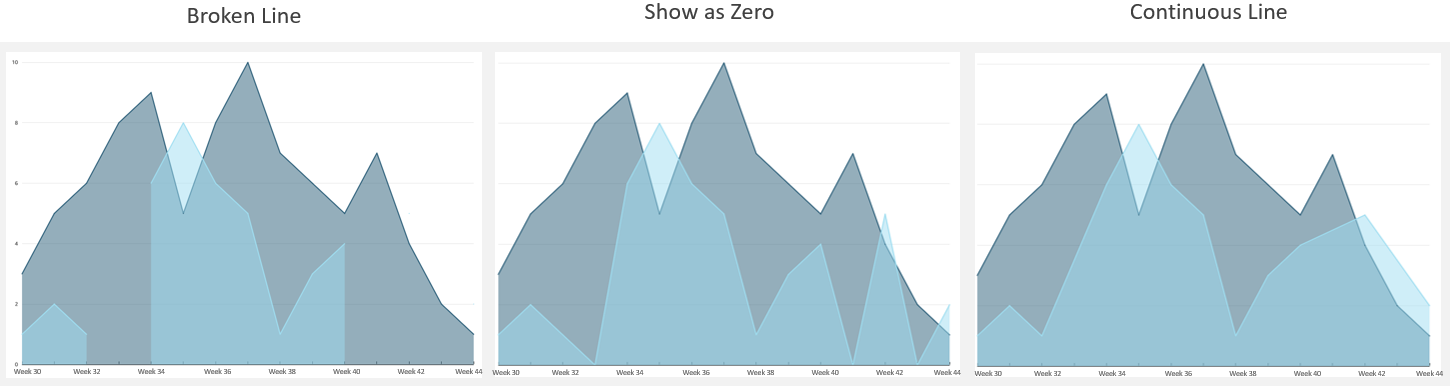
The following diagram illustrates a line chart using each option.
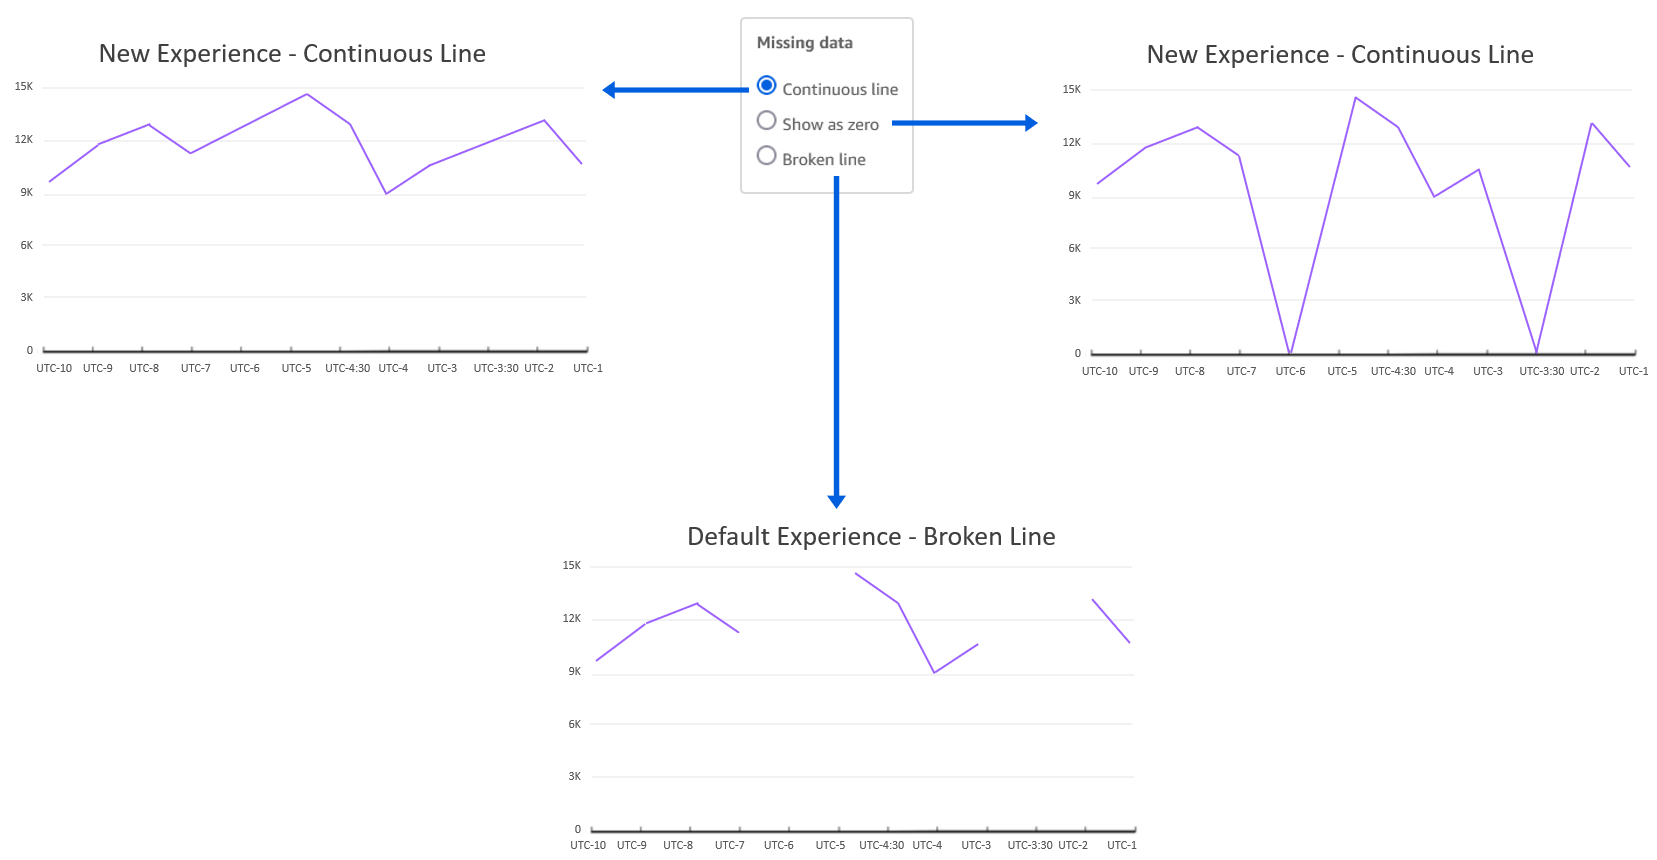
This new feature applies for both categorical and time series data on area charts as well, as shown in the following graphs.
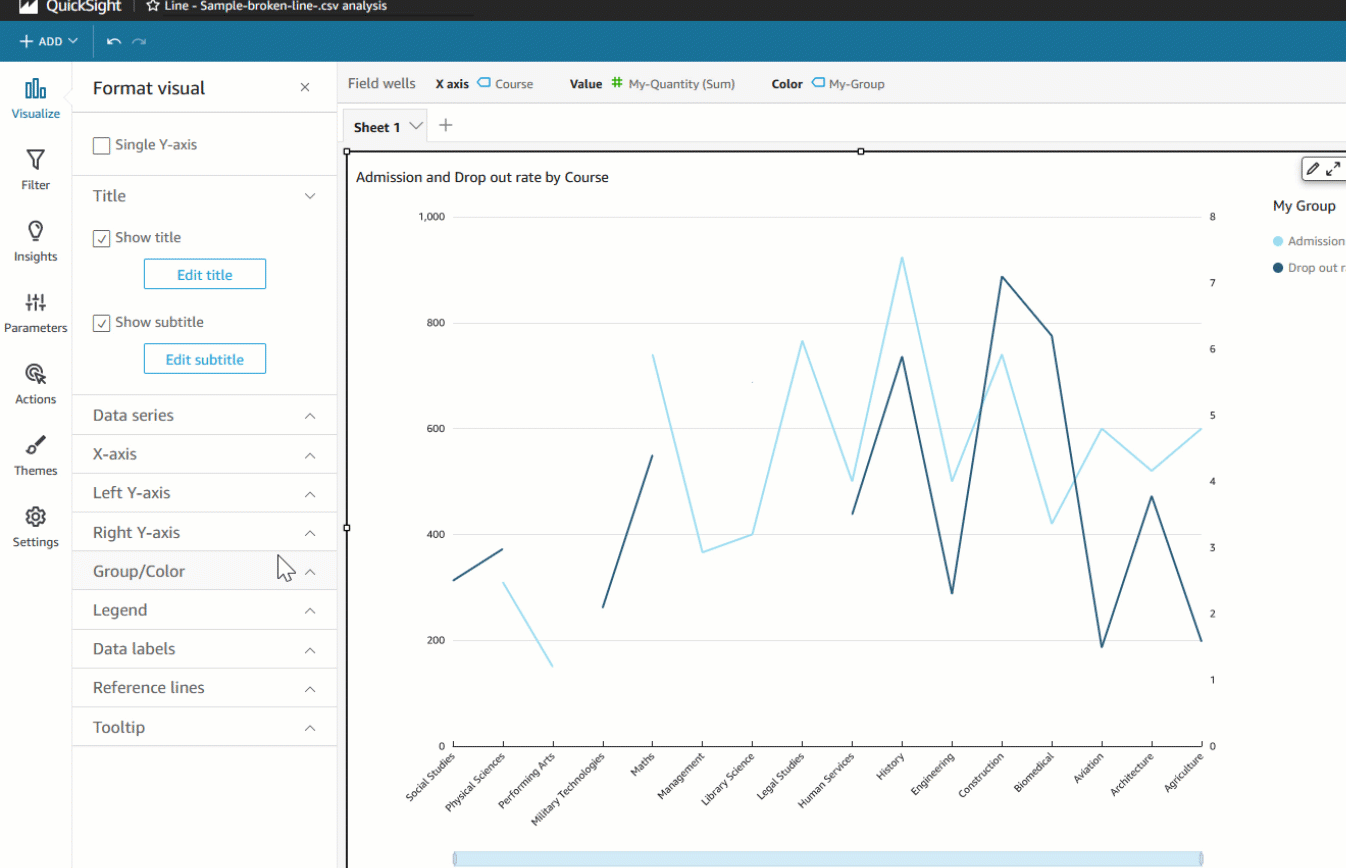
Authors can also configure different data treatments for the left and right Y axis for dual axis charts, as shown in the following example.
Increased data limit for line charts
With the recent update, we have improved line chart performance to support a maximum of 10,000 data points instead of the previous 2,500 data point limit. This also increases the limit for more line series created by the Color by field, which is also bound by the total data limit. For example, if the line chart has 1,000 data points for each series, you could display up to 10 unique colored series.
This update enables use cases where authors want to show a higher number of data points, such as hourly trends or daily trends for a year (365 data points) for multiple groups. This update doesn’t change the default limits of the Color by field (25) and X axis data point limit (100) that exist today to be compatible with existing dashboards and analysis, until authors choose to customize the limits.
Summary
In this post, we looked at how to treat missing data for line charts, where instead of viewing broken lines, you can display continuous lines. This helps you customize how you want to visualize overall trends and variations depending on the business context. Additionally, we looked at the new data handling limit for line charts, which supports 10,000 data points—four times more data than before. To learn more refer customizing missing data control.
Try out the new feature and share your feedback and questions in the comments section.
About the author
 Bhupinder Chadha is a senior product manager for Amazon QuickSight focused on visualization and front end experiences. He is passionate about BI, data visualization and low-code/no-code experiences. Prior to QuickSight he was the lead product manager for Inforiver, responsible for building a enterprise BI product from ground up. Bhupinder started his career in presales, followed by a small gig in consulting and then PM for xViz, an add on visualization product.
BEST Thunderbolt 4 USB-C Hub / Dongle – What to buy 2022
Post Syndicated from Matt Granger original https://www.youtube.com/watch?v=ILVWppYy2Q8
Integrating Cloud Security With DevOps and CI/CD Tools
Post Syndicated from Clint Merrill original https://blog.rapid7.com/2022/09/09/integrating-cloud-security-with-devops-and-ci-cd-tools/

This is the latest post in our blog series on shifting left in cloud security. In our last post, we kicked off the series with a high-level overview about Rapid7’s approach to shifting cloud security into the application development lifecycle. For this post, we’ll dive into a key aspect of our approach: integrating cloud security with developer and DevOps tooling.
Incentivizing adoption by reducing friction
When integrating security into any part of the development lifecycle there are some important factors to consider, including the security tools you’ll integrate, the processes you’ll ask developers to follow, and how aggressively you intend to enforce certain policies. When making these decisions, it’s important to consider the goals of adopting DevOps practices and infrastructure as code (IaC) respectively: to improve the velocity of application development and delivery, and to empower development teams to provision cloud infrastructure resources on a self-service basis.
Infusing security into these goals requires guardrails and routine checks to make sure the need for speed doesn’t create vulnerabilities or potentially exploitable misconfigurations. For IaC development, this is accomplished by having individual developers scan templates and plans as early as possible, and at key points in the CI/CD pipeline, before they’re considered for use in staging or production deployment. This is much easier said than done, as it relies on organizational buy-in, particularly from the developers who are typically laser-focused on bringing new products and features to market as fast as possible with the highest quality possible.
As with anything that relies on multiple teams collaborating in a process, the goal is to make it as easy as possible to adopt and demonstrate tangible value to all involved. Shifting security left into the software development lifecycle (SDLC) via developers and CI/CD tool integrations is a perfect application of this. One common example is allowing developers to execute scans on IaC templates or plans prior to a push or pull request, using a local command-line interface (CLI) tool.
The comfort of the CLI
In this context, a CLI tool allows a developer to interact with IaC security scanning features via a terminal prompt for familiarity and convenience. This comfortable experience will encourage adoption by using the CLI rather than engaging with a security product interface or API directly. In late 2021, we released our first CLI tool to initiate IaC scans in InsightCloudSec (ICS): mimics.
mimics has many intended uses that will expand over the time, but for now, the primary goals are:
- Enabling developers to execute on-demand security scans of their IaC plans and templates with results delivered directly in the CLI, thereby shortening the discovery and feedback loop for security and compliance issues to the point of immediate remediation
- Enabling DevOps teams to easily integrate IaC security scans at any point in the CI/CD workflow, thereby standardizing the process and enforcing security compliance checks and remediation as needed before progressing to the next integration or deployment step
In all cases, the mimics CLI simplifies integration and doesn’t require more costly script-based integration with the ICS API. In some cases, unique IaC security capabilities are exclusively available via mimics.
Introducing GitHub Actions integration
InsightCloudSec recently launched a GitHub Action to facilitate a bidirectional integration with our IaC scanning feature. Our goal is to streamline the incorporation of IaC security scans into your cloud application CI/CD process governed by GitHub. If you’re not familiar with GitHub Actions, they allow you to automate, customize, and execute workflow steps, including security and compliance checks. In doing so, users can discover, create, and share Actions with other community members.
A great use of the mimics CLI is to integrate with GitHub using our Action to trigger an ICS IaC scan at defined points in your workflow. Upon completion of the scan, you’ll receive an overall pass/fail result in reply, as well as detailed findings, if any, in SARIF format for display in the GitHub Advanced Security module as security alerts. If you don’t subscribe to the GitHub Advance Security module, you can still trigger IaC security scans and receive an overall pass/fail result to govern the workflow step, plus a detailed findings report in one of various readable formats.
More DevOps tool integrations on the way
As you can see, Rapid7’s InsightCloudSec is meeting developers and DevOps teams where they are today and expanding in the near future. We want to make integrating security controls by development teams easier. And we aren’t stopping there. We have a deep roadmap of additional integrations that will be coming soon. However, it’s important to note that you’re not limited by our formal integrations. The mimics CLI makes your custom integrations a snap, and we have examples in our product documents.
We understand the profound impact shifting security left can have on organizational buy-in, overall team efficiency, and of course, cloud security outcomes. Keep an eye out for upcoming enhancements that will further help you seamlessly integrate security throughout the entire SDLC.
If you’re interested in learning more about how InsightCloudSec helps your team get contextualized insight into your cloud security and risk posture, be sure to check out our bi-weekly demo series Gaining Layered Context in Cloud Security, which goes live every other Wednesday at 1pm EST.
Additional reading:
[$] Compiling Rust with GCC: an update
Post Syndicated from original https://lwn.net/Articles/907405/
While the Rust language has appeal for kernel development, many developers are
concerned by the fact that there is only one compiler available; there are
many reasons why a second implementation would be desirable. At the 2022
Kangrejos gathering, three developers
described projects to build Rust
programs with GCC in two different ways. A fully featured, GCC-based Rust
implementation is still going to take some time, but rapid progress is
being made.
Responsible Disclosure for Cryptocurrency Security
Post Syndicated from Bruce Schneier original https://www.schneier.com/blog/archives/2022/09/responsible-disclosure-for-cryptocurrency-security.html
Stewart Baker discusses why the industry-norm responsible disclosure for software vulnerabilities fails for cryptocurrency software.
Why can’t the cryptocurrency industry solve the problem the way the software and hardware industries do, by patching and updating security as flaws are found? Two reasons: First, many customers don’t have an ongoing relationship with the hardware and software providers that protect their funds—nor do they have an incentive to update security on a regular basis. Turning to a new security provider or using updated software creates risks; leaving everything the way it was feels safer. So users won’t be rushing to pay for and install new security patches.
Second, cryptocurrency is famously and deliberately decentralized, anonymized, and low friction. That means that the company responsible for hardware or software security may have no way to identify who used its product, or to get the patch to those users. It also means that many wallets with security flaws will be publicly accessible, protected only by an elaborate password. Once word of the flaw leaks, the password can be reverse engineered by anyone, and the legitimate owners are likely to find themselves in a race to move their assets before the thieves do. Even in the software industry, hackers routinely reverse engineer Microsoft’s patches to find the security flaws they fix and then try to exploit them before the patches have been fully installed.
He doesn’t have any good ideas to fix this. I don’t either. Just add it to the pile of blockchain’s many problems.
Setup a high availability design for Oracle Data Guard (Fast-Start Failover) using Amazon Route 53
Post Syndicated from Viqash Adwani original https://aws.amazon.com/blogs/architecture/setup-a-high-availability-design-for-oracle-data-guard-fast-start-failover-using-amazon-route-53/
Many customers use Oracle Database deployed on Amazon Elastic Compute Cloud (Amazon EC2) to run their Oracle E-Business Suite applications. They rely on Oracle Data Guard for high availability databases, with a standby database running in a different availability zone. Oracle Data Guard can switch a standby database to the primary role in case a production database becomes unavailable due to planned/unplanned outage.
Oracle E-Business Suite has AutoConfig Database Context files that points to Domain Name System (DNS), like a private IP DNS name or IP address on Amazon EC2. In case of switchover/failover, Database Context files in Oracle E-Business Suite need to be updated. With this solution, database context files do not need to be updated in case of switchover/failover. This is achieved by providing a single DNS name hosted on Amazon Route 53, always pointing to a primary database irrespective of running on any node.
This post demonstrates setting up a Route 53 hosted zone that points to primary and standby databases and will route requests to the database having a primary role. We will setup Route 53 health checks to monitor Amazon CloudWatch alarms, based on Oracle Data Guard Fast-Start Failover (FSFO) logs pushed from Oracle Database using CloudWatch agent.
Prerequisites
Before getting started, you must have the following:
- Oracle databases running on two separate EC2 instances for 1\Primary and 2\Standby node
- EC2 instance for 3\Observer node, with either Oracle Client Administrator software or the full Oracle Database software stack
- Oracle Data Guard configured to maintain standby databases as transactional consistent copy of the primary database
- Oracle Data Guard Command-Line Interface (DGMGRL) configured with observer process to facilitate FSFO
- FSFO enabled with observer configuration
Solution overview
Figure 1 depicts AWS services that are used build an architecture using a single Domain Name System (DNS) and Route 53 to have requests route to the primary database for Oracle Data Guard deployed on EC2 instances.
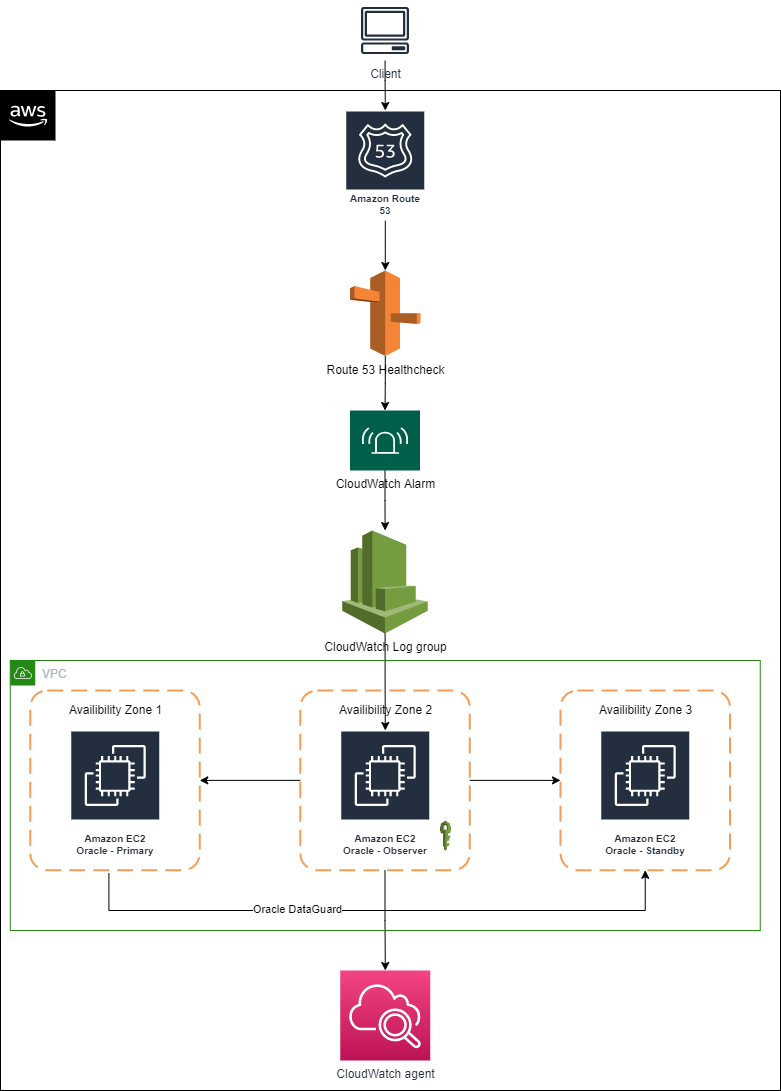
Figure 1. Using a single DNS and Amazon Route 53 to route requests
We encourage you to explore these articles prior to launching this architecture:
- Amazon EC2 for Oracle
- How to Create and Enable an Oracle Data Guard Broker Configuration Procedure
- Configure and Deploy Oracle Data Guard
- Oracle Data Guard Broker
Architecture components
- Primary node: An Oracle Data Guard configuration contains one production database (primary database) that functions in the primary role. This is the database that is accessed by most of your applications.
- Standby node: A standby database is a transactional consistent copy of the primary database. Once created, Oracle Data Guard automatically maintains each standby database by transmitting redo data from the primary database and applying it to the standby database.
- Observer node: A component of DGMGRL that is configured on a separate server with Oracle Client Interface outside the systems running the Oracle Data Guard configuration, which monitors the availability of the primary database. We recommend it is in a separate availability zone than the primary and standby databases. Should it detect that the primary database is unavailable or the connection cannot be made, it will issue a failover after waiting for the 30 seconds or specified by the FastStartFailoverThreshold property.
Note: This solution was tested on Oracle Database 19c Enterprise Edition Release 19.0.0.0.0 and Oracle Enterprise Linux OL7.5-x86_64. Select the required combination of operating system and database by referring to E-Business Suite Database Certifications. Active Oracle Data Guard configuration is not used in this solution; therefore, the database stays in mount state and unavailable for customer reads. However, this solution can be used with an active Oracle Data Guard configuration as well.
Infrastructure setup
This table details the lab environment and the database instance names used throughout this post.
| Database role | IP address | Instance name | Database unique name | Database open mode | Database port |
|---|---|---|---|---|---|
| Primary node | 172.31.xx.xx | ORCLVIQ | orclviq | Read write | 1522 |
| Secondary node | 172.31.xx.xx | ORCLVIQ | orclviq | Mounted | 1522 |
| FSFO observer node | 172.31.xx.xx | – | – | – | – |
| Route 53 hosted zone | Dataguardviq.com | Dataguardviq.com | – | – | – |
Solution implementation
1. IAM policy
To configure the CloudWatch agent on an EC2 instance, create an IAM role via the console, AWS Command Line Interface, or AWS API. By default, an IAM role does not have any privileges and cannot access AWS resources. Before creating an IAM role, create an IAM policy with the permissions required to access CloudWatch logs, specifying the CloudWatch resources you want to monitor or *, which will allow access to CloudWatch logs.
Create the IAM policy using the following JSON and give it a name, like dgpolicy, which grants specific permissions. In this case, the permissions include creating log groups and log streams, inputting log events, and describing log stream for all logs.
{
    "Version": "2012-10-17",
    "Statement": [
        {
            "Action": [
                "logs:DescribeLogGroups",
                "logs:DescribeLogStreams",
                "logs:GetLogEvents",
                "s3:GetBucketLocation"
            ],
            "Effect": "Allow",
            "Resource": "*"
        }
    ]
}
2. IAM role
Create the IAM role (for example, dgrole) and attach the policy created in Step 1.
3. Associate IAM role with Amazon EC2 having FSFO observer node running on it
Associate the IAM role with Amazon EC2 from AWS console:
- Open the Amazon EC2 console.
- In the navigation pane, choose Instances.
- Select the instance, and choose Action, Security, Modify IAM role.
- Select the IAM role to attach to your instance; choose Save.
You also can use the associate-iam-instance-profile command to attach the IAM role to the instance by specifying the instance profile:
aws ec2 associate-iam-instance-profile \
    --instance-id i-1234567890lmnopq1 \
    --iam-instance-profile Name=" dgrole"
4. Install CloudWatch log agent on observer node
Install CloudWatch Logs agent on the observer node that already has FSFO log configuration setup on it. After installation is complete, logs will automatically flow from the instance to the log stream you created while installing the agent, as depicted in Figures 2 and 3.
$curl https://s3.amazonaws.com/aws-cloudwatch/downloads/latest/awslogs-agent-setup.py -O
$sudo python ./awslogs-agent-setup.py --region ap-southeast-2

Figure 2. Steps to install Amazon CloudWatch agent
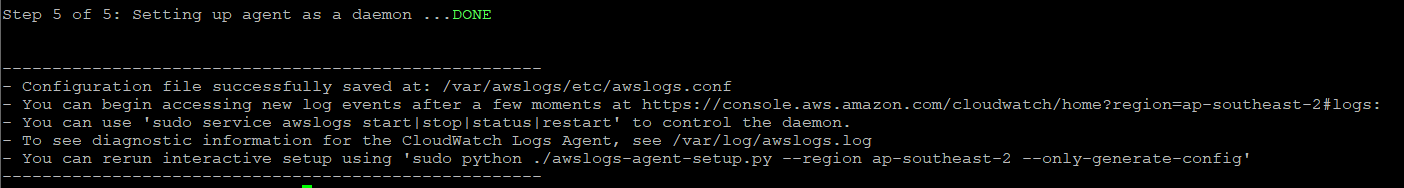
Figure 3. Example of output
At this point, FSFO logs are visible in CloudWatch logs. Perform a database switchover to confirm that logs are being published to CloudWatch logs.
5. Create CloudWatch metric filter
Create primary metric filter
- Create metric filter on “Standby database has changed to orclviq” and set value to “1”.
- Open the CloudWatch log group and search for “Standby database has changed to orclviq“. Once results are displayed, “Create Metric Filter” button will appear at top right (as demonstrated in Figure 4).
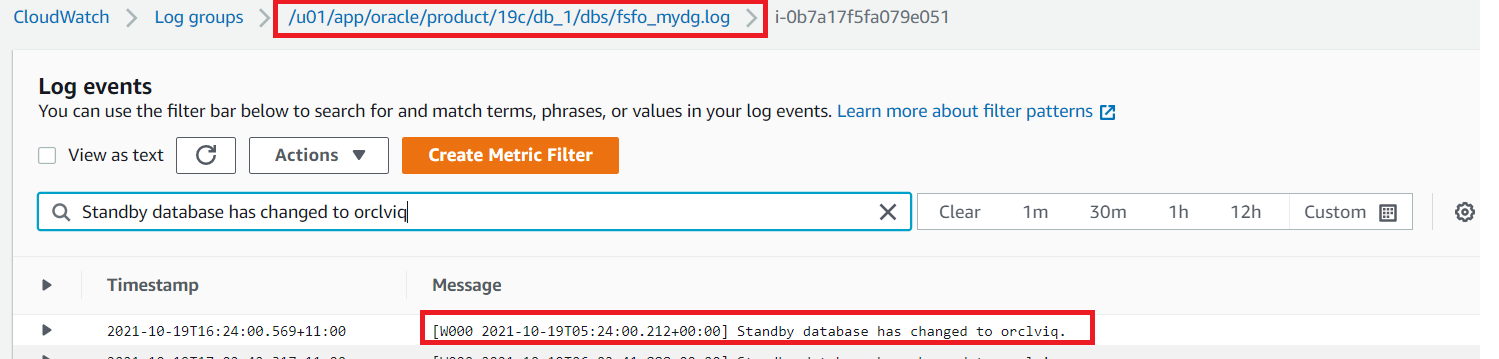
Figure 4. Amazon CloudWatch log group
- “Filter name” and “Filter pattern” are filled automatically, as we already filtered that while accessing the CloudWatch log. Create a new name space in the metric, which we will later use in second metric filter. Specify “Metric namespace”, which will also be the same for the second metric filter. “Metric value” is “1”, as detailed in Figure 5.
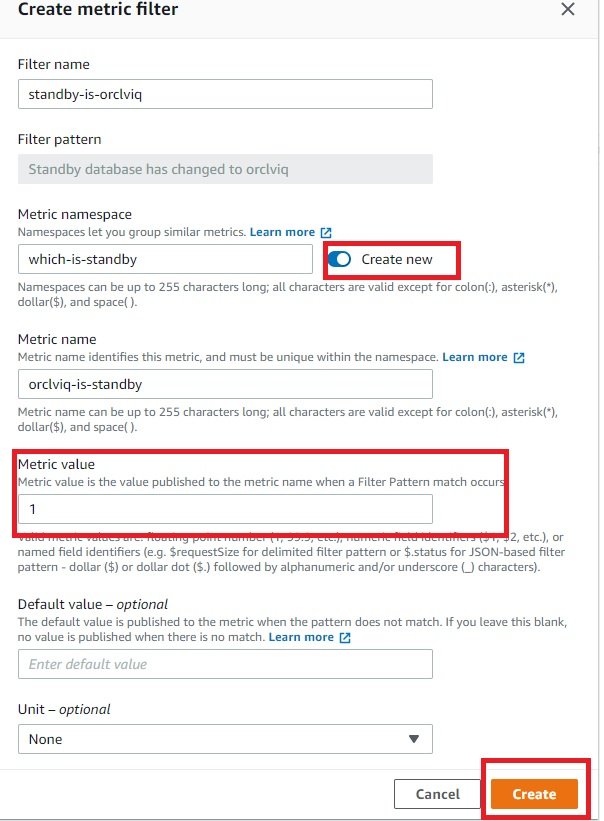
Figure 5. Amazon CloudWatch metric filter
Create secondary metric filter
- To create a second metric filter, follow steps to create the primary metric filter but the filter pattern will be “Standby database has changed to orclstd“. The only difference in this step will be setting the “Metric value” to “0”.
- Verify the metric filter is working and able to find desired entries in the FSFO logs that will decide which instance is the primary database by:
- Click on one of the metric filters
- Select log data to test, and choose and EC2 instance ID
- Testing the pattern to verify if metric filters are working properly
- Select “Next”
- Save changes
6. Create a CloudWatch alarm
Create a CloudWatch alarm that will monitor CloudWatch metrics and perform actions based on the value of the metric.
- Within CloudWatch Alarms section (Step 1), select “Create alarm” and then select “Metric”, as in Figure 6.
- In Step 2, you can create a new topic and specify the email address where you would like to receive notifications regarding changes in primary or standby database.
- In Step 3, you can specify the alarm name and optional alarm description.
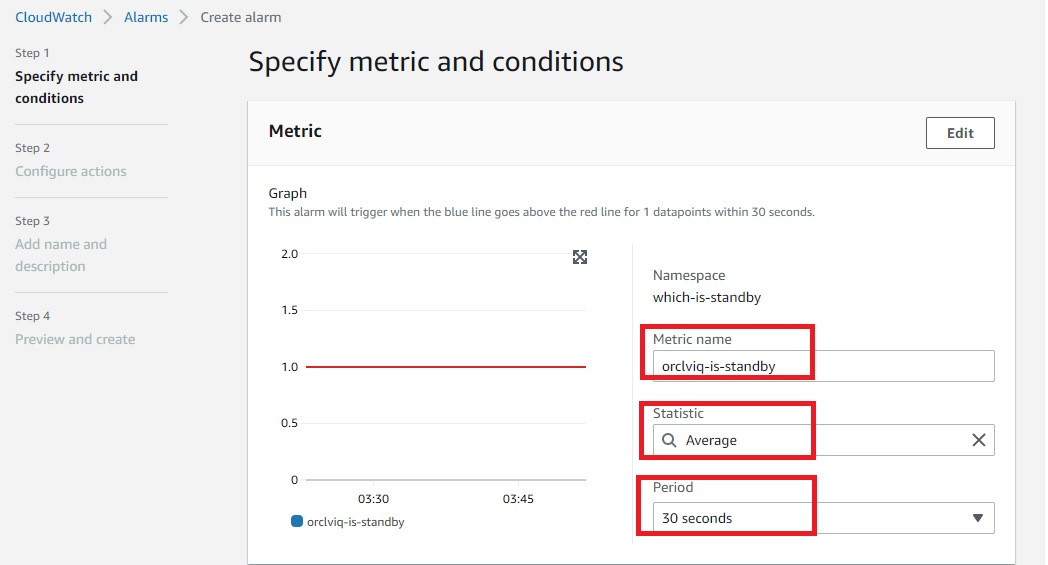
Figure 6. Amazon CloudWatch alarm
- To configure Conditions, as detailed in Figure 7, be sure the threshold type is set to “Static”, the alarm condition is “Greater/Equal”, and the threshold value is “1”.
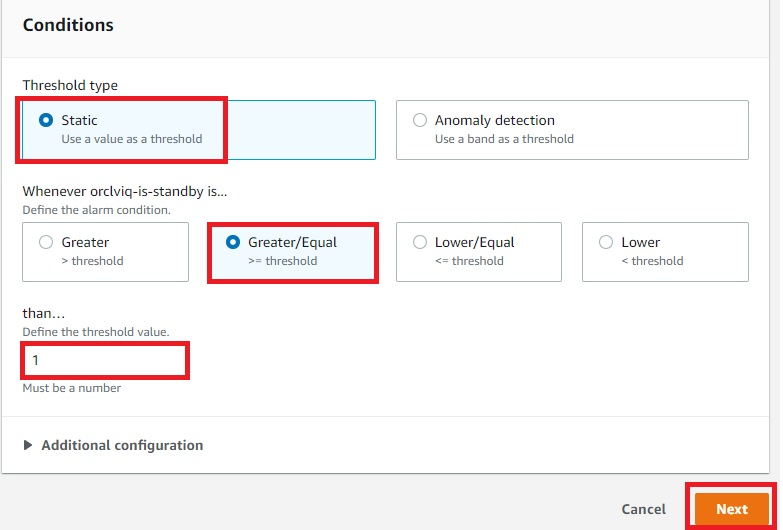
Figure 7. Amazon CloudWatch alarm condition
- Figure 8 demonstrates the summary of the ready CloudWatch metrics and configured alarm. At this point, “orclviq” is the primary database, so the alarm state will be “Insufficient data”. Try to do a switchover and the alarm state should be changed to “In alarm”.
- Switch it back to original primary before proceeding further
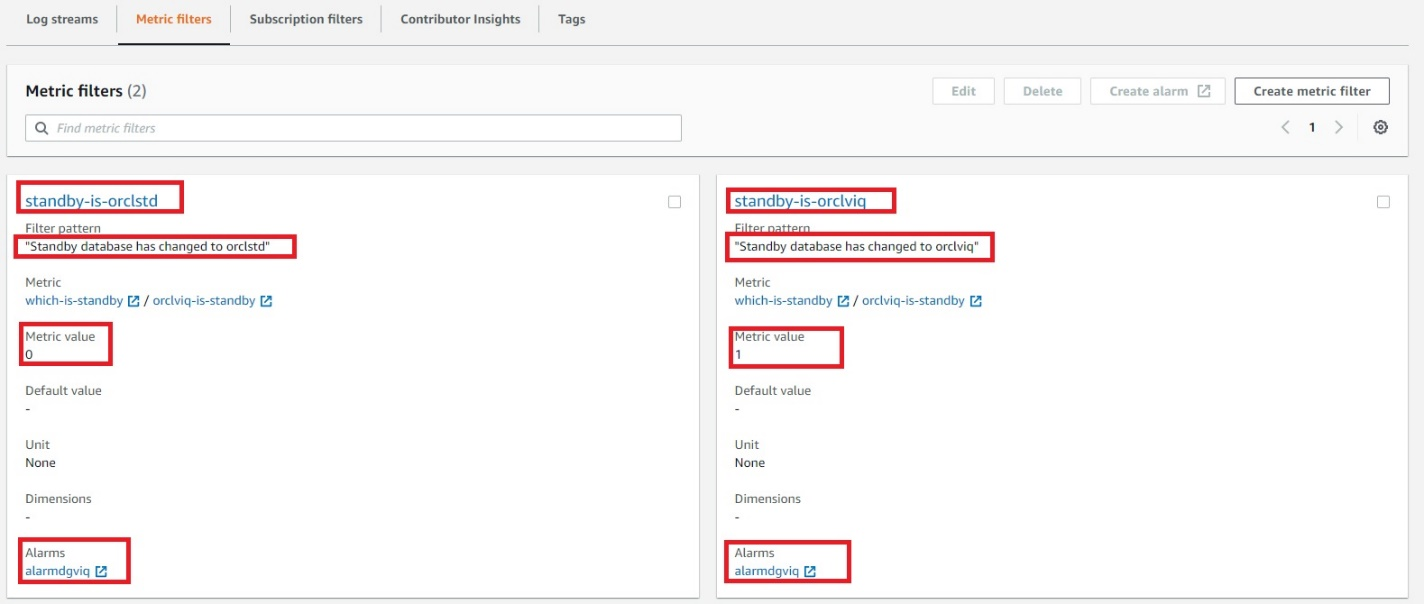
Figure 8. Final view of both metric filters combined
7. Create Route 53 health checks
Creating Route 53 health checks based on the CloudWatch alarm identifies DNS failover. Health checks can be created on public IP directly without creating above metric filters and alarms, but it is unlikely that customers will have a public IP on database servers. Route 53 cannot check the health of an IP address endpoint despite if it is local, private, non-routable, or multi-cast ranges. Therefore, health checks will have to be created on the state of CloudWatch alarm (Figure 9):
- Within the Route 53 console, select “Configure health check”.
- Select “State of CloudWatch alarm”, then select the region of your CloudWatch metrics and choose the CloudWatch alarm that was created earlier from the dropdown menu.
- Skip creating an alarm for health check, as the alarm is already configured for CloudWatch metric filter.
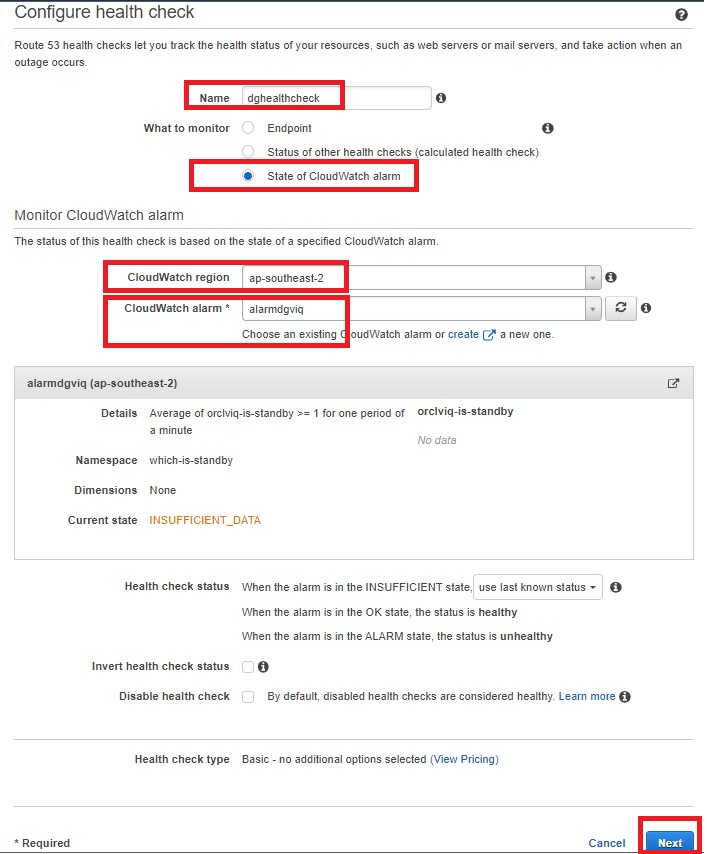
Figure 9. Amazon Route 53 health check parameters
- The health check is now ready and status will be “Unknown”. It will change to “Healthy”, as it is currently having primary orclviq, which means it’s satisfying “Standby database has changed to orclstd“.
- At this point, try doing a failover and observe if health check status changes to “Unhealthy”. Switch it back to the original primary before proceeding.
- The health check should return to “Healthy” state.
- Check the status of the alarm:
- OK: the status is healthy
- ALARM: the status is unhealthy
- INSUFFICIENT: use last known status
8. Create Route 53 hosted zone
A Route 53 hosted zone in this solution will have failover routing based on records pointing to IP addresses of primary and standby database server. When the Route 53 health check is in an “Unhealthy” state, failover routing kicks in and the hosted zone starts routing requests to the IP address of the standby database server.
- A Route 53 hosted zone will have records of your primary and standby database instance private IP. Because it is a private hosted zone, it will use the same VPC as the observer node on which we deployed the CloudWatch agent (Figure 10).
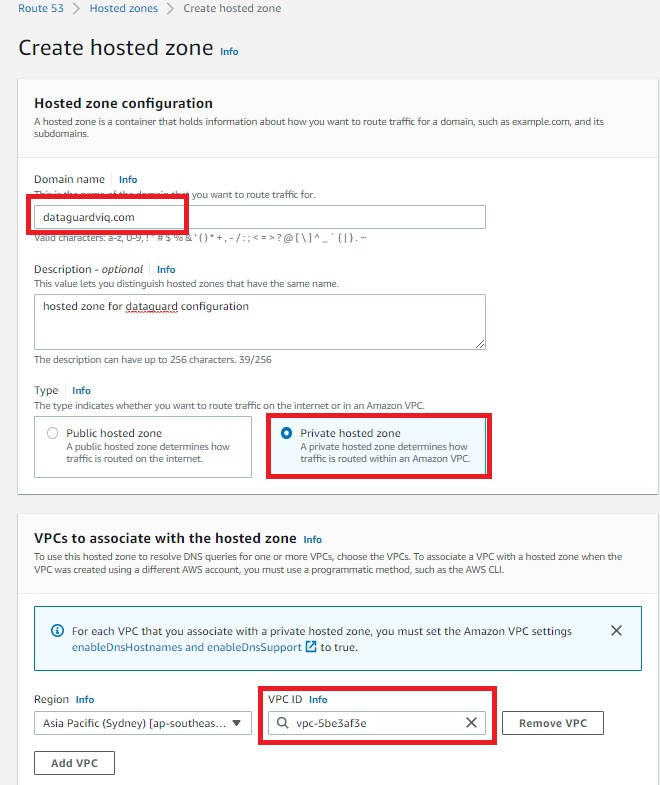
Figure 10. Amazon Route 53 hosted zone
- Once the Route 53 hosted zone is ready, the last step is to create records by adding private IP addresses of primary and secondary database servers (Figures 11 and 12). Routing policy is set as a failover. That means, if the Route 53 health check fails, the hosted zone does a DNS failover to standby server IP.
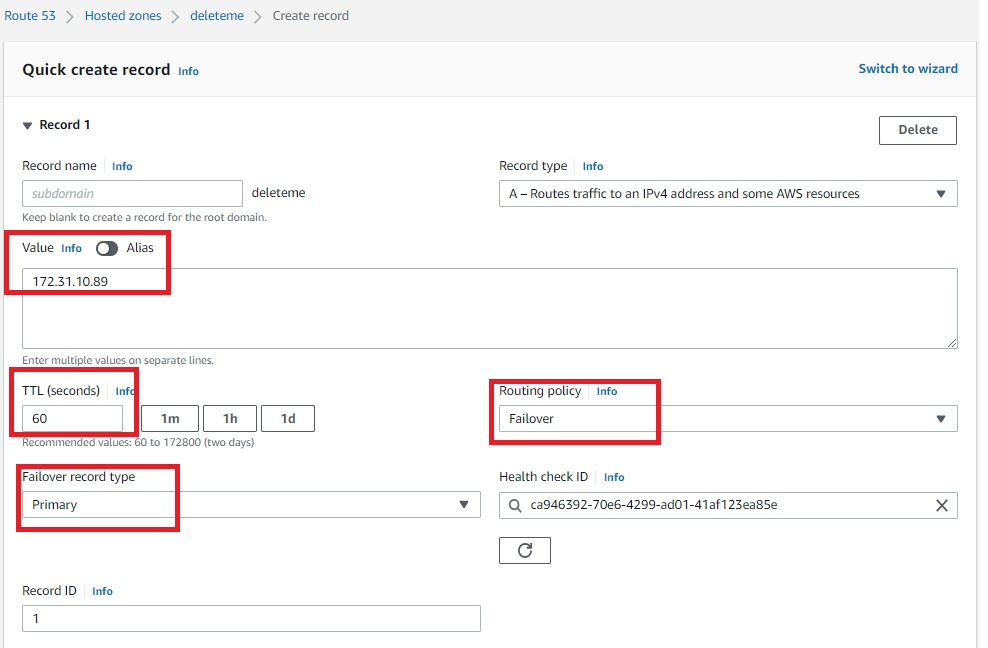
Figure 11. Amazon Route 53 hosted zone record for primary servers
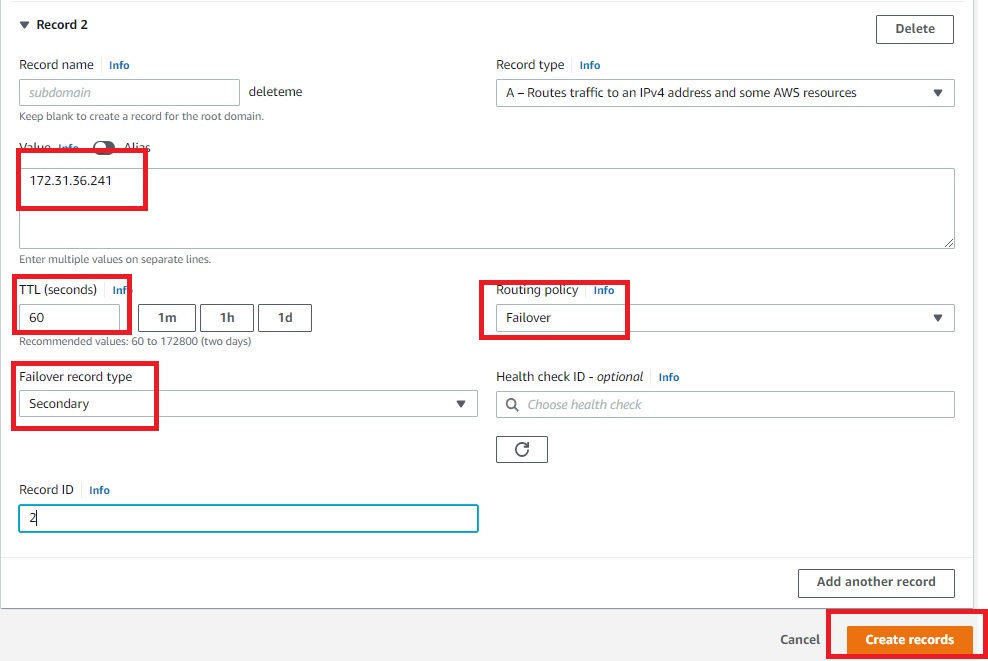
Figure 12. Amazon Route 53 hosted zone record for secondary servers
Once the records are created, the hosted zone will have an IP address of primary and secondary database servers, as demonstrated in Figure 13.
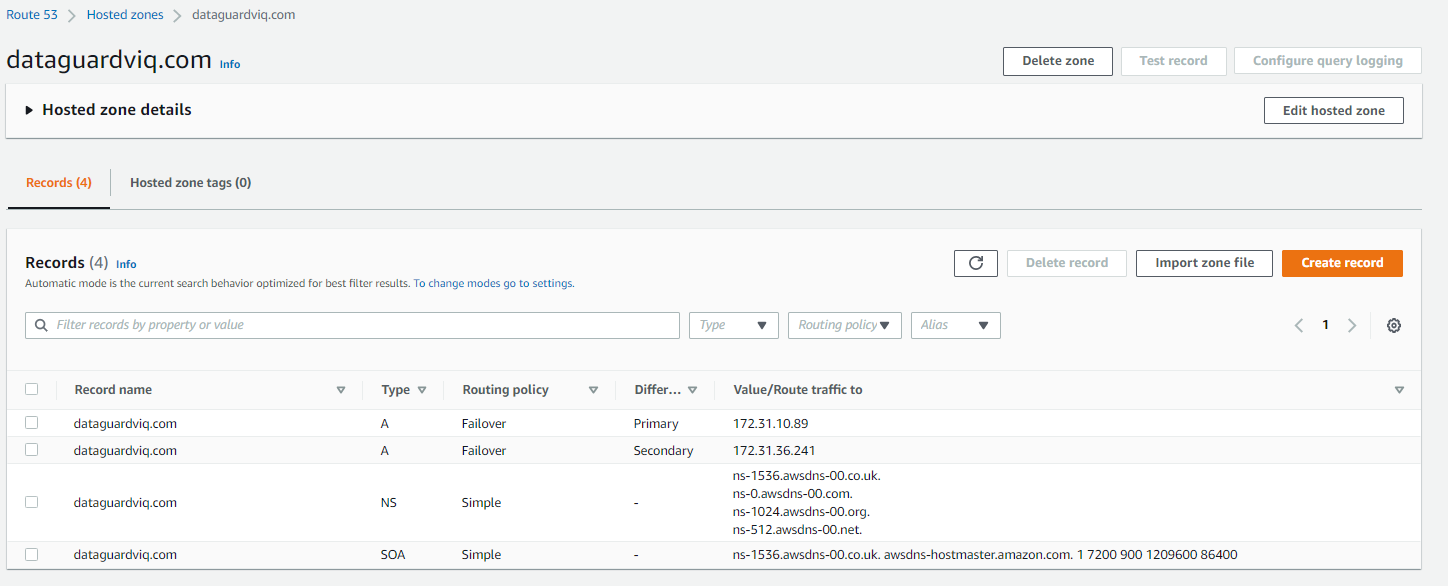
Figure 13. Final view of Amazon Route 53 hosted zone
Solution testing
To test the solution, do a telnet utility test to evaluate network connectivity on the Route 53 hosted zone that was created. It should display the IP address of the primary database server: 172.31.10.89.
[ec2-user@ip-172-xx-xx-xx ~]$ telnet dataguardviq.com 1522
Trying 172.31.10.89…
Connected to dataguardviq.com.
Escape character is ‘^]’.
Next, perform a switchover or failover of the primary to secondary database server. This can be done with the DGMGRL command “switchover to orclstd”. Output will be:
DGMGRL> switchover to orclstd;
Performing switchover NOW, please wait…
Operation requires a connection to database “orclstd”
Connecting …
Connected to “orclstd”
Connected as SYSDBA.
New primary database “orclstd” is opening…
Oracle Clusterware is restarting database “orclviq” …
Connected to an idle instance.
Connected to an idle instance.
Connected to an idle instance.
Connected to an idle instance.
Connected to “orclviq”
Connected to “orclviq”
Switchover succeeded, new primary is “orclstd”
Now, the new primary is “orclstd”. In the backend, the Route 53 health check will be initiated and cause a failover. This means the telnet Route 53 hosted zone will give the IP address of the new primary (old secondary), which is 172.31.36.241.
[ec2-user@ip-172-xx-xx-xx ~]$ telnet dataguardviq.com 1522
Trying 172.31.36.241…
Connected to dataguardviq.com.
Escape character is ‘^]’.
Cleanup
To cleanup, remove:
- Route 53 host zone
- CloudWatch metric filter
- CloudWatch alarm
- CloudWatch agent from observer node
- IAM role and policy created specifically for this solution
Conclusion
This solution demonstrated how to use a Route 53 hosted zone to route requests to the active primary node for Oracle Data Guard on Amazon EC2.
I hate my new myQ garage openers! Why I’m removing the cloud and adding status lights.
Post Syndicated from digiblurDIY original https://www.youtube.com/watch?v=r2afX9I8HSk
5.25" PC Drive Bay Speakers & Subwoofer from the 90s
Post Syndicated from LGR original https://www.youtube.com/watch?v=cZ_CEJMOPQw