What’s Up, Home? – Record Your Roomba Dance

Post Syndicated from Janne Pikkarainen original https://blog.zabbix.com/whats-up-home-record-your-roomba-dance/22943/

Can you monitor your several-year-old dumb Roomba iRobot vacuum cleaner with Zabbix? Of course, you can!

By day, I am a monitoring technical lead in a global cyber security company. By night, I monitor my home with Zabbix & Grafana and make weird experiments with them. Welcome to my weekly blog about this project.

This post is a tad bit shorter than usual, as my summer vacation was looming and I had much other fish to fry before that. However, my motivation for this post came from guests visiting us at our home that weekend, so doing the hoovering and stuff was a reasonable thing to do.

Monitor your robot vacuum cleaner with Zabbix

So, I just did put our Roomba to do some initial cleaning. While doing so, I attached the RuuviTag I used in my last post to our Roomba, and of course, did so by using the gorgeously ugly brown tape to secure Ruuvi’s trip.

As RuuviTag has acceleration sensors, it may be possible to record Roomba’s movements by using Ruuvi. Does it work? Of course, it does.

See, it works!

This is so far my most rushed blog entry, as I literally started this experiment in about 30 minutes. The RuuviTag was already configured to my Zabbix, as it’s the same one that is/was measuring if our dog Lily is in her bed.

However, Lily’s presence was detected by utilizing Ruuvi’s temperature sensor. This Roomba experiment is done by checking the readings from RuuviTag acceleration sensors. See, it works!

From the graph we can clearly see 1) the moment I did transfer RuuviTag from Lily’s bed to Roomba and 2) Roomba’s movement.

So, from these graphs, I can then see for how long Roomba was doing its stuff.

But why?

OK, this is a stupid example, but in the real world, there would be more practical applications for this kind of monitoring. For example, monitor something that should NOT be moving (maybe a grill in your backyard or a safe at work), and if it starts moving, immediately suspect that something is wrong. Or, monitor something that should be in the constant move (conveyor belt?) but is not, and alert accordingly.

I have been working at Forcepoint since 2014 and adding more data points to monitoring is still fascinating. — Janne Pikkarainen

This post was originally published on the author’s LinkedIn account.

The post What’s Up, Home? – Record Your Roomba Dance appeared first on Zabbix Blog.

Repair cafés in computing education | Hello World #19

Post Syndicated from Katharine Childs original https://www.raspberrypi.org/blog/repair-cafes-computing-education-hello-world-19/

Many technology items are disposed of each year, either because they are broken, are no longer needed, or have been upgraded. Researchers from Germany have identified this as an opportunity to develop a scheme of work for Computing, while at the same time highlighting the importance of sustainability in hardware and software use. They hypothesised that by repairing defective devices, students would come to understand better how these devices work, and therefore meet some of the goals of their curriculum.

A smartphone with the back cover taken off so it can be repaired.

The research team visited three schools in Germany to deliver Computing lessons based around the concept of a repair café, where defective items are repaired or restored rather than thrown away. This idea was translated into a series of lessons about using and repairing smartphones. Learners first of all explored the materials used in smartphones and reflected on their personal use of these devices. They then spent time moving around three repair workstations, examining broken smartphones and looking at how they could be repaired or repurposed. Finally, learners reflected on their own ecological footprint and what they had learnt about digital hardware and software.

An educational repair café

In the classroom, repair workstations were set up for three different categories of activity: fixing cable breaks, fixing display breaks, and tinkering to upcycle devices. Each workstation had a mentor to support learners in investigating faults themselves by using the question prompt, “Why isn’t this feature or device working?” At the display breaks and cable breaks workstations, a mentor was on hand to provide guidance with further questions about the hardware and software used to make the smartphone work. On the other hand, the tinkering workstation offered a more open-ended approach, asking learners to think about how a smartphone could be upcycled to be used for a different purpose, such as a bicycle computer. It was interesting to note that students visited each of the three workstations equally.

Two girls solder physical computing components in a workshop.
Getting hands-on with hardware through physical computing activities can be very engaging for learners.

The feedback from the participants showed there had been a positive impact in prompting learners to think about the sustainability of their smartphone use. Working with items that were already broken also gave them confidence to explore how to repair the technology. This is a different type of experience from other Computing lessons, in which devices such as laptops or tablets are provided and are expected to be carefully looked after. The researchers also asked learners to complete a questionnaire two weeks after the lessons, and this showed that 10 of the 67 participants had gone on to repair another smartphone after taking part in the lessons.

Links to computing education

The project drew on a theory called duality reconstruction that has been developed by a researcher called Carsten Schulte. This theory argues that in computing education, it is equally important to teach learners about the function of a digital device as about the structure. For example, in the repair café lessons, learners discovered more about the role that smartphones play in society, as well as experimenting with broken smartphones to find out how they work. This brought a socio-technical perspective to the lessons that helped make the interaction between the technology and society more visible.

A young girl solders something at a worktop while a man looks over her shoulder.
It’s important to make sure young people know how to work safely with electronic and physical computing components.

Using this approach in the Computing classroom may seem counter-intuitive when compared to the approach of splitting the curriculum into topics and teaching each topic sequentially. However, the findings from this project suggest that learners understand better how smartphones work when they also think about how they are manufactured and used. Including societal implications of computing can provide learners with useful contexts about how computing is used in real-world problem-solving, and can also help to increase learners’ motivation for studying the subject.

Working together

The final aspect of this research project looked at collaborative problem-solving. The lessons were structured to include time for group work and group discussion, to acknowledge and leverage the range of experiences among learners. At the workstations, learners formed small groups to carry out repairs. The paper doesn’t mention whether these groups were self-selecting or assigned, but the researchers did carry out observations of group behaviours in order to evaluate whether the collaboration was effective. In the findings, the ideal group size for the repair workstation activity was either two or three learners working together. The researchers noticed that in groups of four or more learners, at least one learner would become disinterested and disengaged. Some groups were also observed taking part in work that wasn’t related to the task, and although no further details are given about the nature of this, it is possible that the groups became distracted.

The findings from this project suggest that learners understand better how smartphones work when they also think about how they are manufactured and used.

Further investigation into effective pedagogies to set group size expectations and maintain task focus would be helpful to make sure the lessons met their learning objectives. This research was conducted as a case study in a small number of schools, and the results indicate that this approach may be more widely helpful. Details about the study can be found in the researchers’ paper (in German).

Repair café start-up tips

If you’re thinking about setting up a repair café in your school to promote sustainable computing, either as a formal or informal learning activity, here are ideas on where to begin:

  • Connect with a network of repair cafés in your region; a great place to start is repaircafe.org
  • Ask for volunteers from your local community to act as mentors
  • Use video tutorials to learn about common faults and how to fix them
  • Value upcycling as much as repair — both lead to more sustainable uses of digital devices
  • Look for opportunities to solve problems in groups and promote teamwork

Discover more in Hello World

This article is from our free computing education magazine Hello World. Every issue is written by educators for educators and packed with resources, ideas, and insights to inspire your learners and your own classroom practice.

Cover of issue 19 of Hello World magazine.

For more about computing education in the context of sustainability, climate change, and environmental impact, download issue 19 of Hello World, which focuses on these topics.

You can subscribe to Hello World for free to never miss a digital issue, and if you’re an educator in the UK, a print subscription will get you free print copies in the post.

PS If you’re interested in facilitating productive classroom discussions with your learners about ethical, legal, cultural, and environmental concerns surrounding computer science, take a look at our free online course ‘Impacts of Technology: How To Lead Classroom Discussions’.

The post Repair cafés in computing education | Hello World #19 appeared first on Raspberry Pi.

Къща На Село – какво ни очаква след покупката

Post Syndicated from VassilKendov original http://kendov.com/village_house_how_to/

Откакто се роди вторият ми син, ремонтирам вилата. Ще рече 11 години вече. Строена е когато аз съм се родил, в най-голения недоимък на материали.
Между другото винаги съм се питал, как така при този недоимък по време на комунизма, се построиха всички тези вили? Всеки имаше вила и апартамент. Но това е тема на друг разговор. Днес ще се концентрирам върху точно тези имоти, които копуваме на село и ползваме като вили, проблемите с тях и решенията.

Миналата седмица, покрай оранжерията, прегледах тефтера. Давал съм между 3000 и 7000 на година за ремонт и поддръжка на имота.
Имайте предвид, че повечето неща си ги правя сам и това е стойността само на метриалите. А защо си ги правя сам ли?

НЯМА МАЙСТОРИ

Коагато купиш къща на село, неминуемо започваш ремонти. Ако имаш вътрешна баня и тоалетна си късметлия. Това обаче е рядкост. Повечето стари къщи на село или изобщо нямат баня и тоалетна, или те са външни. За състоянието им изобщо няма да говорим. В 21-ви век да дадеш пари за къща и да ходиш вън до тоалетната си е доста неудобно.
Това значи ремонт и то не малък. Започва се с търсене на майстори, които всички знаем, че бяха кът. Вече не е съвсем така, но за малки поръчки трудно се съгласяват да идват в отдалечени села и винаги си на края ан сезона. Опивали са се да ми казват, че ще дойдат Ноември, а селото е на 1120 метра надмоска височина. Представете си какво е Ноември и как се лепят плочки на тераса при 0 градуса.
С две думи майсторите не искат малки поръчки в отдалечени места.

МАТЕРИАЛИТЕ

Всичко се доставя от близкия град. Това усложнява и оскъпява още нещата, защото ставате зависим и от още един човек с транспорт. Повярвайте ми не всичко можете да съберете в личния си автомобил.

ДОКУМЕНТИТЕ ПРИ ПОКУПКА

Много рядко можете да намерите имот с изрядни документи. Обикновено на село всеки е строил и достроявал както му падне. А за наследниците да не говорим. Като прави проверка на собствеността на такива имоти за да ги подготвим за продажба се виждаме в чудо. На последната сделка бяхме 12 човека при нотариуса. Някои чакаха отвън.
В тази връзка не се заблуждавайте, че ще купите имот без да позлвате услугите на адвокат – няма да стане!

Текста продължава след формата за среща

За срещи и консултации по банкови неволи, моля използвайте посочената форма.

[contact-form-7]

ИНСТАЛАЦИИТЕ

Няма къща на село, която да няма нужда от преправяне на електроинсталациите и ВиК-то. Това са друг вид майстори от тези които ще Ви правят конструктивните ремонти, но все пак са майстори.

ВРЕМЕТО

Най-трудно е да се отдели време. Ако си мислите, че ще оставите ключовете на майсторите и като дойдете всичко ще е наред, ще бъдете много неприятно изненадани. Спестете си нервите и отделете време да сте там, когато са и масторите. Знам, че е скъпо, но пак е по-добре. Иначе ще правите всичко по 2 пъти.

ОТОПЛЕНИЕТО

В повечето селски къщи отоплението е решено на дърва. Тази година и те са на двойна цена. По-добре е да се отоплявате на ток, но пък електропреносната мрежа в селата не е най-издържливата. Както казахме и инсталацията най-вероятно е стара, та не се знае дали ще стане на ток.
Локалното парно с котел май си остава най-изгодния начин за отопление на селска къща, но изграждането му е скъпо. Пеигответе около 8-10000 лева, ако не го правите сами.

НАПРАВИ СИ САМ

Това не е за всеки, но пък е евтино. Винаги съм предпочитал да си купя някой инструмент и да човъркам нещо, вместо да стоя да гледам майстора и да се ядосвам я за качество, я за мудност.
Но както казах това не е за всеки, макар да е евтино. При мен межу 3000 и 7000 лева на година, в зависимост от проектите които съм подхванал.

ЦЕНАТА НА ИМОТА

Това е най забавната част. Много обичам като дойдат при мен клиенти и кажат че купуват нещо, без да са си направили сметката. За д ане ви отегчавам, но да си знаете, че всяка стара къща на секло над 500EUR на м2 си е „набутка”, просто защото това е цената на новото строителство. Всеки се захласва по сглобяеми къщи, но малко хора си правят таква. Аз обаче имам и такава и Ви казвам, че струва толкова и се изпълнява за 2-3 месеца.
Ако няма да живеете постоянно в нея е идеална. Пак има майстори, но са само 2-3 месеца. После получавате нещо ново и точно според Вашите изисквания.
Моята сглобяема къща я строи Ники (това не е вилата, а друга къща). Определено съм доволен. Ако Ви трябват координати – пишете ми ще Ви пратя.
В една стара къща никога не можеш да сметнеш колко ще са ремонтите. Постоянно изкачат разни неща. Гарантирам ви, че в следващите поне 5 години ще подчините съботите и неделите си на ремонти и майстори по старата селска къща. Имам вече над 5 клиента, които след покупка просто я бутнаха и постоиха нова. По-изгодно им излезе.

ПОДДРЪЖКАТА

Всички имаме хубави спомени при баба на село. Хубава храна, подредени градинки, цветенца и окосени ливадки. Е да ама сега за това ще трябва да се грижим ние и то от 50-150км разстояние. Отиваме там събота и неделя и бързаме да окосим, засадим, оплевим, нацепим дървата, евентуално нещо змнина… С две думи понеделник отиваме на работа пребити, просто защото баба и дядо са живели там постоянно, а ние всичко трябва да свършим за 2 дни. Определено е доста натоварващо да постигнем за децата си този стандарт и тези спомени, които преди са ни били осигурени от баба и дядо.

РЕШЕНИЕТО на проблемите

Преди вскичко запомнете – ПОВЕЧЕ ОТ 500 EUR на квадрат за стара къша на село НЕ!!! Новото е на тази цена, а бътането на старата къща и извозването е между 10 000 и 15 000 лева, колкото може би е и цената на парцела.

Ако искате да е евтино, трябва да си го правите сами!

Ако имате майстори, трябва и Вие да сте там!

Не правете компромис с проверката на имота при покупка!

Не правете много екстри – оранжерии, градинки, детски къщи, фурни, джакузита, навеси… всичко изисква време, пари и нерви. Живейте си живота на зелената морава!

Ако информацията Ви е била полезна, моля споделете статията във ФБ и се абонирайте за канала в Youtube – https://www.youtube.com/channel/UChh1cOXj_FpK8D8C0tV9GKg

Васил Кендов
www.Draftis.com – кредитни консултанти

The post Къща На Село – какво ни очаква след покупката appeared first on Kendov.com.

How to centralize findings and automate deletion for unused IAM roles

Post Syndicated from Hong Pham original https://aws.amazon.com/blogs/security/how-to-centralize-findings-and-automate-deletion-for-unused-iam-roles/

Maintaining AWS Identity and Access Management (IAM) resources is similar to keeping your garden healthy over time. Having visibility into your IAM resources, especially the resources that are no longer used, is important to keep your AWS environment secure. Proactively detecting and responding to unused IAM roles helps you prevent unauthorized entities from gaining access to your AWS resources. In this post, I will show you how to apply resource tags on IAM roles and deploy serverless technologies on AWS to detect unused IAM roles and to require the owner of the IAM role (identified through tags) to take action.

You can use this solution to check for unused IAM roles in a standalone AWS account. As you grow your workloads in the cloud, you can run this solution for multiple AWS accounts by using AWS Organizations. In this solution, you use AWS Control Tower to create an AWS Organizations organization with a Security organizational unit (OU), and a Security account in this OU. In this blog post, you deploy the solution in the Security account belonging to a Security OU of an organization.

For more information and recommended best practices, see the blog post Managing the multi-account environment using AWS Organizations and AWS Control Tower. Following this best practice, you can create a Security OU, in which you provision one or more Security and Audit accounts that are dedicated for security automation and audit activities on behalf of the entire organization.

Solution architecture

The architecture diagram in Figure 1 demonstrates the solution workflow.

Figure 1: Solution workflow for standalone account or member account of an AWS Organization.

Figure 1: Solution workflow for standalone account or member account of an AWS Organization.

The solution is triggered periodically by an Amazon EventBridge scheduled rule and invokes a series of actions. You specify the frequency (in number of days) when you create the EventBridge rule. There are two options to run this solution, based on the needs of your organization.

Option 1: For a standalone account

Choose this option if you would like to check for unused IAM roles in a single AWS account. This AWS account might or might not belong to an organization or OU. In this blog post, I refer to this account as the standalone account.

Prerequisites

  1. You need an AWS account specifically for security automation. For this blog post, I refer to this account as the standalone Security account.
  2. You should deploy the solution to the standalone Security account, which has appropriate admin permission to audit other accounts and manage security automation.
  3. Because this solution uses AWS CloudFormation StackSets, you need to grant self-managed permissions to create stack sets in standalone accounts. Specifically, you need to establish a trust relationship between the standalone Security account and the standalone account by creating the AWSCloudFormationStackSetAdministrationRole IAM role in the standalone Security account, and the AWSCloudFormationStackSetExecutionRole IAM role in the standalone account.
  4. You need to have AWS Security Hub enabled in your standalone Security account, and you need to deploy the solution in the same AWS Region as your Security Hub dashboard.
  5. You need a tagging enforcement in place for IAM roles. This solution uses an IAM tag key Owner to identify the email address of the owner. The value of this tag key should be the email address associated with the owner of the IAM role. If the Owner tag isn’t available, the notification email is sent to the email address that you provided in the parameter ITSecurityEmail when you provisioned the CloudFormation stack.
  6. This solution uses Amazon Simple Email Service (Amazon SES) to send emails to the owner of the IAM roles. The destination address needs to be verified with Amazon SES. With Amazon SES, you can verify identity at the individual email address or at the domain level.

An EventBridge rule triggers the AWS Lambda function LambdaCheckIAMRole in the standalone Security account. The LambdaCheckIAMRolefunction assumes a role in the standalone account. This role is named after the Cloudformation stack name that you specify when you provision the solution. Then LambdaCheckIAMRole calls the IAM API action GetAccountAuthorizationDetails to get the list of IAM roles in the standalone account, and parses the data type RoleLastUsed to retrieve the date, time, and the Region in which the roles were last used. If the last time value is not available, the IAM role is skipped. Based on the CloudFormation parameter MaxDaysForLastUsed that you provide, LambdaCheckIAMRole determines if the last time used is greater than the MaxDaysForLastUsed value. LambdaCheckIAMRole also extracts tags associated with the IAM roles, and retrieves the email address of the IAM role owner from the value of the tag key Owner. If there is no Owner tag, then LambdaCheckIAMRole sends an email to a default email address provided by you from the CloudFormation parameter ITSecurityEmail.

Option 2: For all member accounts that belong to an organization or an OU

Choose this option if you want to check for unused IAM roles in every member account that belongs to an AWS Organizations organization or OU.

Prerequisites

  1. You need to have an AWS Organizations organization with a dedicated Security account that belongs to a Security OU. For this blog post, I refer to this account as the Security account.
  2. You should deploy the solution to the Security account that has appropriate admin permission to audit other accounts and to manage security automation.
  3. Because this solution uses CloudFormation StackSets to create stack sets in member accounts of the organization or OU that you specify, the Security account in the Security OU needs to be granted CloudFormation delegated admin permission to create AWS resources in this solution.
  4. You need Security Hub enabled in your Security account, and you need to deploy the solution in the same Region as your Security Hub dashboard.
  5. You need tagging enforcement in place for IAM roles. This solution uses the IAM tag key Owner to identify the owner email address. The value of this tag key should be the email address associated with the owner of the IAM role. If the Owner tag isn’t available, the notification email will be sent to the email address that you provided in the parameter ITSecurityEmail when you provisioned the CloudFormation stack.
  6. This solution uses Amazon SES to send emails to the owner of the IAM roles. The destination address needs to be verified with Amazon SES. With Amazon SES, you can verify identity at the individual email address or at the domain level.

An EventBridge rule triggers the Lambda function LambdaGetAccounts in the Security account to collect the account IDs of member accounts that belong to the organization or OU. LambdaGetAccounts sends those account IDs to an SNS topic. Each account ID invokes the Lambda function LambdaCheckIAMRole once.

Similar to the process for Option 1, LambdaCheckIAMRole in the Security account assumes a role in the member account(s) of the organization or OU, and checks the last time that IAM roles in the account were used.

In both options, if an IAM role is not currently used, the function LambdaCheckIAMRole generates a Security Hub finding, and performs BatchImportFindings for all findings to Security Hub in the Security account. At the same time, the Lambda function starts an AWS Step Functions state machine execution. Each execution is for an unused IAM role following this naming convention:
[target-account-id]-[unused IAM role name]-[time the execution created in Unix format]

You should avoid running this solution against special IAM roles, such as a break-glass role or a disaster recovery role. In the CloudFormation parameter RolePatternAllowedlist, you can provide a list of role name patterns to skip the check.

Use a Step Functions state machine to process approval

Figure 2 shows the state machine workflow for owner approval.

Figure 2: Owner approval state machine workflow

Figure 2: Owner approval state machine workflow

After the solution identifies an unused IAM role, it creates a Step Functions state machine execution. Figure 2 demonstrates the workflow of the execution. After the execution starts, the first Lambda task NotifyOwner (powered by the Lambda function NotifyOwnerFunction) sends an email to notify the IAM role owner. This is a callback task that pauses the execution until a taskToken is returned. The maximum pause for a callback task is 1 year. The execution waits until the owner responds with a decision to delete or keep the role, which is captured by a private API endpoint in Amazon API Gateway. You can configure a timeout to avoid waiting for callback task execution.

With a private API endpoint, you can build a REST API that is only accessible within your Amazon Virtual Private Cloud (Amazon VPC), or within your internal network connected to your VPC. Using a private API endpoint will prevent anyone from outside of your internal network from selecting this link and deleting the role. You can implement authentication and authorization with API Gateway to make sure that only the appropriate owner can delete a role.

If the owner denies role deletion, then the role remains intact until the next automation cycle runs, and the state machine execution stops immediately with a Fail status. If the owner approves role deletion, the next Lambda task Approve (powered by the function ApproveFunction) checks again if the role is not currently used. If the role isn’t in use, the Lambda task Approve attaches an IAM policy DenyAllCheckUnusedIAMRoleSolution to deny the role to perform any actions, and waits for 30 days. During this wait time, you can restore the IAM role by removing the IAM policy DenyAllCheckUnusedIAMRoleSolution from the role. The Step Functions state machine execution for this role is still in progress until the wait time expires.

After the wait time expires, the state machine execution invokes the Validate task. The Lambda function ValidateFunction checks again if the role is not in use after the amount of time calculated by adding MaxDaysForLastUsed and the preceding wait time. It also checks if the IAM policy DenyAllCheckUnusedIAMRoleSolution is attached to the role. If both of these conditions are true, the Lambda function follows a process to detach the IAM policies and delete the role permanently. The role can’t be recovered after deletion.

Note: To restore a role that has been marked for deletion, detach the DenyAll IAM policy from the role.

To deploy the solution using the AWS CLI

  1. Clone git repo from AWS Samples to get source code and CloudFormation templates.
    git clone https://github.com/aws-samples/aws-blog-automate-iam-role-deletion 
    cd /aws-blog-automate-iam-role-deletion

  2. Run the AWS CLI command below to upload CloudFormation templates and Lambda code to a S3 bucket in the Security Account. The S3 bucket needs to be in the same Region where you will deploy the solution.
    • To deploy the solution for a single account, use the following commands. Be sure to replace <YOUR_BUCKET_NAME> and <PATH_TO_UPLOAD_CODE> with your own values.
      #Deploy solution for a single target AWS Account
      aws cloudformation package \
      --template-file solution_scope_account.yml \
      --s3-bucket <YOUR_BUCKET_NAME> \
      --s3-prefix <PATH_TO_UPLOAD_CODE> \
      --output-template-file solution_scope_account.template

    • To deploy the solution for an organization or OU, use the following commands. Be sure to replace <YOUR_BUCKET_NAME> and <PATH_TO_UPLOAD_CODE> with your own values.
      #Deploy solution for an Organization/OU
      aws cloudformation package \
      --template-file solution_scope_organization.yml \
      --s3-bucket <YOUR_BUCKET_NAME> \
      --s3-prefix <PATH_TO_UPLOAD_CODE> \
      --output-template-file solution_scope_organization.template

  3. Validate the template generated by the CloudFormation package.
    • To validate the solution for a single account, use the following commands.
      #Deploy solution for a single target AWS Account
      aws cloudformation validate-template —template-body file://solution_scope_account.template

    • To validate the solution for an organization or OU, use the following commands.
      #Deploy solution for an Organization/OU
      aws cloudformation validate-template —template-body file://solution_scope_organization.template

  4. Deploy the solution in the same Region that you use for Security Hub. The stack takes 30 minutes to complete deployment.
    • To deploy the solution for a single account, use the following commands. Be sure to replace all of the placeholders with your own values.
      #Deploy solution for a single target AWS Account
      aws cloudformation deploy \
      --template-file solution_scope_account.template \
      --stack-name <UNIQUE_STACK_NAME> \
      --region <REGION> \
      --capabilities CAPABILITY_NAMED_IAM CAPABILITY_AUTO_EXPAND \
      --parameter-overrides AccountId='<STANDALONE ACCOUNT ID>' \
      Frequency=<DAYS> MaxDaysForLastUsed=<DAYS> \
      ITSecurityEmail='<YOUR IT TEAM EMAIL>' \
      RolePatternAllowedlist='<ALLOWED PATTERN>'

    • To deploy the solution for an organization, run the following commands to create CloudFormation stack in the Security Account of the organization.
      #Deploy solution for an Organization
      aws cloudformation deploy \
      --template-file solution_scope_organization.template \
      --stack-name <UNIQUE_STACK_NAME> \
      --region <REGION> \
      --capabilities CAPABILITY_NAMED_IAM CAPABILITY_AUTO_EXPAND \
      --parameter-overrides Scope=Organization \
      OrganizationId='<o-12345abcde>' \
      OrgRootId='<r-1234>'  \
      Frequency=<DAYS> MaxDaysForLastUsed=<DAYS> \
      ITSecurityEmail='<[email protected]>' \
      RolePatternAllowedlist='<ALLOWED PATTERN>'

    • To deploy the solution for an OU, run the following commands to create CloudFormation stack in the Security Account of the organization.
      #Deploy solution for an OU
      aws cloudformation deploy \
      --template-file solution_scope_organization.template \
      --stack-name <UNIQUE_STACK_NAME> \
      --region <REGION> \
      --capabilities CAPABILITY_NAMED_IAM CAPABILITY_AUTO_EXPAND \
      --parameter-overrides Scope=OrganizationalUnit \
      OrganizationId='<o-12345abcde>' \
      OrganizationalUnitId='<ou-1234-1234abcd>'  \
      Frequency=<DAYS> MaxDaysForLastUsed=<DAYS> \
      ITSecurityEmail=’<[email protected]>’ \
      RolePatternAllowedlist=’<ALLOWED PATTERN>

Test the solution

The solution is triggered by an EventBridge scheduled rule, so it doesn’t perform the checks immediately. To test the solution right away after the CloudFormation stacks are successfully created, follow these steps.

To manually trigger the automation for a single account

  1. Navigate to the AWS Lambda console and choose the function
    <CloudFormation stackname>-LambdaCheckIAMRole.
  2. Choose Test.
  3. Choose New event.
  4. For Name, enter a name for the event, and provide the current time in UTC Date Time format YYYY-MM-DDTHH:MM:SSZ. For example {“time”: “2022-01-22T04:36:52Z”}. The Lambda function uses this value to calculate how much time has passed since the last time that a role was used. Figure 5 shows an example of configuring a test event.
    Figure 5: Configure test event for standalone account

    Figure 5: Configure test event for standalone account

  5. Choose Test.

To manually trigger the automation for an organization or OU

  1. Choose the function
    [CloudFormation stackname]-LambdaGetAccounts.
  2. Choose Test.
  3. Choose New event.
  4. For Name, enter a name for the event. Leave the default values for the remaining fields.
  5. Choose Test.

Respond to unused IAM roles

After you’ve triggered the Lambda function, the automation runs the necessary checks. For each unused IAM role, it creates a Step Functions state machine execution.

To see the list of Step Functions state machine executions

  1. Navigate to the AWS Step Functions console.
  2. Choose state machine [CloudFormation stackname]OnwerApprovalStateMachine.
  3. Under the Executions tab, you will see the list of executions in running state following this naming convention: [target-account-id]-[unused IAM role name]-[time the execution created in Unix format]. Figure 6 shows an example list of executions.
    Figure 6: Each unused IAM role generates an execution in the Step Functions state machine

    Figure 6: Each unused IAM role generates an execution in the Step Functions state machine

Each execution sends out an email notification to the IAM role owner (if available through the Owner tag) or to the IT security email address that you provided in the CloudFormation stack parameter ITSecurityEmail. The email content is:

Subject: Please take action on this unused IAM Role
 
Hello!
 
This IAM Role arn:aws:iam::<AWS account>:role/<role name> is not in use for
more than 60 days.
 
Can you please delete the role by following this link: Approve link
 
Or keep this role by following this link: Deny Link

In the email, the Approve link and Deny link is the hyperlink to a private API endpoint with a parameter taskToken. If you try to access these links publicly, they won’t work. When you access the link, the taskToken is provided to the private API endpoint, which updates the Step Functions state machine.

To test the approval action using an API Gateway test

  1. Navigate to the AWS Step Functions console. Under State machines, choose the state machine that has the name [CloudFormation stackname]OwnerApprovalStateMachine
  2. On the Executions tab, there is a list of executions. Each execution represents a workflow for one IAM role, as shown in Figure 6. Choose the execution name that includes the IAM role name in the email that you received earlier.
  3. Scroll down to Execution event history.
  4. Expand the Step Notify Owner, enter TaskScheduled, find the item taskToken, and copy its value to a notepad, as shown in Figure 7.
    Figure 7: Retrieve taskToken from execution

    Figure 7: Retrieve taskToken from execution

  5. Navigate to the API Gateway console.
  6. Choose the API that has a name similar to [CloudFormation stackname]-PrivateAPIGW-[unique string]-ApprovalEndpoint.
  7. Choose which action to test: Deny or Approve.
    • To test the Deny action, under /deny resource, choose the GET method.
    • To test the Approve action, under /approve resource, choose the GET method.
  8. Choose Test.
  9. Under Query Strings, enter taskToken= and paste the taskToken you copied earlier from the state machine execution. Figure 8 shows how to pass the taskToken to API Gateway.
    Figure 8: Provide taskToken to API Gateway Method

    Figure 8: Provide taskToken to API Gateway Method

  10. Choose Test. After you test, the state machine resumes the workflow and finishes the automation. You won’t be able to change the action.
  11. Navigate to the AWS Step Functions console. Choose the state machine and go to the state machine execution.
    1. If you choose to deny the role deletion, the execution immediately stops as Fail.
    2. If you choose to approve the role deletion, the execution moves to the Wait task. This task removes IAM policies associated to the role and waits for a period of time before moving to the next task. By default, the wait time is 30 days. To change this number, go to the Lambda function [CloudFormation stackname]ApproveFunction, and update the variable wait_time_stamp.
    3. After the waiting period expires, the state machine triggers the Validate task to do a final validation on the role before deleting it. If the Validate task decides that the role is being used, it leaves the role intact. Otherwise, it deletes the role permanently.

Conclusion

In this blog post, you learned how serverless services such as Lambda, Step Functions, and API Gateway can work together to build security automation. We recommend testing this solution as a starting point. Then, you can build more features on top of the sample code and templates to customize it to perform checks, following guidance from your IT security team.

Here are a few suggestions that you can take to extend this solution.

  • This solution uses a private API Gateway to handle the approval response from the IAM role owner. You need to establish private connectivity between your internal network and AWS to invoke a private API Gateway. For instructions, see How to invoke a private API.
  • Add a mechanism to control access to API Gateway by using endpoint policies for interface VPC endpoints.
  • Archive the Security Hub finding after the IAM role is deleted using the AWS CLI or AWS Console.
  • Use a Step Functions state machine for other automation that needs human approval.
  • Add the capability to report on IAM roles that were skipped due to the absence of RoleLastUsed information.

 
If you have feedback about this post, submit comments in the Comments section below. If you have questions about this post, contact AWS Support.

Want more AWS Security news? Follow us on Twitter.

Hong Pham

Hong Pham

Hong is a Senior Solutions Architect at AWS. For more than five years, she has helped many customers from start-ups to enterprises in different industries to adopt Cloud Computing. She was born in Vietnam and currently lives in Seattle, Washington.

Announcing the latest AWS Heroes – August 2022

Post Syndicated from Ross Barich original https://aws.amazon.com/blogs/aws/announcing-the-latest-aws-heroes-august-2022/

The global AWS community is filled with passionate builders, eager to learn and explore ways to build better and faster on AWS. Within the AWS community, a select few individuals truly go above and beyond to share their knowledge and inspire others through content creation, event organization, open source contributions, and more. These community leaders are called AWS Heroes, and today we are thrilled to recognize the latest cohort:

Alexey Grigorev – Berlin, Germany

Machine Learning Hero Alexey Grigorev works as a principal data scientist at OLX and he runs DataTalks.Club, a community of 20,000+ data enthusiasts. He has written a few books about machine learning. One of them is Machine Learning Bookcamp, a book for software engineers who want to get into machine learning. A big fan of serverless and AWS Lambda, Alexey likes teaching how to use Lambda and other AWS services for Machine Learning model deployment. He lives in Berlin with his wife and son.

Allen Helton – McKinney, USA

Serverless Hero Allen Helton is a Cloud Architect at Tyler Technologies with a sharp focus on serverless-first development. He has been working in tech since 2012, after graduating with a B.S. in Software Engineering from the University of Texas at Dallas. Allen writes extensively about serverless on his blog Ready, Set, Cloud, where he shares everything from reference architectures to enterprise level production readiness tips. He also regularly engages on serverless topics on Twitter.

Liz Fong-Jones – Vancouver, Canada / Sydney, Australia

Community Hero Liz Fong-Jones is a developer advocate, labor and ethics organizer, and Site Reliability Engineer (SRE) with 17+ years of experience. She is an advocate at Honeycomb for the SRE and Observability communities. She led implementation of Service-Level Objectives and adoption of Graviton2/Graviton3 at Honeycomb, and co-authored Observability Engineering. She has served on the OpenTelemetry governance committee and on the SREcon steering committee. She lives in Vancouver, BC with her wife Elly, partners, and a Samoyed/Golden Retriever mix, and in Sydney, NSW. She plays classical piano, leads an EVE Online alliance, and advocates for transgender rights.

Scott Hsieh – New Taipei City, Taiwan

Data Hero Scott Hsieh, also known as Shu-Jeng Hsieh, is a Data Architect at 104 Corporation. He has been sharing content on dev.to and Medium for nearly 2 years and has spoken at 6 events including AWS Summit Taiwan, re:Invent re:Cap, and DevAx::Alliance, mostly on data topics. He became an AWS Community Builder in the end of 2020 and achieved 10 AWS certifications within 1.5 years. Additionally, Scott has created 5 CDK constructs for 5 programming languages which in total are approaching 100K downloads. He is active in the AWS User Group Taiwan Facebook group, and enjoys helping people to grasp AWS services with ease and learning from experts across different fields.


If you’d like to learn more about the new Heroes, or connect with a Hero near you, please visit the AWS Heroes website or browse the AWS Heroes Content Library.

Ross

Deep dives & how the Internet works

Post Syndicated from João Tomé original https://blog.cloudflare.com/deep-dives-how-the-internet-works/

Deep dives & how the Internet works

Deep dives & how the Internet works

When August comes, for many, at least in the Northern Hemisphere, it’s time to enjoy summer and/or vacations. Here are some deep dive reading suggestions from our Cloudflare Blog for any time, weather or time of the year. There’s also some reading material on how the Internet works, and a glimpse into our history.

To create the list (that goes beyond 2022), initially we asked inside the company for favorite blog posts. Many explained how a particular blog post made them want to work at Cloudflare (including some of those who have been at the company for many years). And then, we also heard from readers by asking the question on our Twitter account: “What’s your favorite blog post from the Cloudflare Blog and why?”

In early July (thinking of the July 4 US holiday) we did a sum up where some of the more recent blog posts were referenced. We’ve added a few to that list:

  • Eliminating CAPTCHAs on iPhones and Macs (✍️)
    How it works using open standards. On this topic, you can also read the detailed blog post from our research team, from 2021: Humanity wastes about 500 years per day on CAPTCHAs. It’s time to end this madness.
  • Optimizing TCP for high WAN throughput while preserving low latency (✍️)
    If you like networks, this is an in depth look of how we tune TCP parameters for low latency and high throughput.
  • Live-patching the Linux kernel (✍️)
    A detail focused blog focused on using eBPF. Code, Makefiles and more within.
  • Early Hints in the real world (✍️)  
    In depth data about it where we show how much faster the web is with it (in a Cloudflare, Google, and Shopify partnership).
  • Internet Explorer, we hardly knew ye (✍️)
    A look at the demise of Internet Explorer and the rise of the Edge browser (after Microsoft announced the end-of-life for IE).
  • When the window is not fully open, your TCP stack is doing more than you think (✍️)
    A recent deep dive shows how Linux manages TCP receive buffers and windows, and how to tune the TCP connection for the best speed. Similar blogs are: How to stop running out of ephemeral ports and start to love long-lived connections; Everything you ever wanted to know about UDP sockets but were afraid to ask.
  • How Ramadan shows up in Internet trends (✍️)
    What happens to the Internet traffic in countries where many observe Ramadan? Depending on the country, there are clear shifts and changing patterns in Internet use, particularly before dawn and after sunset. This is all coming from our Radar platform. We can see many human trends, from a relevant outage in a country (here’s the list of Q2 2022 disruptions), to events like elections, the Eurovision, the ‘Jubilee’ celebration or the James Webb Telescope pictures revelation.

2022, research focused

  • Hertzbleed attack (✍️)  
    A deep explainer where we compare a runner in a long distance race with how CPU frequency scaling leads to a nasty side channel affecting cryptographic algorithms. Don’t be confused with the older and impactful Heartbleed.
  • Future-proofing SaltStack (✍️)  
    A chronicle of our path of making the SaltStack system quantum-secure. In an extra post-quantum blog post, we highlight how we are preparing the Internet and our infrastructure for the arrival of quantum computers.
  • Unlocking QUIC’s proxying potential with MASQUE (✍️)
    A deep dive into QUIC transport protocol and a good up to date way to know more about it (related: HTTP usage trends).
  • HPKE: Standardizing public-key encryption (finally!) (✍️)  
    Two research groups have finally published the next reusable, and future-proof generation of (hybrid) public-key encryption (PKE) for Internet protocols and applications: Hybrid Public Key Encryption (HPKE).
  • Sizing Up Post-Quantum Signatures (✍️)  
    This blog (followed by this deep dive one that includes quotes from Ancient Greece) was highlighted by a reader as “life changing”. It shows the peculiar relationship between PQC (post-quantum cryptography) signatures and TLS (Transport Layer Security) size and connection quality. It’s research about how quantum computers could unlock the next age of innovation, and will break the majority of the cryptography used to protect our web browsing (more on that below). But it is also about how to make a website really fast.

If you like Twitter threads, here is a recent one from our Head of Cloudflare Research, Nick Sullivan, that explains in simple terms the way privacy on the Internet works and challenges in protecting it now and for the future.

This month we also did a full reading list/guide with our blog posts about all sorts of attacks (from DDoS to phishing, malware or ransomware) and how to stay protected in 2022.

How does it (the Internet) work

  • Cloudflare’s view of the Rogers Communications outage in Canada (✍️ 2022)
    One of the largest ISPs in Canada, Rogers Communications, had a huge outage on July 8, 2022, that lasted for more than 17 hours. From our view of the Internet, we show why we concluded it seemed caused by an internal error and how the Internet, being a network of networks, all bound together by BGP, was related to the disruption.
  • Understanding how Facebook disappeared from the Internet (✍️ 2021).
    “Facebook can’t be down, can it?”, we thought, for a second, on October 4, 2021. It was, and we had a deep dive about it, where BGP was also ‘king’.

Albert Einstein’s special theory of relativity famously dictates that no known object can travel faster than the speed of light in vacuum, which is 299,792 km/s.

  • Welcome to Speed Week and a Waitless Internet (✍️ 2021).
    There’s no object, as far as we, humans, know, that is faster than the speed of light. In this blog post you’ll get a sense of the physical limits of Internet speeds (“the speed of light is really slow”). How it all works through electrons through wires, lasers blasting data down fiber optic cables, and how building a waitless Internet is hard.
    We go on to explain the factors that go into building our fast global network: bandwidth, latency, reliability, caching, cryptography, DNS, preloading, cold starts, and more; and how Cloudflare zeroes in on the most powerful number there is: zero. And here’s a challenge, there are a few movies, books, board game references hidden in the post for you to find.

“People ask me to predict the future, when all I want to do is prevent it. Better yet, build it. Predicting the future is much too easy, anyway. You look at the people around you, the street you stand on, the visible air you breathe, and predict more of the same. To hell with more. I want better.”
Ray Bradbury, from Beyond 1984: The People Machines

  • Securing the post-quantum world (✍️ 2020).
    This one is more about the future of the Internet. We have many post-quantum related posts, including the recent standardization one (‘NIST’s pleasant post-quantum surprise’), but here you have an easy-to-understand explanation of a complex but crucial for the future of the Internet topic. More on those challenges and opportunities in 2022 here.
    The sum up is: “Quantum computers are coming that will have the ability to break the cryptographic mechanisms we rely on to secure modern communications, but there is hope”. For a quantum computing starting point, check: The Quantum Menace.
  • SAD DNS Explained (✍️ 2020).
    A 2020 attack against the Domain Name System (DNS) called SAD DNS (Side channel AttackeD DNS) leveraged features of the networking stack in modern operating systems. It’s a good excuse to explain how the DNS protocol and spoofing work, and how the industry can prevent it — another post expands on improving DNS privacy with Oblivious DoH in 1.1.1.1.
  • Privacy needs to be built into the Internet (✍️ 2020)
    A bit of history is always interesting and of value (at least for me). To launch one of our Privacy Weeks, in 2020, here’s a general view to the three different phases of the Internet. Until the 1990s the race was for connectivity. With the introduction of SSL in 1994, the Internet moved to a second phase where security became paramount (it helped create the dotcom rush and the secure, online world we live in today). Now, it’s all about the Phase 3 of the Internet we’re helping to build: always on, always secure, always private.
  • 50 Years of The Internet. Work in Progress to a Better Internet (✍️ 2019)
    In 2019, we were celebrating 50 years from when the very first network packet took flight from the Los Angeles campus at UCLA to the Stanford Research Institute (SRI) building in Palo Alto. Those two California sites had kicked-off the world of packet networking, on the ARPANET, and of the modern Internet as we use and know it today. Here we go through some Internet history.
    This reminds me of this December 2021 conversation about how the Web began, 30 years earlier. Cloudflare CTO John Graham-Cumming meets Dr. Ben Segal, early Internet pioneer and CERN’s first official TCP/IP Coordinator, and Francois Fluckiger, director of the CERN School of Computing. Here, we learn how the World Wide Web became an open source project.
  • Welcome to Crypto Week (✍️ 2018).
    If you want to know why cryptography is so important for the Internet, here’s a good place to start. The Internet, with all of its marvels in connecting people and ideas, needs an upgrade, and one of the tools that can make things better is cryptography. There’s also a more mathematical privacy pass protocol related perspective (that is the basis of the work to eliminate CAPTCHAs).
  • Why TLS 1.3 isn’t in browsers yet (✍️ 2017).
    It’s all about: “Upgrading a security protocol in an ecosystem as complex as the Internet is difficult. You need to update clients and servers and make sure everything in between continues to work correctly. The Internet is in the middle of such an upgrade right now.” More on that from 2021 here: Handshake Encryption: Endgame (an ECH update).
  • How to build your own public key infrastructure (✍️ 2015).
    A way of getting to know how a major part of securing a network as geographically diverse as Cloudflare’s is protecting data as it travels between datacenters. “Great security architecture requires a defense system with multiple layers of protection”. From the same year, here’s something about digital signatures being the bedrock of trust.
  • A (Relatively Easy To Understand) Primer on Elliptic Curve Cryptography (✍️ 2013).
    Also thinking of how the Internet will continue to work for years to come, here’s a very complex topic made simple about one of the most powerful but least understood types of cryptography in wide use.
  • Why Google Went Offline Today and a Bit about How the Internet Works (✍️ 2012).
    We had several similar blog posts over the years, but this 10-year old one from Tom Paseka set the tone on how we could give a good technical explanation for something that was impacting so many. Here ​​Internet routing, route leakages are discussed and it all ends on a relevant note: “Just another day in our ongoing efforts to #savetheweb.” Quoting from someone in the company for nine years: “This blog was the one that first got me interested in Cloudflare”.

Again, if you like Twitter threads, this recent Nick Sullivan one starts with an announcement (Cloudflare now allows experiments with post-quantum cryptography) and goes on explaining what some of the more relevant Internet acronyms mean. Example: TLS, or Transport Layer Security, it’s the ubiquitous encryption and authentication protocol that protects web requests online.

Blast from the past (some history)

A few also recently referenced blog posts from the past, some more technical than others.

  • Introducing DNS Resolver, 1.1.1.1 (not a joke) (✍️ 2018).
    The first consumer-focused service Cloudflare has ever released, our DNS resolver, 1.1.1.1 — a recursive DNS service — was launched on April 1, 2018, and this is the technical explanation. With this offering, we started fixing the foundation of the Internet by building a faster, more secure and privacy-centric public DNS resolver. And, just this month, we’ve added privacy proofed features (a geolocation accuracy “pizza test” included).
  • Cloudflare goes InterPlanetary – Introducing Cloudflare’s IPFS Gateway (✍️ 2018).
    We introduced Cloudflare’s IPFS Gateway, an easy way to access content from the InterPlanetary File System (IPFS). This served as the platform for many new, at the time, highly-reliable and security-enhanced web applications. It was the first product to be released as part of our Distributed Web Gateway project and is a different perspective from the traditional web.
    IPFS is a peer-to-peer file system composed of thousands of computers around the world, each of which stores files on behalf of the network. And, yes, it can be used as a method for a possible Mars (Moon, etc.) Internet in the future. About that, the same goes for code that will need to be running on Mars, something we mention about Workers here.
  • LavaRand in Production: The Nitty-Gritty Technical Details (✍️ 2017).
    Our lava lamps wall in the San Francisco office is much more than a wall of lava lamps (the YouTuber Tom Scott did a 2017 video about it) and in this blog we explain the in-depth look at the technical details (there’s a less technical one on how randomness in cryptography works).
  • Introducing Cloudflare Workers (✍️ 2017).
    There are several announcements each year, but this blog (associated with the explanation, Code Everywhere: Why We Built Cloudflare Workers) was referenced this week by some as one of those with a clear impact. It was when we started making Cloudflare’s network programmable. In 2018, Workers was available to everyone and, in 2019, we registered the trademark for The Network is the Computer®, to encompass how Cloudflare is using its network to pave the way for the future of the Internet.
  • What’s the story behind the names of CloudFlare’s name servers? (✍️ 2013)
    Another one referenced this week is the answer to the question we got often back in 2013: what the names of our nameservers mean. Here’s the story — there’s even an Apple co-founder Steve Wozniak tribute.

Visualize Amazon S3 data using Amazon Athena and Amazon Managed Grafana

Post Syndicated from Pedro Sola Pimentel original https://aws.amazon.com/blogs/big-data/visualize-amazon-s3-data-using-amazon-athena-and-amazon-managed-grafana/

Grafana is a popular open-source analytics platform that you can employ to create, explore, and share your data through flexible dashboards. Its use cases include application and IoT device monitoring, and visualization of operational and business data, among others. You can create your dashboard with your own datasets or publicly available datasets related to your industry.

In November 2021, the AWS team together with Grafana Labs announced the Amazon Athena data source plugin for Grafana. The feature allows you to visualize information on a Grafana dashboard using data stored in Amazon Simple Storage Service (Amazon S3) buckets, with help from Amazon Athena, a serverless interactive query service. In addition, you can provision Grafana dashboards using Amazon Managed Grafana, a fully managed service for open-source Grafana and Enterprise Grafana.

In this post, we show how you can create and configure a dashboard in Amazon Managed Grafana that queries data stored on Amazon S3 using Athena.

Solution overview

The following diagram is the architecture of the solution.

Architecture diagram

The solution is comprised of a Grafana dashboard, created in Amazon Managed Grafana, populated with data queried using Athena. Athena runs queries against data stored in Amazon S3 using standard SQL. Athena integrates with the AWS Glue Data Catalog, a metadata store for data in Amazon S3, which includes information such as the table schema.

To implement this solution, you complete the following high-level steps:

  1. Create and configure an Athena workgroup.
  2. Configure the dataset in Athena.
  3. Create and configure a Grafana workspace.
  4. Create a Grafana dashboard.

Create and configure an Athena workgroup

By default, the AWS Identity and Access Management (IAM) role used by Amazon Managed Grafana has the AmazonGrafanaAthenaAccess IAM policy attached. This policy gives the Grafana workspace access to query all Athena databases and tables. More importantly, it gives the service access to read data written to S3 buckets with the prefix grafana-athena-query-results-. In order for Grafana to be able to read the Athena query results, you have two options:

In this post, we go with the first option. To do that, complete the following steps:

  1. Create an S3 bucket named grafana-athena-query-results-<name>. Replace <name> with a unique name of your choice.
  2. On the Athena console, choose Workgroups in the navigation pane.
  3. Choose Create workgroup.
  4. Under Workgroup name, enter a unique name of your choice.
  5. For Query result configuration, choose Browse S3.
  6. Select the bucket you created and choose Choose.
  7. For Tags, choose Add new tag.
  8. Add a tag with the key GrafanaDataSource and the value true.
  9. Choose Create workgroup.

It’s important that you add the tag described in steps 7–8. If the tag isn’t present, the workgroup won’t be accessible by Amazon Managed Grafana.

For more information about the Athena query results location, refer to Working with query results, recent queries, and output files.

Configure the dataset in Athena

For this post, we use the NOAA Global Historical Climatology Network Daily (GHCN-D) dataset, from the National Oceanic and Atmospheric Administration (NOAA) agency. The dataset is available in the Registry of Open Data on AWS, a registry that exists to help people discover and share datasets.

The GHCN-D dataset contains meteorological elements such as daily maximum and minimum temperatures. It’s a composite of climate records from numerous locations—some locations contain more than 175 years recorded.

The GHCN-D data is in CSV format and is stored in a public S3 bucket (s3://noaa-ghcn-pds/). You access the data through Athena. To start using Athena, you need to create a database:

  1. On the Athena console, choose Query editor in the navigation pane.
  2. Choose the workgroup, created in the previous step, on the top right menu.
  3. To create a database named mydatabase, enter the following statement:
CREATE DATABASE mydatabase
  1. Choose Run.
  2. From the Database list on the left, choose mydatabase to make it your current database.

Now that you have a database, you can create a table in the AWS Glue Data Catalog to start querying the GHCN-D dataset.

  1. In the Athena query editor, run the following query:
CREATE EXTERNAL TABLE `noaa_ghcn_pds`(
  `id` string, 
  `year_date` string, 
  `element` string, 
  `data_value` string, 
  `m_flag` string, 
  `q_flag` string, 
  `s_flag` string, 
  `obs_time` string
)
ROW FORMAT SERDE 
  'org.apache.hadoop.hive.serde2.OpenCSVSerde' 
WITH SERDEPROPERTIES ('separatorChar'=',')
STORED AS INPUTFORMAT 'org.apache.hadoop.mapred.TextInputFormat' 
OUTPUTFORMAT 'org.apache.hadoop.hive.ql.io.HiveIgnoreKeyTextOutputFormat'
LOCATION 's3://noaa-ghcn-pds/csv/'
TBLPROPERTIES ('classification'='csv')

After that, the table noaa_ghcn_pds should appear under the list of tables for your database. In the preceding statement, we define columns based on the GHCN-D data structure. For a full description of the variables and data structure, refer to the dataset’s readme file.

With the database and the table configured, you can start running SQL queries against the entire dataset. For the purpose of this post, you create a second table containing a subset of the data: the maximum temperatures of one weather station located in Retiro Park (or simply El Retiro), one of the largest parks of the city of Madrid, Spain. The identification of the station is SP000003195 and the element of interest is TMAX.

  1. Run the following statement on the Athena console to create the second table:
CREATE TABLE madrid_tmax WITH (format = 'PARQUET') AS
SELECT CAST(data_value AS real) / 10 AS t_max,
  CAST(
    SUBSTR(year_date, 1, 4) || '-' || SUBSTR(year_date, 5, 2) || '-' || SUBSTR(year_date, 7, 2) AS date
  ) AS iso_date
FROM "noaa_ghcn_pds"
WHERE id = 'SP000003195'
  AND element = 'TMAX'

After that, the table madrid_tmax should appear under the list of tables for your database. Note that in the preceding statement, the temperature value is divided by 10. That’s because temperatures are originally recorded in tenths of Celsius degrees. We also adjust the date format. Both adjustments make the consumption of the data easier.

Unlike the noaa_ghcn_pds table, the madrid_tmax table isn’t linked with the original dataset. That means its data won’t reflect updates made to the GHCN-D dataset. Instead, it holds a snapshot of the moment of its creation. That may not be ideal in certain scenarios, but is acceptable here.

Create and configure a Grafana workspace

The next step is to provision and configure a Grafana workspace and assign a user to the workspace.

Create your workspace

In this post, we use the AWS Single Sign-On (AWS SSO) option to set up the users. You can skip this step if you already have a Grafana workspace.

  1. On the Amazon Managed Grafana console, choose Create Workspace.
  2. Give your workspace a name, and optionally a description.
  3. Choose Next.
  4. Select AWS IAM Identity Center (successor to AWS SSO).
  5. For Permission type, choose Service Managed and choose Next.
  6. For Account access, select Current account.
  7. For Data sources, select Amazon Athena and choose Next.
  8. Review the details and choose Create workspace.

This starts the creation of the Grafana workspace.

Create a user and assign it to the workspace

The last step of the configuration is to create a user to access the Grafana dashboard. Complete the following steps:

  1. Create a user for your AWS SSO identity store if you don’t have one already.
  2. On the Amazon Managed Grafana console, choose All workspaces in the navigation pane.
  3. Choose your Grafana workspace to open the workspace details.
  4. On the Authentication tab, choose Assign new user or group.
  5. Select the user you created and choose Assign users and groups.
  6. Change the user type by selecting the user and on the Action menu, choose Make admin.

Create a Grafana dashboard

Now that you have Athena and Amazon Managed Grafana configured, create a Grafana dashboard with data fetched from Amazon S3 using Athena. Complete the following steps:

  1. On the Amazon Managed Grafana console, choose All workspaces in the navigation pane.
  2. Choose the Grafana workspace URL link.
  3. Log in with the user you assigned in the previous step.
  4. In the navigation pane, choose the lower AWS icon (there are two) and then choose Athena on the AWS services tab.
  5. Choose the Region, database, and workgroup used previously, then choose Add 1 data source.
  6. Under Provisioned data sources, choose Go to settings on the newly created data source.
  7. Select Default and then choose Save & test.
  8. In the navigation pane, hover over the plus sign and then choose Dashboard to create a new dashboard.
  9. Choose Add a new panel.
  10. In the query pane, enter the following query:
select iso_date as time, t_max from madrid_tmax where $__dateFilter(iso_date) order by iso_date
  1. Choose Apply.
  2. Change the time range on the top right corner.

For example, if you change to Last 2 years, you should see something similar to the following screenshot.

Temperature visualization

Now that you’re able to populate your Grafana dashboard with data fetched from Amazon S3 using Athena, you can experiment with different visualizations and configurations. Grafana provides lots of options, and you can adjust your dashboard to your preferences, as shown in the following example screenshot of daily maximum temperatures.

Temperature visualization - colorful

As you can see in this visualization, Madrid can get really hot on the summer!

For more information on how to customize Grafana visualizations, refer to Visualization panels.

Clean up

If you followed the instructions in this post in your own AWS account, don’t forget to clean up the created resources to avoid further charges.

Conclusion

In this post, you learned how to use Amazon Managed Grafana in conjunction with Athena to query data stored in an S3 bucket. As an example, we used a subset of the GHCN-D dataset, available in the Registry of Open Data on AWS.

Check out Amazon Managed Grafana and start creating other dashboards using your own data or other publicly available datasets stored in Amazon S3.


About the authors

Pedro Pimentel is a Prototyping Architect working on the AWS Cloud Engineering and Prototyping team, based in Brazil. He works with AWS customers to innovate using new technologies and services. In his spare time, Pedro enjoys traveling and cycling.

Rafael Werneck is a Senior Prototyping Architect at AWS Cloud Engineering and Prototyping, based in Brazil. Previously, he worked as a Software Development Engineer on Amazon.com.br and Amazon RDS Performance Insights.

New Powered by QuickSight program helps AWS partners embed interactive analytics in applications to enable data-driven experiences

Post Syndicated from Rich Russell original https://aws.amazon.com/blogs/big-data/new-powered-by-quicksight-program-helps-aws-partners-embed-interactive-analytics-in-applications-to-enable-data-driven-experiences/

Applications today generate enormous amounts of data. This provides an incredible opportunity for independent software vendors (ISV) to deliver business intelligence (BI) offerings as a part of their application, providing visuals, dashboards, and self-service capabilities to customers. These insights are crucial for data-driven decision-making for end-users of these apps, especially if surfaced in the moments that matter and in formats that are easily understood.

Amazon QuickSight provides the keys for ISVs in the software as a service (SaaS) space to unlock the potential of your data by offering the technology to deliver out-of-the-box analytics, driving stickier experiences for customers that lead to higher revenues. To support our partners further, we are excited to announce the Powered by QuickSight program, which includes technical build, go-to-market (GTM), and sales support for ISVs to embed and monetize their data.

About the Powered by QuickSight program

Building upon the Powered by Amazon Redshift program announced in July 2022, the Powered by QuickSight program extends the available benefits and funding to partners using more of the AWS Data and Analytics stack to include Amazon’s BI offering QuickSight. ISVs can embed the powerful analytics and BI capabilities of QuickSight, such as visuals, dashboards, natural language querying, and authoring insights, into applications to enable data-driven experiences for millions of users, joining customers such as the NFL, 3M, Bolt, Tealium, and Extensiv, whose apps are powered by QuickSight.

The benefits available from the Powered by QuickSight program include:

  • Private strategy and development support – Connect with AWS industry experts in one-on-one sessions focused on a customized evaluation of revenue-generating offerings. Analyze your offering relevance by industry, location, and size.
  • Rapid proof of concept – Take advantage of QuickSight product managers, solution architects, specialists, and AWS Data Labs to develop a minimum viable product (MVP) for your selected use case. Where appropriate, AWS will lead a Data-Driven Everything (D2E) workshop to quickly identify proofs of concept for priority use cases.
  • Product technical assistance – Have access to product engineering, architecture, specialists, and support teams for integration, product development, best practices, roadmaps, and post-sales support.
  • Joint Powered by QuickSight launch package – Take advantage of joint PR, AWS website listing, and featured blog posts and social media. You also have access to a joint webinar deck, solution brief, case study, landing page, and social media banners.

Additional benefits:

  • Listed internally as a qualified partner to engage with field teams in respective regions
  • Annual planning session to identify AWS Marketplace solutions to be listed
  • Annual funding for AWS Partner Marketing funds to support development of lead generation or thought leadership highlighting your solution (incremental to existing Marketing Development Funds)

“AWS has been a natural home for builders, with the widest range of services available to support applications across use cases. We see an increasing trend of builders needing more powerful analytical capabilities within their applications,” says Tracy Daugherty, General Manager of Amazon QuickSight.

“With QuickSight, we have a powerful set of analytics capabilities that are easy to embed in applications. The Powered by QuickSight program combines these capabilities with training, enablement, and go-to-market support activities to help developers and ISVs provide differentiated data-driven experiences that scale to all of their users.”

ISVs that are registered with the AWS Partner Network (APN) and interested in joining the program can complete the registration form for an exploratory session to deep dive into their data monetization strategy.

To get started, register now. Once registered, a member of the AWS team will contact you with next steps.

About QuickSight

With QuickSight, ISVs can easily embed interactive visuals and dashboards, natural language querying (NLQ), or the complete BI-authoring experience seamlessly in your applications, enabling end-users to gain insights right when and where they matter. Additionally, QuickSight capabilities such as custom branded email reports and advanced machine learning (ML) capabilities (such as forecasting and anomaly detection) enable you to differentiate your applications and enhance your end-user experience, without the heavy lifting involved in building such capabilities from scratch.

Application users can now dive deep into data insights without leaving their application, with interactive dashboards that offer drill-down, interactive filtering, and export options. Embedded visuals and dashboards are refreshed automatically when the data is updated, with options of direct query to data sources such as (but not limited to) Amazon Redshift or Snowflake, or fast performance with the QuickSight SPICE in-memory data store. You can now quickly bring value to your applications by using the Powered by QuickSight program, creating data-driven experiences for users, and using joint GTM channels to grow their business.

The following screenshots are just a few examples of the interactive dashboards you can create with QuickSight.

Success stories from ISV partners in the program

ISV partners in the Powered by QuickSight program have the following to say.

Extensiv

“Amazon QuickSight enabled us to delight our customers by replacing a non-interactive native dashboard with an engaging QuickSight embedded dashboard. We quickly scaled to 4,600 daily viewers with strong engagement and extremely positive feedback. Our user sentiment score went from 14% on the old dashboard to 83% on the QuickSight dashboard, over the same period,” says Brian Sevy, Senior Product Manager at Extensiv.

“Extensiv has seen great value in the technical support provided through the Powered by QuickSight program. We look forward to leveraging the GTM benefits offered in the Powered by QuickSight program as we as we continue to expand our solution offerings.”

Convoy

“Visibility and transparency are critical to solving modern supply chain challenges. Convoy collects over 1,000 data points on every shipment; however, the complexity of this data can be difficult to curate and present in a way that freight shippers can act on,” says Dorothy Li, CTO of Convoy.

“QuickSight allowed our team to build an interactive shipment and facility insights dashboard in weeks to visualize more than 40 key data points—all on demand and in real time. This has helped us strengthen our partnership with shippers by giving them visibility into opportunities that save both time and costs.”

Trakstar

“Companies struggle with trying to organize and visualize their HR data in meaningful ways. Trakstar equips HR leaders who now have a ‘seat at the table’ with board-ready reporting and expertly designed people analytics dashboards embedded directly into the product experience that help guide future business decisions. By partnering with AWS and leveraging QuickSight, we can focus on what HR leaders need next and trust QuickSight to deliver interactive, ML-driven visualizations with high performance at scale,” says Brian Kasen, Dir. Business Intelligence at Trakstar.

“Trakstar is excited to be Powered by QuickSight and empower business and HR leaders with state-of-the-art capabilities to make smarter decisions to attract, retain, and engage their workforce.”

ConexEd

“At ConexEd, we strive to make students successful by providing tools and accessibility to school staff. School administrators usually struggle to get meaningful data that help them make informed decisions to further support students. To close this gap, we had to invest more than half of our development team’s time to create initial reports and keep building on these as we launch new features instead of focusing on building critical features for the business,” says Michael Gorham, co-founder and CTO of ConexEd.

“Now with embedded dashboards powered by QuickSight, not only can ConexEd’s development team focus all its energies on creating competitive features, but also the reporting and data visualization are now features our customers can control and customize. QuickSight features such as drill-down filtering, predictive forecasting, and aggregation insights have given us the competitive edge that our customers expect from a modern, cloud-based solution.”

Syniti

“Embedding Amazon QuickSight dashboards into our applications was a no-brainer to meet our goal. With QuickSight, we are able to build data rich dashboards easily and embed these in our applications quickly. Different personas from the same enterprise get insights that matter to them, cutting out any noise,” says Tyler Warden, SVP of Product and Engineering at Syniti.

“Partnering with QuickSight has made it easy for us to bring rich insights to our enterprise customers and help us grow.”

Next steps

To learn more about the Powered by QuickSight program, visit QuickSight. If you’re interested in learning more about how your company can use QuickSight, you can meet us in person at a Powered by QuickSight roadshow at one of four locations: New York on September 7, Chicago on September 13, San Francisco on September 15 , and London on October 4.


About the authors

Rich Russell is the global Head for QuickSight GTM at Amazon Web Services (AWS) and senior global sales and partner leader with extensive experience in establishing and building revenue generating Go-To-Market (GTM) strategies through sales, strategic partnerships, ISVs and global alliance programs. Specializing in helping companies drive growth through leveraging sales and partners while focusing on what’s most important, the customer. Rich resides in Utah, with his wife and 5 boys where they love to spend time in the great outdoors.

Kareem Syed-Mohammed is a Product Manager at Amazon QuickSight. He focuses on embedded analytics, APIs, and developer experience. Prior to QuickSight he has been with AWS Marketplace and Amazon retail as a PM. Kareem started his career as a developer and then PM for call center technologies, Local Expert and Ads for Expedia. He worked as a consultant with McKinsey and Company for a short while.

New — Fine-Grained Visual Embedding Powered by Amazon QuickSight

Post Syndicated from Donnie Prakoso original https://aws.amazon.com/blogs/aws/new-fine-grained-visual-embedding-powered-by-amazon-quicksight/

Today, we are announcing a new feature, Fine-Grained Visual Embedding Powered by Amazon QuickSight. With this feature, individual visualizations from Amazon QuickSight dashboards can now be embedded in high-traffic webpages and applications. Additionally, this feature enables you to provide rich insights for your end-users where they need them the most, without server or software setup or infrastructure management.

This is a quick preview of this new feature:

Quick Preview of Fine-Grained Visual Embedding Powered by Amazon QuickSight

Quick Preview: Fine-Grained Visual Embedding Powered by Amazon QuickSight

New Feature: Fine-Grained Visual Embedding

Amazon QuickSight is a cloud-based embeddable and ML-powered business intelligence (BI) service that delivers interactive data visualizations, analysis, and reporting to enable data-driven decision-making within the organization and with the end user, without servers to manage.

Amazon QuickSight supports embedded analytics, a feature that enables you to incorporate branded analytics into internal portals or public sites. Customers can easily embed interactive dashboards, natural language querying (NLQ), or the complete BI-authoring experience seamlessly in their applications. This provides convenience for your end users to simplify the process of data-informed decisions.

Our customers want to be able to embed visuals from various dashboards into their applications and websites in order to bring forth deeply integrated data-driven experiences to enhance end user experiences. Previously, customers needed to build, scale, and maintain generation layer and charting libraries to embed individual visualizations.

With Fine-Grained Visual Embedding Powered by Amazon QuickSight, developers and ISVs now have the ability to embed any visuals from dashboards into their applications using APIs. As for enterprises, they can embed visuals into their internal sites using 1-Click Embedding. For end-users, Fine-Grained Visual Embedding provides a seamless and integrated experience to access a variety of key data visuals to get insights.

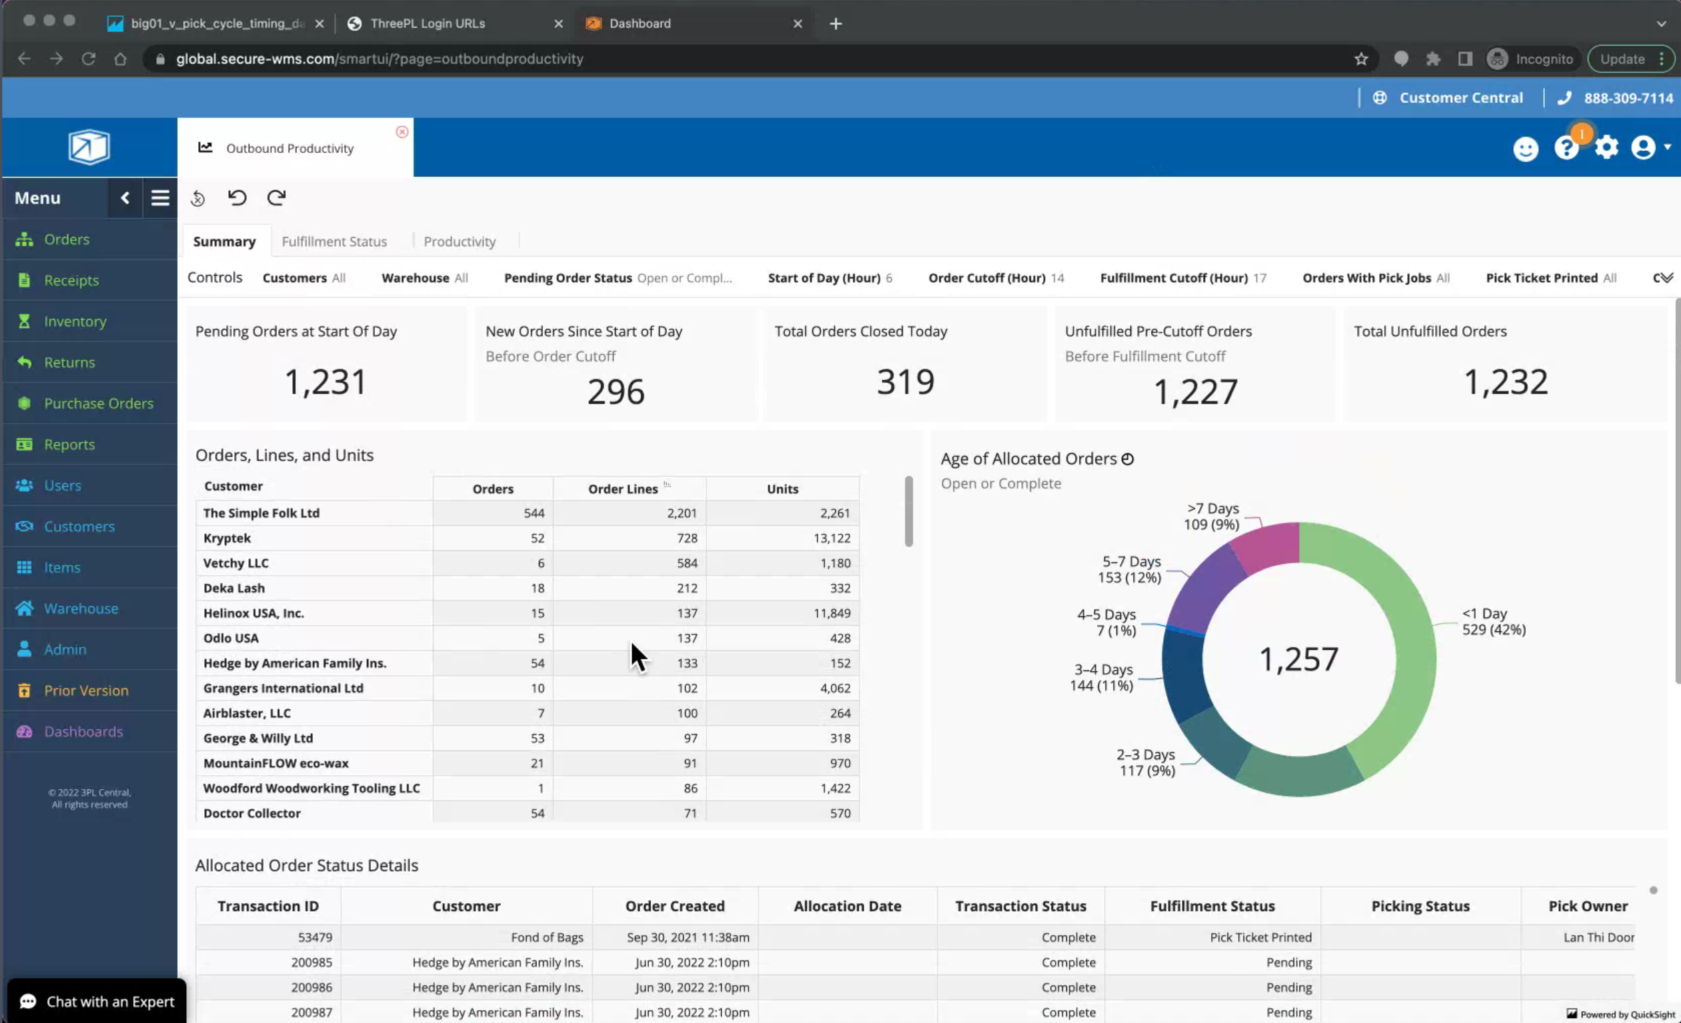
Here’s an example view where we can embed a visual using this feature in a sample web application page:

Sample Web App with a Visual

Sample Web App with a Visual

The embedded visuals are automatically updated when the source data changes or when the visual is updated. Embedded visuals scale automatically without the need to manage servers from your end and are optimized for high performance on high-traffic pages.

Get Started with Fine-Grained Visual Embedding

There are two ways to use Fine-Grained Visual Embedding, with 1-Click Embedding or using QuickSight APIs to generate the embed URL. The 1-Click Embedding feature makes it easy for nontechnical users to generate embed code that can be inserted directly into internal portals or public sites. Using APIs, ISVs and developers can embed rich visuals in their applications. Furthermore, with row-level security, data access is secured enabling users to access only their data.

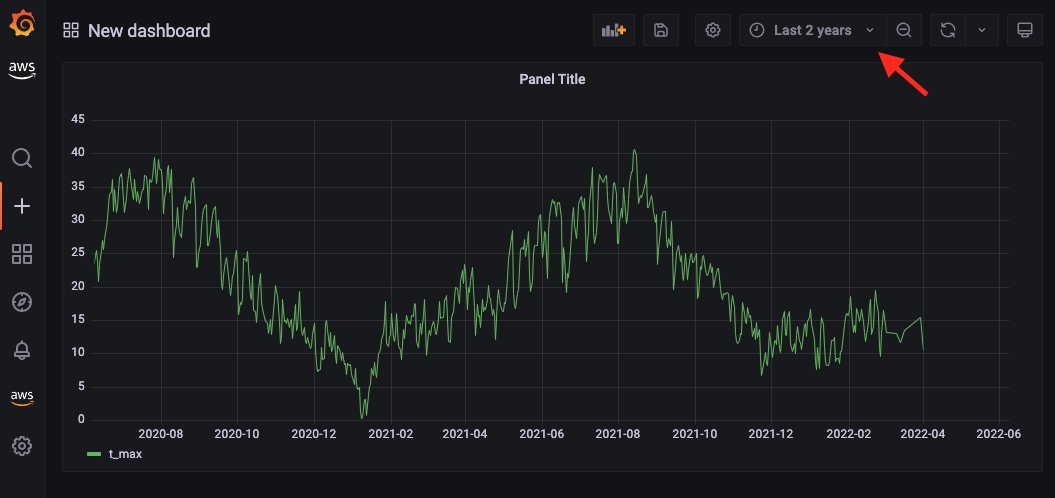
To start using this feature, let’s turn to the Amazon QuickSight dashboard. Here, I already have a dashboard using a dataset that you can follow from the Create an Amazon QuickSight dashboard using sample data documentation.

Amazon QuickSight Dashboard Using Sample Data

Amazon QuickSight Dashboard Using Sample Data

Using 1-Click Embedding to Generate Embed Code

Amazon QuickSight supports 1-Click Embedding—a feature that allows you to get the embed code without any development efforts. There are two types of 1-Click Embedding: 1) 1-Click Enterprise Embedding and 2) 1-Click Public Embedding. With enterprise embedding, it allows you to enable access to the dashboard with registered users in your account. In public embedding, you can enable access to the dashboards for anyone.

To get the embed code via 1-Click Embedding, you can select the visual you want to embed, then select Menu Options and choose Embed visual.

Select "Embed visual" from Menu Options

Select Embed visual from Menu Options

Once you select Embed visual, you will get a new menu on the right side, which contains the details of the visual you selected.

Copy "Embed code"

Copy the Embed code

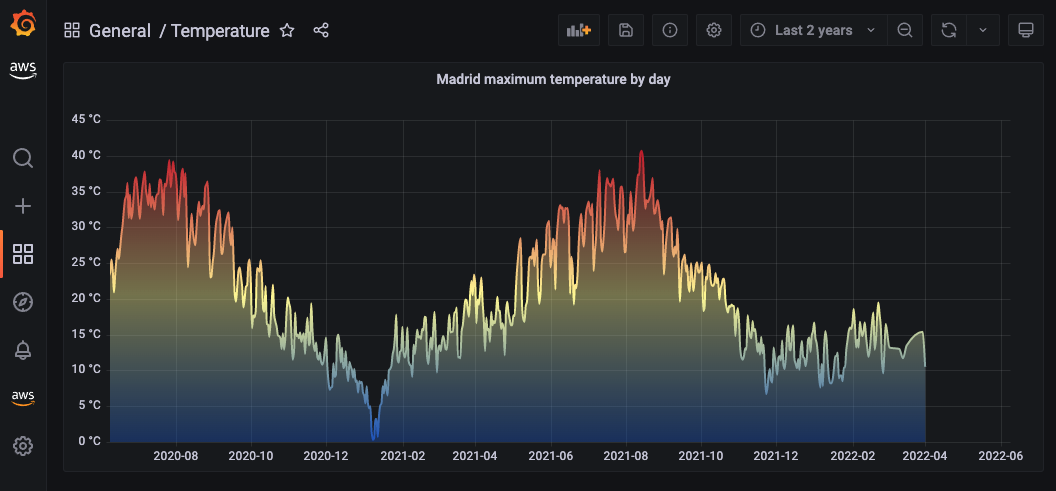
The Embed code section contains iframe code that you can insert into your application, portal, or website. Domains hosting these embedded visuals must be on an allow list, which you can learn more about on the Allow listing static domains page. This is a sample display of how the embed code is rendered:

Sample Display of Fine-Grained Visual Embedding Powered by Amazon QuickSight

Sample Display of Fine-Grained Visual Embedding Powered by Amazon QuickSight

When there is a change in the visual source within Amazon QuickSight, it will also be reflected within the web app or app where you embed your visuals. In addition, embedded visuals from QuickSight will automatically scale as traffic on the website grows.

From a customer’s perspective, 1-Click Embedding will help customers provide key data visuals from various dashboards in Amazon QuickSight for end users anywhere on their websites without requiring technical skills.

Programmatically Generate Embed URL

In addition to the 1-Click Embedding, you can also perform visual embedding through the API. To perform visual embedding through the API, you can use AWS CLI or SDK to call the API GenerateEmbedUrlForAnonymousUser or GenerateEmbedUrlForRegisteredUser.

You can use the GenerateEmbedUrlForAnonymousUser API to embed visuals in your applications for your users without provisioning them in Amazon QuickSight.

You can also use GenerateEmbedUrlForRegisteredUser API to embed visuals in your application for your users that are provisioned in Amazon QuickSight.

The API works by passing the ExperienceConfiguration parameter in DashboardVisual with the properties below:

{
    'DashboardId':'<DASHBOARD_ID>',  
    'SheetId':'<SHEET_ID>',  
    'VisualId':'<VISUAL_ID>'  
}

Then, to get the IDs for DashboardSheet, and Visual, you can find the value of these properties under IDs for Developers menu section for the visual you selected.

IDs for Developers

IDs for Developers

Using CLI to Generate Embed URL

After collecting all the required IDs, we can pass them as parameters. Here’s an example API command to generate an embed URL:

aws quicksight generate-embed-url-for-anonymous-user \  
    --aws-account-id <ACCOUNT_ID> \  
    --session-lifetime-in-minutes 15 \          
    --authorized-resource-arns “<DASHBOARD_ARN>”           
    --namespace default           
    --experience-configuration '{"DashboardVisual": \
        {
            "InitialDashboardVisualId": \
            {  
                    "DashboardId”:”<DASHBOARD_ID>”,  \
                    "SheetId”:”<SHEET_ID>”,  \
                    "VisualId”:”<VISUAL_ID”  \
            }  
        }}'  

If the request is successful, you will get the following response. You can then use the EmbedUrl property within your web or application.

{  
    "Status": 200,  
    "EmbedUrl": “<EMBED_URL>”,  
    "RequestId": “<REQUEST_ID>”,  
    "AnonymousUserArn": “<ARN>”  
}

Using SDK to Generate Embed URL

In addition to the AWS CLI, generating embed URLs can also be done using the AWS SDK. Here’s an example in Python:

response = client.generate_embed_url_for_anonymous_user(  
    AwsAccountId='123456789012',  
    SessionLifetimeInMinutes=15,  
    Namespace='default',  
    AuthorizedResourceArns=[  
        '<DASHBOARD_ARN>',  
    ],  
    ExperienceConfiguration={  
        'DashboardVisual': {  
            'InitialDashboardVisualId': {  
                'DashboardId':'<DASHBOARD_ID>',  
                'SheetId':'<SHEET_ID>',  
                'VisualId':'<VISUAL_ID>'  
            }  
        }  
    },  
    AllowedDomains=[  
        'https://YOUR-DOMAIN.com',  
    ]  
)  

With API, you have the flexibility to configure allowed domains at runtime. From the example above, you can pass your domains in AllowedDomains property.

When the request is successful, the API will return a successful response, along with a URL from Visual Embedding that can be inserted into external web apps. Example response as below:

{
    "Status": 200,  
    "EmbedUrl":"<EMBED_URL>",  
    "RequestId": "<REQUEST_ID>”
}  

Using the API approach gives developers the flexibility to programmatically generate embed URLs. Developers can specify the access for visuals for nonregistered and registered users in Amazon QuickSight.

Demo

To see Fine-Grained Visual Embedding Powered by Amazon QuickSight in action, have a look at this demo:

Pricing and Availability

You can use this new feature, Fine-Grained Visual Embedding in Amazon QuickSight Enterprise Edition, in all supported Regions. For more detailed information, please visit the documentation page.

Happy building,

— Donnie

[The Lost Bots] S02E03: Browser-in-Browser Attacks — Don’t Get (Cat)-Phished

Post Syndicated from Rapid7 original https://blog.rapid7.com/2022/08/25/the-lost-bots-s02e03-browser-in-browser-attacks-dont-get-cat-phished/

[The Lost Bots] S02E03: Browser-in-Browser Attacks — Don't Get (Cat)-Phished

Welcome back to The Lost Bots! In our latest episode, we’re talking about phishing attacks — but not your standard run-of-the-mill version. Instead, we’re focusing on a new technique known as browser-in-browser attacks, unpacking what it means and how it should factor into your organization’s security strategy.

Our hosts Jeffrey Gardner, Detection and Response Practice Advisor, and Stephen Davis, Lead D&R Sales Technical Advisor, highlight the telltale signs of browser-in-browser attacks you should look out for as you’re carrying out your day-to-day work and life on the internet. They also discuss how to set up user behavior analytics rules in your SIEM that will help you detect this type of threat, as well as how to make end-user training more effective.

Check back with us on Thursday, September 29, for the next Lost Bots installment!

Additional reading:

NEVER MISS A BLOG

Get the latest stories, expertise, and news about security today.

Announcing Backblaze B2 Object Lock for MSP360: Enhanced Ransomware Protection

Post Syndicated from Jennifer Newman original https://www.backblaze.com/blog/announcing-backblaze-b2-object-lock-for-msp360/

The potential threat of ransomware is something every modern business lives with. It’s a frightening prospect, but it’s a manageable risk with technology that’s readily available on many major platforms. Today, we’re adding one more tool to that list: we’re excited to announce that our long-time partners at MSP360 have now made Backblaze B2 Object Lock functionality available to customers that use B2 Cloud Storage as cloud tier for their backup data.

How Backblaze B2 Object Lock Works with MSP360 Data

Backups are the last line of defense against cyberattacks and accidental data loss. From ransomware attacks to hacking unattended devices, there are plenty of attack vectors available to cybercriminals, not to mention the very real risk of human error. But, when activated by an IT admin in MSP360 Managed Backup 6.0, Backblaze B2 Object Lock provides an additional layer of security to a business’ backups by blocking deletion or modification by anyone (including admins) during a user-defined retention period. Object Lock puts the data in an immutable state—it’s accessible and usable, but it can’t be changed or trashed. For anyone worried about attacks on their last line of defense, this is a huge relief. It’s also increasingly a requirement, as it’s becoming more common to request immutability as proof of compliance for many industries with strict standards.

“Our customers have clients operating in a range of IT environments. With whatever we do, we want to keep that in mind and ensure we provide our customers with options. Offering Backblaze B2 Object Lock to our customers provides them another tool in the fight against ransomware, arguably still cybersecurity’s biggest challenge.”—Brian Helwig, CEO, MSP360

How to Use Object Lock with MSP360 Today

If you’re already using Backblaze B2 as a cloud storage tier for MSP360 and you’re running the latest version, you can choose to enable Object Lock when you create a new bucket. If you’re interested in checking out the joint solution now that Object Lock is enabled, you can learn more here.

“MSP360 has been a long-time partner of Backblaze and continues to impress us with their commitment to delivering a well-rounded platform to customers. We’re very happy to extend Backblaze B2 Object Lock to MSP360’s customers to meet their security, disaster recovery, and cloud storage needs.”—Nilay Patel, Vice President, Sales & Partnerships, Backblaze

Want to Learn More About Object Lock?

Protecting data is one of our favorite things, so, appropriately, we’ve written about the value of Object Lock quite a bit. You can learn more about the basics in this general guide to Object Lock. If you’re interested in how this feature will integrate into your existing security policy, you can read about adding Object Lock to your IT security policy here.

And if you want to hear more from the experts on the subject, register for our webinar, Cybersecurity and the Public Cloud: Cloud Backup Best Practices on September 21. The webinar features John Hill, Cybersecurity Expert; Troy Liljedahl, Director of Solutions Engineering at Backblaze; and David Gugick, VP Product Management at MSP360, and you’ll learn about a few of the common security concerns facing you today as you back up data into the public cloud. If you can’t join us live, the webinar will be available on demand on the Backblaze BrightTALK channel.

We hope these guides can be useful for you, but drop a comment if there’s anything else we can cover.

The post Announcing Backblaze B2 Object Lock for MSP360: Enhanced Ransomware Protection appeared first on Backblaze Blog | Cloud Storage & Cloud Backup.

How to set up and track SLAs for resolving Security Hub findings

Post Syndicated from Maisie Fernandes original https://aws.amazon.com/blogs/security/how-to-set-up-and-track-slas-for-resolving-security-hub-findings/

Your organization can use AWS Security Hub to gain a comprehensive view of your security and compliance posture across your Amazon Web Services (AWS) environment. Security Hub receives security findings from AWS security services and supported third-party products and centralizes them, providing a single view for identifying and analyzing security issues. Security Hub correlates findings and breaks them down into five severity categories: INFORMATIONAL, LOW, MEDIUM, HIGH, and CRITICAL. In this blog post, we provide step-by-step instructions for tracking Security Hub findings in each severity category against service-level agreements (SLAs) through visual dashboards.

SLAs are defined collaboratively by the Business, IT, and Security and Compliance teams within an organization. You can track Security Hub findings against your specific SLAs, and any findings that are in breach of an SLA can be escalated. You can also apply automation to alert the owners of the resources and remediate common security findings to improve your overall security posture.

Prerequisites

Security Hub uses service-linked AWS Config rules to perform security checks behind the scenes. To support these controls, you must enable AWS Config on all accounts, including the administrator and member accounts, in each AWS Region where Security Hub is enabled.

As a best practice, we recommend that you enable AWS Config and Security Hub across all of your accounts and Regions. For more information on how to do this, see Enabling and configuring AWS Config and Setting up Security Hub.

Solution overview

In this solution, you will learn two different ways to track your findings in Security Hub against the pre-defined SLA for each severity category.

Option 1: Use custom insights

Security Hub offers managed insights, which include a collection of related findings that identify a security issue that requires attention and intervention. You can view and take action on the insight findings. In addition to the managed insights, you can create custom insights to track issues and findings related to your resources in your environment.

Create a custom insight for SLA tracking

In this example, you set an SLA of 30 days for HIGH severity findings. This example will provide you with a view of the HIGH severity findings that were generated within the last 30 days and haven’t been resolved.

To create a custom insight to view HIGH severity findings from the last 30 days

  1. In the Security Hub console, in the left navigation pane, choose Insights.
  2. On the Insights page, choose Create insight, as shown in Figure 1.
    Figure 1: Create insight in the Security Hub console

    Figure 1: Create insight in the Security Hub console

  3. On the Create insight page, in the search box, leave the following default filters: Workflow status is NEW, Workflow status is NOTIFIED, and Record state is ACTIVE, as show in Figure 2.
  4. To select the required grouping attribute for the insight, choose the search box to display the filter options. In the search box, choose the following filters and settings:
    1. Choose the Group by filter, and select WorkflowStatus.
      Figure 2: Create insights using filters

      Figure 2: Create insights using filters

    2. Choose the Severity label filter and enter HIGH.
    3. Choose the Created at filter and enter 30 to indicate the number of days you want to set as your SLA.
  5. Choose Create insight again.
  6. For Insight name, enter a meaningful name (for this example, we entered UnresolvedHighSevFindings), and then choose Create insight again.

You can repeat the same steps for other finding severities – CRITICAL, MEDIUM, LOW, and INFORMATIONAL; you can change the number of days you specify for the Created at filter to meet your SLA requirements; or specify different workflow status settings. Note that the workflow status can have the following values:

  • NEW – The initial state of a finding before you review it.
  • NOTIFIED – Indicates that the resource owner has been notified about the security issue.
  • SUPPRESSED – Indicates that you have reviewed the finding and no action is required.
  • RESOLVED – Indicates that the finding has been reviewed and remediated.

Your custom insight will show the findings that meet the criteria you defined. For more information about creating custom insights, see Module 2: Custom Insights in the Security Hub Workshop.

Option 2: Build visualizations for Security Hub findings data by using Amazon QuickSight

We hear from our customers that your organizations are looking for a solution where you can quickly visualize the status of your Security Hub findings, to see which findings you need to take action on (NEW and NOTIFIED) and which you do not (SUPPRESSED and RESOLVED). You can achieve this by building a data analytics pipeline that uses Amazon EventBridge, Amazon Kinesis Data Firehose, Amazon Simple Storage Service (Amazon S3), Amazon Athena, and Amazon QuickSight. The data analytics pipeline enables you to detect, analyze, contain, and mitigate issues quickly.

This solution integrates Security Hub with EventBridge to set SLA rules to a specified period of your choice for each severity level. For example, you can set the SLA to 5 days for CRITICAL severity findings, 10 days for HIGH severity findings, 14 days for MEDIUM severity findings, 30 days for LOW severity findings, and 60 days for INFORMATIONAL severity findings.

Architecture overview

Figure 3 shows the architectural overview of the QuickSight solution workflow.

Figure 3: Architecture diagram for option 2, the QuickSight solution

Figure 3: Architecture diagram for option 2, the QuickSight solution

In the QuickSight solution, Security Hub publishes the findings to EventBridge, and then an EventBridge rule (based on the SLA) is configured to deliver the findings to Kinesis Data Firehose. For example, if the SLA is 14 days for all MEDIUM severity findings, then those findings will be filtered by the rule and sent to Kinesis Data Firehose. Security Hub findings follow the AWS Security Finding Format (ASFF).

The following is a sample EventBridge rule that filters the Security Hub findings for MEDIUM severity and workflow status NEW, before publishing the findings to Kinesis Data Firehose, and then finally to Amazon S3 for storage. A workflow status of NEW and NOTIFIED should be included to catch all findings that require action.

{
  "source": ["aws.securityhub"],
  "detail-type": ["Security Hub Findings - Imported"],
  "detail": {
    "findings": {
      "Severity": {
        "Label": ["MEDIUM"]
      },
      "Workflow": {
        "Status": ["NEW"]
      }
    }
  }
}

After the findings are exported and stored in Amazon S3, you can use Athena to run queries on the data and you can use Amazon QuickSight to display the findings that violate your organization’s SLA. With Athena, you can create views of the original table as a logical table. You can also create a view for CRITICAL, HIGH, MEDIUM, LOW, and INFORMATIONAL severity findings.

For details about how to export findings and build a dashboard, see the blog post How to build a multi-Region AWS Security Hub analytic pipeline and visualize Security Hub data.

Visualize an SLA by using QuickSight

The QuickSight dashboard shown in Figure 4 is an example that shows all the MEDIUM severity findings that should be resolved within a 14 day SLA.

Figure 4: QuickSight table showing medium severity findings over a 14-day SLA

Figure 4: QuickSight table showing medium severity findings over a 14-day SLA

Using QuickSight, you can create different types of data visualizations to represent the exported Security Hub findings, which enables the decision makers in your organization to explore and interpret information in an interactive visual environment. For example, Figure 5 shows findings categorized by service.

Figure 5: QuickSight visual showing MEDIUM severity findings for each service

Figure 5: QuickSight visual showing MEDIUM severity findings for each service

As another example, Figure 6 shows findings categorized by severity.

Figure 6: QuickSight visual showing findings by severity

Figure 6: QuickSight visual showing findings by severity

For more information about visualizing Security Hub findings by using Amazon OpenSearch Service and Kibana, see the blog post Visualize Security Hub Findings using Analytics and Business Intelligence Tools.

Changing a finding’s severity

Over time, your organization might discover that there are certain findings that should be tracked at a lower or higher severity level than what is auto-generated from Security Hub. You can implement EventBridge rules with AWS Lambda functions to automatically update the severity of the findings as soon as they are generated.

To automate the finding severity change

  1. On the EventBridge console, create an EventBridge rule. For detailed instructions, see Getting started with Amazon EventBridge.
    Figure 7: Create an EventBridge rule in the console

    Figure 7: Create an EventBridge rule in the console

  2. Define the event pattern, including the finding generator ID or any other identifying fields for which you want to redefine the severity. Review the fields in the format, and choose your desired filters. The following is a sample of the event pattern.
    {
      "source": ["aws.securityhub"],
      "detail-type": ["Security Hub Findings - Imported"],
      "detail": {
        "findings": {
            "GeneratorId": [
            "aws-foundational-security-best-practices/v/1.0.0/S3.4"
                        ],
          "RecordState": ["ACTIVE"],
          "Workflow": {
            "Status": ["NEW"]
          }
        }
      }
    }

  3. Specify the target as a Lambda function that will host the code to update the finding severity.
    Figure 8: Select a target Lambda function

    Figure 8: Select a target Lambda function

  4. In the Lambda function, use the BatchUpdateFindings API action to update the severity label as desired.

    The following example Lambda code will update finding severity to INFORMATIONAL. This function requires Amazon CloudWatch write permissions, and requires permissions to invoke the Security Hub API action BarchUpdateFindings.

    import logging
    import json, boto3
    import botocore.exceptions as boto3exceptions
    
    logger = logging.getLogger()
    logger.setLevel(os.environ.get('LOGLEVEL', 'INFO').upper())
    
    def lambda_handler(event, context):
        
        finding_id = ""
        product_arn = ""
        
        logger.info(event)
        
        for finding in event['detail']['findings']:
            
            #determine and log this Finding's ID
            finding_id = finding["Id"]
            product_arn = finding["ProductArn"]
            logger.info("Finding ID: " + finding_id)
            
        
            #determine and log this Finding's resource type
            resource_type = finding["Resources"][0]["Type"]
            logger.info("Resource Type is: " + resource_type)
    
            try:
                sec_hub_client = boto3.client('securityhub')
                response = sec_hub_client.batch_update_findings(
                    FindingIdentifiers=[
                    {
                        'Id': finding_id,
                        'ProductArn': product_arn
                    }
                    ],
                        Severity={"Label": "INFORMATIONAL"}
        
                    )
    
            except boto3exceptions.ClientError as error:
                logger.exception(f"Client error invoking batch update findings {error}")
            except boto3exceptions.ParamValidationError as error:
                logger.exception(f"The parameters you provided are incorrect: {error}")
    
        return {"statusCode": 200}

  5. The finding is generated with a new severity level, as updated in the Lambda function. For example, Figure 9 shows a finding that is generated as MEDIUM by default, but the configured EventBridge rule and Lambda function update the severity level to INFORMATIONAL.
    Figure 9: Security Hub findings generated with updated severity level

    Figure 9: Security Hub findings generated with updated severity level

Conclusion

This blog post walked you through two different solutions for setting up and tracking the SLAs for the findings generated by Security Hub. Reporting Security Hub findings for a given SLA in a dashboard view can help you prioritize findings and track whether findings are being remediated on time. This post also provided example code that you can use to modify the Security Hub severity for a specific finding. To further extend the solution and enable custom actions to remediate the findings, see the following:

 
If you have feedback about this post, submit comments in the Comments section below. If you have questions about this post, contact AWS Support.

Want more AWS Security news? Follow us on Twitter.

Maisie Fernandes

Maisie Fernandes

Maisie is a Senior Solutions Architect at AWS based in London. She is focused on helping public sector customers design, build, and secure scalable applications on AWS. Outside of work, Maisie enjoys traveling, running, and gardening.

Krati Singh

Krati Singh

Krati is a Senior Solutions Architect at AWS based in San Francisco Bay Area. She collaborates with small and medium business customers on their cloud journey and is passionate about security in the cloud. Outside of work, Krati enjoys reading, and an occasional hike on a nice weather day.

[$] Ushering out strlcpy()

Post Syndicated from original https://lwn.net/Articles/905777/

With all of the complex problems that must be solved in the kernel, one
might think that copying a string would draw little attention. Even with
the hazards that C strings present, simply moving some bytes should not be
all that hard. But string-copy functions have been a frequent subject of
debate over the years, with different variants being in fashion at times.
Now it seems that the BSD-derived strlcpy() function
may finally be on its way out of the kernel.

Introducing Trilogy: a new database adapter for Ruby on Rails

Post Syndicated from Matthew Draper original https://github.blog/2022-08-25-introducing-trilogy-a-new-database-adapter-for-ruby-on-rails/

We’ve open sourced the database adapter we use at GitHub to connect Ruby on Rails and Active Record clients to MySQL-compatible database servers.

Trilogy is a client library for MySQL-compatible database servers, designed for performance, flexibility, and ease of embedding. We released Trilogy, with its Ruby-native wrapper, in December, and have now rounded out the set with the release of activerecord-trilogy-adapter, an Active Record adapter that allows a Ruby on Rails application to use Trilogy in place of the built-in mysql2-based adapter.

Why does Trilogy exist?

The Trilogy library is specifically designed to perform efficiently when embedded in environments like the Ruby VM, which benefits from special handling of blocking syscalls, and conscious use of dynamic memory allocation. It also aims to provide strong portability and compatibility, using a custom implementation of the network protocol to minimize dependencies needed for compilation.

After starting off on the original mysql gem, GitHub switched to mysql2 in 2011, gaining performance and reliability. But over the following years, we found it was still not quite meeting our needs. Trilogy was initially developed by Hailey Somerville and Brian Lopez to further improve GitHub’s performance and reliability, and has been backing all of our Rails monolith’s query activity since 2015. (The name is a pun: it’s the third adapter GitHub has used, and it’s used to query sequel.)

Open sourcing this adapter is the culmination of a long term effort, primarily championed first by Aaron Patterson and then by Eileen M. Uchitelle, to extract valuable database-communication behavior we’d collected and upstream it into other layers of Active Record—most recently, deferred connection verification and automatic reconnection.

Should you use Trilogy?

Compared to the mysql2 gem, Trilogy avoids a dependency on the libmariadb / libmysqlclient library, which can simplify gem installation and eliminate version mismatch issues, and minimizes the number of times data must be copied in memory when building and parsing network packets. It should simplify gem installation and be more efficient under heavy query loads.

Trilogy is thoroughly production-tested to work well for our applications, but there may be protocol features it doesn’t support (yet?) that other database configurations might require. For that reason, while we do encourage other Rails applications to try using Trilogy to interface with their MySQL-compatible database servers, it would be prudent to check things out in a staging environment first. Other than that, it should be a drop-in compatible change.

The Trilogy adapter is currently only compatible with the version of Rails that we use to run GitHub: the in-development main branch of rails/rails. After Active Record 7.1.0 is released, we will maintain a release that is compatible with the current supported release series.

Trilogy is a strong option when connecting to a MySQL-compatible database server, and we would love to hear from you if you give it a try.

Security updates for Thursday

Post Syndicated from original https://lwn.net/Articles/906055/

Security updates have been issued by Debian (firefox-esr, libxslt, and open-vm-tools), Fedora (dotnet6.0 and firefox), Oracle (curl, firefox, rsync, and thunderbird), Red Hat (curl, firefox, php:7.4, rsync, systemd, and thunderbird), SUSE (bluez, chromium, freerdp, glibc, gnutls, kernel, postgresql10, raptor, rubygem-rails-html-sanitizer, and spice), and Ubuntu (firefox, linux, linux-kvm, linux-lts-xenial, linux-aws, linux-azure-fde, open-vm-tools, and varnish).

Man-in-the-Middle Phishing Attack

Post Syndicated from Bruce Schneier original https://www.schneier.com/blog/archives/2022/08/man-in-the-middle-phishing-attack.html

Here’s a phishing campaign that uses a man-in-the-middle attack to defeat multi-factor authentication:

Microsoft observed a campaign that inserted an attacker-controlled proxy site between the account users and the work server they attempted to log into. When the user entered a password into the proxy site, the proxy site sent it to the real server and then relayed the real server’s response back to the user. Once the authentication was completed, the threat actor stole the session cookie the legitimate site sent, so the user doesn’t need to be reauthenticated at every new page visited. The campaign began with a phishing email with an HTML attachment leading to the proxy server.

Handy Tips #36: Collecting custom metrics with Zabbix agent user parameters

Post Syndicated from Arturs Lontons original https://blog.zabbix.com/handy-tips-36-collecting-custom-metrics-with-zabbix-agent-user-parameters/22850/

Define custom agent keys to collect custom metrics by executing scripts or commands with Zabbix user parameters.

Having a simple way to extend the metric collection functionality of a monitoring tool can be vital if we wish to monitor custom in-house software or simply collect metrics not available out of the box.

Collect custom metrics with Zabbix agent by defining user parameters:

  • Define an unlimited number of user parameters for your Zabbix agents
  • Parameters such as usernames and passwords can be passed to flexible user parameters

  • User parameters support Zabbix agent data collection in active and passive modes
  • User parameters can collect bulk data for further processing by dependent items

Check out the video to learn how to define user parameters for Zabbix agents.

Define user parameters for Zabbix agents:

  1. Test your custom command on the host on which you will create the user parameter
  2. Open the Zabbix agent configuration file in a text editor
  3. A simple user parameter can be defined by adding the line: UserParameter=key,command
  4. A flexible user parameter can be defined by adding the line: UserParameter=key[*],command
  5. For flexible user parameters, use $1…$9 positional references to reference your custom key parameters
  6. Save the changes
  7. Reload user parameters by using the command zabbix_agentd -R userparameter_reload
  8. Open the Zabbix frontend and navigate to ConfigurationHosts
  9. Find your host and click on the Items button next to the host
  10. Press the Create item button
  11. Give your item a name and select the item type – Zabbix agent or Zabbix agent (active)
  12. Provide the key that you defined as your user parameter key
  13. For flexible user parameters, provide the key parameters
  14. Press the Test button and then press Get value and test to test your user parameter
  15. Press the Add button to add the item

Tips and best practices
  • User parameter commands need to be executed within the Zabbix agent Timeout parameter value
  • User parameters can be reloaded by executing the zabbix_agentd -R userparameter_reload command
  • User parameters can be defined in the Zabbix agent configuration file, or the files specified by the Include parameter
  • By default, certain symbols are not permitted to be used in user parameters
  • The usage of restricted characters can be permitted by setting the value of UnsafeUserParameters parameter to 1

Learn how to leverage the many types of data collection provided by Zabbix and empower your data collection and processing. Sign up for our Zabbix Certified Specialist course, where under the guidance of a Zabbix certified trainer you will learn more about different types and technologies of monitoring and learn how to get the most out of your Zabbix instance.

The post Handy Tips #36: Collecting custom metrics with Zabbix agent user parameters appeared first on Zabbix Blog.

Speeding up incremental changes with AWS SAM Accelerate and nested stacks

Post Syndicated from Eric Johnson original https://aws.amazon.com/blogs/compute/speeding-up-incremental-changes-with-aws-sam-accelerate-and-nested-stacks/

This blog written by Jeff Marcinko, Sr. Technical Account Manager, Health Care & Life Sciencesand Brian Zambrano, Sr. Specialist Solutions Architect, Serverless.

Developers and operators have been using the AWS Serverless Application Model (AWS SAM) to author, build, test, and deploy serverless applications in AWS for over three years. Since its inception, the AWS SAM team has focused on developer productivity, simplicity, and best practices.

As good as AWS SAM is at making your serverless development experience easier and faster, building non-trivial cloud applications remains a challenge. Developers and operators want a development experience that provides high-fidelity and fast feedback on incremental changes. With serverless development, local emulation of an application composed of many AWS resources and managed services can be incomplete and inaccurate. We recommend developing serverless applications in the AWS Cloud against live AWS services to increase developer confidence. However, the latency of deploying an entire AWS CloudFormation stack for every code change is a challenge that developers face with this approach.

In this blog post, I show how to increase development velocity by using AWS SAM Accelerate with AWS CloudFormation nested stacks. Nested stacks are an application lifecycle management best practice at AWS. We recommend nested stacks for deploying complex serverless applications, which aligns to the Serverless Application Lens of the AWS Well-Architected Framework. AWS SAM Accelerate speeds up deployment from your local system by bypassing AWS CloudFormation to deploy code and resource updates when possible.

AWS CloudFormation nested stacks and AWS SAM

A nested stack is a CloudFormation resource that is part of another stack, referred to as the parent, or root stack.

Nested stack architecture

Nested stack architecture

The best practice for modeling complex applications is to author a root stack template and declare related resources in their own nested stack templates. This partitioning improves maintainability and encourages reuse of common template patterns. It is easier to reason about the configuration of the AWS resources in the example application because they are described in nested templates for each application component.

With AWS SAM, developers create nested stacks using the AWS::Serverless::Application resource type. The following example shows a snippet from a template.yaml file, which is the root stack for an AWS SAM application.

AWSTemplateFormatVersion: '2010-09-09'
Transform: AWS::Serverless-2016-10-31

Resources:
  DynamoDB:
    Type: AWS::Serverless::Application
    Properties:
      Location: db/template.yaml

  OrderWorkflow:
    Type: AWS::Serverless::Application
    Properties:
      Location: workflow/template.yaml

  ApiIntegrations:
    Type: AWS::Serverless::Application
    Properties:
      Location: api-integrations/template.yaml

  Api:
    Type: AWS::Serverless::Application
    Properties:
      Location: api/template.yaml

Each AWS::Serverless::Application resource type references a child stack, which is an independent AWS SAM template. The Location property tells AWS SAM where to find the stack definition.

Solution overview

The sample application exposes an API via Amazon API Gateway. One API endpoint (#2) forwards POST requests to Amazon SQS, an AWS Lambda function polls (#3) the SQS Queue and starts an Amazon Step Function workflow execution (#4) for each message.

Sample application architecture

Sample application architecture

Prerequisites

  1. AWS SAM CLI, version 1.53.0 or higher
  2. Python 3.9

Deploy the application

To deploy the application:

  1. Clone the repository:
    git clone <a href="https://github.com/aws-samples/sam-accelerate-nested-stacks-demo.git" target="_blank" rel="noopener">https://github.com/aws-samples/sam-accelerate-nested-stacks-demo.git</a>
  2. Change to the root directory of the project and run the following AWS SAM CLI commands:
    cd sam-accelerate-nested-stacks-demo
    sam build
    sam deploy --guided --capabilities CAPABILITY_IAM CAPABILITY_AUTO_EXPAND

    You must include the CAPABILITY_IAM and CAPABILITY_AUTO_EXPAND capabilities to support nested stacks and the creation of permissions.

  3. Use orders-app as the stack name during guided deployment. During the deploy process, enter your email for the SubscriptionEmail value. This requires confirmation later. Accept the defaults for the rest of the values.

    SAM deploy example

    SAM deploy example

  4. After the CloudFormation deployment completes, save the API endpoint URL from the outputs.

Confirming the notifications subscription

After the deployment finishes, you receive an Amazon SNS subscription confirmation email at the email address provided during the deployment. Choose the Confirm Subscription link to receive notifications.

You have chosen to subscribe to the topic: 
arn:aws:sns:us-east-1:123456789012:order-topic-xxxxxxxxxxxxxxxxxx

To confirm this subscription, click or visit the link below (If this was in error no action is necessary): 
Confirm subscription

Testing the orders application

To test the application, use the curl command to create a new Order request with the following JSON payload:

{
    "quantity": 1,
    "name": "Pizza",
    "restaurantId": "House of Pizza"
}
curl -s --header "Content-Type: application/json" \
  --request POST \
  --data '"quantity":1,"name":"Pizza","quantity":1,"restaurantId":"House of Pizza"}' \
  https://xxxxxxxxxx.execute-api.us-east-1.amazonaws.com/Dev/orders  | python -m json.tool

API Gateway responds with the following message, showing it successfully sent the request to the SQS queue:

API Gateway response

API Gateway response

The application sends an order notification once the Step Functions workflow completes processing. The workflow intentionally randomizes the SUCCESS or FAILURE status message.

Accelerating development with AWS SAM sync

AWS SAM Accelerate enhances the development experience. It automatically observes local code changes and synchronizes them to AWS without building and deploying every function in my project.

However, when you synchronize code changes directly into the AWS Cloud, it can introduce drift between your CloudFormation stacks and its deployed resources. For this reason, you should only use AWS SAM Accelerate to publish changes in a development stack.

In your terminal, change to the root directory of the project folder and run the sam sync command. This runs in the foreground while you make code changes:

cd sam-accelerate-nested-stacks-demo
sam sync --watch --stack-name orders-app

The –watch option causes AWS SAM to perform an initial CloudFormation deployment. After the deployment is complete, AWS SAM watches for local changes and synchronizes them to AWS. This feature allows you to make rapid iterative code changes and sync to the Cloud automatically in seconds.

Making a code change

In the editor, update the Subject argument in the send_order_notification function in workflow/src/complete_order/app.py.

def send_order_notification(message):
    topic_arn = TOPIC_ARN
    response = sns.publish(
        TopicArn=topic_arn,
        Message=json.dumps(message),
        Subject=f'Orders-App: Update for order {message["order_id"]}'
        #Subject='Orders-App: SAM Accelerate for the win!'
    )

On save, AWS SAM notices the local code change, and updates the CompleteOrder Lambda function. AWS SAM does not trigger updates to other AWS resources across the different stacks, since they are unchanged. This can result in increased development velocity.

SAM sync output

SAM sync output

Validate the change by sending a new order request and review the notification email subject.

curl -s --header "Content-Type: application/json" \
  --request POST \
  --data '"quantity":1,"name":"Pizza","quantity":1,"restaurantId":"House of Pizza"}' \
  https://xxxxxxxxxx.execute-api.us-east-1.amazonaws.com/Dev/orders  | python -m json.tool

In this example, AWS SAM Accelerate is 10–15 times faster than the CloudFormation deployment workflow (sam deploy) for single function code changes.

Deployment speed comparison between SAM accelerate and CloudFormation

Deployment speed comparison between SAM accelerate and CloudFormation

Deployment times vary based on the size and complexity of your Lambda functions and the number of resources in your project.

Making a configuration change

Next, make an infrastructure change to show how sync –watch handles configuration updates.

Update ReadCapacityUnits and WriteCapacityUnits in the DynamoDB table definition by changing the values from five to six in db/template.yaml.

Resources:
  OrderTable:
    Type: AWS::DynamoDB::Table
    Properties:
      TableName: order-table-test
      AttributeDefinitions:
        - AttributeName: user_id
          AttributeType: S
        - AttributeName: id
          AttributeType: S
      KeySchema:
        - AttributeName: user_id
          KeyType: HASH
        - AttributeName: id
          KeyType: RANGE
      ProvisionedThroughput:
        ReadCapacityUnits: 5
        WriteCapacityUnits: 5

The sam sync –watch command recognizes the configuration change requires a CloudFormation deployment to update the db nested stack. Nested stacks reflect an UPDATE_COMPLETE status because CloudFormation starts an update to every nested stack to determine if changes must be applied.

SAM sync infrastructure update

SAM sync infrastructure update

Cleaning up

Delete the nested stack resources to make sure that you don’t continue to incur charges. After stopping the sam sync –watch command, run the following command to delete your resources:

sam delete orders-app

You can also delete the CloudFormation root stack from the console by following these steps.

Conclusion

Local emulation of complex serverless applications, built with nested stacks, can be challenging. AWS SAM Accelerate helps builders achieve a high-fidelity development experience by rapidly synchronizing code changes into the AWS Cloud.

This post shows AWS SAM Accelerate features that push code changes in near real time to a development environment in the Cloud. I use a non-trivial sample application to show how developers can push code changes to a live environment in seconds while using CloudFormation nested stacks to achieve the isolation and maintenance benefits.

For more serverless learning resources, visit Serverless Land.

The collective thoughts of the interwebz