Tag Archives: Workers Observability

Your agent can now debug Workers with local tracing

Post Syndicated from Zin Khant original https://blog.cloudflare.com/local-tracing/

Starting today, wrangler dev and vite dev automatically capture OpenTelemetry traces for local Worker invocations. When Cloudflare's tooling detects an agent session, it points the agent to the Local Explorer API, a local debugging API where it can query those traces. You do not need to install an SDK, enable tracing, configure your agent, or even mention observability in the prompt.

A prompt can be as simple as:

This builds on years of investment in local development, from introducing Miniflare to making local mode the default in Wrangler 3. Local traces give coding agents structured feedback from that development environment before code is deployed.

Agents discover the Local Explorer API automatically

As part of its normal workflow, an agent starts wrangler dev or vite dev to run and test the Worker. When the development server recognizes a supported coding-agent session, it automatically prints a hint that looks like this:

The Local Explorer is a browser-based interface and REST API for viewing and editing local resource data and querying observability data during development. The API root serves an OpenAPI schema, so agents can discover available endpoints at runtime without hardcoded instructions.

The automatically captured traces are available through a read-only observability endpoint in that API, together with their correlated console logs. The agent can query this telemetry, then use the API's other operations to inspect local Workers and bindings or examine state in D1, KV, R2, Durable Objects, and Workflows. 

Find the failure and verify the fix

Consider POST /api/orders, which retrieves an active cart from KV, saves the checkout details into D1, and sends a message to a Queue for order processing. After a schema change, the endpoint suddenly starts returning a 500 status.

Without local traces 

The 500 does not identify which operation failed. The agent adds logs around KV, D1, and the Queue, reruns the request, inspects the output, and repeats. Each cycle takes time and burns tokens while the agent reconstructs the request from text.

With local traces 

The agent reproduces the error and queries the read-only observability endpoint. The trace shows that the KV read succeeded, the D1 insert failed with no such column: delivery_window, and the Queue was never called. Your agent uses the Local Explorer API to access the same trace data you would see here: 

The agent uses the API to inspect the D1 schema. It finds that the migration adding delivery_window exists in the repository but has not been applied locally, applies it, sends the request again, and queries the new trace. Issue resolved. 

In one local loop, the agent identifies the failed operation, fixes the local environment, and verifies the result without deploying or adding temporary logs.

Explore traces and logs in Local Explorer

Agents query local telemetry through the API, but you as a human can visualize the same data in the Local Explorer, the browser-based interface built into the local development server. Alongside browsing local binding state, you can select a request to inspect its spans, timing, attributes, errors, and correlated console logs. 

Local Explorer runs on the same localhost origin as your Worker, not in the Cloudflare dashboard. Press e in Wrangler or visit /cdn-cgi/explorer on the local server to open it.

How it works 

When we launched Workers Tracing, we built instrumentation directly into workerd, the open-source runtime that powers Workers. Without requiring an SDK or any code changes, the runtime captures spans for:

  • Fetch calls: All outbound HTTP requests, including timing, status codes, and request metadata.
  • Binding calls: Every interaction with KV, R2, D1, Durable Objects, Queues, and other bindings.
  • Handler calls: The full lifecycle of each invocation, from fetch to scheduled to queue handlers.

Any custom spans emitted by your application will also appear alongside these automatic spans. 

Wrangler and the Cloudflare Vite plugin use Miniflare to run your Worker locally in the same runtime, making this instrumentation available during local development.

Miniflare collects runtime events and console output, assembles them into OpenTelemetry traces and correlated logs, then writes the telemetry to an internal SQLite-backed Durable Object that serves as the local trace store. The Local Explorer API exposes that data through the local development server where agents can easily query traces and logs and inspect local state. 

Get started

Update Wrangler or the Cloudflare Vite plugin, whichever your project uses:

Then ask your agent to debug locally as you normally would. Your agent can already write and run your Worker locally — now it can see what happened, fix what failed, and verify the result before you deploy. Check out the docs to learn more!
Introducing Workers Observability: logs, metrics, and queries – all in one place

Post Syndicated from Rohin Lohe original https://blog.cloudflare.com/introducing-workers-observability-logs-metrics-and-queries-all-in-one-place/

We’re excited to announce Workers Observability – a new section in the Cloudflare Dashboard that allows you to query detailed log events across all Workers in your account to extract deeper insights.

In 2024, we set out to build the best first-party observability for any cloud platform. Since then, we’ve improved metrics reporting for all resources, launched Workers Logs to automatically ingest and store logs for Workers, and rebuilt real-time logs with improved filtering. However, observability insights have been limited to a single Worker.

Starting today, you can use Workers Observability to understand what is happening across all of your Workers:

  • Workers Metrics Dashboard (Beta): A single dashboard to view metrics and logs from all of your Workers 

  • Query Builder (Beta): Construct structured queries to explore your logs, extract metrics from logs, create graphical and tabular visualizations, and save queries for faster future investigations.

  • Workers Logs: Now Generally Available, with a public API and improved invocation-based grouping.

Building queries 

The Query Builder allows you to interact with your logs, and answer the “why” to any question you have. You can find it by navigating to Workers & Pages > Observability in the dashboard.

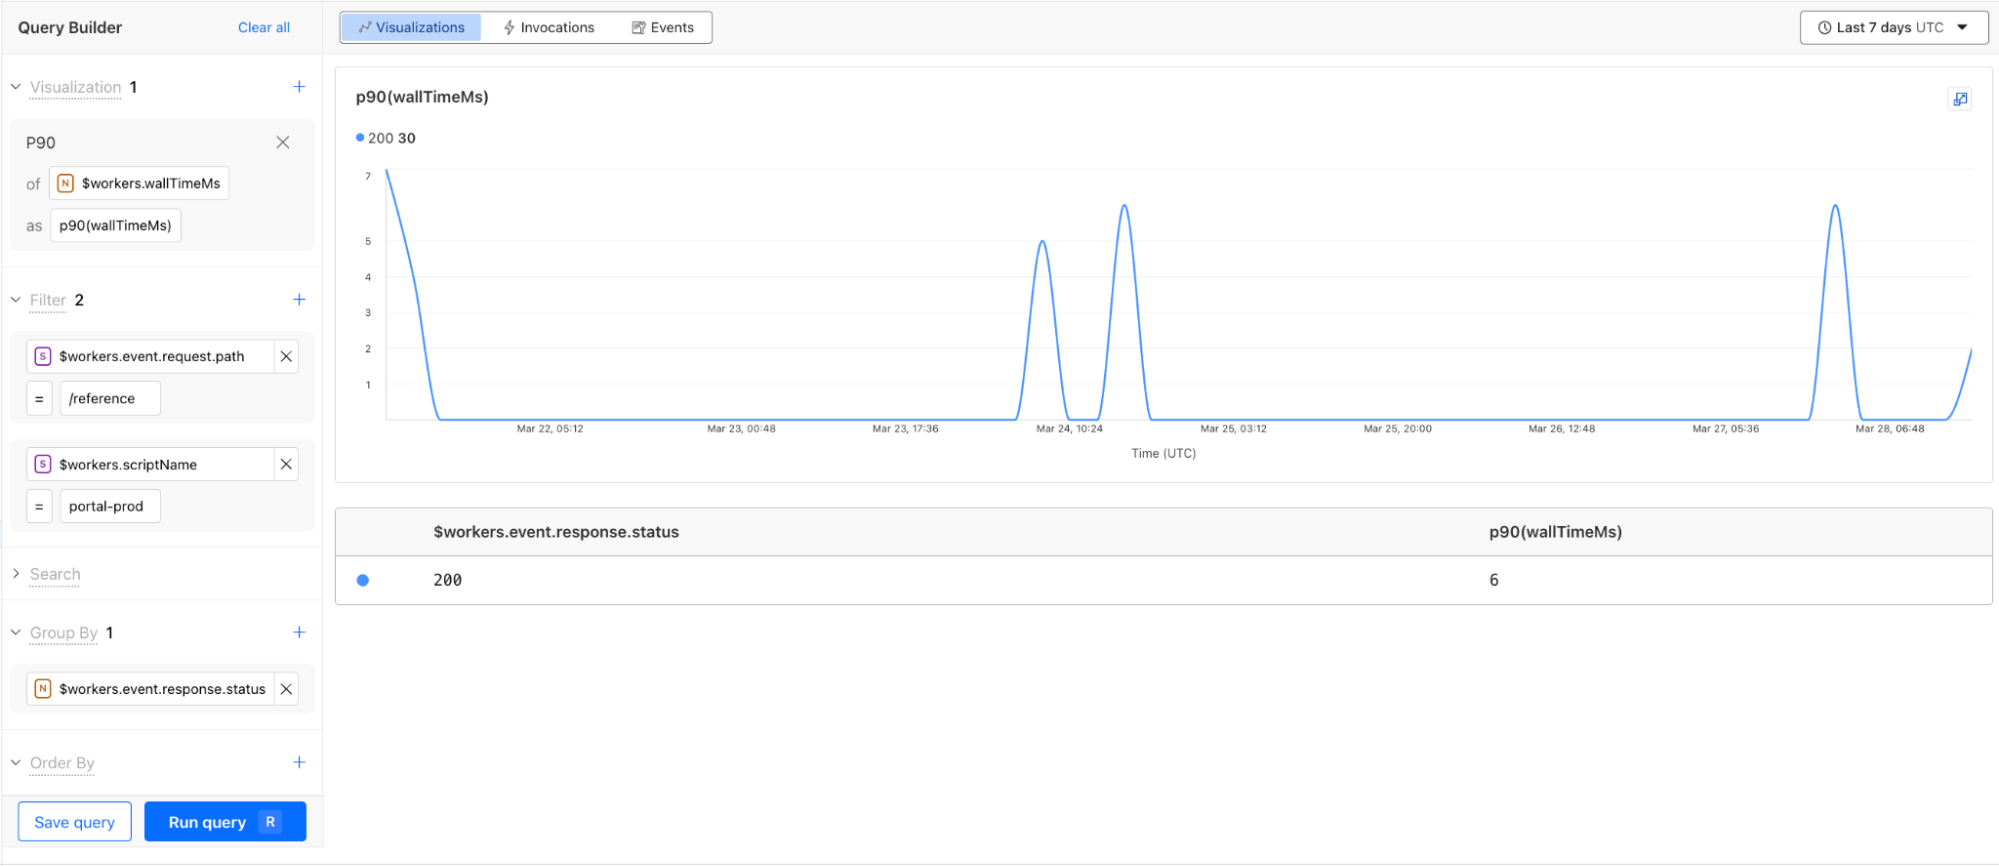
Using the Query Builder, you can now answer more questions than ever. For example, this query shows the p90 wall time for 200 OK responses from the /reference endpoint is 6 milliseconds.


The key components to structuring a query in the Query Builder are:

  • Visualizations: An aggregate function like average, count, percentile, or unique that performs a calculation on a group of values to return a single value. Each aggregate function returns a graph visualization and a summary table.

  • Filters: A condition that allows you to exclude data not matching the criteria.

  • Search: A condition that only returns the data matching the specified string.

  • Group by: A function to collapse a field into only its distinct values, allowing you to more granularly apply aggregate functions.

  • Order by: A sorting function to order the returned rows.

  • Limits: A cap on the number of returned rows, allowing you to focus on what is important.

The Query Builder relies on structured logs for efficient indexed queries and extracting metrics from logs. Workers Observability natively supports and encourages structured logs. Structured logs store context-rich metadata as key-value pairs in the form of distinct fields (high dimensionality), each with many potential unique values (high cardinality). Invocation Logs, which can be enabled in your Worker, contain deep insights from Cloudflare’s network, and are a great example of a structured log. By logging important metadata as a structured log, you empower yourself to answer questions about your system that you couldn’t predict when writing the code. 

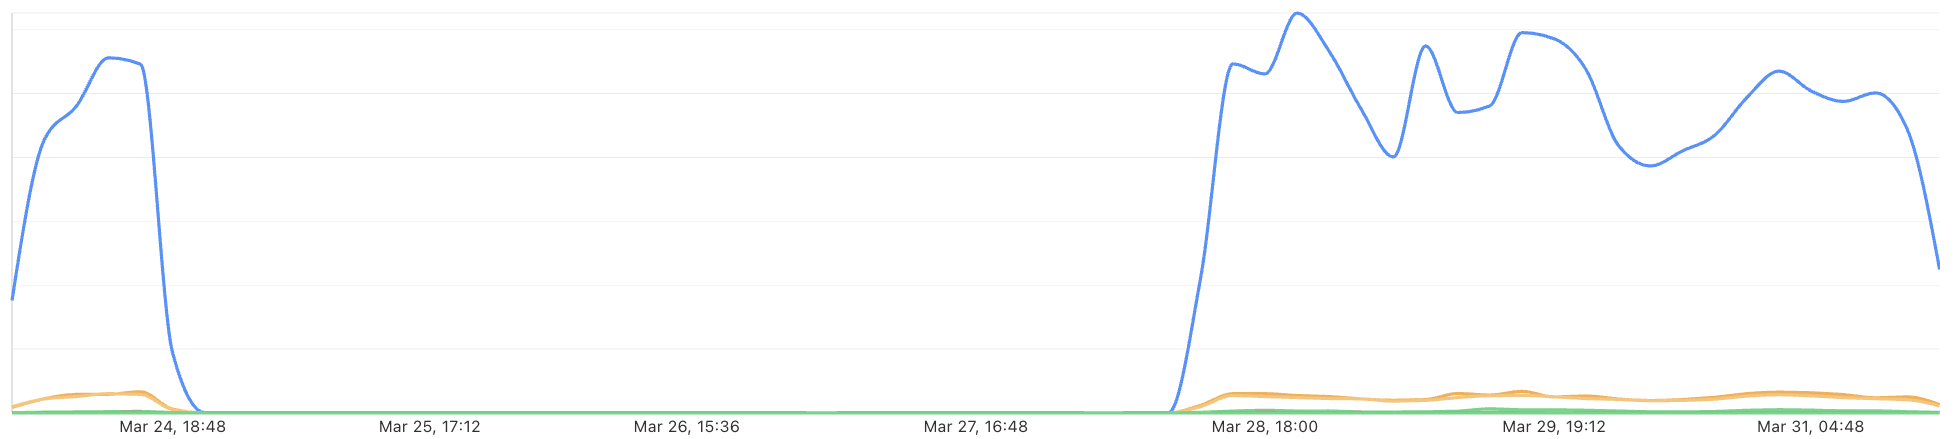
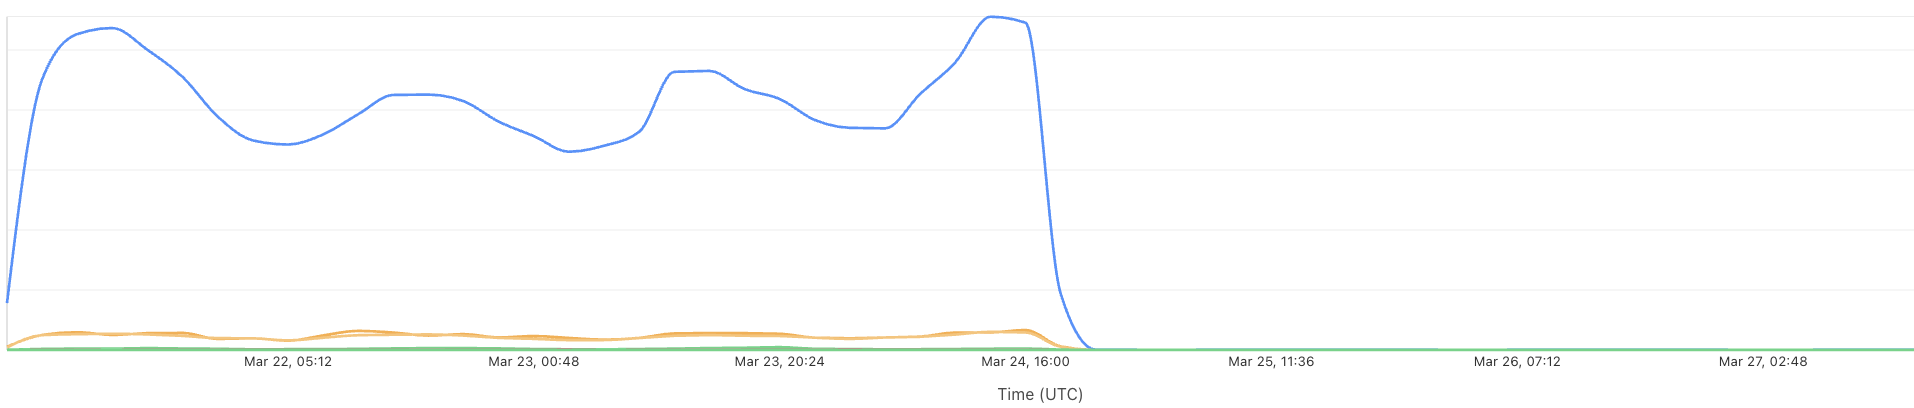
Internally at Cloudflare, we’ve already found tremendous value from this new product. During development, the Workers Observability team was able to use the Query Builder to discover a bug in the Workers Observability team’s staging environment. A query on the number of the events per script returned the following response:


After mapping this drop in recorded events against recent staging deployments, the team was able to isolate and root cause the introduction of the bug. Along with fixing the bug, the team also introduced new staging alerts to prevent errors like this from going unnoticed.


Queries built with the Query Builder or Workers Logs can be saved with a custom name and description. You can star your favorite queries, and also share them with your teammates using a shareable link, making it easier than ever to debug together and invest in developing visualizations from your telemetry data.

CPU time and wall time

You can now monitor CPU time and wall time for every Workers invocation across all of our observability offerings, including Tail Workers, Workers Logpush, and Workers Logs. These metrics help show how much time is spent executing code compared to the total elapsed time for the invocation, including I/O time.

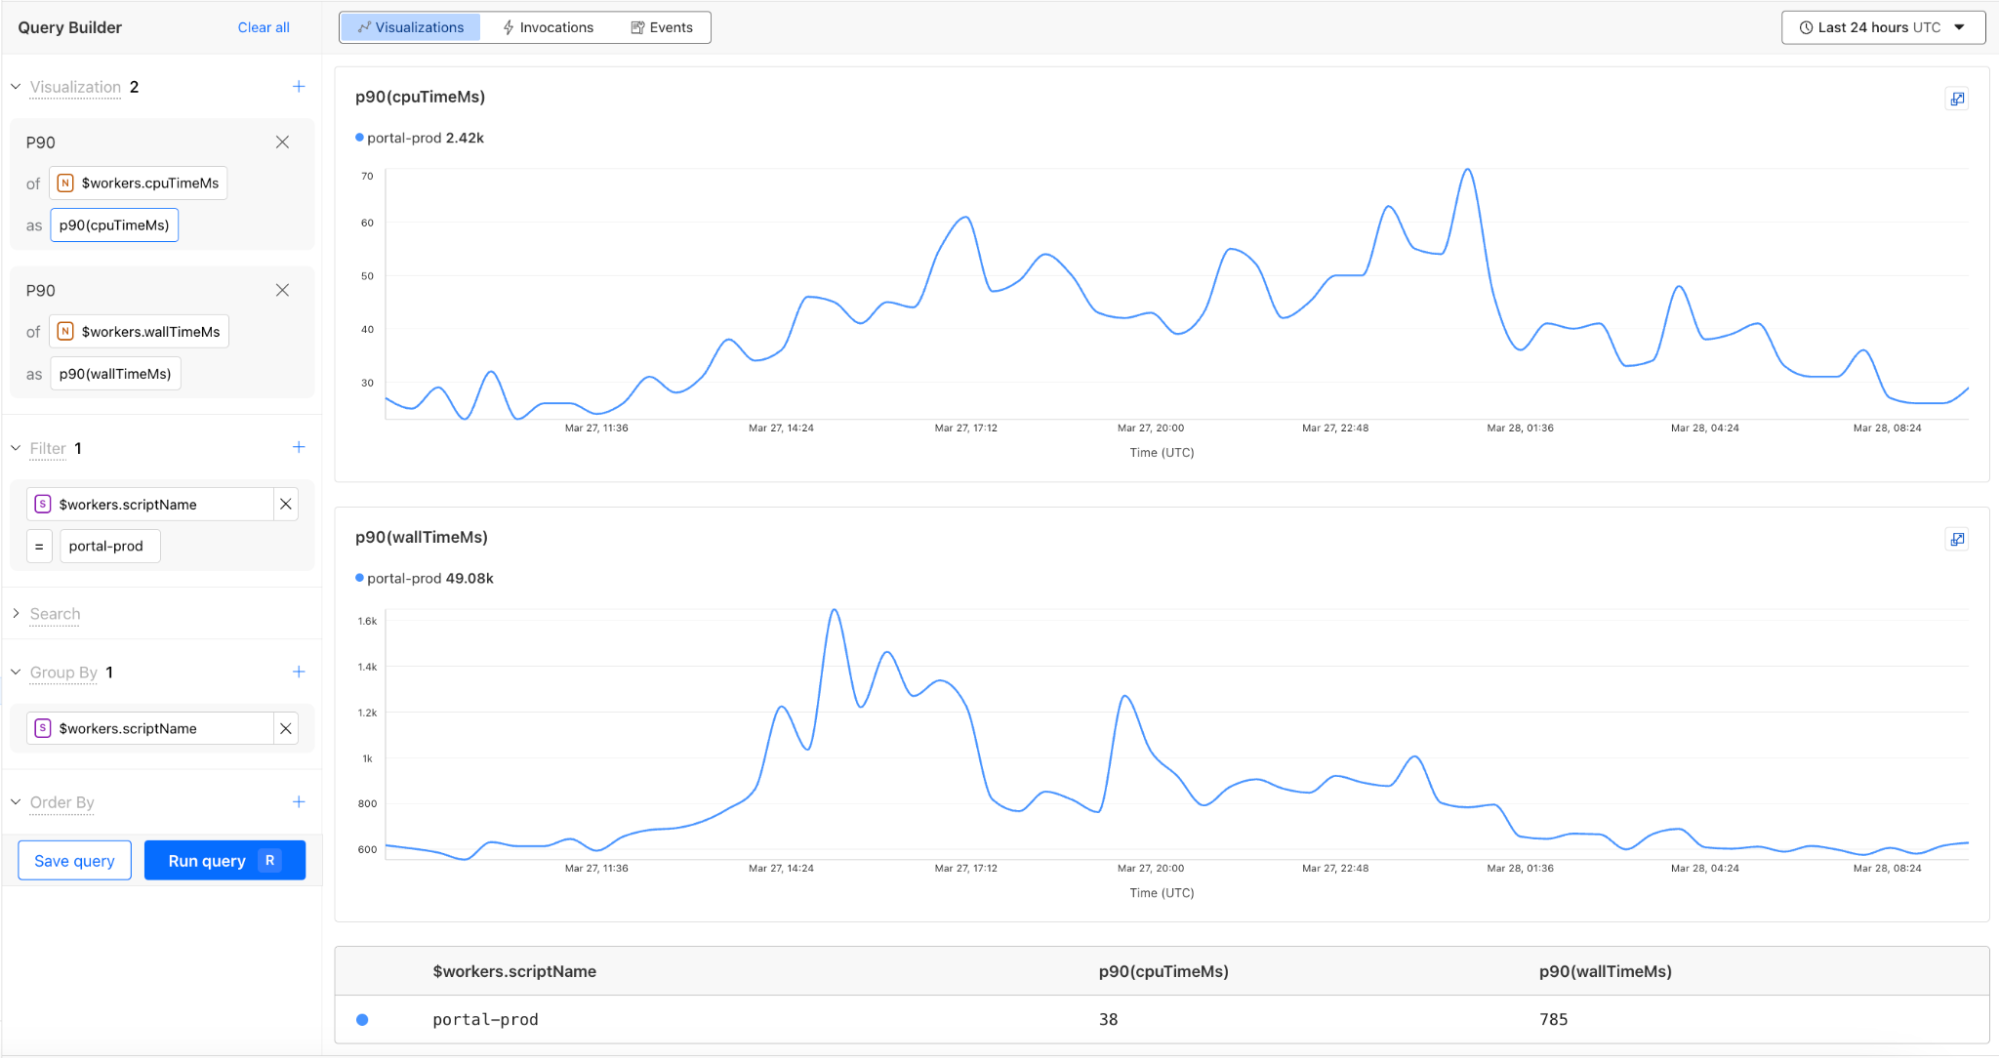
For example, using the CPU time and wall time surfaced in the Invocation Log, you can use the Query Builder to show the p90 CPU time and wall time traffic for a single Worker script.


Revamped Workers metrics

In February, we released a new view into your Workers’ metrics to help you monitor your gradual deployments with improved visualizations. Today, we are also launching a new Workers Metrics overview page in the Observability tab. Now you can easily compare metrics across Workers and understand the current state of your deployments, all from a single view.


Invocations view

Invocations are mechanisms to trigger the execution of a Worker or Durable Object in response to an event, such as an alarm, cron job, or a fetch. 

When the Worker or Durable Object executes, log events are emitted. To date, we have surfaced logs in an events view where each log is ordered by the time it was published. 

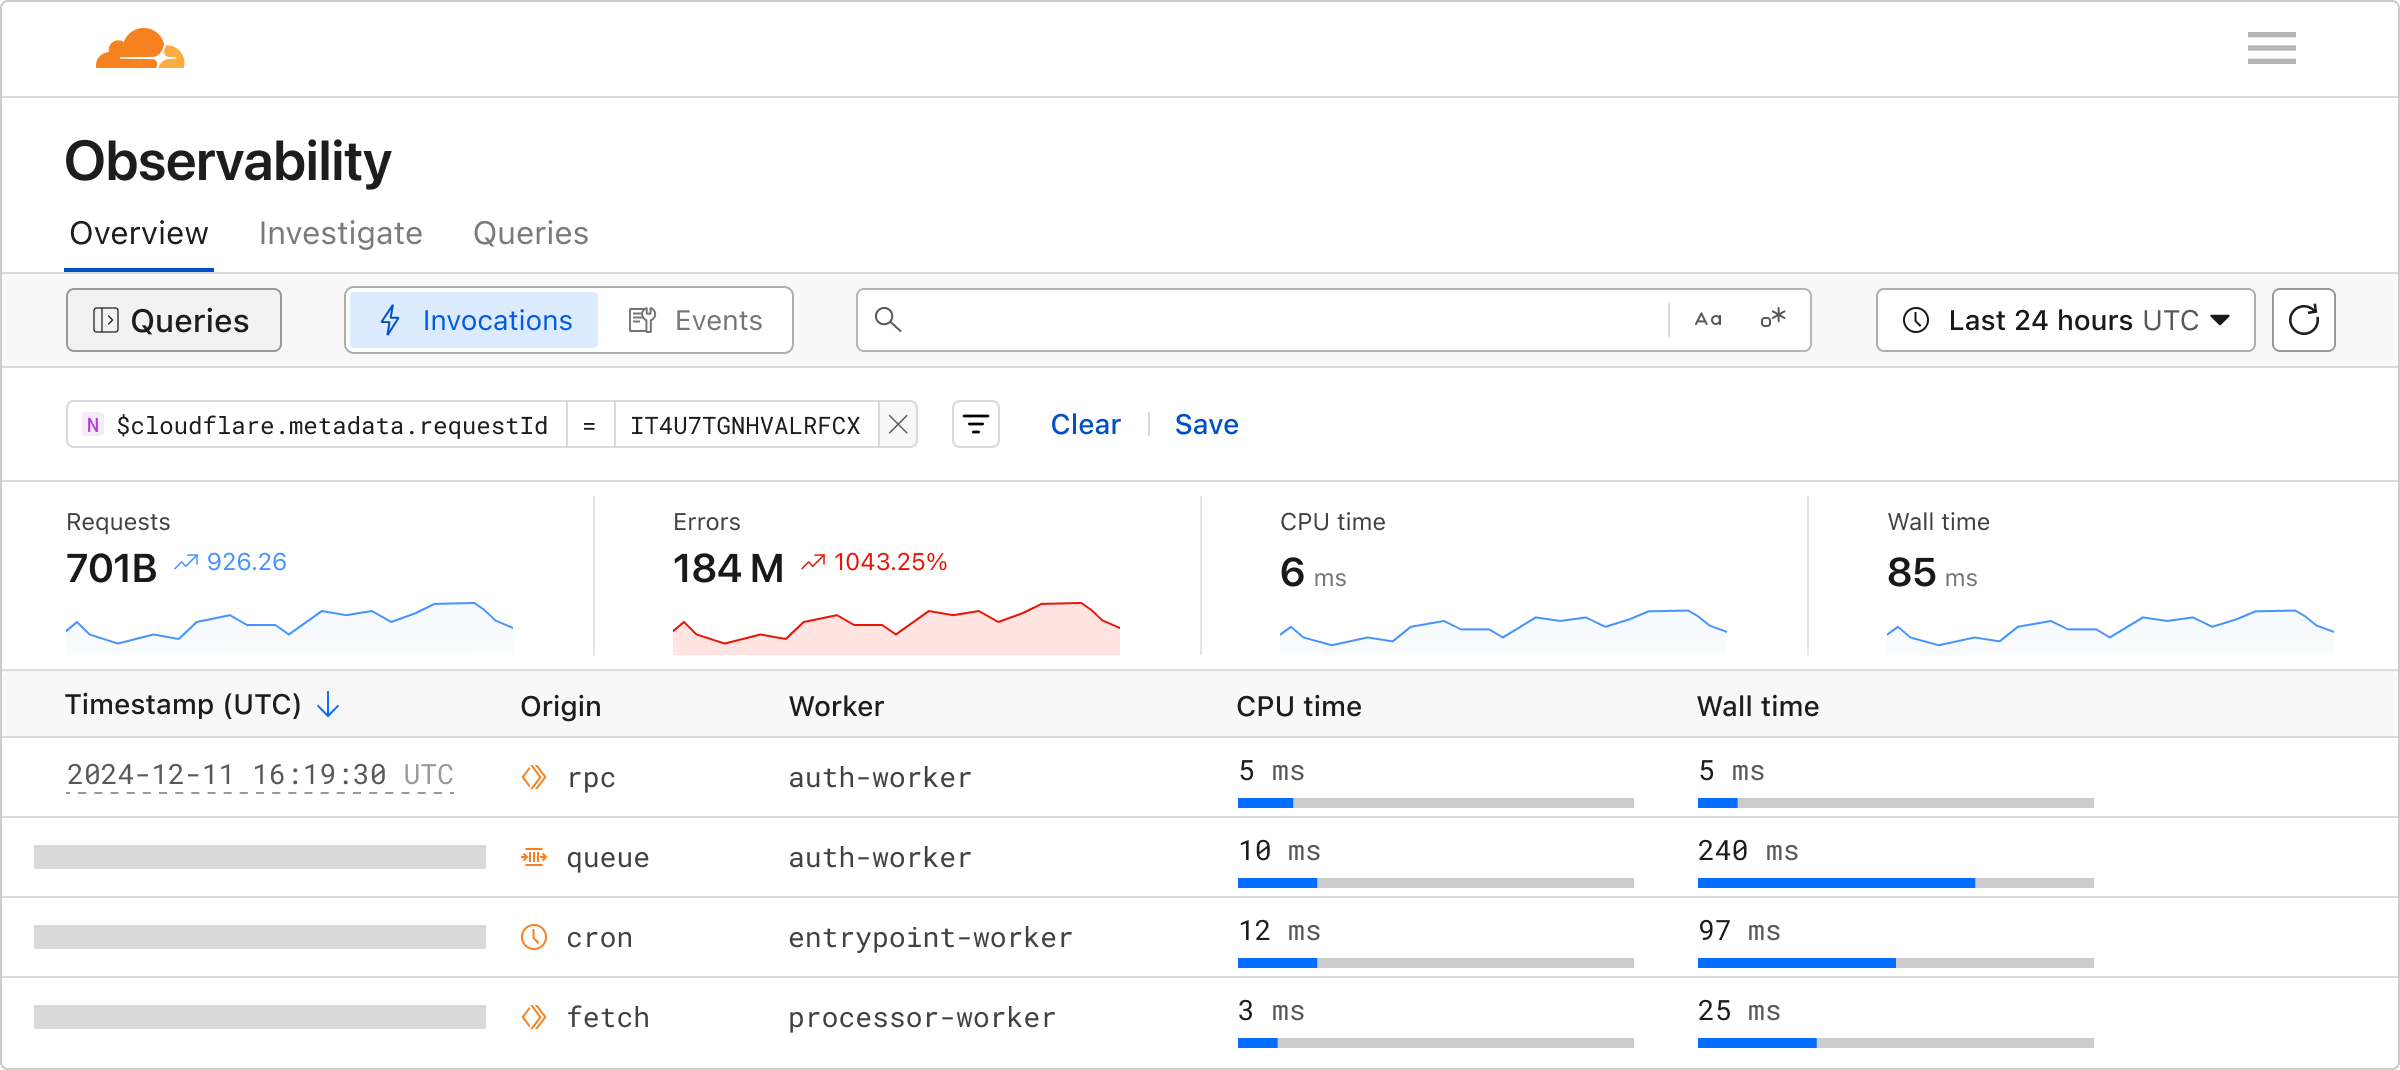
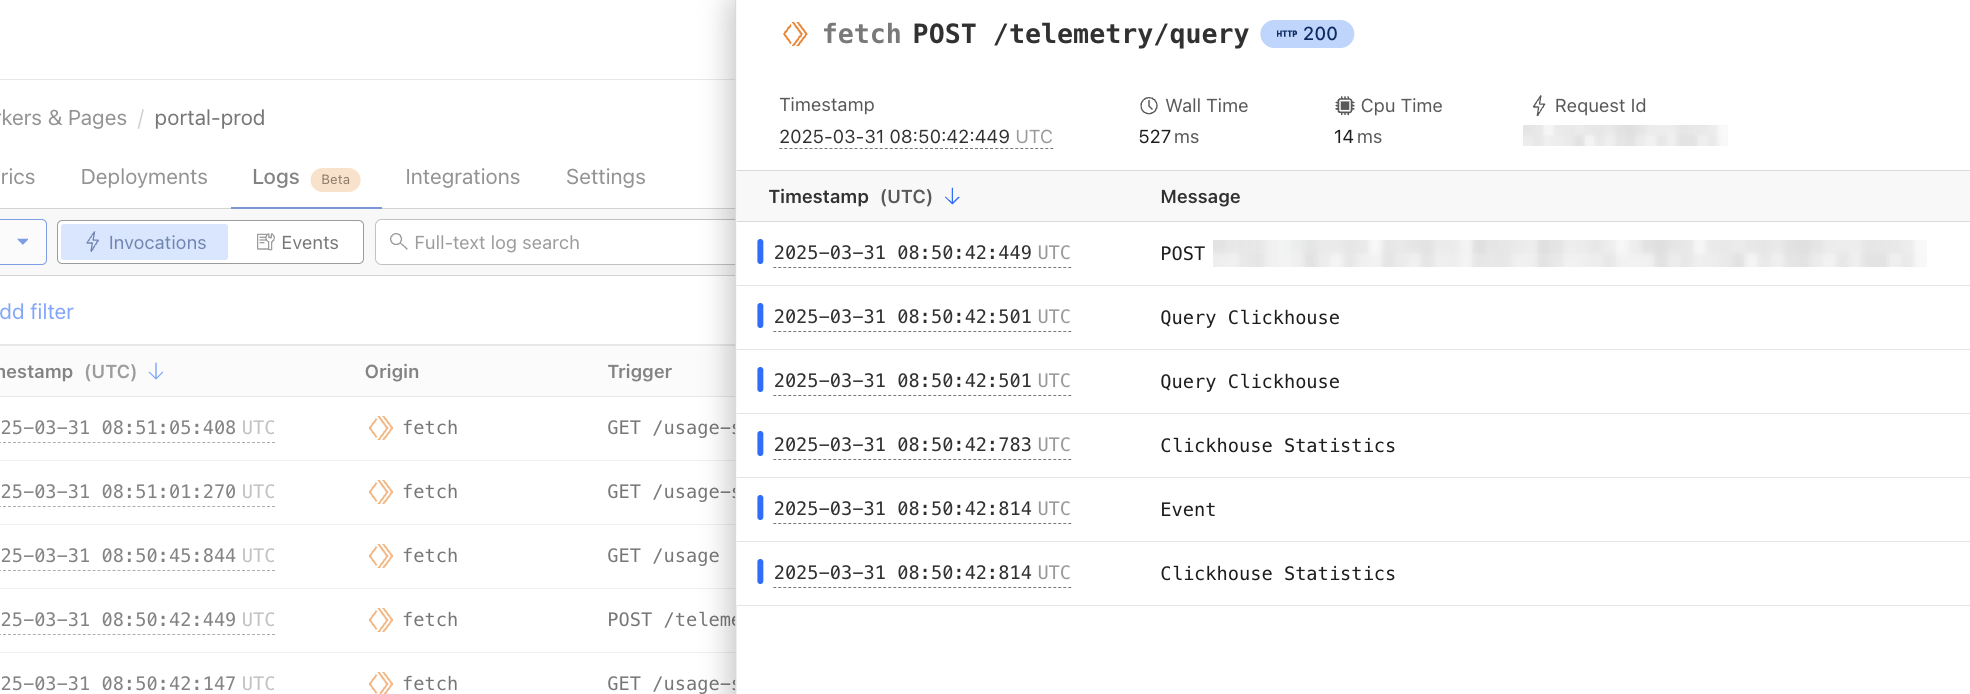
We’re now introducing an Invocations View, so you can group and view all logs from each invocation. These views are available in each Worker’s view and the Workers Observability tab.


Workers Observability API

You can now use the Workers Observability API to programmatically retrieve your telemetry data and populate the tool of your choice.

The API allows you to automate, integrate, and customize in ways that our dashboard may not. For example, you may want to analyze your logs in a notebook or correlate your Workers logs with logs from a different source.  Leveraging the Workers Observability API can help you optimize your monitoring strategy, automate repetitive tasks, and improve flexibility in how you interact with your telemetry data.

Enable Workers Logs today

To use Workers Logs, enable it in your Workers’ settings in the dashboard or add the following configuration to your Workers’ wrangler file:

# wrangler.jsonc

{
  "observability": {
    "enabled": true,
    "logs": {
      "invocation_logs": true,
      "head_sampling_rate": 1
    }
  }
}

We’re just getting started. We have lots in store to help make Cloudflare’s developer observability best-in-class. Join us in Discord in the #workers-observability channel for feedback and feature requests.