We’re excited to announce Workers Observability – a new section in the Cloudflare Dashboard that allows you to query detailed log events across all Workers in your account to extract deeper insights.
In 2024, we set out to build the best first-party observability for any cloud platform. Since then, we’ve improved metrics reporting for all resources, launched Workers Logs to automatically ingest and store logs for Workers, and rebuilt real-time logs with improved filtering. However, observability insights have been limited to a single Worker.
Starting today, you can use Workers Observability to understand what is happening across all of your Workers:
Workers Metrics Dashboard (Beta): A single dashboard to view metrics and logs from all of your Workers
Query Builder (Beta): Construct structured queries to explore your logs, extract metrics from logs, create graphical and tabular visualizations, and save queries for faster future investigations.
Workers Logs: Now Generally Available, with a public API and improved invocation-based grouping.
Building queries
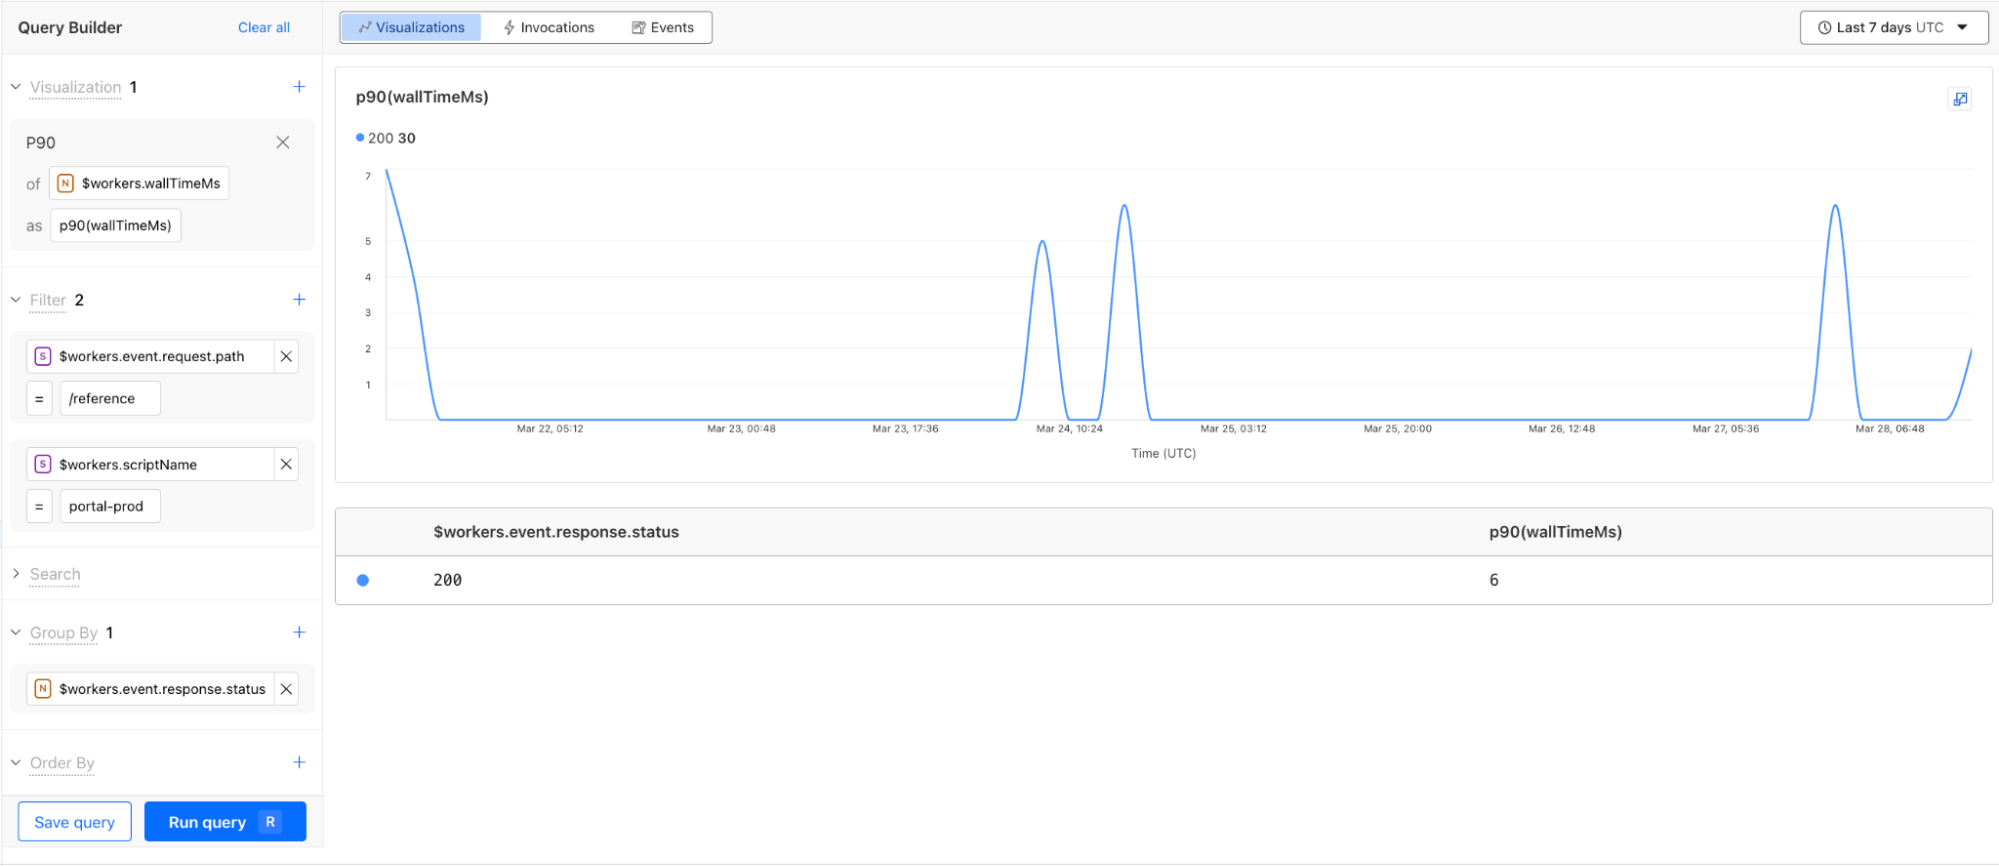
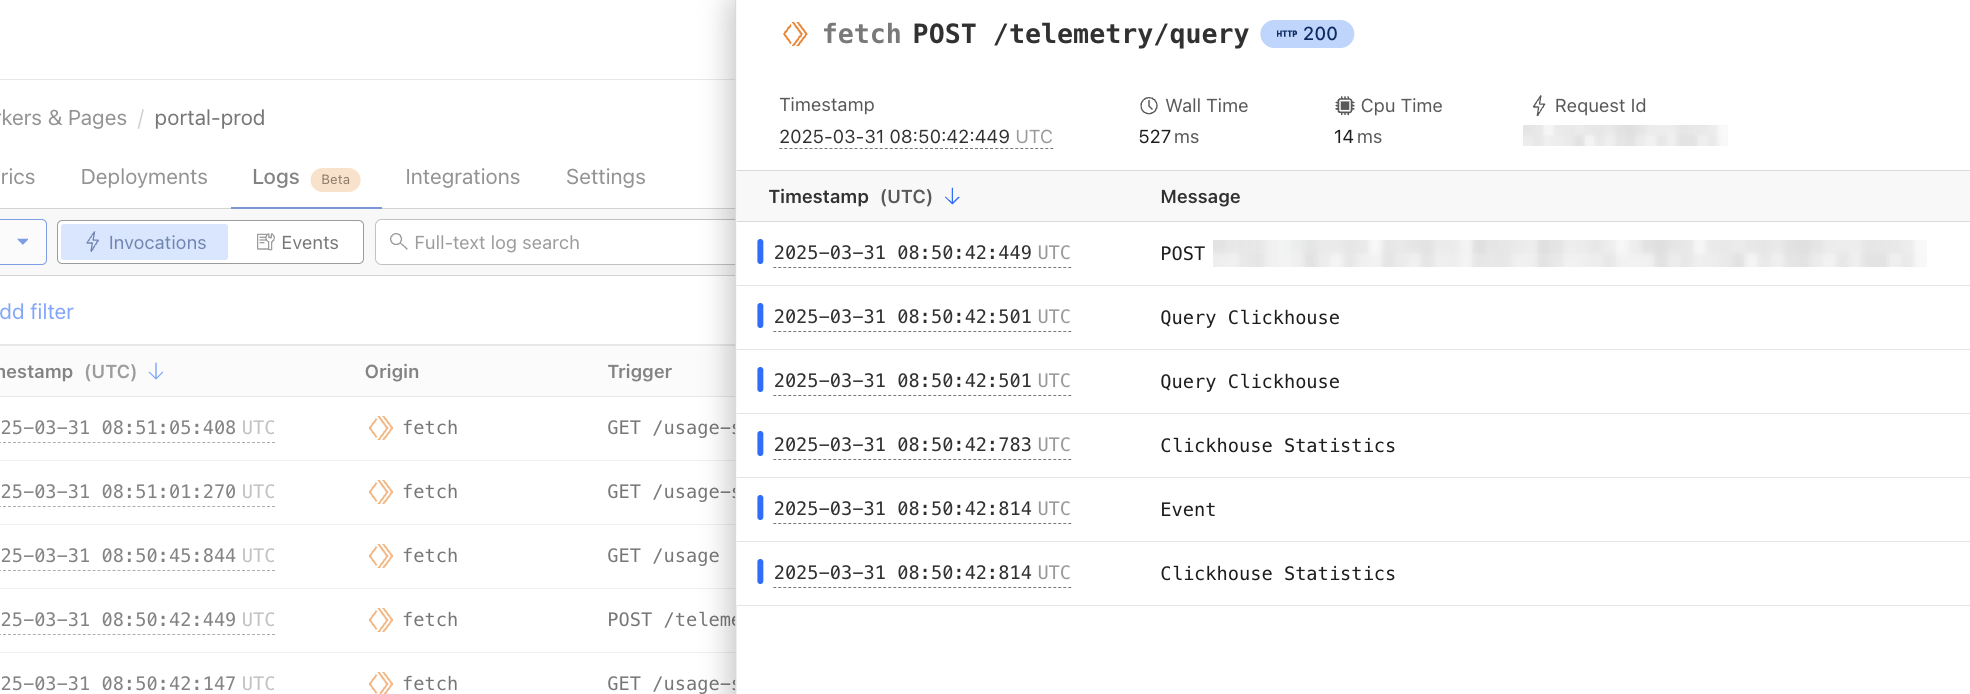
The Query Builder allows you to interact with your logs, and answer the “why” to any question you have. You can find it by navigating to Workers & Pages > Observability in the dashboard.
Using the Query Builder, you can now answer more questions than ever. For example, this query shows the p90 wall time for 200 OK responses from the /reference endpoint is 6 milliseconds.
The key components to structuring a query in the Query Builder are:
Visualizations: An aggregate function like average, count, percentile, or unique that performs a calculation on a group of values to return a single value. Each aggregate function returns a graph visualization and a summary table.
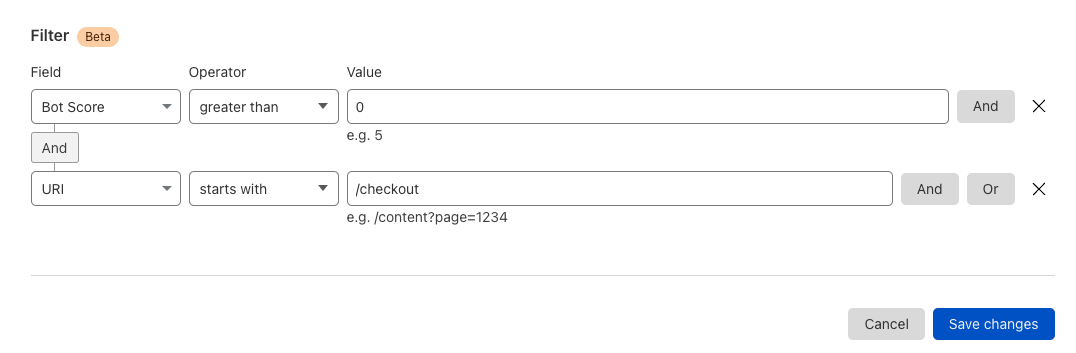
Filters: A condition that allows you to exclude data not matching the criteria.
Search: A condition that only returns the data matching the specified string.
Group by: A function to collapse a field into only its distinct values, allowing you to more granularly apply aggregate functions.
Order by: A sorting function to order the returned rows.
Limits: A cap on the number of returned rows, allowing you to focus on what is important.
The Query Builder relies on structured logs for efficient indexed queries and extracting metrics from logs. Workers Observability natively supports and encourages structured logs. Structured logs store context-rich metadata as key-value pairs in the form of distinct fields (high dimensionality), each with many potential unique values (high cardinality). Invocation Logs, which can be enabled in your Worker, contain deep insights from Cloudflare’s network, and are a great example of a structured log. By logging important metadata as a structured log, you empower yourself to answer questions about your system that you couldn’t predict when writing the code.
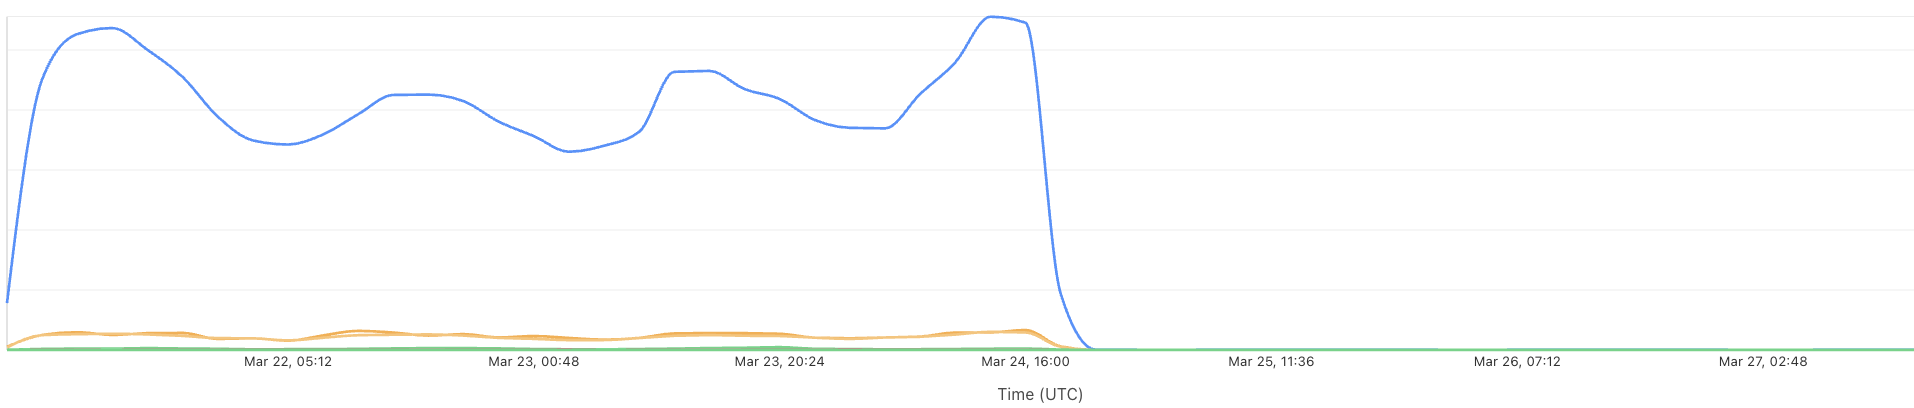
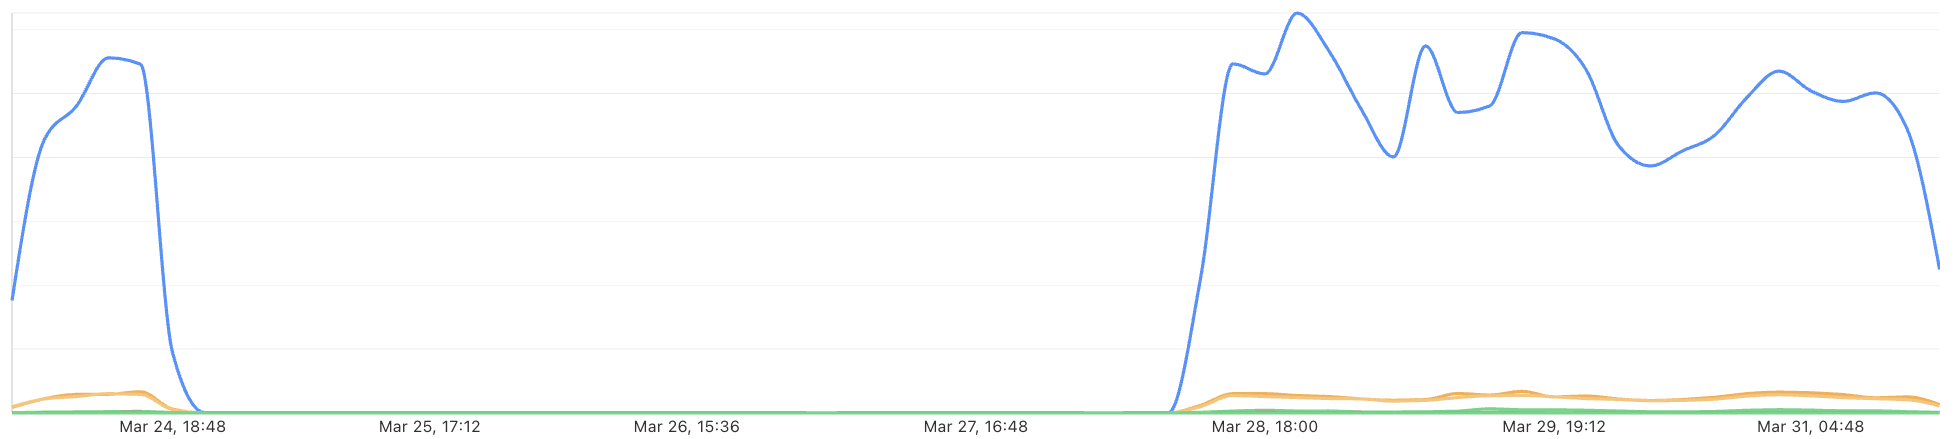
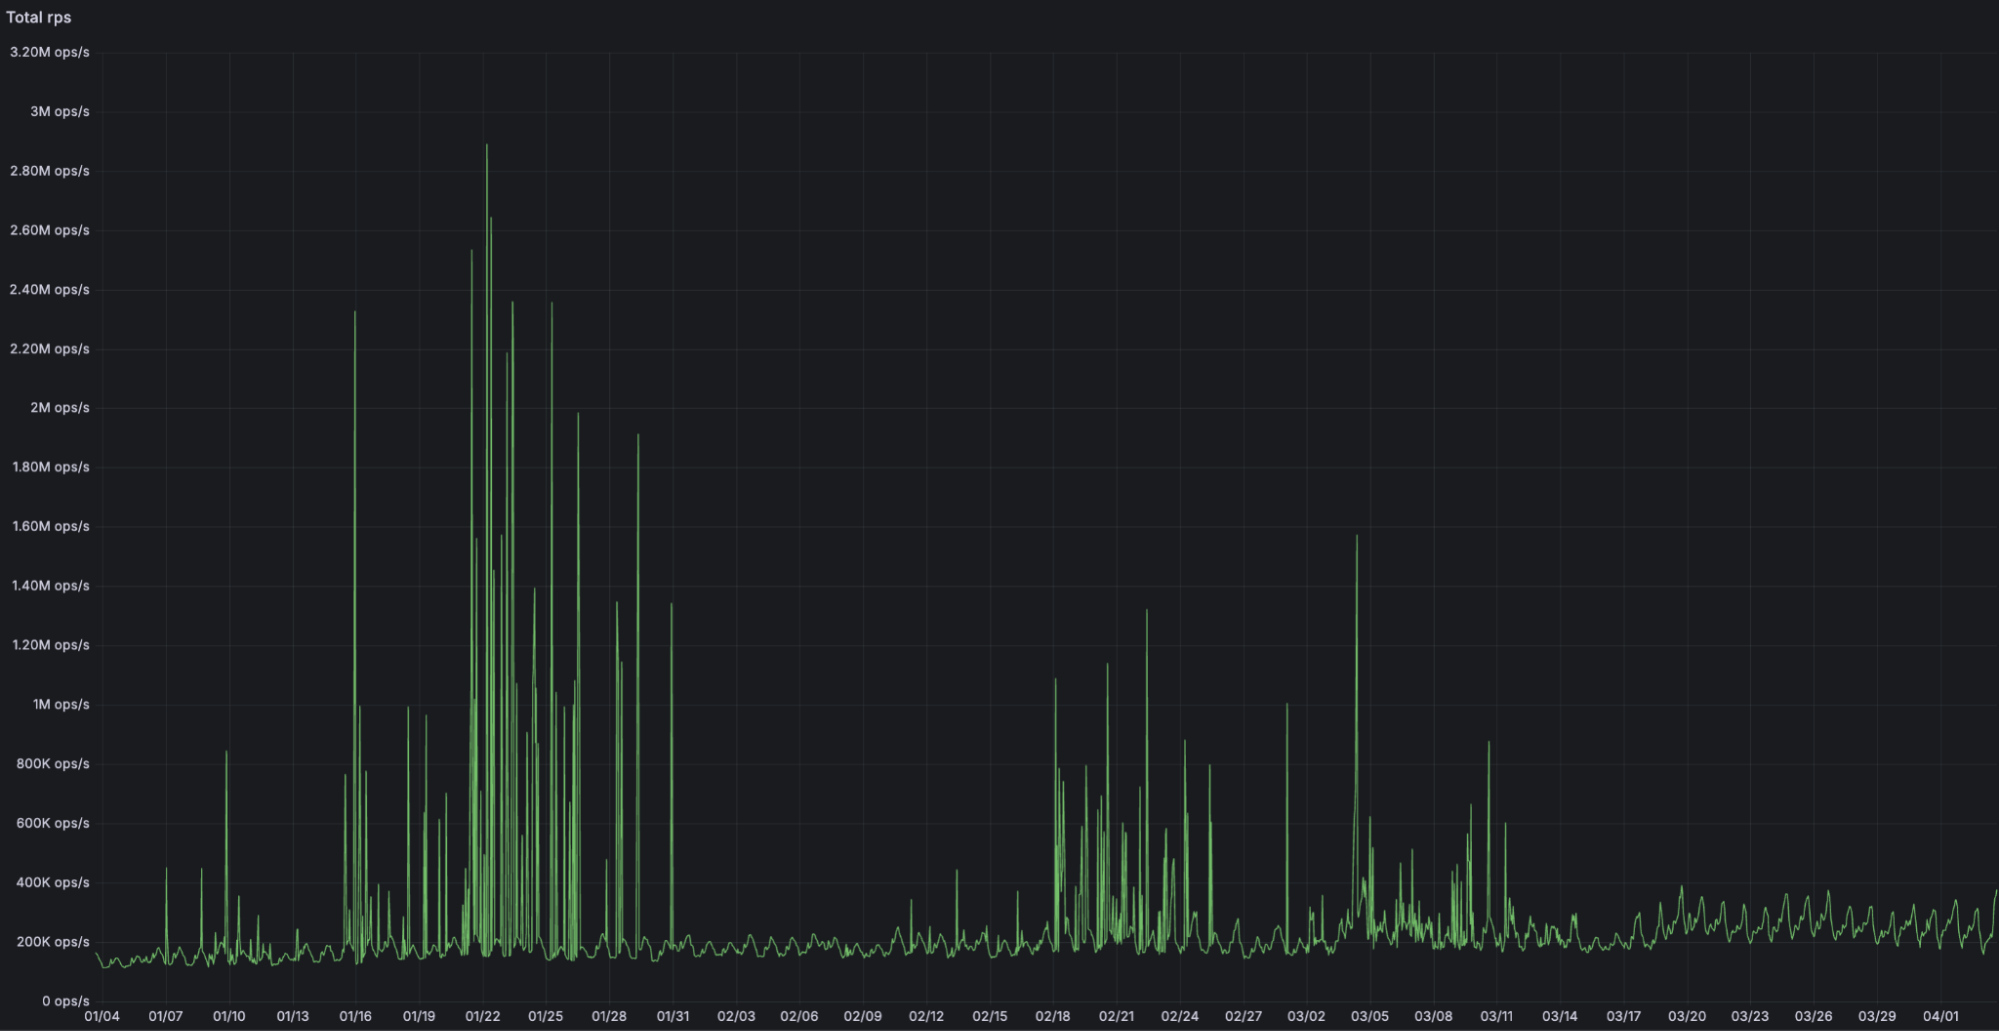
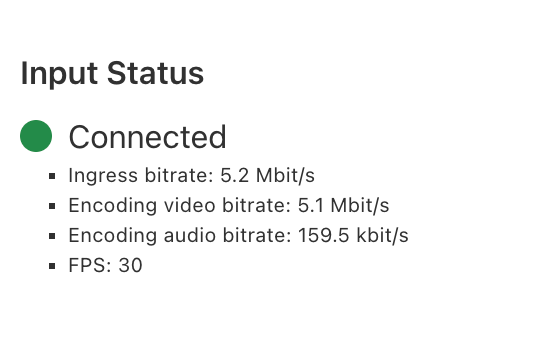
Internally at Cloudflare, we’ve already found tremendous value from this new product. During development, the Workers Observability team was able to use the Query Builder to discover a bug in the Workers Observability team’s staging environment. A query on the number of the events per script returned the following response:
After mapping this drop in recorded events against recent staging deployments, the team was able to isolate and root cause the introduction of the bug. Along with fixing the bug, the team also introduced new staging alerts to prevent errors like this from going unnoticed.
Queries built with the Query Builder or Workers Logs can be saved with a custom name and description. You can star your favorite queries, and also share them with your teammates using a shareable link, making it easier than ever to debug together and invest in developing visualizations from your telemetry data.
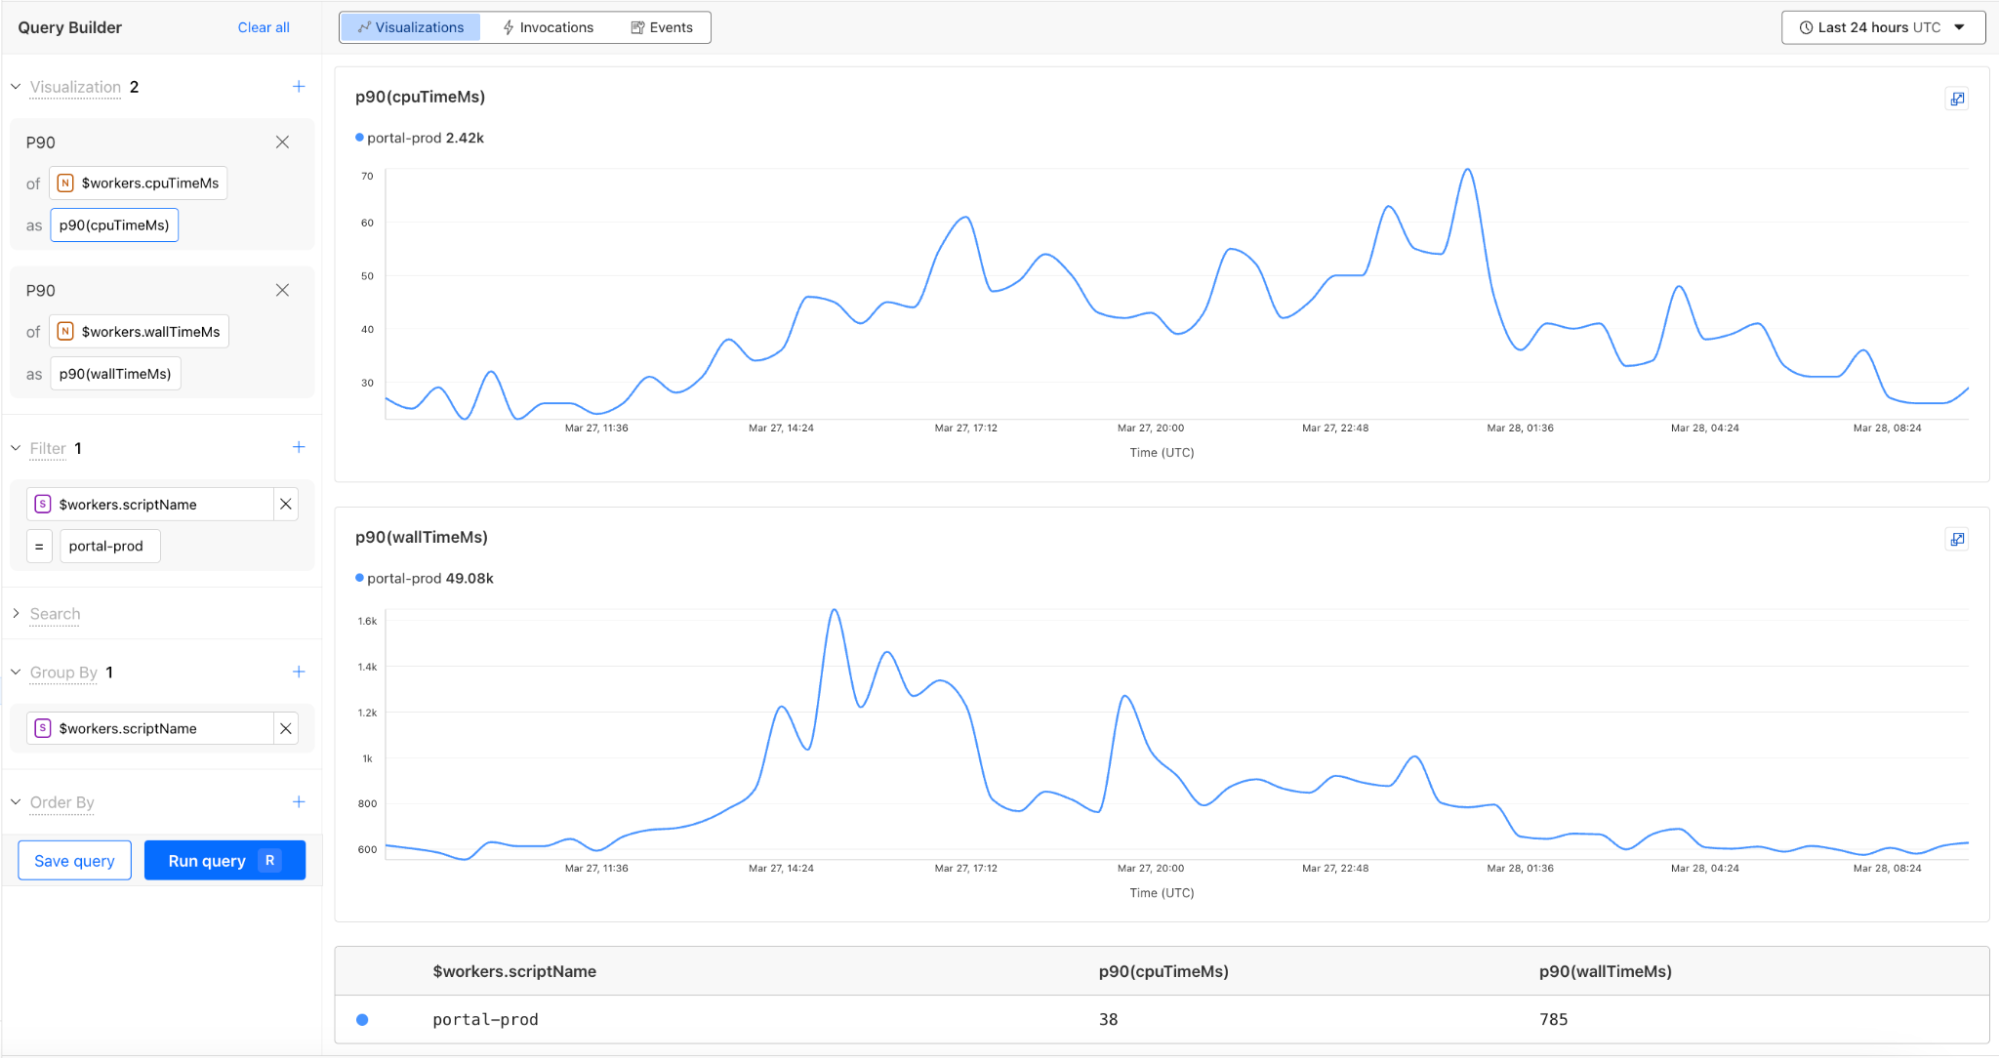
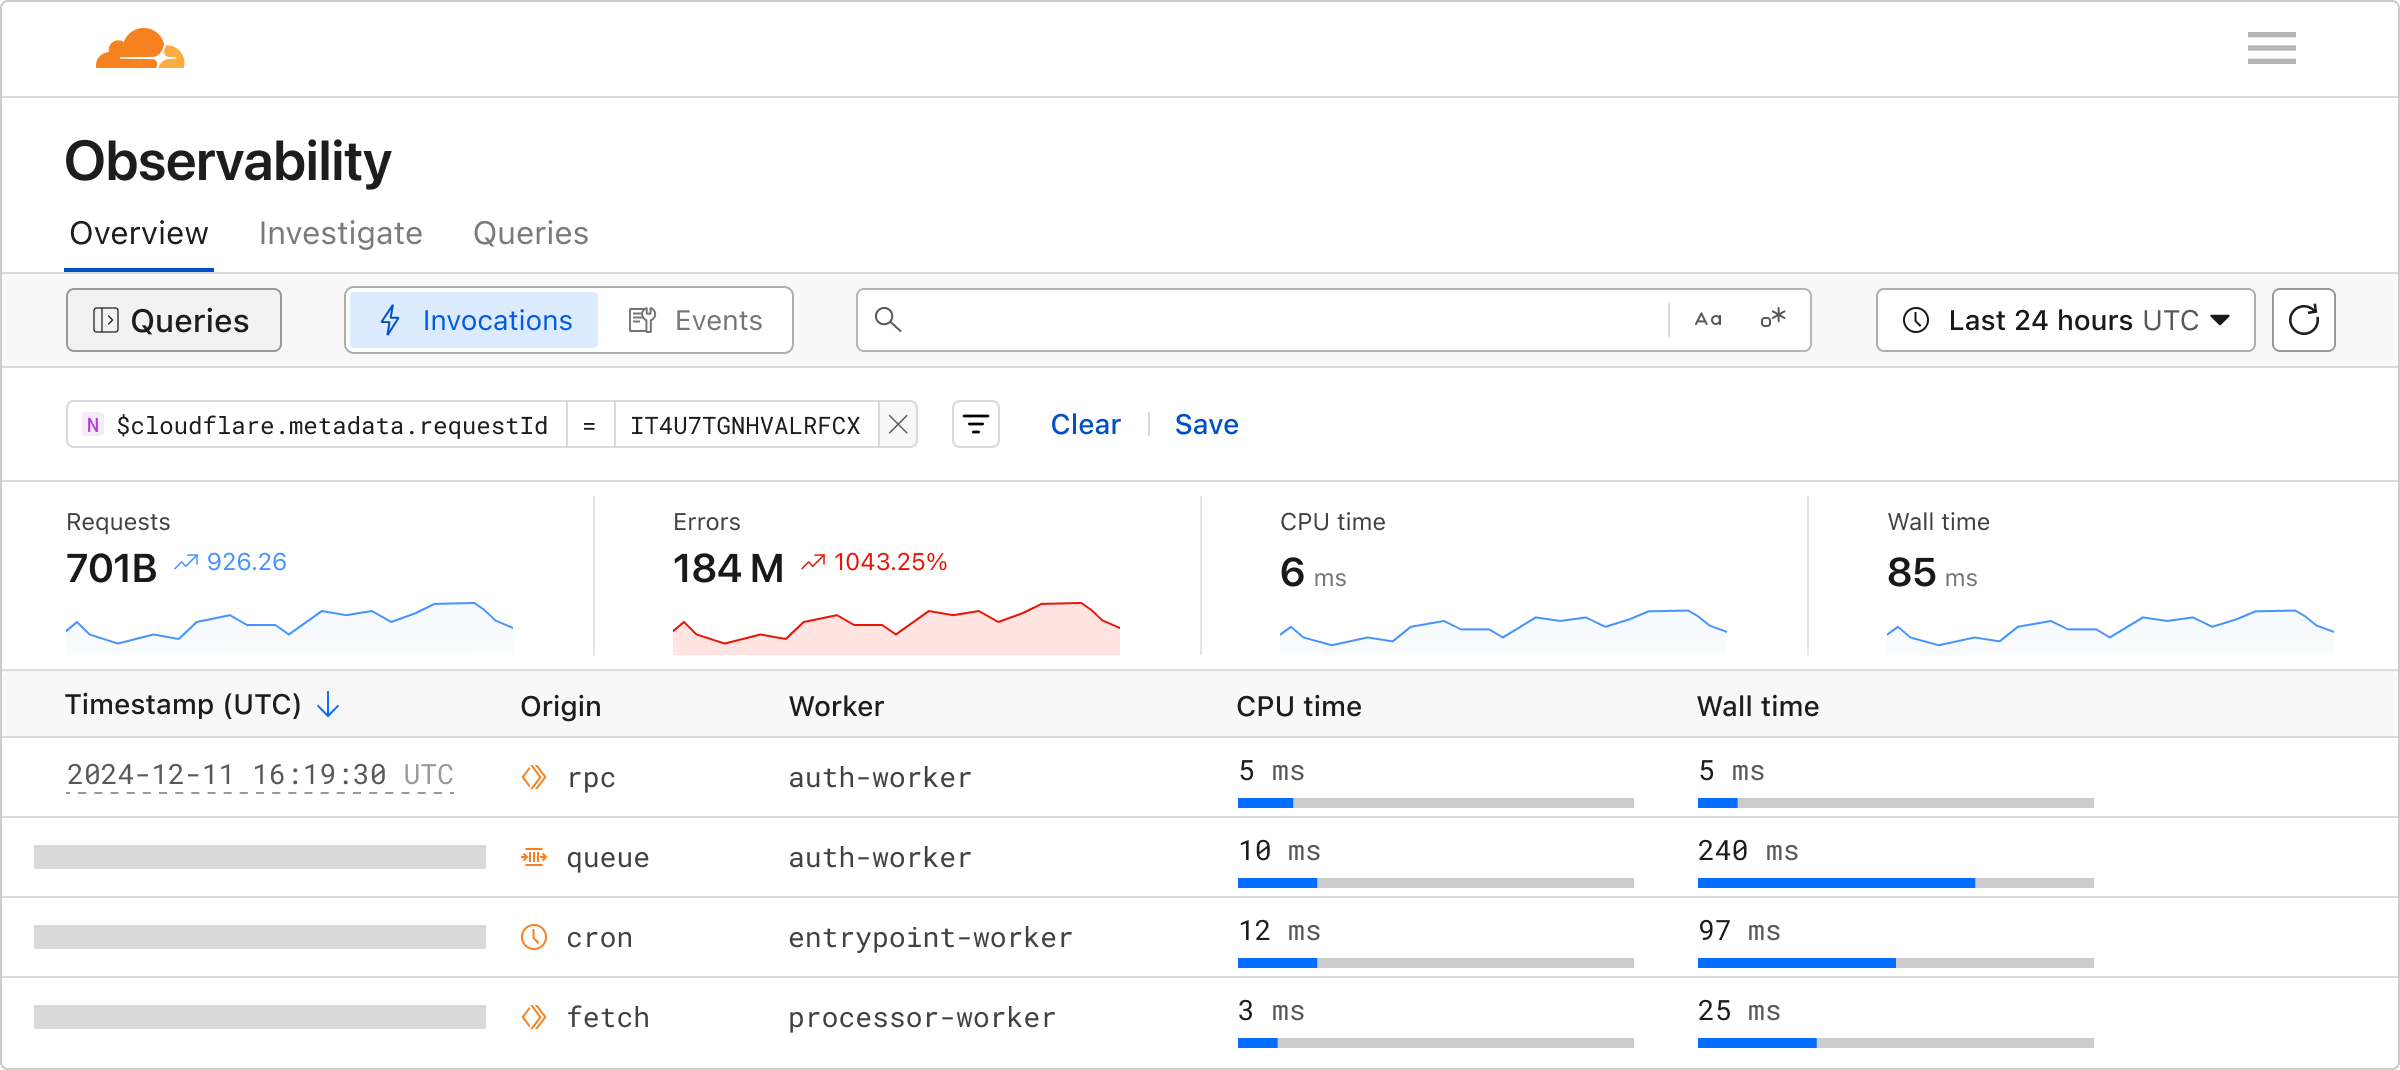
CPU time and wall time
You can now monitor CPU time and wall time for every Workers invocation across all of our observability offerings, including Tail Workers, Workers Logpush, and Workers Logs. These metrics help show how much time is spent executing code compared to the total elapsed time for the invocation, including I/O time.
For example, using the CPU time and wall time surfaced in the Invocation Log, you can use the Query Builder to show the p90 CPU time and wall time traffic for a single Worker script.
Revamped Workers metrics
In February, we released a new view into your Workers’ metrics to help you monitor your gradual deployments with improved visualizations. Today, we are also launching a new Workers Metrics overview page in the Observability tab. Now you can easily compare metrics across Workers and understand the current state of your deployments, all from a single view.
Invocations view
Invocations are mechanisms to trigger the execution of a Worker or Durable Object in response to an event, such as an alarm, cron job, or a fetch.
When the Worker or Durable Object executes, log events are emitted. To date, we have surfaced logs in an events view where each log is ordered by the time it was published.
We’re now introducing an Invocations View, so you can group and view all logs from each invocation. These views are available in each Worker’s view and the Workers Observability tab.
Workers Observability API
You can now use the Workers Observability API to programmatically retrieve your telemetry data and populate the tool of your choice.
The API allows you to automate, integrate, and customize in ways that our dashboard may not. For example, you may want to analyze your logs in a notebook or correlate your Workers logs with logs from a different source. Leveraging the Workers Observability API can help you optimize your monitoring strategy, automate repetitive tasks, and improve flexibility in how you interact with your telemetry data.
Enable Workers Logs today
To use Workers Logs, enable it in your Workers’ settings in the dashboard or add the following configuration to your Workers’ wrangler file:
We’re just getting started. We have lots in store to help make Cloudflare’s developer observability best-in-class. Join us in Discord in the #workers-observability channel for feedback and feature requests.
Program your traffic at the edge — fast, flexible, and free
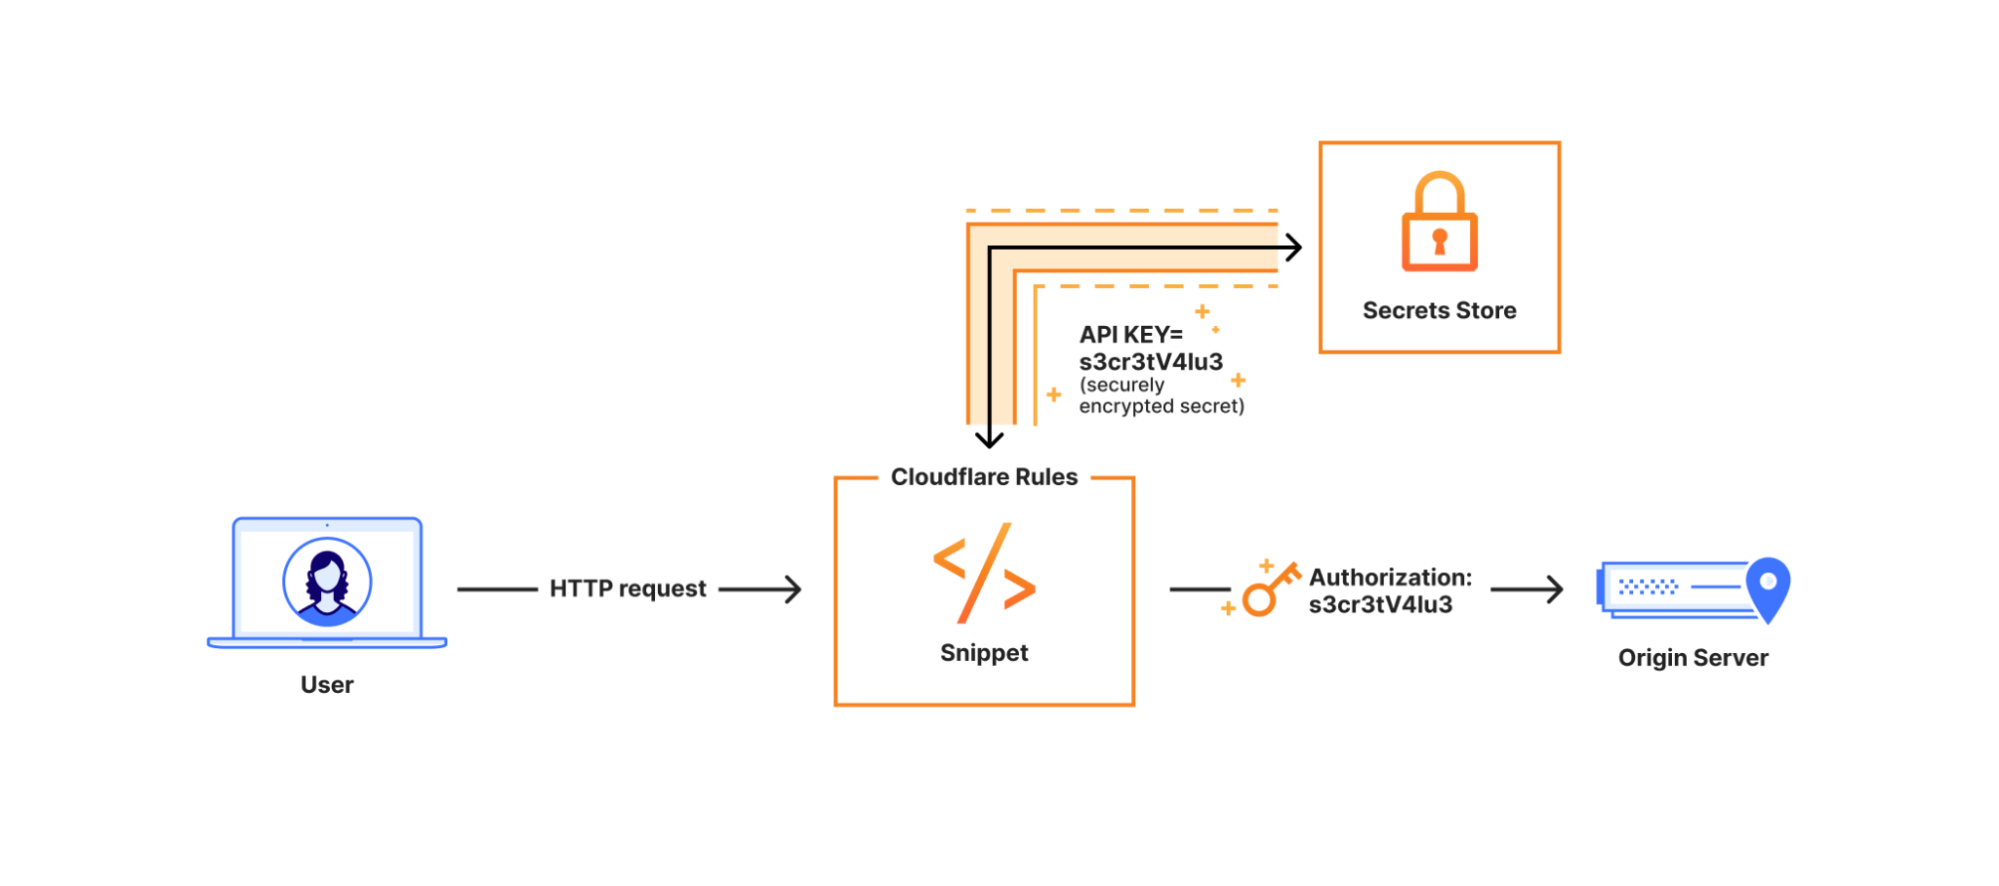
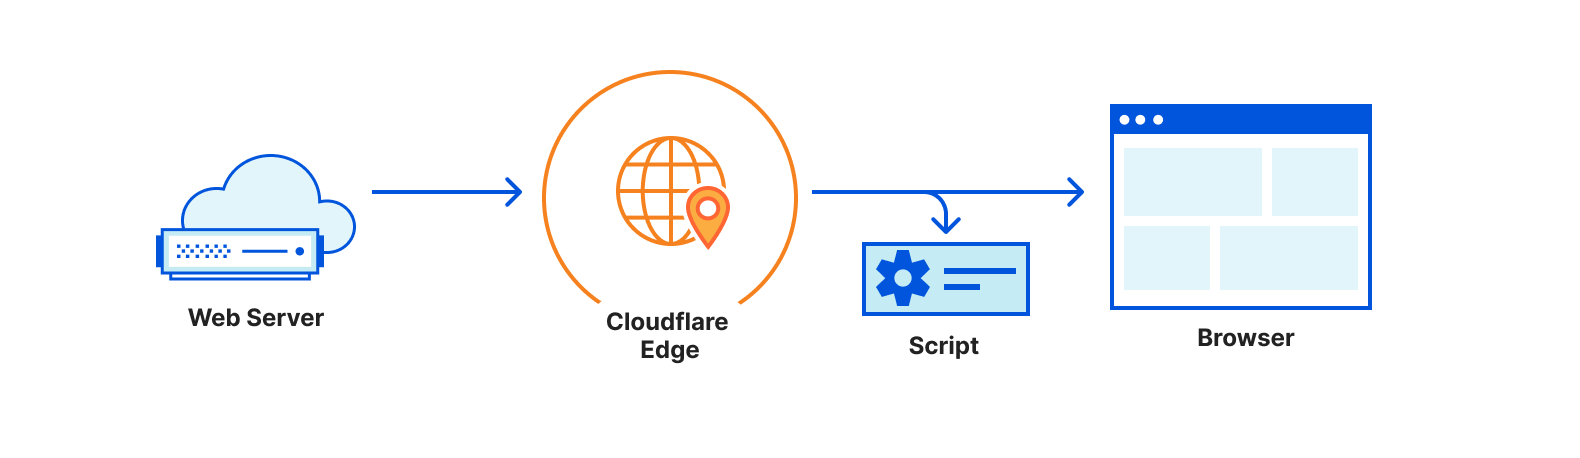
Cloudflare Snippets are now generally available (GA) for all paid plans, giving you a fast, flexible way to control HTTP traffic using lightweight JavaScript “code rules” — at no extra cost.
Need to transform headers dynamically, fine-tune caching, rewrite URLs, retry failed requests, replace expired links, throttle suspicious traffic, or validate authentication tokens? Snippets provide a production-ready solution built for performance, security, and control.
With GA, we’re introducing a new code editor to streamline writing and testing logic. This summer, we’re also rolling out an integration with Secrets Store — enabling you to bind and manage sensitive values like API keys directly in Snippets, securely and at scale.
What are Snippets?
Snippets bring the power of JavaScript to Cloudflare Rules, letting you write logic that runs before a request reaches your origin or after a response returns from upstream. They’re ideal when built-in rule actions aren’t quite enough. While Cloudflare Rules let you define traffic logic without code, Snippets extend that model with greater flexibility for advanced scenarios.
Automated deployment and versioning via Terraform.
Best of all? Snippets are included at no extra cost for Pro, Business, and Enterprise plans — with no usage-based fees.
The journey to GA: How Snippets became production-grade
Cloudflare Snippets started as a bold idea: bring the power of JavaScript-based logic to Cloudflare Rules, without the complexity of a full-stack developer platform.
Over the past two years, Snippets have evolved into a production-ready “code rules” solution, shaping the future of HTTP traffic control.
2022: Cloudflare Snippets were announced during Developer Week as a solution for users needing flexible HTTP traffic modifications without a full Worker.
2023:Alpha launch — hundreds of users tested Snippets for high-performance traffic logic.
2024:7x traffic growth, processing 17,000 requests per second. Terraform support and production-grade backend were released.
2025:General Availability — Snippets introduces a new code editor, increased limits alongside other Cloudflare Rules products, integration with Trace, and a production-grade experience built for scale, handling over 2 million requests per second at peak. Integration with the Secrets Store is rolling out this summer.
New: Snippets + Trace
Cloudflare Trace now shows exactly which Snippets were triggered on a request. This makes it easier to debug traffic behavior, verify logic execution, and understand how your Snippets interact with other products in the request pipeline.
Whether you’re fine-tuning header logic or troubleshooting a routing issue, Trace gives you real-time insight into how your edge logic behaves in production.
Coming soon: Snippets + Secrets Store
In the third quarter, you’ll be able to securely access API keys, authentication tokens, and other sensitive values from Secrets Store directly in your Snippets. No more plaintext secrets in your code, no more workarounds.
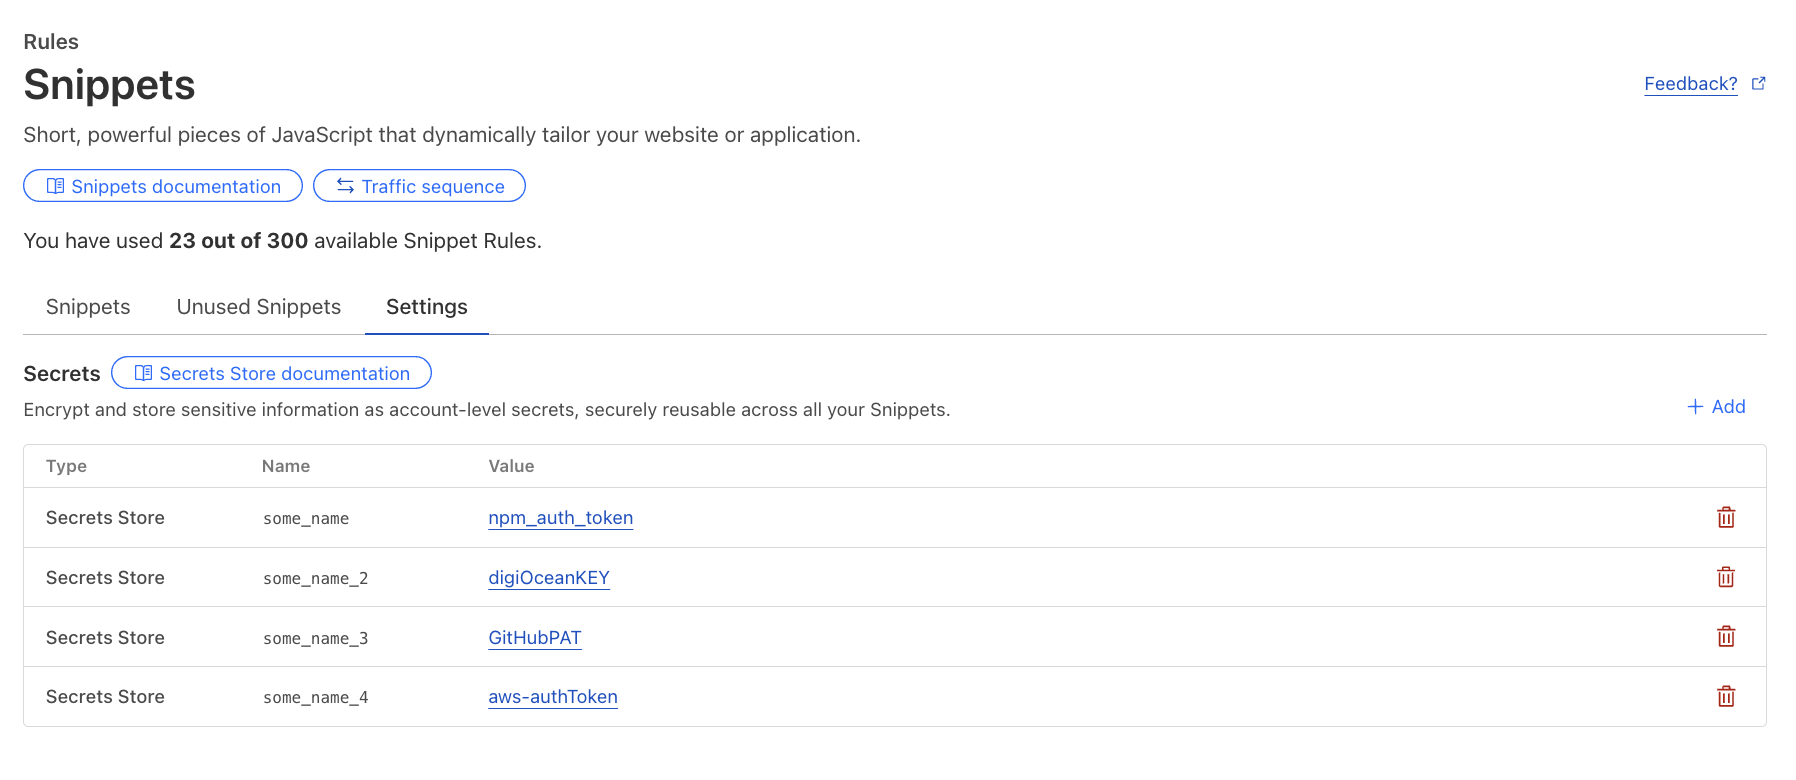
Once rolled out, secrets can be configured for Snippets via the dashboard or API under the new “Settings” button.
When to use Snippets vs. Cloudflare Workers
Snippets are fast, flexible, and free, but how do they compare to Cloudflare Workers? Both allow you to programmatically control traffic. However, they solve different problems:
Feature
Snippets
Workers
Execute scripts based on request attributes (headers, geolocation, cookies, etc.)
✅
❌
Modify HTTP requests/responses or serve a different response
✅
✅
Add, remove, or rewrite headers dynamically
✅
✅
Cache assets at the edge
✅
✅
Route traffic dynamically between origins
✅
✅
Authenticate requests, pre-sign URLs, run A/B testing
✅
✅
Perform compute-intensive tasks (e.g., AI inference, image processing)
❌
✅
Store persistent data (e.g., KV, Durable Objects, D1)
❌
✅
Deploy via CLI (Wrangler)
❌
✅
Use TypeScript, Python, Rust or other programming languages
❌
✅
Use Snippets when:
You need ultra-fast conditional traffic modifications directly on Cloudflare’s network.
You want to extend Cloudflare Rules beyond built-in actions.
You need free, unlimited invocations within the execution limits.
You are migrating from VCL, Akamai’s EdgeWorkers, or on-premise logic.
Use Workers when:
Your application requires state management, Developer Platform product integrations, or high compute limits.
You are building APIs, full-stack applications, or complex workflows.
You need logging, debugging tools, CLI support, and gradual rollouts.
Still unsure? Check out our detailed guide for best practices.
Snippets in action: real-world use cases
Below are practical use cases demonstrating Snippets. Each script can be dynamically triggered using our powerful Rules language, so you can granularly control which requests your Snippets will be applied to.
1. Dynamically modify headers
Inject custom headers, remove unnecessary ones, and tweak values on the fly:
export default {
  async fetch(request) {
    const timestamp = Date.now().toString(16); // convert timestamp to HEX
    const modifiedRequest = new Request(request, { headers: new Headers(request.headers) });
    modifiedRequest.headers.set("X-Hex-Timestamp", timestamp); // send HEX timestamp to upstream

    const response = await fetch(modifiedRequest);
    const newResponse = new Response(response.body, response); // make response from upstream immutable

    newResponse.headers.append("x-snippets-hello", "Hello from Cloudflare Snippets"); // add new response header
    newResponse.headers.delete("x-header-to-delete"); // delete response header
    newResponse.headers.set("x-header-to-change", "NewValue"); // replace the value of existing response header

    return newResponse;
  },
};
2. Serve a custom maintenance page
Route traffic to a maintenance page when your origin is undergoing planned maintenance:
export default {
    async fetch(request) { // for all matching requests, return predefined HTML response with 503 status code
        return new Response(`
            <!DOCTYPE html>
            <html lang="en">
            <head>
                <meta charset="UTF-8">
                <title>We'll Be Right Back!</title>
                <style> body { font-family: Arial, sans-serif; text-align: center; padding: 20px; } </style>
            </head>
            <body>
                <h1>We'll Be Right Back!</h1>
                <p>Our site is undergoing maintenance. Check back soon!</p>
            </body>
            </html>
        `, { status: 503, headers: { "Content-Type": "text/html" } });
    }
};
3. Retry failed requests to a backup origin
Ensure reliability by automatically rerouting requests when your primary origin returns an unexpected response:
export default {
  async fetch(request) {
    const response = await fetch(request); // send original request to the origin

    if (!response.ok && !response.redirected) { // if response is not 200 OK or a redirect, send to another origin
      const newRequest = new Request(request); // clone the original request to construct a new request
      newRequest.headers.set("X-Rerouted", "1"); // add a header to identify a re-routed request at the new origin
      const url = new URL(request.url); // clone the original URL
      url.hostname = "backup.example.com"; // send request to a different origin / hostname
      return await fetch(url, newRequest); // serve response from the backup origin
    }

    return response; // otherwise, serve response from the primary origin
  },
};
4. Redirect users based on their location
Send visitors to region-specific sites for better localization:
export default {
    async fetch(request) {
        const country = request.cf.country; // identify visitor's country using request.cf property
        const redirectMap = { US: "https://example.com/us", EU: "https://example.com/eu" }; // define redirects for each country
        if (redirectMap[country]) return Response.redirect(redirectMap[country], 301); // redirect on match
        return fetch(request); // otherwise, proceed to upstream normally
    }
};
Getting started with Snippets
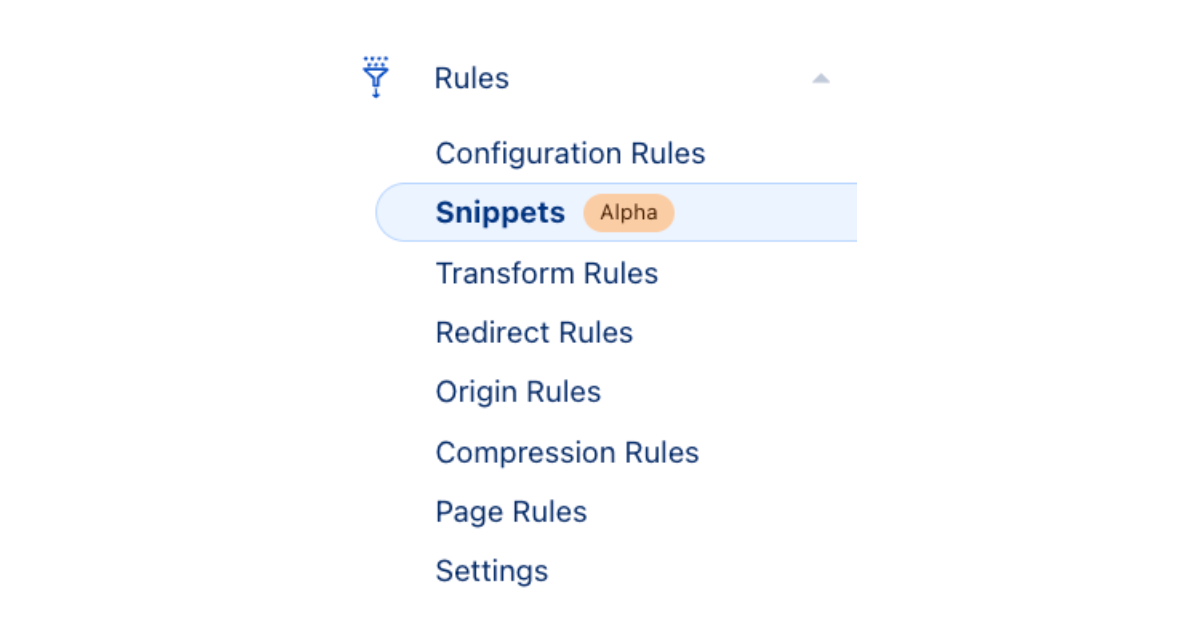
Snippets are available right now in the Cloudflare dashboard under Rules > Snippets:
Go to Rules → Snippets.
Use prebuilt templates or write your own JavaScript code.
Configure a flexible rule to trigger your Snippet.
Cloudflare Snippets are now generally available, bringing fast, cost-free, and intelligent HTTP traffic control to all paid plans.
With native integration into Cloudflare Rules and Terraform — and Secrets Store integration coming this summer — Snippets provide the most efficient way to manage advanced traffic logic at scale.
Explore Snippets in the Cloudflare Dashboard and start optimizing your traffic with lightweight, flexible rules that enhance performance and reduce complexity.
In September 2024, we introduced beta support for hosting, storing, and serving static assets for free on Cloudflare Workers — something that was previously only possible on Cloudflare Pages. Being able to host these assets — your client-side JavaScript, HTML, CSS, fonts, and images — was a critical missing piece for developers looking to build a full-stack application within a single Worker.
Today we’re announcing ten big improvements to building apps on Cloudflare. All together, these new additions allow you to build and host projects ranging from simple static sites to full-stack applications, all on Cloudflare Workers:
You can build complete full-stack apps on Workers without a framework: you can “just use Vite” and React together, and build a backend API in the same Worker. See our Vite + React template for an example.
The Cloudflare Vite plugin is now v1.0 and generally available. The Vite plugin allows you to run Vite’s development server in the Workers runtime (workerd), meaning you get all the benefits of Vite, including Hot Module Replacement, while still being able to use features that are exclusive to Workers (like Durable Objects).
You can now use static _headers and _redirects configuration files for your applications on Workers, something that was previously only available on Pages. These files allow you to add simple headers and configure redirects without executing any Worker code.
In addition to PostgreSQL, you can now connect to MySQL databases in addition from Cloudflare Workers, via Hyperdrive. Bring your existing Planetscale, AWS, GCP, Azure, or other MySQL database, and Hyperdrive will take care of pooling connections to your database and eliminating unnecessary roundtrips by caching queries.
More Node.js APIs are available in the Workers Runtime — including APIs from the crypto, tls, net, and dns modules. We’ve also increased the maximum CPU time for a Workers request from 30 seconds to 5 minutes.
The Images binding in Workers is generally available, allowing you to build more flexible, programmatic workflows.
These improvements allow you to build both simple static sites and more complex server-side rendered applications. Like Pages, you only get charged when your Worker code runs, meaning you can host and serve static sites for free. When you want to do any rendering on the server or need to build an API, simply add a Worker to handle your backend. And when you need to read or write data in your app, you can connect to an existing database with Hyperdrive, or use any of our storage solutions: Workers KV, R2, Durable Objects, or D1.
If you’d like to dive straight into code, you can deploy a single-page application built with Vite and React, with the option to connect to a hosted database with Hyperdrive, by clicking this “Deploy to Cloudflare” button:
Start with Workers
Previously, you needed to choose between building on Cloudflare Pages or Workers (or use Pages for one part of your app, and Workers for another) just to get started. This meant figuring out what your app needed from the start, and hoping that if your project evolved, you wouldn’t be stuck with the wrong platform and architecture. Workers was designed to be a flexible platform, allowing developers to evolve projects as needed — and so, we’ve worked to bring pieces of Pages into Workers over the years.
Now that Workers supports both serving static assets and server-side rendering, you should start with Workers. Cloudflare Pages will continue to be supported, but, going forward, all of our investment, optimizations, and feature work will be dedicated to improving Workers. We aim to make Workers the best platform for building full-stack apps, building upon your feedback of what went well with Pages and what we could improve.
Before, building an app on Pages meant you got a really easy, opinionated on-ramp, but you’d eventually hit a wall if your application got more complex. If you wanted to use Durable Objects to manage state, you would need to set up an entirely separate Worker to do so, ending up with a complicated deployment and more overhead. You also were limited to real-time logs, and could only roll out changes all in one go.
When you build on Workers, you can immediately bind to any other Developer Platform service (including Durable Objects, Email Workers, and more), and manage both your front end and back end in a single project — all with a single deployment. You also get the whole suite of Workers observability tooling built into the platform, such as Workers Logs. And if you want to rollout changes to only a certain percentage of traffic, you can do so with Gradual Deployments.
These latest improvements are part of our goal to bring the best parts of Pages into Workers. For example, we now support static _headers and _redirects config files, so that you can easily take an existing project from Pages (or another platform) and move it over to Workers, without needing to change your project. We also directly integrate with GitHub and GitLab with Workers Builds, providing automatic builds and deployments. And starting today, Preview URLs are posted back to your repository as a comment, with feature branch aliases and environments coming soon.
To learn how to migrate an existing project from Pages to Workers, read our migration guide.
Next, let’s talk about how you can build applications with different rendering modes on Workers.
Building static sites, SPAs, and SSR on Workers
As a quick primer, here are all the architectures and rendering modes we’ll be discussing that are supported on Workers:
Static sites: When you visit a static site, the server immediately returns pre-built static assets — HTML, CSS, JavaScript, images, and fonts. There’s no dynamic rendering happening on the server at request-time. Static assets are typically generated at build-time and served directly from a CDN, making static sites fast and easily cacheable. This approach works well for sites with content that rarely changes.
Single-Page Applications (SPAs): When you load an SPA, the server initially sends a minimal HTML shell and a JavaScript bundle (served as static assets). Your browser downloads this JavaScript, which then takes over to render the entire user interface client-side. After the initial load, all navigation occurs without full-page refreshes, typically via client-side routing. This creates a fast, app-like experience.
Server-Side Rendered (SSR) applications: When you first visit a site that uses SSR, the server generates a fully-rendered HTML page on-demand for that request. Your browser immediately displays this complete HTML, resulting in a fast first page load. Once loaded, JavaScript “hydrates” the page, adding interactivity. Subsequent navigations can either trigger new server-rendered pages or, in many modern frameworks, transition into client-side rendering similar to an SPA.
Next, we’ll dive into how you can build these kinds of applications on Workers, starting with setting up your development environment.
Setup: build and dev
Before uploading your application, you need to bundle all of your client-side code into a directory of static assets. Wrangler bundles and builds your code when you run wrangler dev, but we also now support Vite with our new Vite plugin. This is a great option for those already using Vite’s build tooling and development server — you can continue developing (and testing with Vitest) using Vite’s development server, all using the Workers runtime.
To get started using the Cloudflare Vite plugin, you can scaffold a React application using Vite and our plugin, by running:
The Vite plugin informs Wrangler that this /dist directory contains the project’s built static assets — which, in this case, includes client-side code, some CSS files, and images.
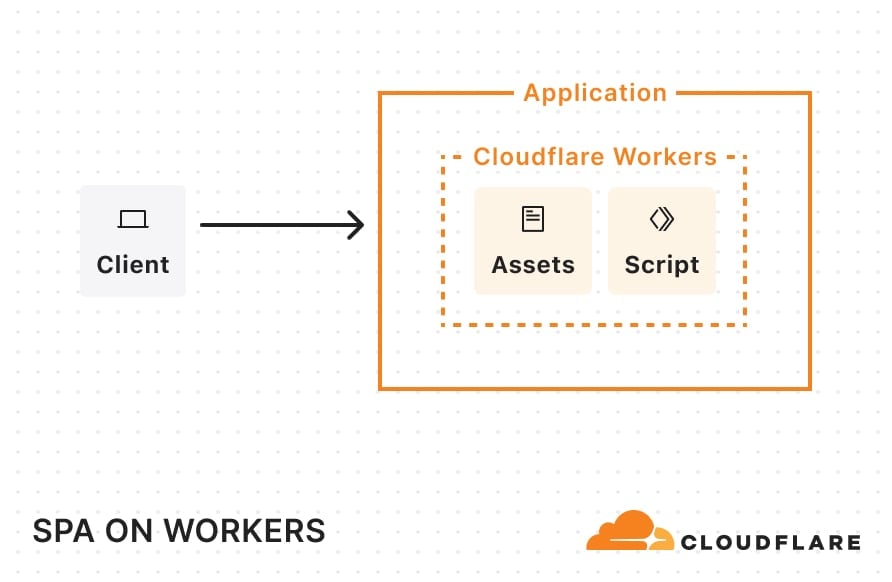
Once deployed, this single-page application (SPA) architecture will look something like this:
When a request comes in, Cloudflare looks at the pathname and automatically serves any static assets that match that pathname. For example, if your static assets directory includes a blog.html file, requests for example.com/blog get that file.
Static sites
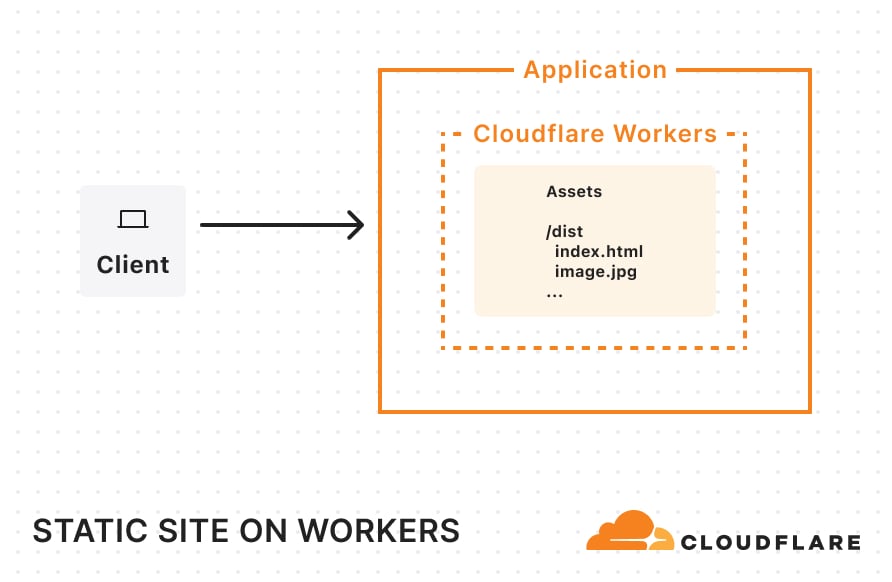
If you have a static site created by a static site generator (SSG) like Astro, all you need to do is create a wrangler.jsonc file (or wrangler.toml) and tell Cloudflare where to find your built assets:
Once you’ve added this configuration, you can simply build your project and run wrangler deploy. Your entire site will then be uploaded and ready for traffic on Workers. Once deployed and requests start flowing in, your static site will be cached across Cloudflare’s network.
You can try starting a fresh Astro project on Workers today by running:
By enabling this, the platform assumes that any navigation request (requests which include a Sec-Fetch-Mode: navigate header) are intended for static assets and will serve up index.html whenever a matching static asset match cannot be found. For non-navigation requests (such as requests for data) that don’t match a static asset, Cloudflare will invoke the Worker script. With this setup, you can render the frontend with React, use a Worker to handle back-end operations, and use Vite to help stitch the two together. This is a great option for porting over older SPAs built with create-react-app, which was recently sunset.
Another thing to note in this Wrangler configuration file: we’ve defined a Hyperdrive binding and enabled Smart Placement. Hyperdrive lets us use an existing database and handles connection pooling. This solves a long-standing challenge of connecting Workers (which run in a highly distributed, serverless environment) directly to traditional databases. By design, Workers operate in lightweight V8 isolates with no persistent TCP sockets and a strict CPU/memory limit. This isolation is great for security and speed, but it makes it difficult to hold open database connections. Hyperdrive addresses these constraints by acting as a “bridge” between Cloudflare’s network and your database, taking care of the heavy lifting of maintaining stable connections or pools so that Workers can reuse them. By turning on Smart Placement, we also ensure that if requests to our Worker originate far from the database (causing latency), Cloudflare can choose to relocate both the Worker—which handles the database connection—and the Hyperdrive “bridge” to a location closer to the database, reducing round-trip times.
SPA example: Worker code
Let’s look at the “Deploy to Cloudflare” example at the top of this blog. In api/index.js, we’ve defined an API (using Hono) which connects to a hosted database through Hyperdrive.
import { Hono } from "hono";
import postgres from "postgres";
import booksRouter from "./routes/books";
import bookRelatedRouter from "./routes/book-related";

const app = new Hono();

// Setup SQL client middleware
app.use("*", async (c, next) => {
 // Create SQL client
 const sql = postgres(c.env.HYPERDRIVE.connectionString, {
   max: 5,
   fetch_types: false,
 });

 c.env.SQL = sql;

 // Process the request
 await next();

 // Close the SQL connection after the response is sent
 c.executionCtx.waitUntil(sql.end());
});

app.route("/api/books", booksRouter);
app.route("/api/books/:id/related", bookRelatedRouter);


export default {
 fetch: app.fetch,
};
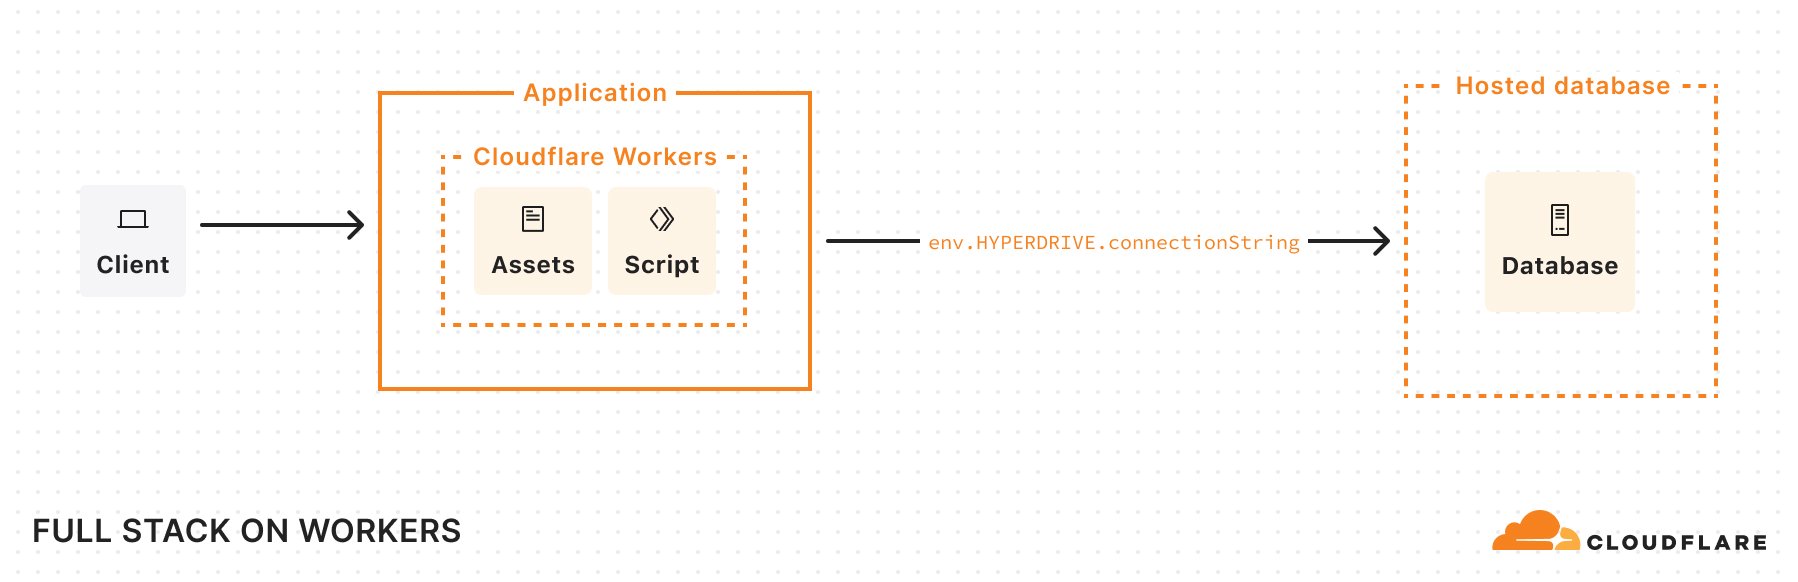
When deployed, our app’s architecture looks something like this:
If Smart Placement moves the placement of my Worker to run closer to my database, it could look like this:
Server-Side Rendering (SSR)
If you want to handle rendering on the server, we support a number of popular full-stack frameworks.
Here’s a version of our previous example, now using React Router v7’s server-side rendering:
Deploy to Workers, with as few changes as possible
Node.js compatibility
We’ve also continued to make progress supporting Node.js APIs, recently adding support for the crypto, tls, net, and dns modules. This allows existing applications and libraries that rely on these Node.js modules to run on Workers. Let’s take a look at an example:
Previously, if you tried to use the mongodb package, you encountered the following error:
Error: [unenv] dns.resolveTxt is not implemented yet!
This occurred when mongodb used the node:dns module to do a DNS lookup of a hostname. Even if you avoided that issue, you would have encountered another error when mongodb tried to use node:tls to securely connect to a database.
Now, you can use mongodb as expected because node:dns and node:tls are supported. The same can be said for libraries relying on node:crypto and node:net.
Additionally, Workers now expose environment variables and secrets on the process.env object when the nodejs_compat compatibility flag is on and the compatibility date is set to 2025-04-01 or beyond. Some libraries (and developers) assume that this object will be populated with variables, and rely on it for top-level configuration. Without the tweak, libraries may have previously broken unexpectedly and developers had to write additional logic to handle variables on Cloudflare Workers.
Now, you can just access your variables as you would in Node.js.
We have also raised the maximum CPU time per Worker request from 30 seconds to 5 minutes. This allows for compute-intensive operations to run for longer without timing out. Say you want to use the newly supported node:crypto module to hash a very large file, you can now do this on Workers without having to rely on external compute for CPU-intensive operations.
Workers Builds
We’ve also made improvements to Workers Builds, which allows you to connect a Git repository to your Worker, so that you can have automatic builds and deployments on every pushed change. Workers Builds was introduced during Builder Day 2024, and initially only allowed you to connect a repository to an existing Worker. Now, you can bring a repository and immediately deploy it as a new Worker, reducing the amount of setup and button clicking needed to bring a project over. We’ve improved the performance of Workers Builds by reducing the latency of build starts by 6 seconds — they now start within 10 seconds on average. We also boosted API responsiveness, achieving a 7x latency improvement thanks to Smart Placement.
Note: On April 2, 2025, Workers Builds transitioned to a new pricing model, as announced during Builder Day 2024. Free plan users are now capped at 3,000 minutes of build time, and Workers Paid subscription users will have a new usage-based model with 6,000 free minutes included and $0.005 per build minute pricing after. To better support concurrent builds, Paid plans will also now get six (6) concurrent builds, making it easier to work across multiple projects and monorepos. For more information on pricing, see the documentation.
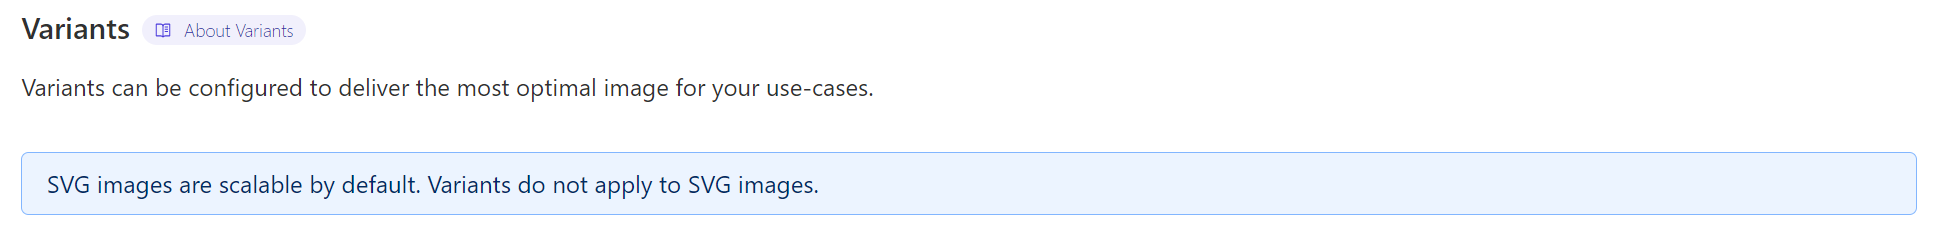
Last week, we wrote a blog post that covers how the Images binding enables more flexible, programmatic workflows for image optimization.
Previously, you could access image optimization features by calling fetch() in your Worker. This method requires the original image to be retrievable by URL. However, you may have cases where images aren’t accessible from a URL, like when you want to compress user-uploaded images before they are uploaded to your storage. With the Images binding, you can directly optimize an image by operating on its body as a stream of bytes.
We’re excited to see what you’ll build, and are focused on new features and improvements to make it easier to create any application on Workers. Much of this work was made even better by community feedback, and we encourage everyone to join our Discord to participate in the discussion.
Browser Rendering API is now available to all paid Workers customers with improved session management
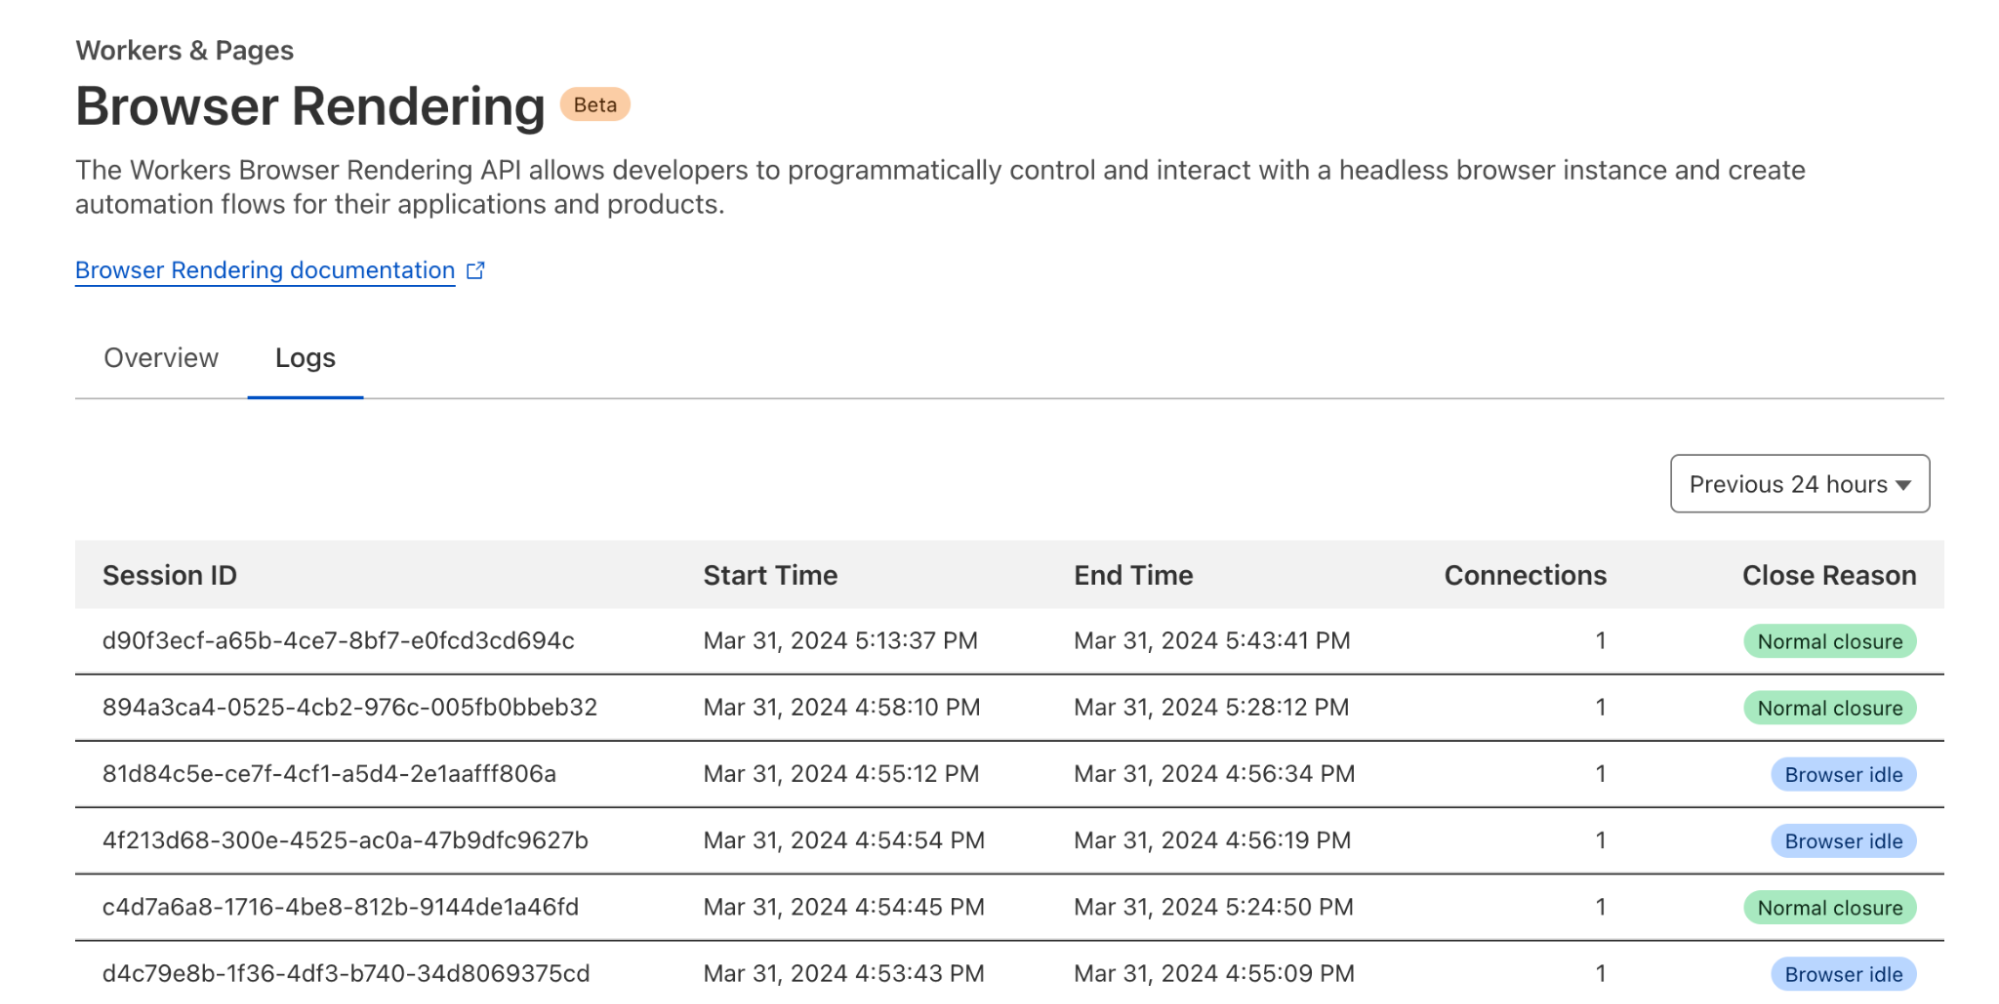
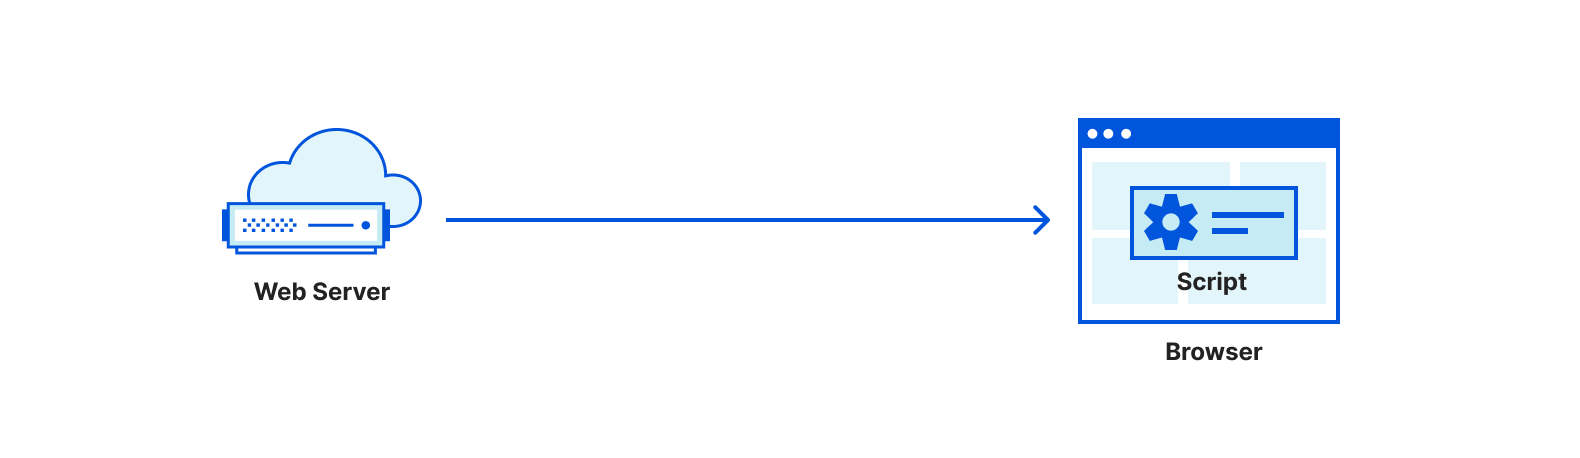
In May 2023, we announced the open beta program for the Browser Rendering API. Browser Rendering allows developers to programmatically control and interact with a headless browser instance and create automation flows for their applications and products.
At the same time, we launched a version of the Puppeteer library that works with Browser Rendering. With that, developers can use a familiar API on top of Cloudflare Workers to create all sorts of workflows, such as taking screenshots of pages or automatic software testing.
Today, we take Browser Rendering one step further, taking it out of beta and making it available to all paid Workers’ plans. Furthermore, we are enhancing our API and introducing a new feature that we’ve been discussing for a long time in the open beta community: session management.
Session Management
Session management allows developers to reuse previously opened browsers across Worker’s scripts. Reusing browser sessions has the advantage that you don’t need to instantiate a new browser for every request and every task, drastically increasing performance and lowering costs.
Before, to keep a browser instance alive and reuse it, you’d have to implement complex code using Durable Objects. Now, we’ve simplified that for you by keeping your browsers running in the background and extending the Puppeteer API with new session management methods that give you access to all of your running sessions, activity history, and active limits.
Observability is an essential part of any Cloudflare product. You can find detailed analytics and logs of your Browser Rendering usage in the dashboard under your account’s Worker & Pages section.
Browser Rendering is now available to all customers with a paid Workers plan. Each account is limited to running two new browsers per minute and two concurrent browsers at no cost during this period. Check our developers page to get started.
We are rolling out access to Cloudflare Snippets
Powerful, programmable, and free of charge, Snippets are the best way to perform complex HTTP request and response modifications on Cloudflare. What was once too advanced to achieve using Rules products is now possible with Snippets. Since the initial announcement during Developer Week 2022, the promise of extending out-of-the-box Rules functionality by writing simple JavaScript code is keeping the Cloudflare community excited.
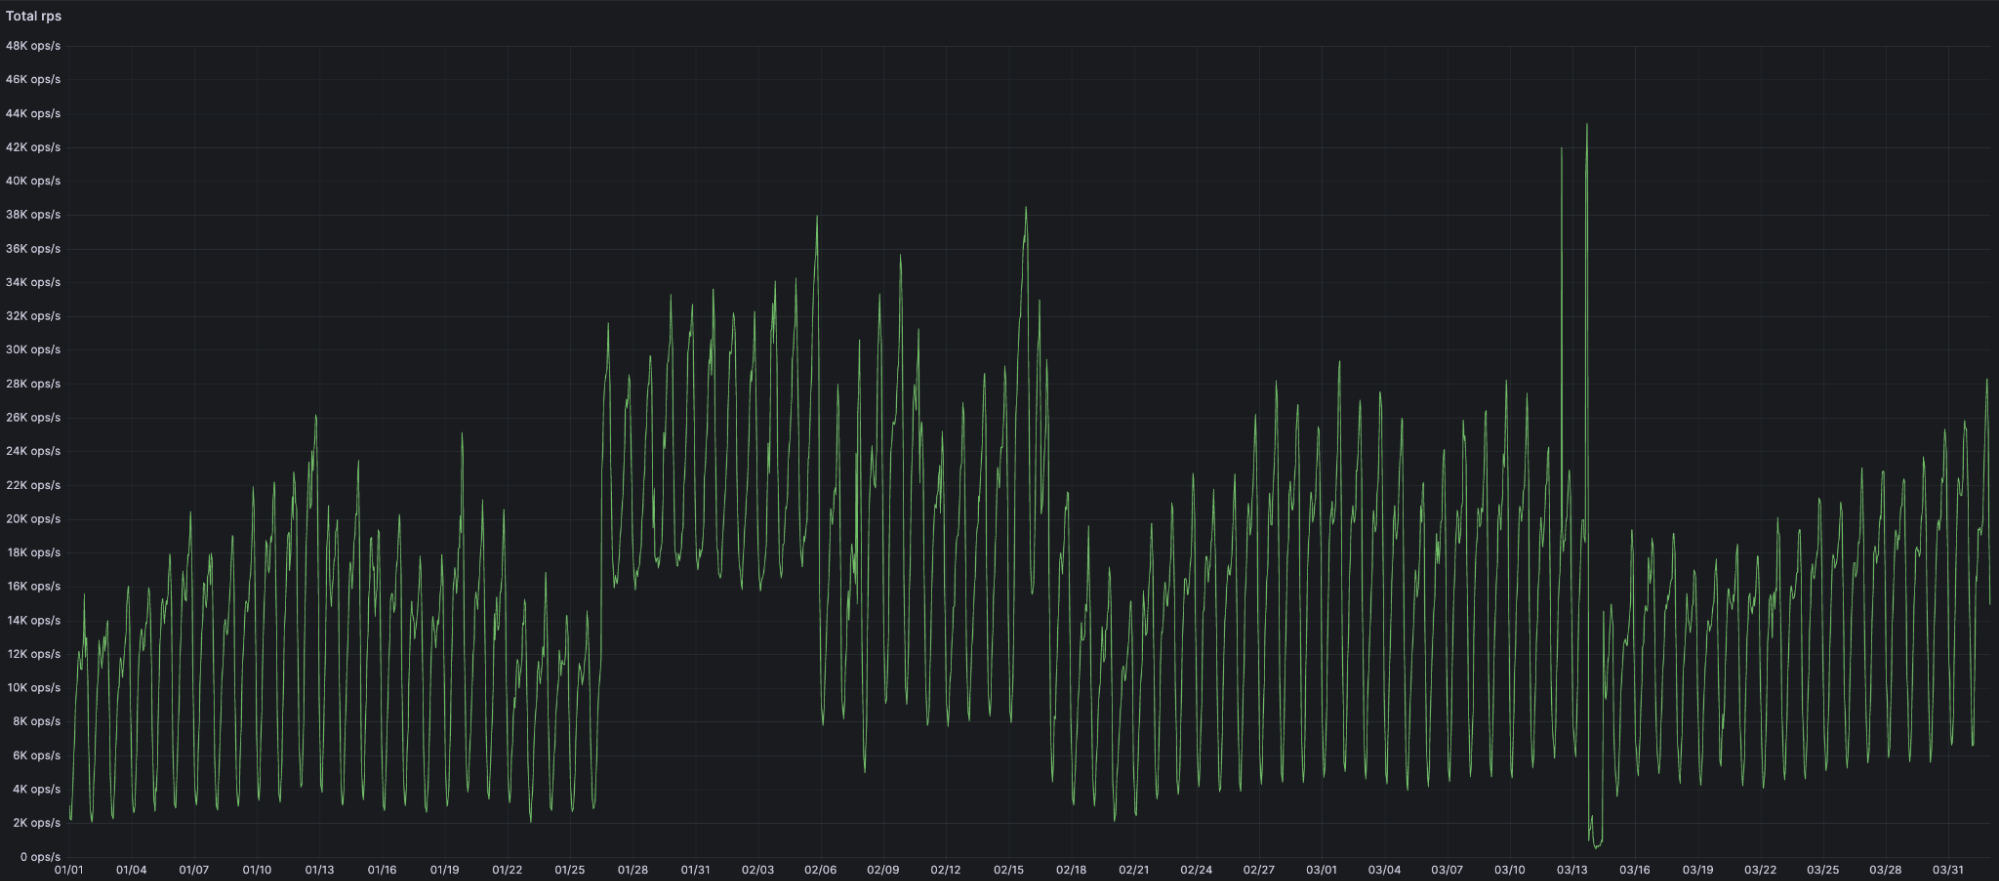
During the first 3 months of 2024 alone, the amount of traffic going through Snippets increased over 7x, from an average of 2,200 requests per second in early January to more than 17,000 in March.
However, instead of opening the floodgates and letting millions of Cloudflare users in to test (and potentially break) Snippets in the most unexpected ways, we are going to pace ourselves and opt for a phased rollout, much like the newly released Gradual Rollouts for Workers.
In the next few weeks, 5% of Cloudflare users will start seeing “Snippets” under the Rules tab of the zone-level menu in their dashboard. If you happen to be part of the first 5%, snip into action and try out how fast and powerful Snippets are even for advanced use cases like dynamically changing the date in headers or A / B testing leveraging the `math.random` function. Whatever you use Snippets for, just keep one thing in mind: this is still an alpha, so please do not use Snippets for production traffic just yet.
Until then, keep your eyes out for the new Snippets tab in the Cloudflare dashboard and learn more how powerful and flexible Snippets are at the developer documentation in the meantime.
Coming soon: asynchronous revalidation with stale-while-revalidate
One of the features most requested by our customers is the asynchronous revalidation with stale-while-revalidate (SWR) cache directive, and we will be bringing this to you in the second half of 2024. This functionality will be available by design as part of our new CDN architecture that is being built using Rust with performance and memory safety at top of mind.
Currently, when a client requests a resource, such as a web page or an image, Cloudflare checks to see if the asset is in cache and provides a cached copy if available. If the file is not in the cache or has expired and become stale, Cloudflare connects to the origin server to check for a fresh version of the file and forwards this fresh version to the end user. This wait time adds latency to these requests and impacts performance.
Stale-while-revalidate is a cache directive that allows the expired or stale version of the asset to be served to the end user while simultaneously allowing Cloudflare to check the origin to see if there’s a fresher version of the resource available. If an updated version exists, the origin forwards it to Cloudflare, updating the cache in the process. This mechanism allows the client to receive a response quickly from the cache while ensuring that it always has access to the most up-to-date content. Stale-while-revalidate strikes a balance between serving content efficiently and ensuring its freshness, resulting in improved performance and a smoother user experience.
Customers who want to be part of our beta testers and “cache” in on the fun can register here, and we will let you know when the feature is ready for testing!
Coming on April 16, 2024: Workers for Platforms for our pay-as-you-go plan
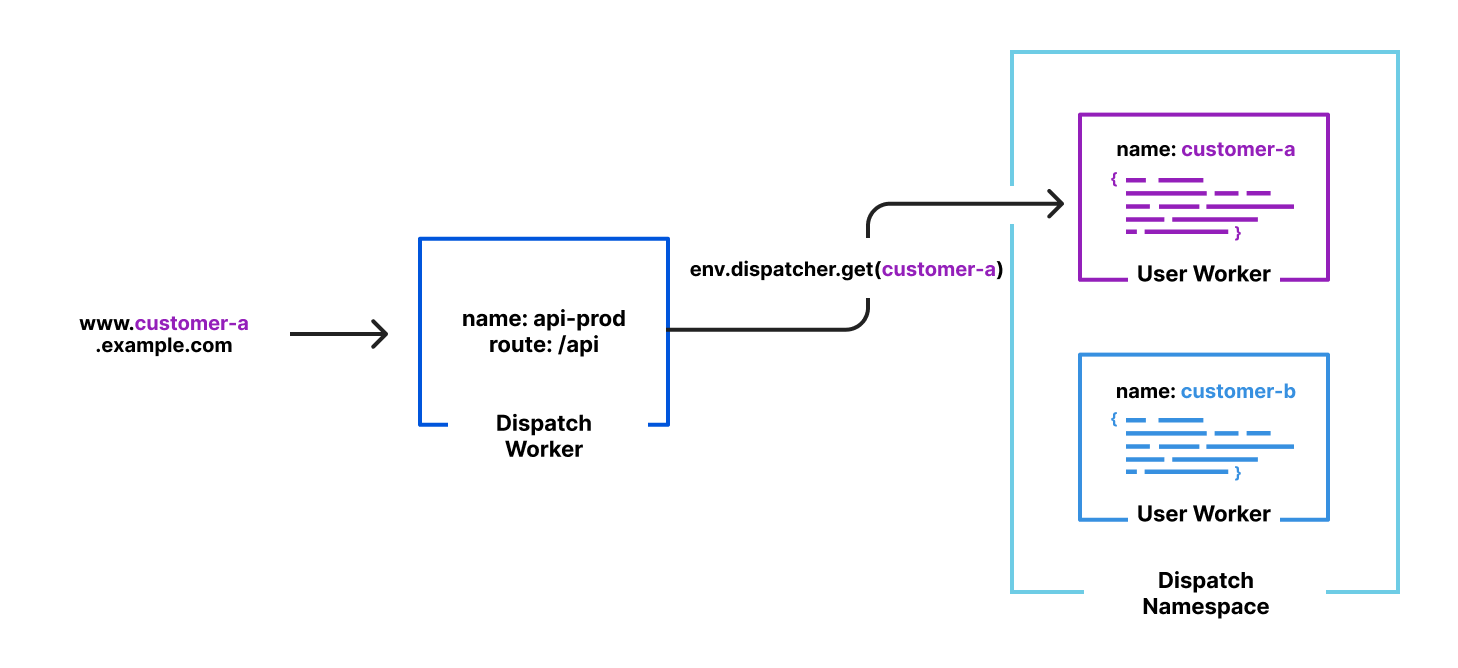
Today, we’re excited to share that on April 16th, Workers for Platforms will be available to all developers through our new $25 pay-as-you-go plan!
Workers for Platforms is changing the way we build software – it gives you the ability to embed personalization and customization directly into your product. With Workers for Platforms, you can deploy custom code on behalf of your users or let your users directly deploy their own code to your platform, without you or your users having to manage any infrastructure. You can use Workers for Platforms with all the exciting announcements that have come out this Developer Week – it supports all the bindings that come with Workers (including Workers AI, D1 and Durable Objects) as well as Python Workers.
Here’s what some of our customers – ranging from enterprises to startups – are building on Workers for Platforms:
Shopify Oxygen is a hosting platform for their Remix-based eCommerce framework Hydrogen, and it’s built on Workers for Platforms! The Hydrogen/Oxygen combination gives Shopify merchants control over their buyer experience without the restrictions of generic storefront templates.
Grafbase is a data platform for developers to create a serverless GraphQL API that unifies data sources across a business under one endpoint. They use Workers for Platforms to give their developers the control and flexibility to deploy their own code written in JavaScript/TypeScript or WASM.
Triplit is an open-source database that syncs data between server and browser in real-time. It allows users to build low latency, real-time applications with features like relational querying, schema management and server-side storage built in. Their query and sync engine is built on top of Durable Objects, and they’re using Workers for Platforms to allow their customers to package custom Javascript alongside their Triplit DB instance.
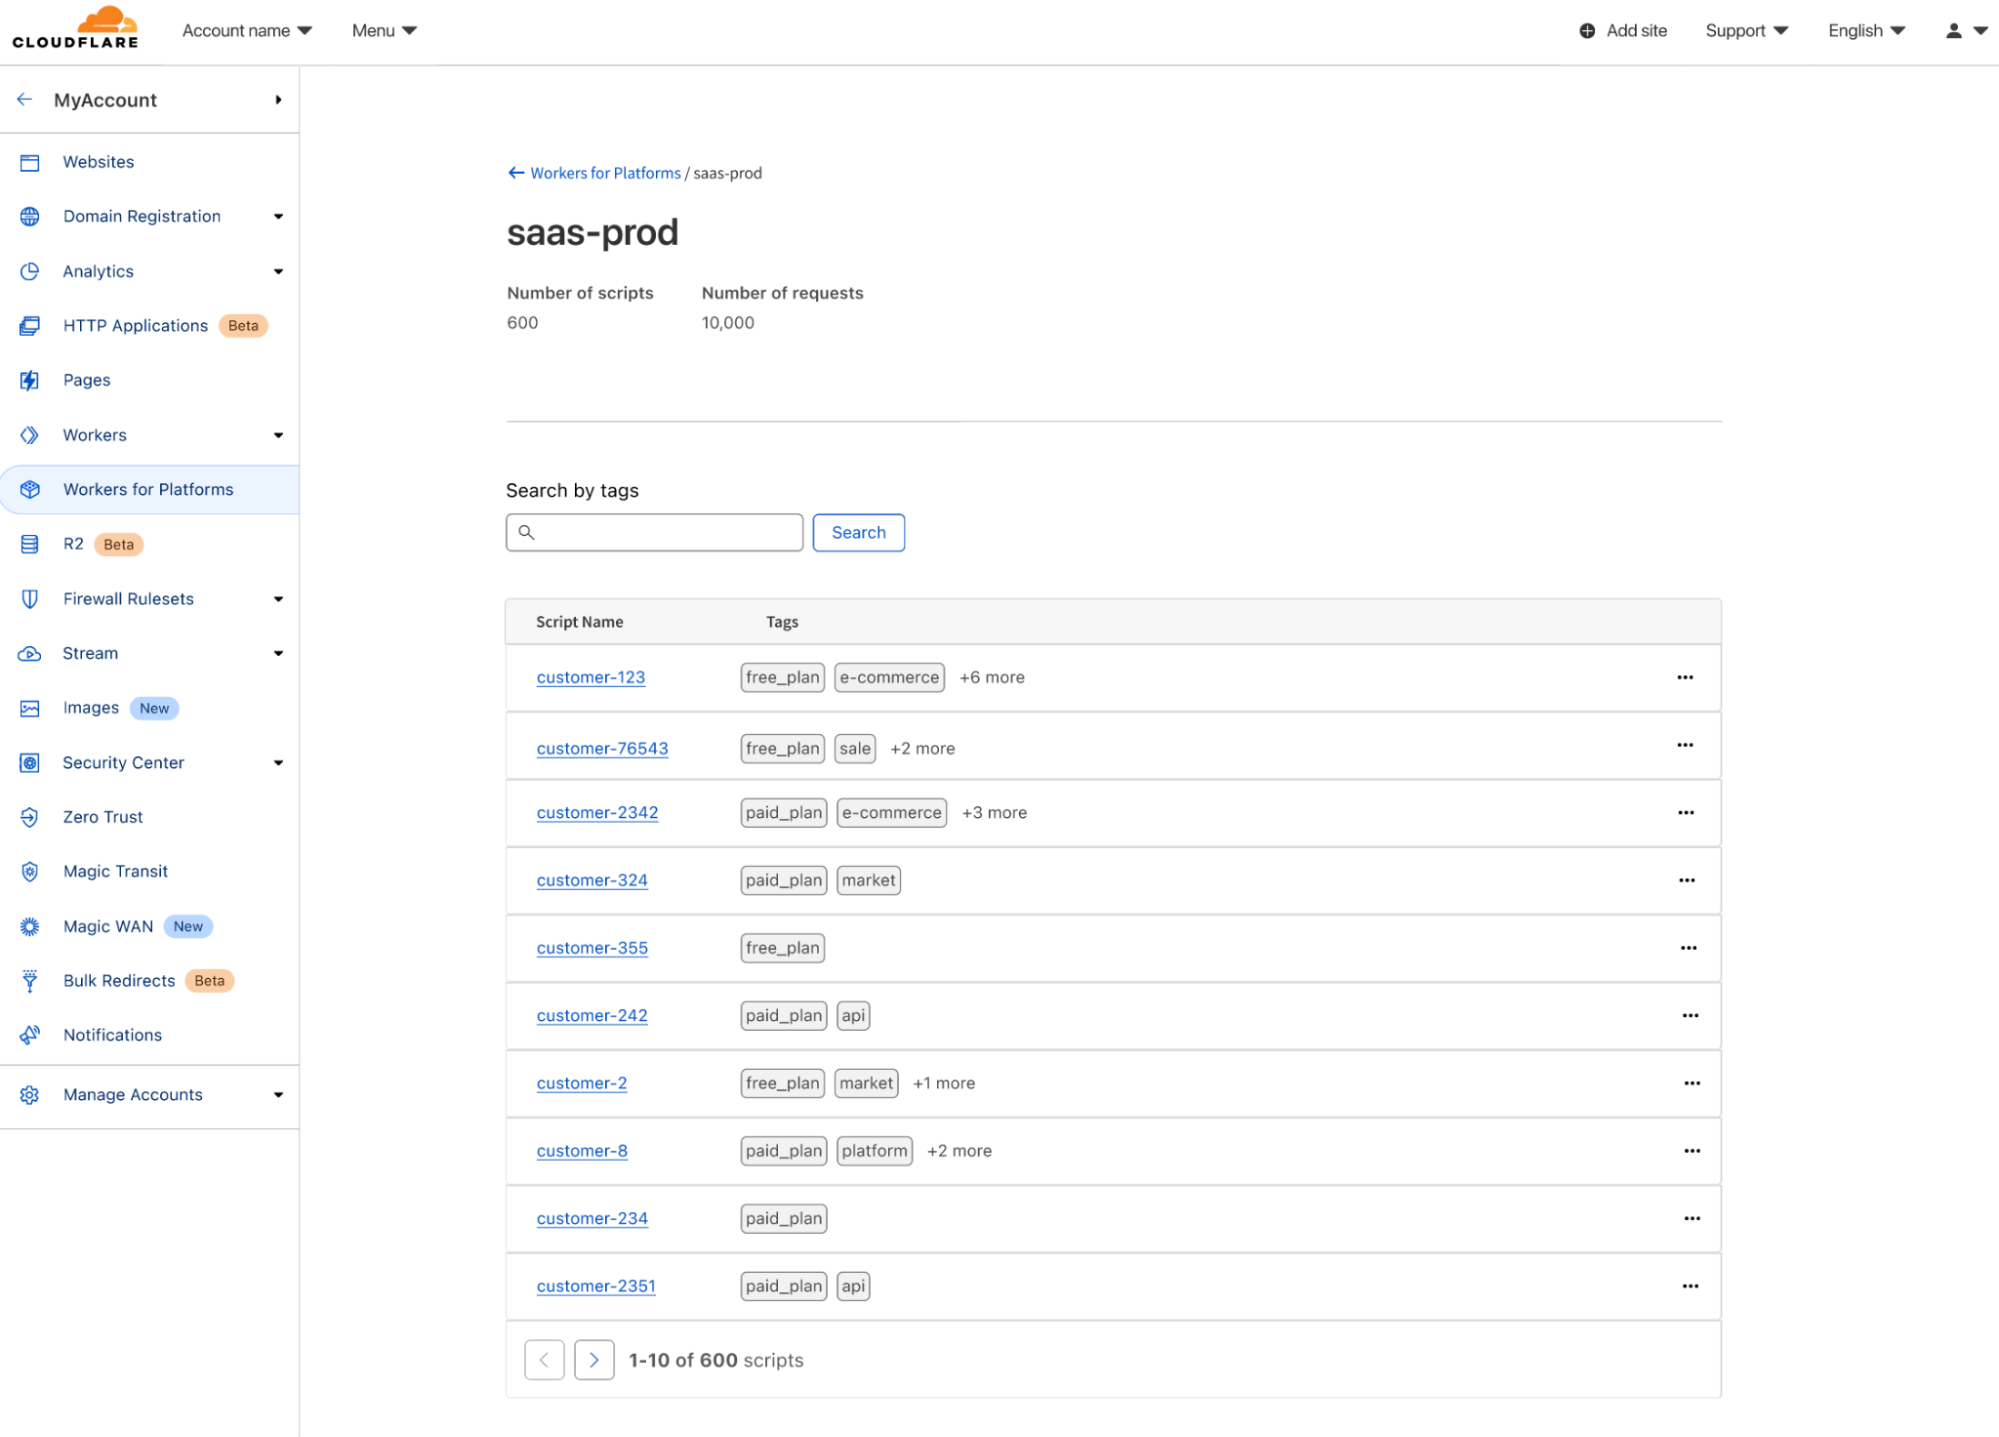
Tools for observability and platform level controls
Workers for Platforms doesn’t just allow you to deploy Workers to your platform – we also know how important it is to have observability and control over your users’ Workers. We have a few solutions that help with this:
Custom Limits: Set CPU time or subrequest caps on your users’ Workers. Can be used to set limits in order to control your costs on Cloudflare and/or shape your own pricing and packaging model. For example, if you run a freemium model on your platform, you can lower the CPU time limit for customers on your free tier.
Tail Workers: Tail Worker events contain metadata about the Worker, console.log() messages, and capture any unhandled exceptions. They can be used to provide your developers with live logging in order to monitor for errors and troubleshoot in real time.
Outbound Workers: Get visibility into all outgoing requests from your users’ Workers. Outbound Workers sit between user Workers and the fetch() requests they make, so you get full visibility over the request before it’s sent out to the Internet.
Pricing
We wanted to make sure that Workers for Platforms was affordable for hobbyists, solo developers, and indie developers. Workers for Platforms is part of a new $25 pay-as-you-go plan, and it includes the following:
Included Amounts
Requests
20 million requests/month +$0.30 per additional million
CPU time
60 million CPU milliseconds/month +$0.02 per additional million CPU milliseconds
Scripts
1000 scripts +0.02 per additional script/month
Workers for Platforms will be available to purchase on April 16, 2024!
The Workers for Platforms will be available to purchase under the Workers for Platforms tab on the Cloudflare Dashboard on April 16, 2024.
Welcome to Tuesday – our AI day of Developer Week 2024! In this blog post, we’re excited to share an overview of our new AI announcements and vision, including news about Workers AI officially going GA with improved pricing, a GPU hardware momentum update, an expansion of our Hugging Face partnership, Bring Your Own LoRA fine-tuned inference, Python support in Workers, more providers in AI Gateway, and Vectorize metadata filtering.
Workers AI GA
Today, we’re excited to announce that our Workers AI inference platform is now Generally Available. After months of being in open beta, we’ve improved our service with greater reliability and performance, unveiled pricing, and added many more models to our catalog.
Improved performance & reliability
With Workers AI, our goal is to make AI inference as reliable and easy to use as the rest of Cloudflare’s network. Under the hood, we’ve upgraded the load balancing that is built into Workers AI. Requests can now be routed to more GPUs in more cities, and each city is aware of the total available capacity for AI inference. If the request would have to wait in a queue in the current city, it can instead be routed to another location, getting results back to you faster when traffic is high. With this, we’ve increased rate limits across all our models – most LLMs now have a of 300 requests per minute, up from 50 requests per minute during our beta phase. Smaller models have a limit of 1500-3000 requests per minute. Check out our Developer Docs for the rate limits of individual models.
Lowering costs on popular models
Alongside our GA of Workers AI, we published a pricing calculator for our 10 non-beta models earlier this month. We want Workers AI to be one of the most affordable and accessible solutions to run inference, so we added a few optimizations to our models to make them more affordable. Now, Llama 2 is over 7x cheaper and Mistral 7B is over 14x cheaper to run than we had initially published on March 1. We want to continue to be the best platform for AI inference and will continue to roll out optimizations to our customers when we can.
As a reminder, our billing for Workers AI started on April 1st for our non-beta models, while beta models remain free and unlimited. We offer 10,000 neurons per day for free to all customers. Workers Free customers will encounter a hard rate limit after 10,000 neurons in 24 hours while Workers Paid customers will incur usage at $0.011 per 1000 additional neurons. Read our Workers AI Pricing Developer Docs for the most up-to-date information on pricing.
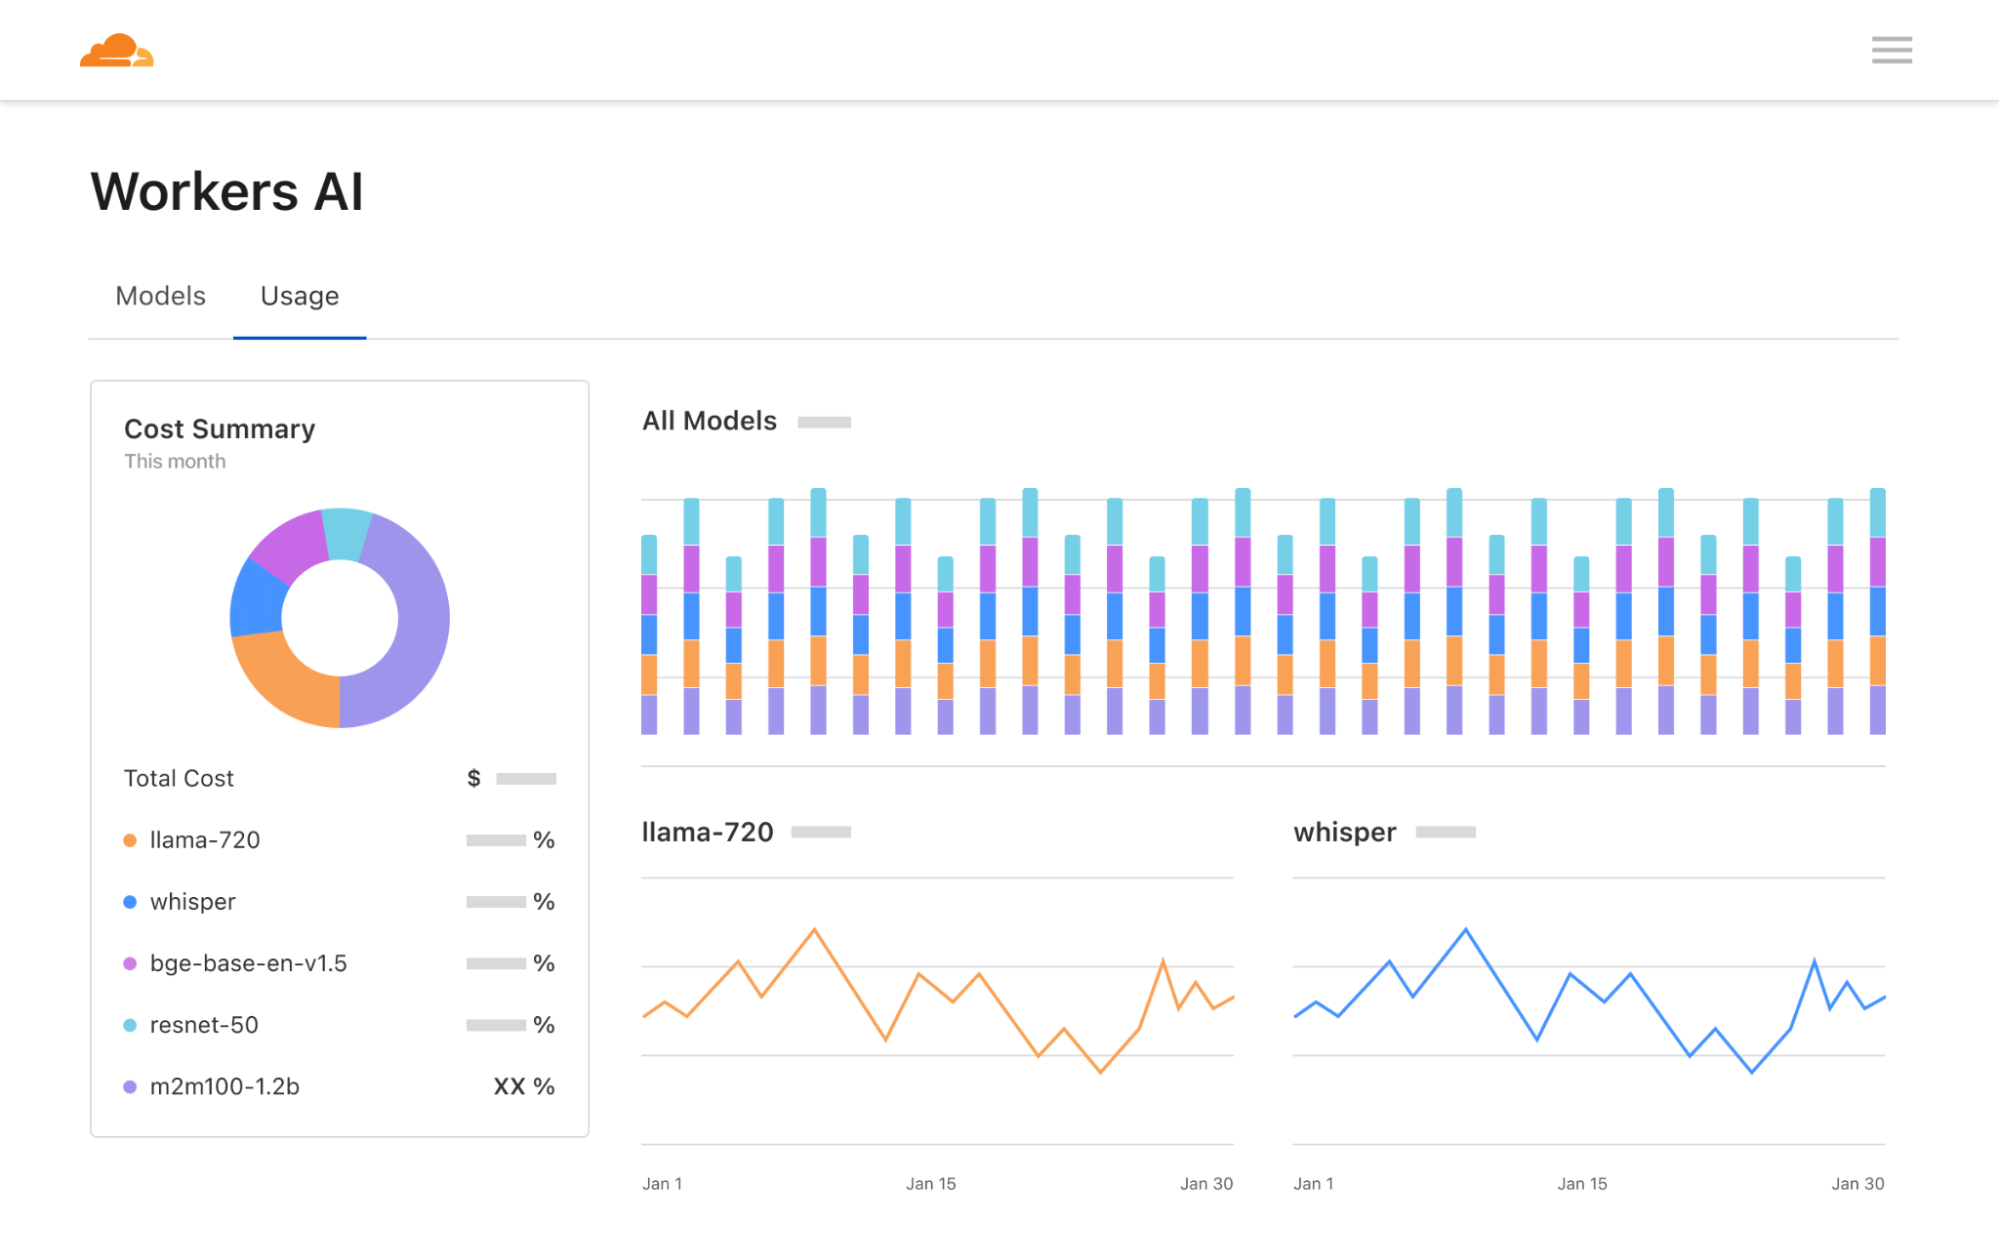
New dashboard and playground
Lastly, we’ve revamped our Workers AI dashboard and AI playground. The Workers AI page in the Cloudflare dashboard now shows analytics for usage across models, including neuron calculations to help you better predict pricing. The AI playground lets you quickly test and compare different models and configure prompts and parameters. We hope these new tools help developers start building on Workers AI seamlessly – go try them out!
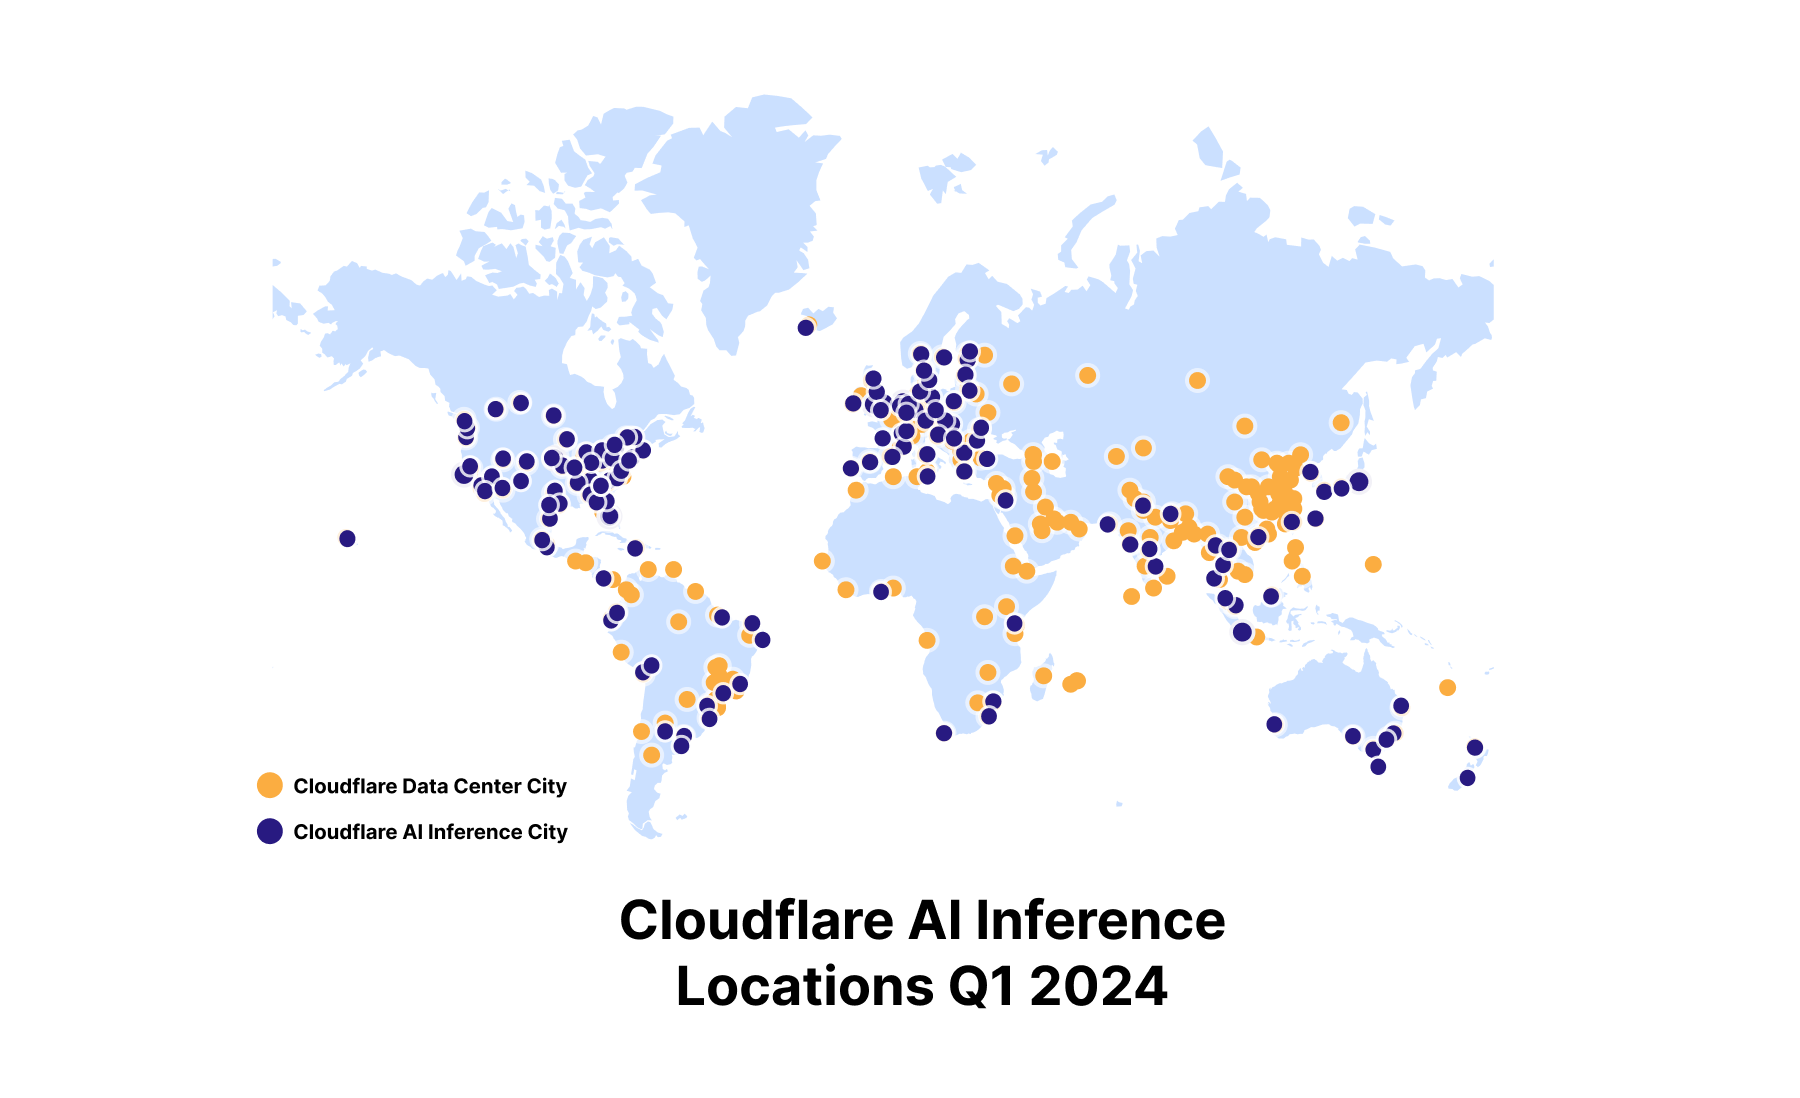
Run inference on GPUs in over 150 cities around the world
When we announced Workers AI back in September 2023, we set out to deploy GPUs to our data centers around the world. We plan to deliver on that promise and deploy inference-tuned GPUs almost everywhere by the end of 2024, making us the most widely distributed cloud-AI inference platform. We have over 150 cities with GPUs today and will continue to roll out more throughout the year.
We also have our next generation of compute servers with GPUs launching in Q2 2024, which means better performance, power efficiency, and improved reliability over previous generations. We provided a preview of our Gen 12 Compute servers design in a December 2023 blog post, with more details to come. With Gen 12 and future planned hardware launches, the next step is to support larger machine learning models and offer fine-tuning on our platform. This will allow us to achieve higher inference throughput, lower latency and greater availability for production workloads, as well as expanding support to new categories of workloads such as fine-tuning.
Hugging Face Partnership
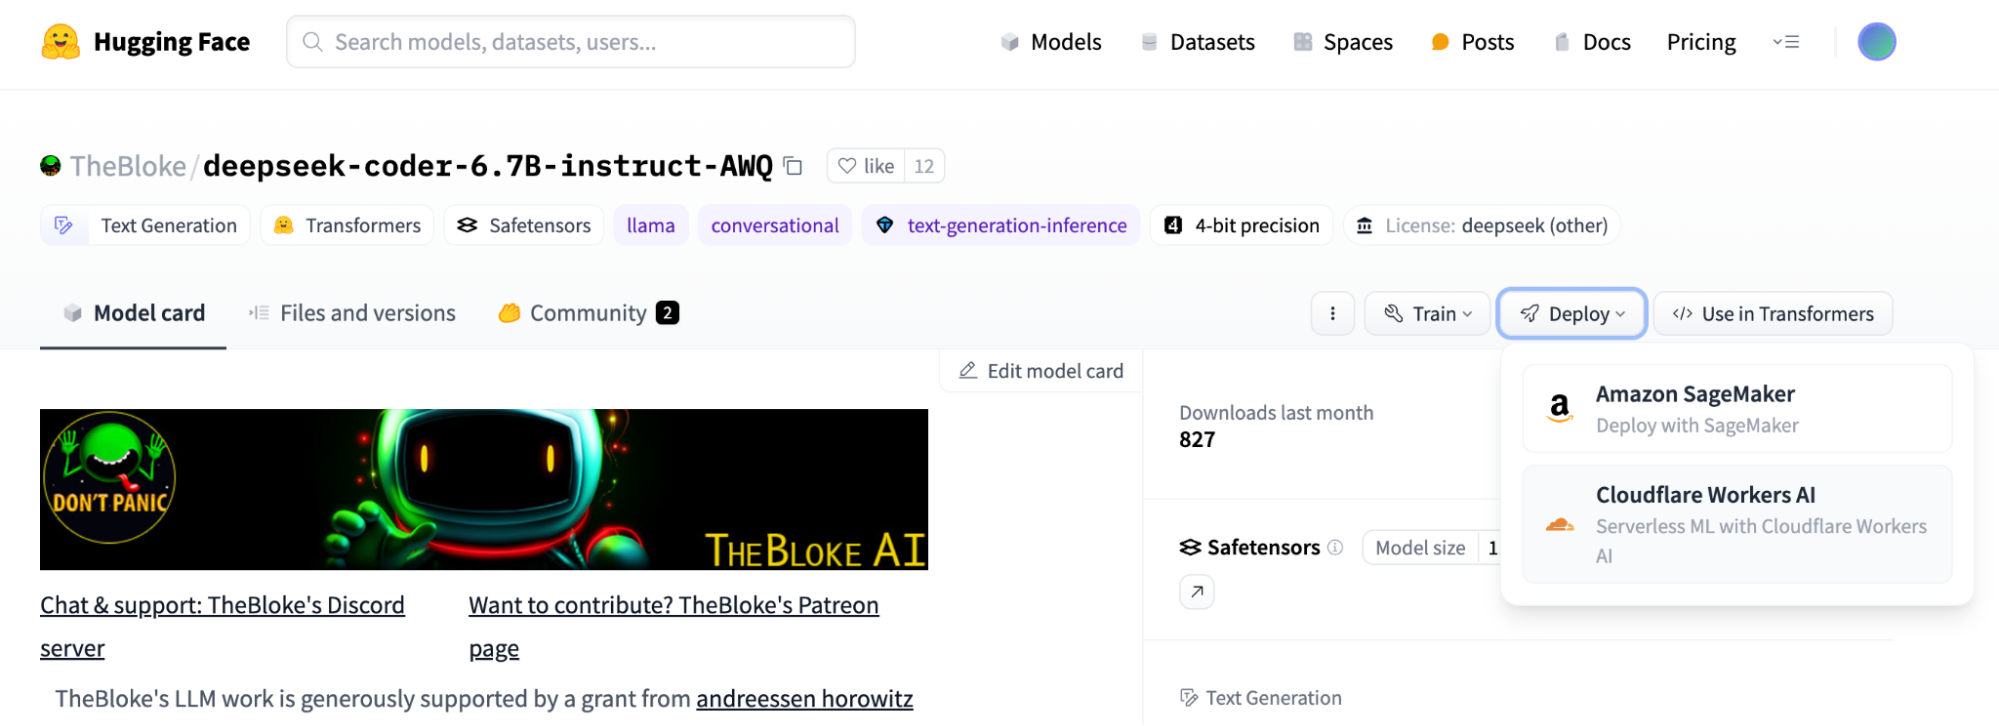
We’re also excited to continue our partnership with Hugging Face in the spirit of bringing the best of open-source to our customers. Now, you can visit some of the most popular models on Hugging Face and easily click to run the model on Workers AI if it is available on our platform.
We’re happy to announce that we’ve added 4 more models to our platform in conjunction with Hugging Face. You can now access the new Mistral 7B v0.2 model with improved context windows, Nous Research’s Hermes 2 Pro fine-tuned version of Mistral 7B, Google’s Gemma 7B, and Starling-LM-7B-beta fine-tuned from OpenChat. There are currently 14 models that we’ve curated with Hugging Face to be available for serverless GPU inference powered by Cloudflare’s Workers AI platform, with more coming soon. These models are all served using Hugging Face’s technology with a TGI backend, and we work closely with the Hugging Face team to curate, optimize, and deploy these models.
“We are excited to work with Cloudflare to make AI more accessible to developers. Offering the most popular open models with a serverless API, powered by a global fleet of GPUs is an amazing proposition for the Hugging Face community, and I can’t wait to see what they build with it.” – Julien Chaumond, Co-founder and CTO, Hugging Face
You can find all of the open models supported in Workers AI in this Hugging Face Collection, and the “Deploy to Cloudflare Workers AI” button is at the top of each model card. To learn more, read Hugging Face’s blog post and take a look at our Developer Docs to get started. Have a model you want to see on Workers AI? Send us a message on Discord with your request.
Supporting fine-tuned inference – BYO LoRAs
Fine-tuned inference is one of our most requested features for Workers AI, and we’re one step closer now with Bring Your Own (BYO) LoRAs. Using the popular Low-Rank Adaptation method, researchers have figured out how to take a model and adapt some model parameters to the task at hand, rather than rewriting all model parameters like you would for a fully fine-tuned model. This means that you can get fine-tuned model outputs without the computational expense of fully fine-tuning a model.
We now support bringing trained LoRAs to Workers AI, where we apply the LoRA adapter to a base model at runtime to give you fine-tuned inference, at a fraction of the cost, size, and speed of a fully fine-tuned model. In the future, we want to be able to support fine-tuning jobs and fully fine-tuned models directly on our platform, but we’re excited to be one step closer today with LoRAs.
const response = await ai.run(
  "@cf/mistralai/mistral-7b-instruct-v0.2-lora", //the model supporting LoRAs
  {
      messages: [{"role": "user", "content": "Hello world"],
      raw: true, //skip applying the default chat template
      lora: "00000000-0000-0000-0000-000000000", //the finetune id OR name
  }
);
BYO LoRAs is in open beta as of today for Gemma 2B and 7B, Llama 2 7B and Mistral 7B models with LoRA adapters up to 100MB in size and max rank of 8, and up to 30 total LoRAs per account. As always, we expect you to use Workers AI and our new BYO LoRA feature with our Terms of Service in mind, including any model-specific restrictions on use contained in the models’ license terms.
Python is the second most popular programming language in the world (after JavaScript) and the language of choice for building AI applications. And starting today, in open beta, you can now write Cloudflare Workers in Python. Python Workers support all bindings to resources on Cloudflare, including Vectorize, D1, KV, R2 and more.
…and are configured by simply pointing at a .py file in your wrangler.toml:
name = "hello-world-python-worker"
main = "src/entry.py"
compatibility_date = "2024-03-18"
compatibility_flags = ["python_workers"]
There are no extra toolchain or precompilation steps needed. The Pyodide Python execution environment is provided for you, directly by the Workers runtime, mirroring how Workers written in JavaScript already work.
There’s lots more to dive into — take a look at the docs, and check out our companion blog post for details about how Python Workers work behind the scenes.
AI Gateway now supports Anthropic, Azure, AWS Bedrock, Google Vertex, and Perplexity
Our AI Gateway product helps developers better control and observe their AI applications, with analytics, caching, rate limiting, and more. We are continuing to add more providers to the product, including Anthropic, Google Vertex, and Perplexity, which we’re excited to announce today. We quietly rolled out Azure and Amazon Bedrock support in December 2023, which means that the most popular providers are now supported via AI Gateway, including Workers AI itself.
Take a look at our Developer Docs to get started with AI Gateway.
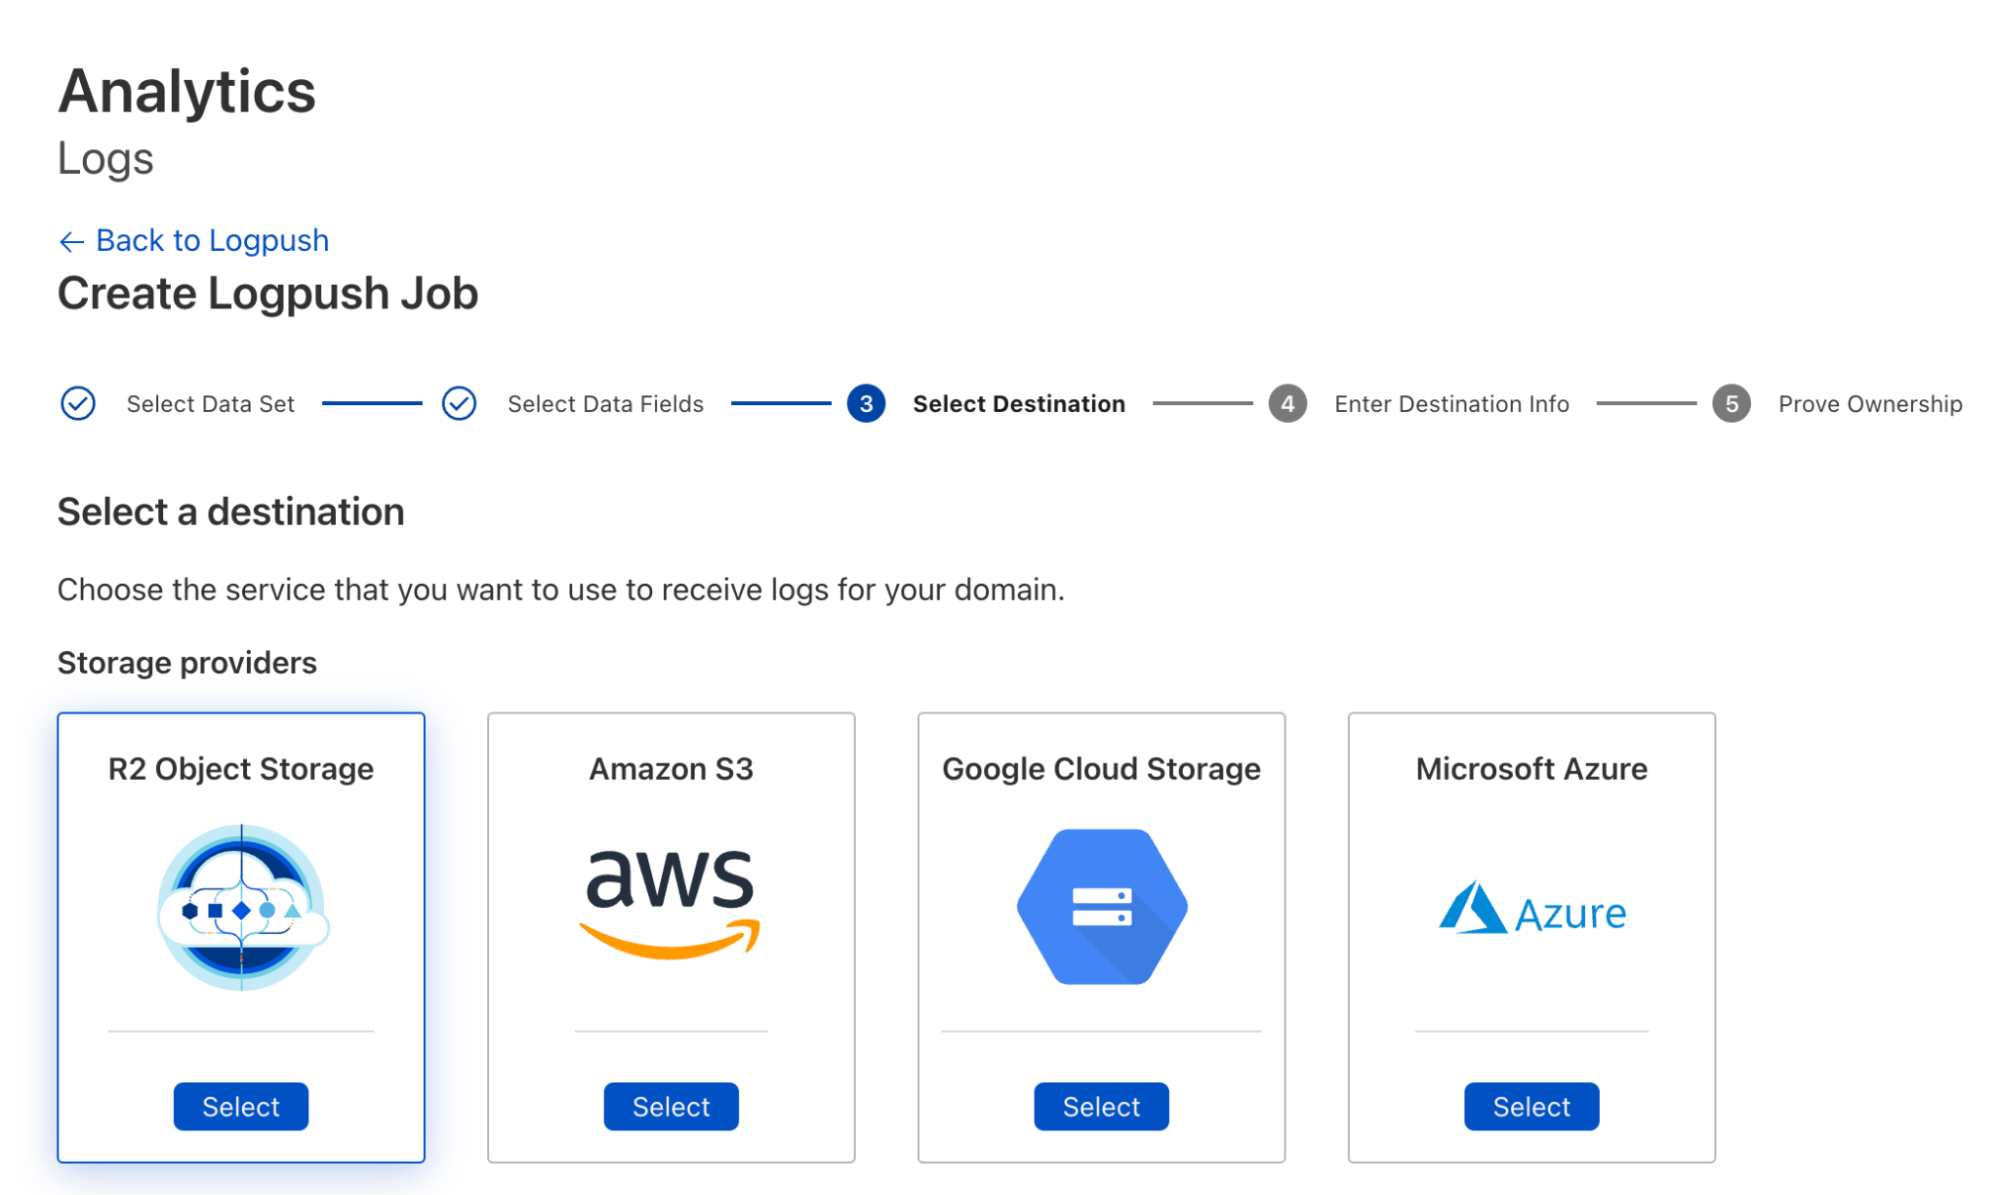
Coming soon: Persistent Logs
In Q2 of 2024, we will be adding persistent logs so that you can push your logs (including prompts and responses) to object storage, custom metadata so that you can tag requests with user IDs or other identifiers, and secrets management so that you can securely manage your application’s API keys.
We want AI Gateway to be the control plane for your AI applications, allowing developers to dynamically evaluate and route requests to different models and providers. With our persistent logs feature, we want to enable developers to use their logged data to fine-tune models in one click, eventually running the fine-tune job and the fine-tuned model directly on our Workers AI platform. AI Gateway is just one product in our AI toolkit, but we’re excited about the workflows and use cases it can unlock for developers building on our platform, and we hope you’re excited about it too.
Vectorize metadata filtering and future GA of million vector indexes
Vectorize is another component of our toolkit for AI applications. In open beta since September 2023, Vectorize allows developers to persist embeddings (vectors), like those generated from Workers AI text embedding models, and query for the closest match to support use cases like similarity search or recommendations. Without a vector database, model output is forgotten and can’t be recalled without extra costs to re-run a model.
Since Vectorize’s open beta, we’ve added metadata filtering. Metadata filtering lets developers combine vector search with filtering for arbitrary metadata, supporting the query complexity in AI applications. We’re laser-focused on getting Vectorize ready for general availability, with an target launch date of June 2024, which will include support for multi-million vector indexes.
The most comprehensive Developer Platform to build AI applications
On Cloudflare’s Developer Platform, we believe that all developers should be able to quickly build and ship full-stack applications – and that includes AI experiences as well. With our GA of Workers AI, announcements for Python support in Workers, AI Gateway, and Vectorize, and our partnership with Hugging Face, we’ve expanded the world of possibilities for what you can build with AI on our platform. We hope you are as excited as we are – take a look at all our Developer Docs to get started, and let us know what you build.
File upload is a common feature in many web applications. Applications may allow users to upload files like images of flood damage to file an insurance claim, PDFs like resumes or cover letters to apply for a job, or other documents like receipts or income statements. However, beneath the convenience lies a potential threat, since allowing unrestricted file uploads can expose the web server and your enterprise network to significant risks related to security, privacy, and compliance.
Cloudflare recently introduced WAF Content Scanning, our in-line malware file detection and prevention solution to stop malicious files from reaching the web server, offering our Enterprise WAF customers an additional line of defense against security threats.
Today, we’re pleased to announce that the feature is now generally available. It will be automatically rolled out to existing WAF Content Scanning customers before the end of March 2024.
In this blog post we will share more details about the new version of the feature, what we have improved, and reveal some of the technical challenges we faced while building it. This feature is available to Enterprise WAF customers as an add-on license, contact your account team to get it.
What to expect from the new version?
The feedback from the early access version has resulted in additional improvements. The main one is expanding the maximum size of scanned files from 1 MB to 15 MB. This change required a complete redesign of the solution’s architecture and implementation. Additionally, we are improving the dashboard visibility and the overall analytics experience.
Let’s quickly review how malware scanning operates within our WAF.
Behind the scenes
WAF Content Scanning operates in a few stages: users activate and configure it, then the scanning engine detects which requests contain files, the files are sent to the scanner returning the scan result fields, and finally users can build custom rules with these fields. We will dig deeper into each step in this section.
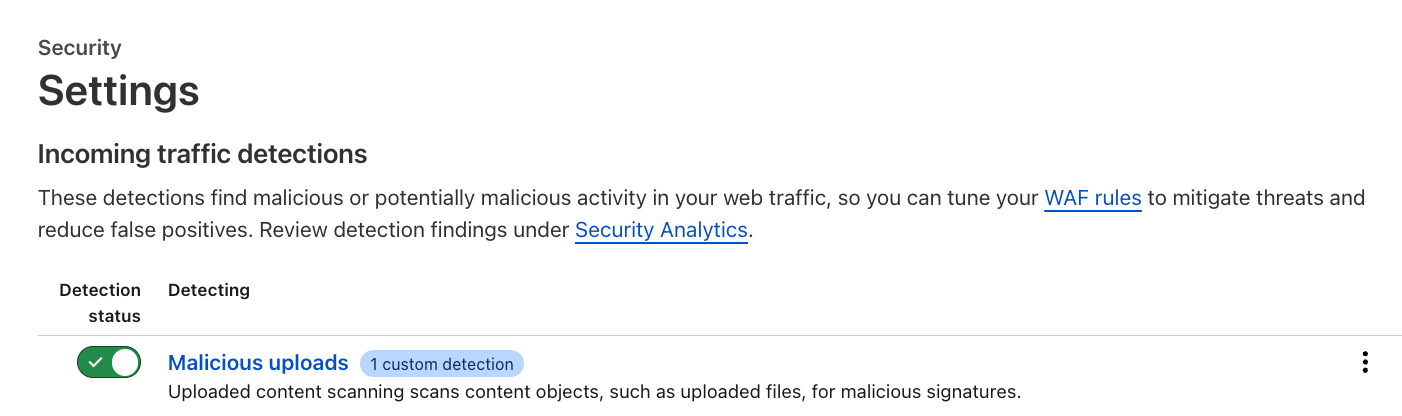
Activate and configure
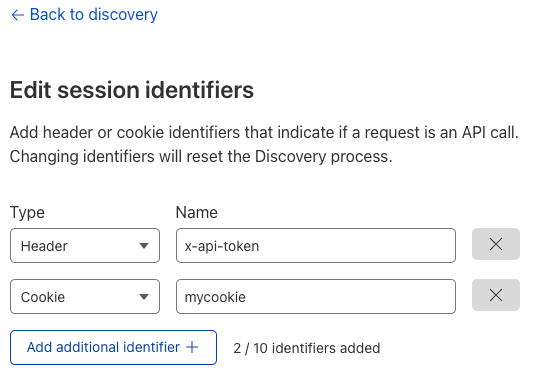
Customers can enable the feature via the API, or through the Settings page in the dashboard (Security → Settings) where a new section has been added for incoming traffic detection configuration and enablement. As soon as this action is taken, the enablement action gets distributed to the Cloudflare network and begins scanning incoming traffic.
Customers can also add a custom configuration depending on the file upload method, such as a base64 encoded file in a JSON string, which allows the specified file to be parsed and scanned automatically.
In the example below, the customer wants us to look at JSON bodies for the key “file” and scan them.
As soon as the feature is activated and configured, the scanning engine runs the pre-scanning logic, and identifies content automatically via heuristics. In this case, the engine logic does not rely on the Content-Type header, as it’s easy for attackers to manipulate. When relevant content or a file has been found, the engine connects to the antivirus (AV) scanner in our Zero Trust solution to perform a thorough analysis and return the results of the scan. The engine uses the scan results to propagate useful fields that customers can use.
Integrate with WAF
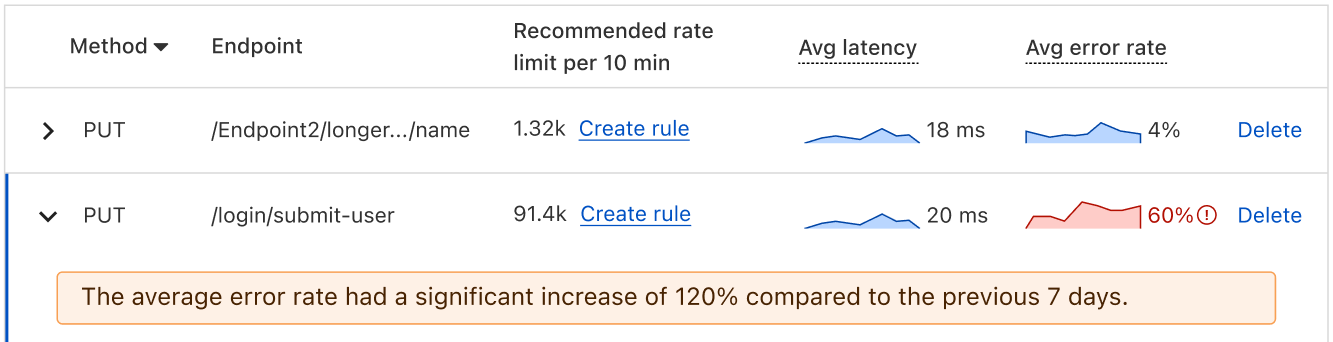
For every request where a file is found, the scanning engine returns various fields, including:
The scanning engine integrates with the WAF where customers can use those fields to create custom WAF rules to address various use cases. The basic use case is primarily blocking malicious files from reaching the web server. However, customers can construct more complex logic, such as enforcing constraints on parameters such as file sizes, file types, endpoints, or specific paths.
In-line scanning limitations and file types
One question that often comes up is about the file types we detect and scan in WAF Content Scanning. Initially, addressing this query posed a challenge since HTTP requests do not have a definition of a “file”, and scanning all incoming HTTP requests does not make sense as it adds extra processing and latency. So, we had to decide on a definition to spot HTTP requests that include files, or as we call it, “uploaded content”.
The WAF Content Scanning engine makes that decision by filtering out certain content types identified by heuristics. Any content types not included in a predefined list, such as text/html, text/x-shellscript, application/json, and text/xml, are considered uploaded content and are sent to the scanner for examination. This allows us to scan a wide range of content types and file types without affecting the performance of all requests by adding extra processing. The wide range of files we scan includes:
Executable (e.g., .exe, .bat, .dll, .wasm)
Documents (e.g., .doc, .docx, .pdf, .ppt, .xls)
Compressed (e.g., .7z, .gz, .zip, .rar)
Image (e.g., .jpg, .png, .gif, .webp, .tif)
Video and audio files within the 15 MB file size range.
The file size scanning limit of 15 Megabytes comes from the fact that the in-line file scanning as a feature is running in real time, which offers safety to the web server and instant access to clean files, but also impacts the whole request delivery process. Therefore, it’s crucial to scan the payload without causing significant delays or interruptions; namely increased CPU time and latency.
Scaling the scanning process to 15 MB
In the early design of the product, we built a system that could handle requests with a maximum body size of 1 MB, and increasing the limit to 15 MB had to happen without adding any extra latency. As mentioned, this latency is not added to all requests, but only to the requests that have uploaded content. However, increasing the size with the same design would have increased the latency by 15x for those requests.
In this section, we discuss how we previously managed scanning files embedded in JSON request bodies within the former architecture as an example, and why it was challenging to expand the file size using the same design, then compare the same example with the changes made in the new release to overcome the extra latency in details.
Old architecture used for the Early Access release
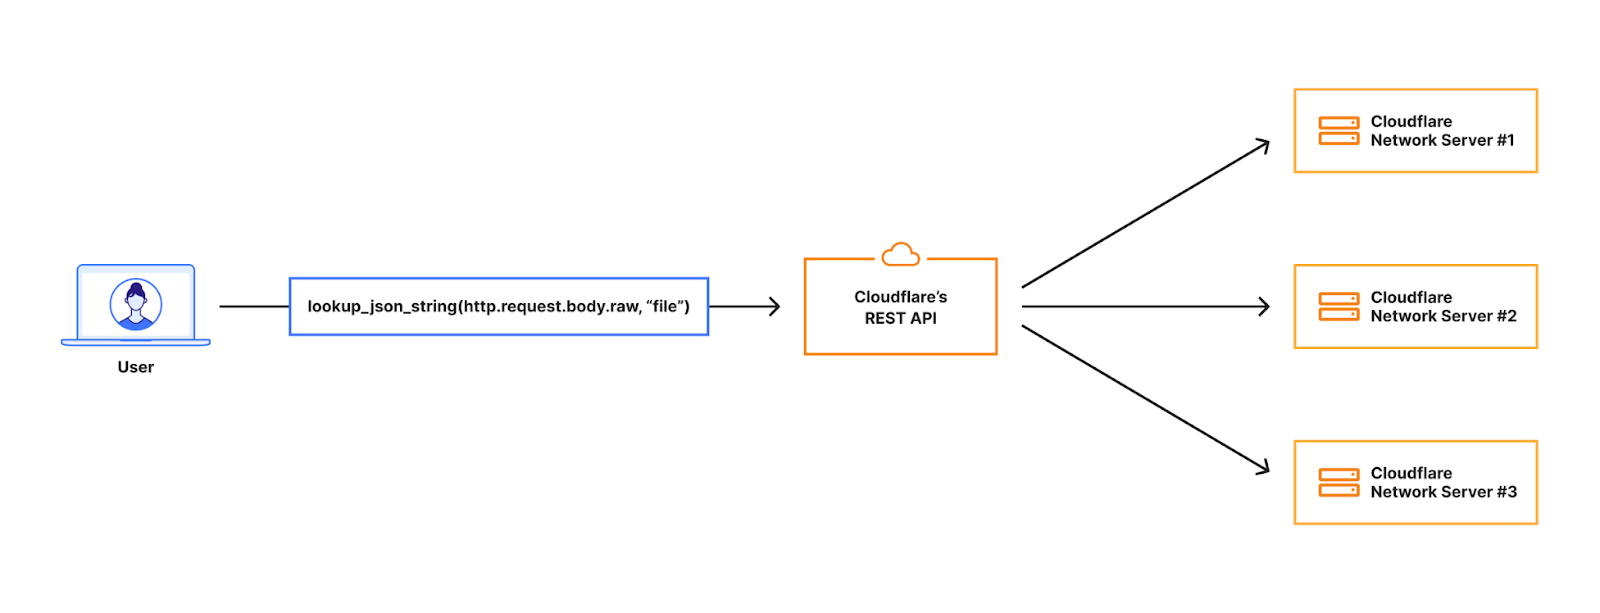
In order for customers to use the content scanning functionality in scanning files embedded in JSON request bodies, they had to configure a rule like:
lookup_json_string(http.request.body.raw, “file”)
This means we should look in the request body but only for the “file” key, which in the image below contains a base64 encoded string for an image.
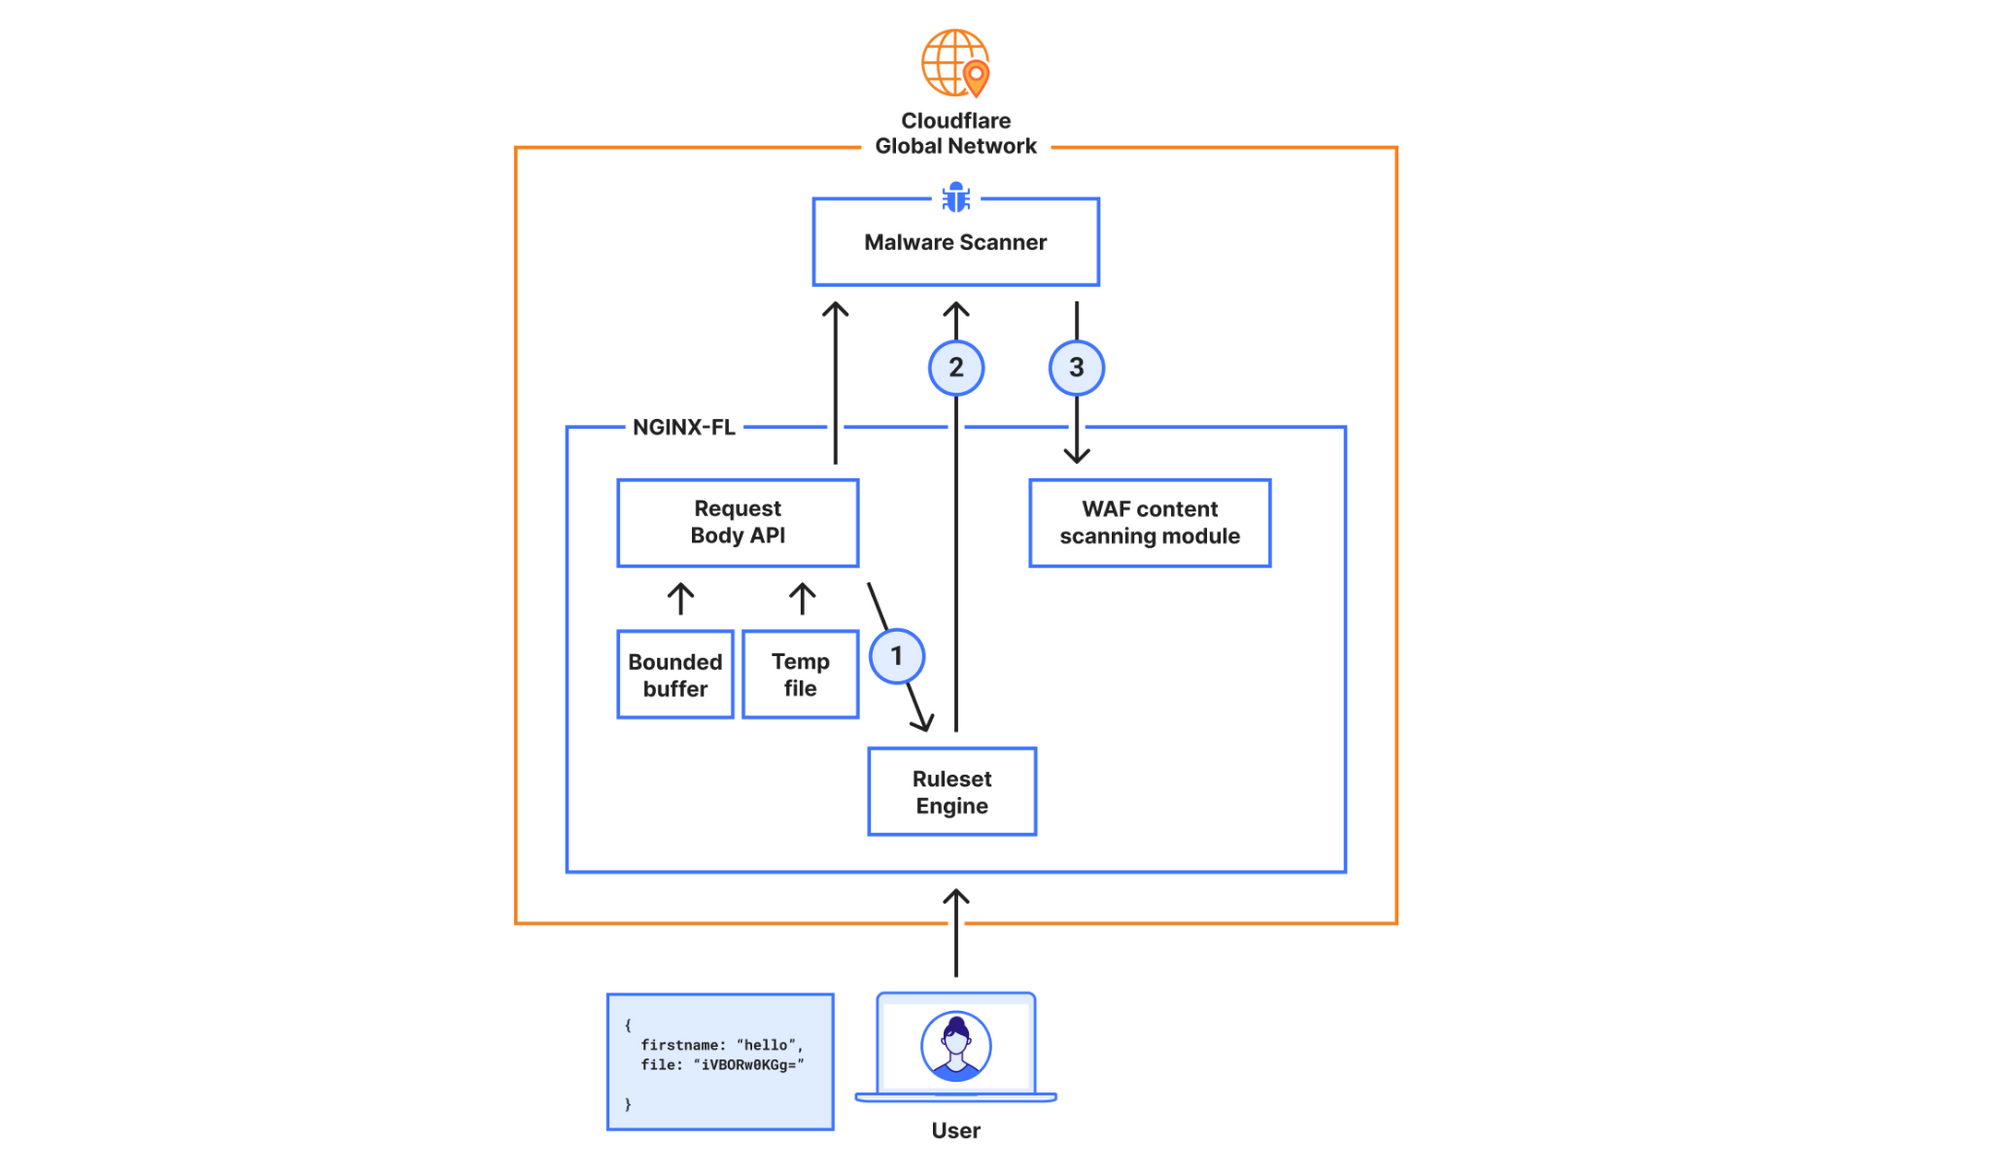
When the request hits our Front Line (FL) NGINX proxy, we buffer the request body. This will be in an in-memory buffer, or written to a temporary file if the size of the request body exceeds the NGINX configuration of client_body_buffer_size. Then, our WAF engine executes the lookup_json_string function and returns the base64 string which is the content of the file key. The base64 string gets sent via Unix Domain Sockets to our malware scanner, which does MIME type detection and returns a verdict to the file upload scanning module.
This architecture had a bottleneck that made it hard to expand on: the expensive latency fees we had to pay. The request body is first buffered in NGINX and then copied into our WAF engine, where rules are executed. The malware scanner will then receive the execution result — which, in the worst scenario, is the entire request body — over a Unix domain socket. This indicates that once NGINX buffers the request body, we send and buffer it in two other services.
New architecture for the General Availability release
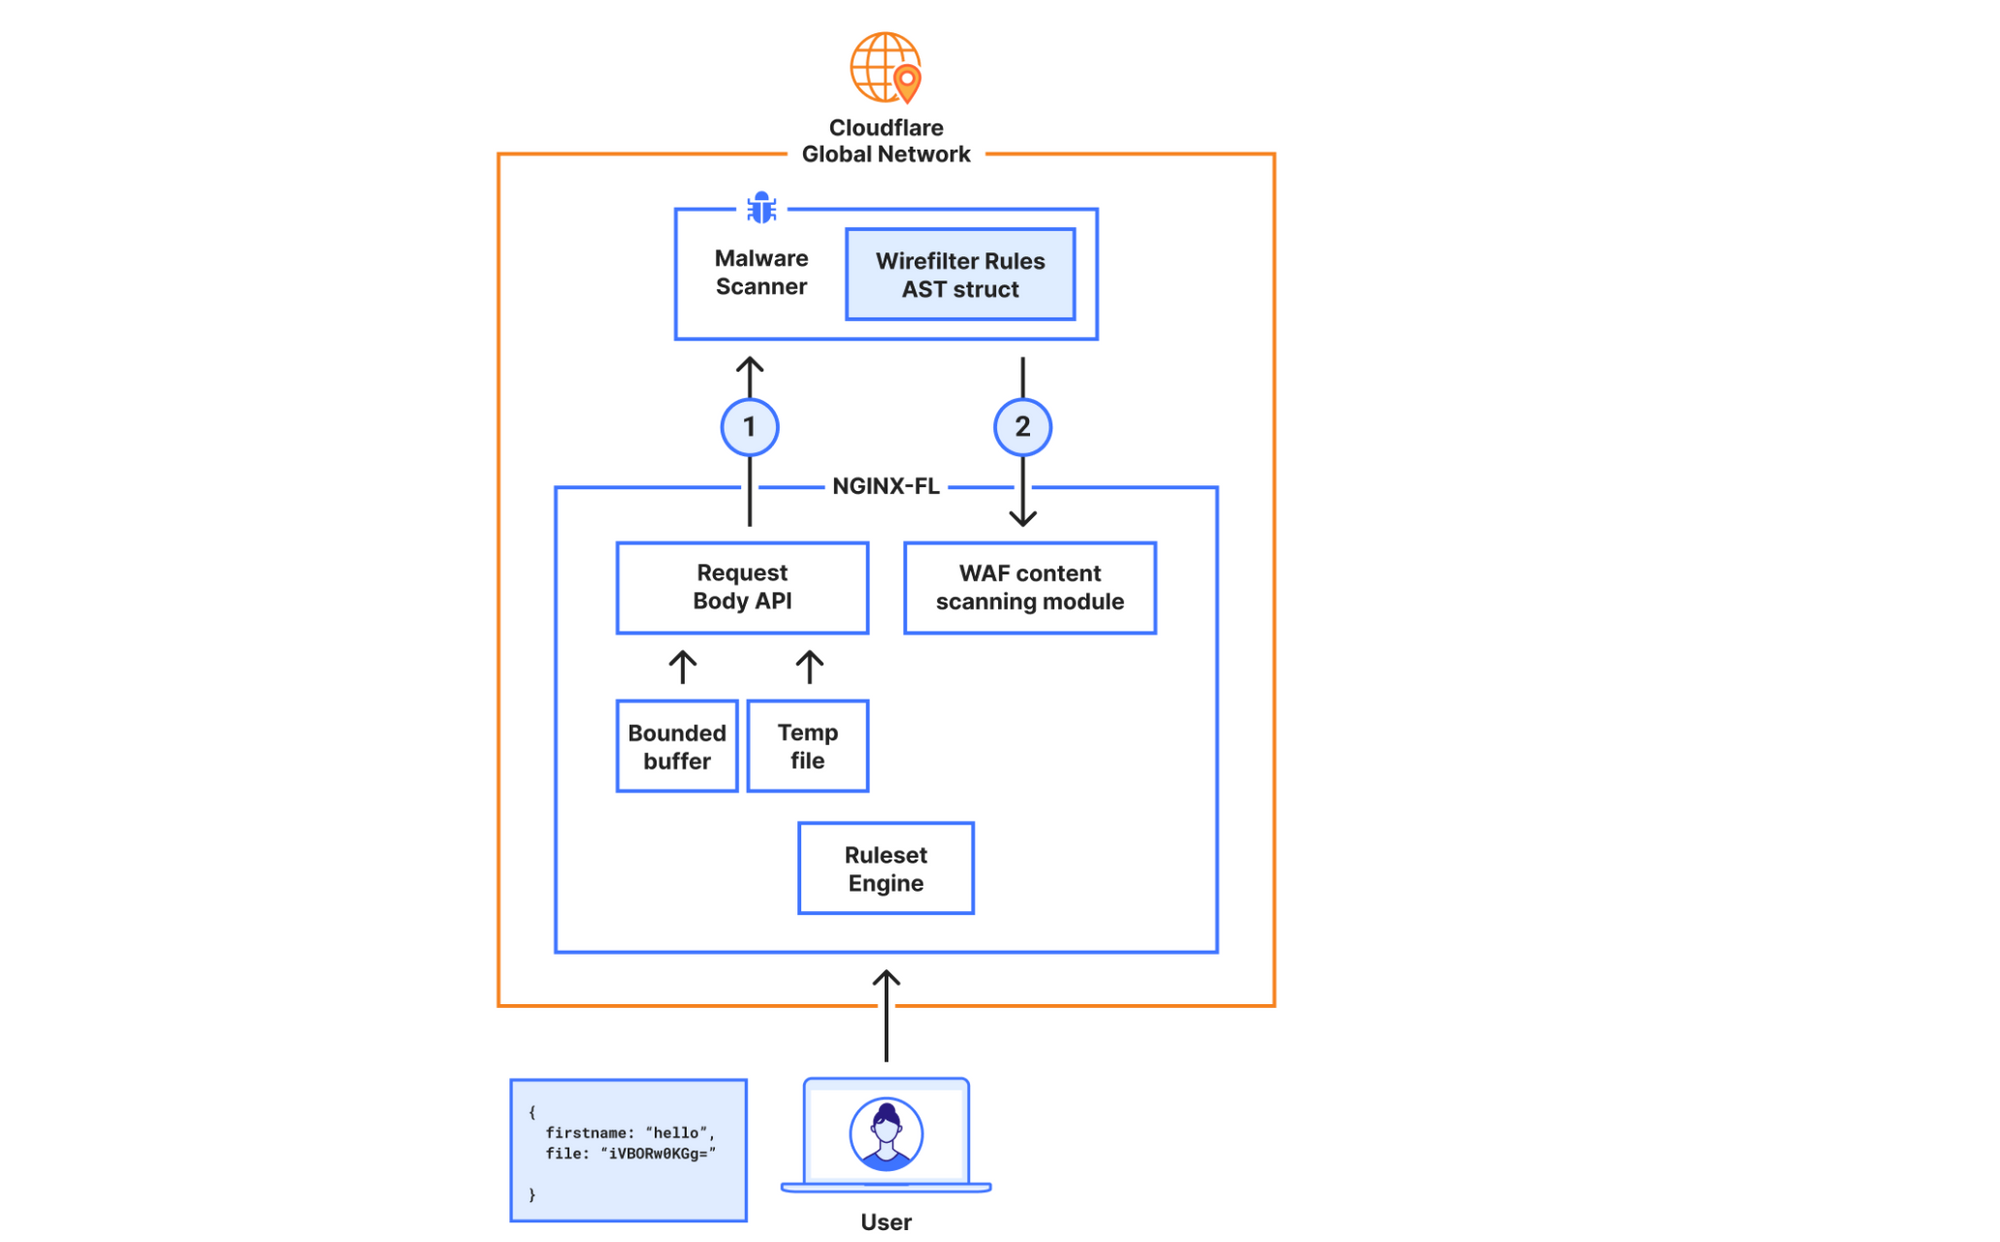
In the new design, the requirements were to scan larger files (15x larger) while not compromising on performance. To achieve this, we decided to bypass our WAF engine, which is where we introduced the most latency.
In the new architecture, we made the malware scanner aware of what is needed to execute the rule, hence bypassing the Ruleset Engine (RE). For example, the configuration “lookup_json_string(http.request.body.raw, “file”)”, will be represented roughly as:
{
   Function: lookup_json_string
   Args: [“file”]
}
This is achieved by walking the Abstract Syntax Tree (AST) when the rule is configured, and deploying the sample struct above to our global network. The struct’s values will be read by the malware scanner, and rule execution and malware detection will happen within the same service. This means we don’t need to read the request body, execute the rule in the Ruleset Engine (RE) module, and then send the results over to the malware scanner.
The malware scanner will now read the request body from the temporary file directly, perform the rule execution, and return the verdict to the file upload scanning module.
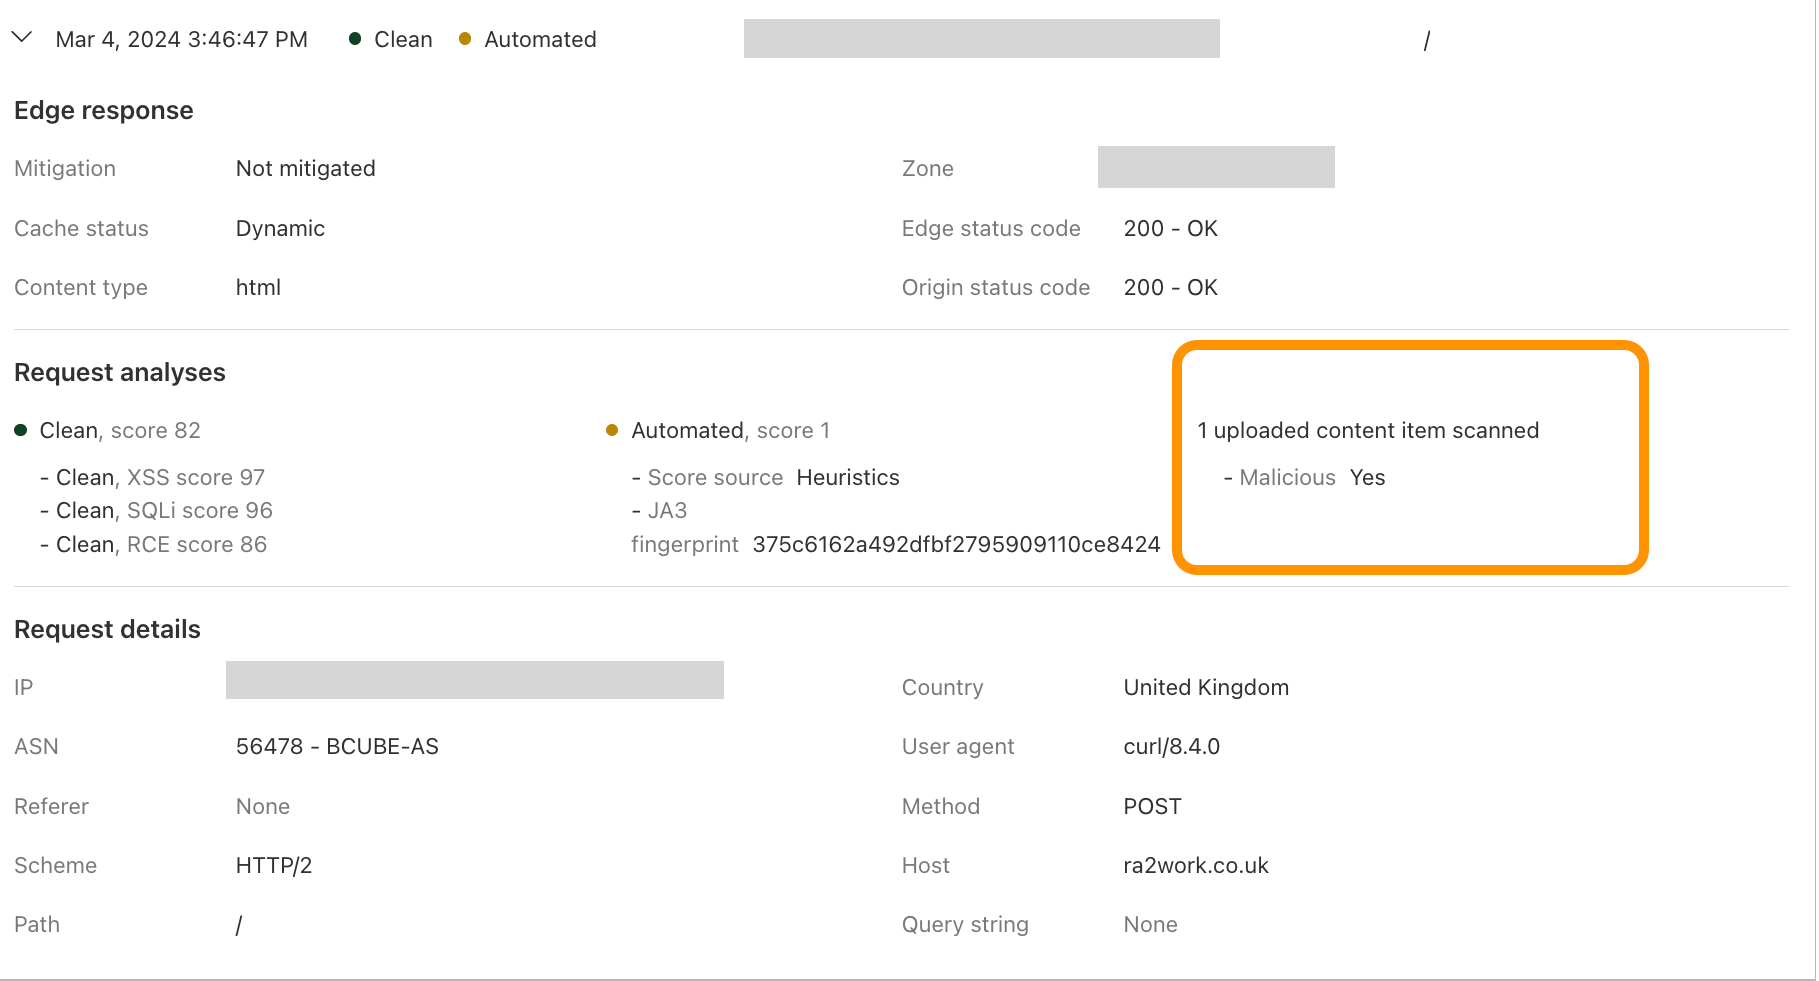
The file upload scanning module populates these fields, so they can be used to write custom rules and take actions. For example:
This module also enriches our logging pipelines with these fields, which can then be read in Log Push, Edge Log Delivery, Security Analytics, and Firewall Events in the dashboard. For example, this is the security log in the Cloudflare dashboard (Security → Analytics) for a web request that triggered WAF Content Scanning:
WAF content scanning detection visibility
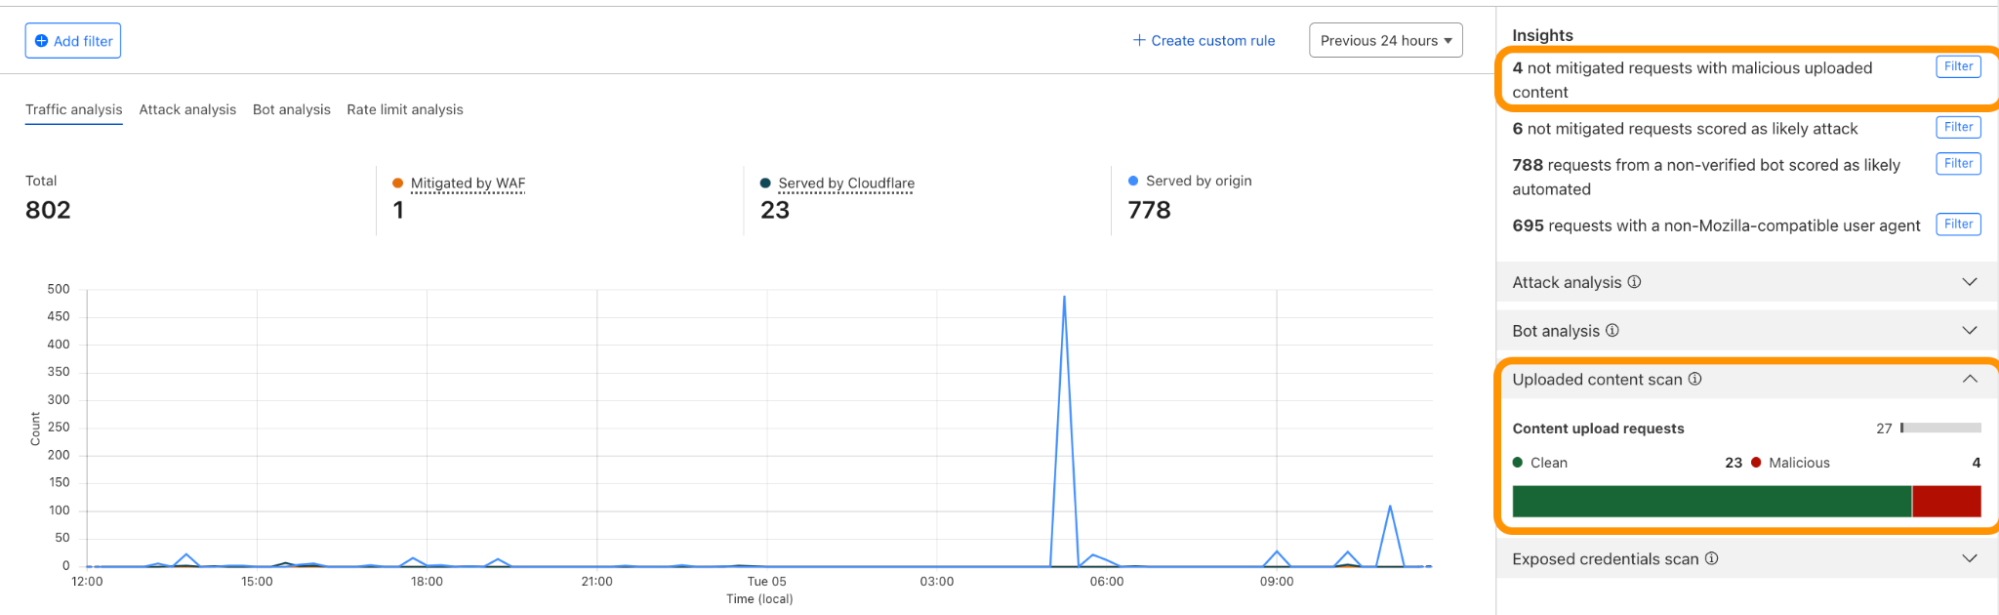
Using the concept of incoming traffic detection, WAF Content Scanning enables users to identify hidden risks through their traffic signals in the analytics before blocking or mitigating matching requests. This reduces false positives and permits security teams to make decisions based on well-informed data. Actually, this isn’t the only instance in which we apply this idea, as we also do it for a number of other products, like WAF Attack Score and Bot Management.
We have integrated helpful information into our security products, like Security Analytics, to provide this data visibility. The Content Scanning tab, located on the right sidebar, displays traffic patterns even if there were no WAF rules in place. The same data is also reflected in the sampled requests, and you can create new rules from the same view.
On the other hand, if you want to fine-tune your security settings, you will see better visibility in Security Events, where these are the requests that match specific rules you have created in WAF.
Last but not least, in our Logpush datastream, we have included the scan fields that can be selected to send to any external log handler.
What’s next?
Before the end of March 2024, all current and new customers who have enabled WAF Content Scanning will be able to scan uploaded files up to 15 MB. Next, we’ll focus on improving how we handle files in the rules, including adding a dynamic header functionality. Quarantining files is also another important feature we will be adding in the future. If you’re an Enterprise customer, reach out to your account team for more information and to get access.
Over the last twelve months, we have been talking about the new baseline of encryption on the Internet: post-quantum cryptography. During Birthday Week last year we announced that our beta of Kyber was available for testing, and that Cloudflare Tunnel could be enabled with post-quantum cryptography. Earlier this year, we made our stance clear that this foundational technology should be available to everyone for free, forever.
Today, we have hit a milestone after six years and 31 blog posts in the making: we’re starting to roll out General Availability1 of post-quantum cryptography support to our customers, services, and internal systems as described more fully below. This includes products like Pingora for origin connectivity, 1.1.1.1, R2, Argo Smart Routing, Snippets, and so many more.
This is a milestone for the Internet. We don't yet know when quantum computers will have enough scale to break today's cryptography, but the benefits of upgrading to post-quantum cryptography now are clear. Fast connections and future-proofed security are all possible today because of the advances made by Cloudflare, Google, Mozilla, the National Institutes of Standards and Technology in the United States, the Internet Engineering Task Force, and numerous academic institutions
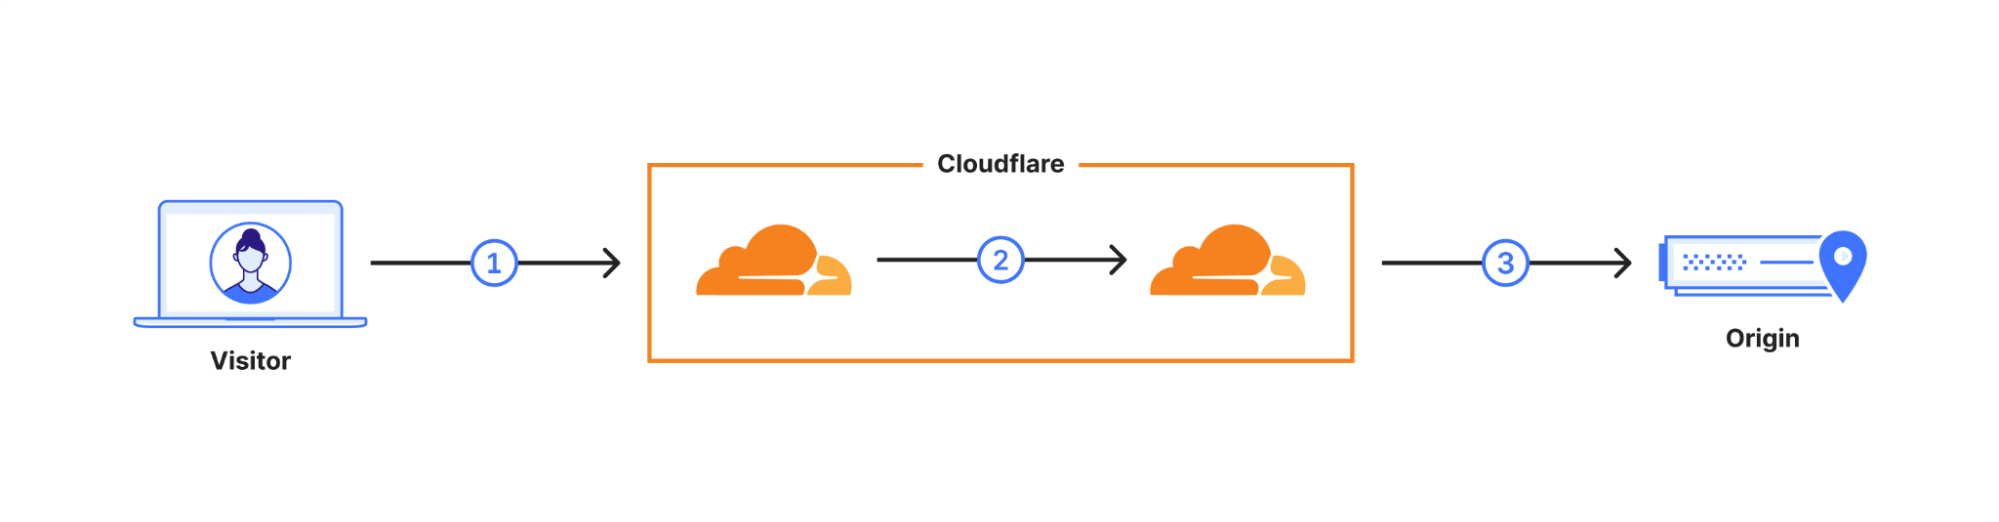
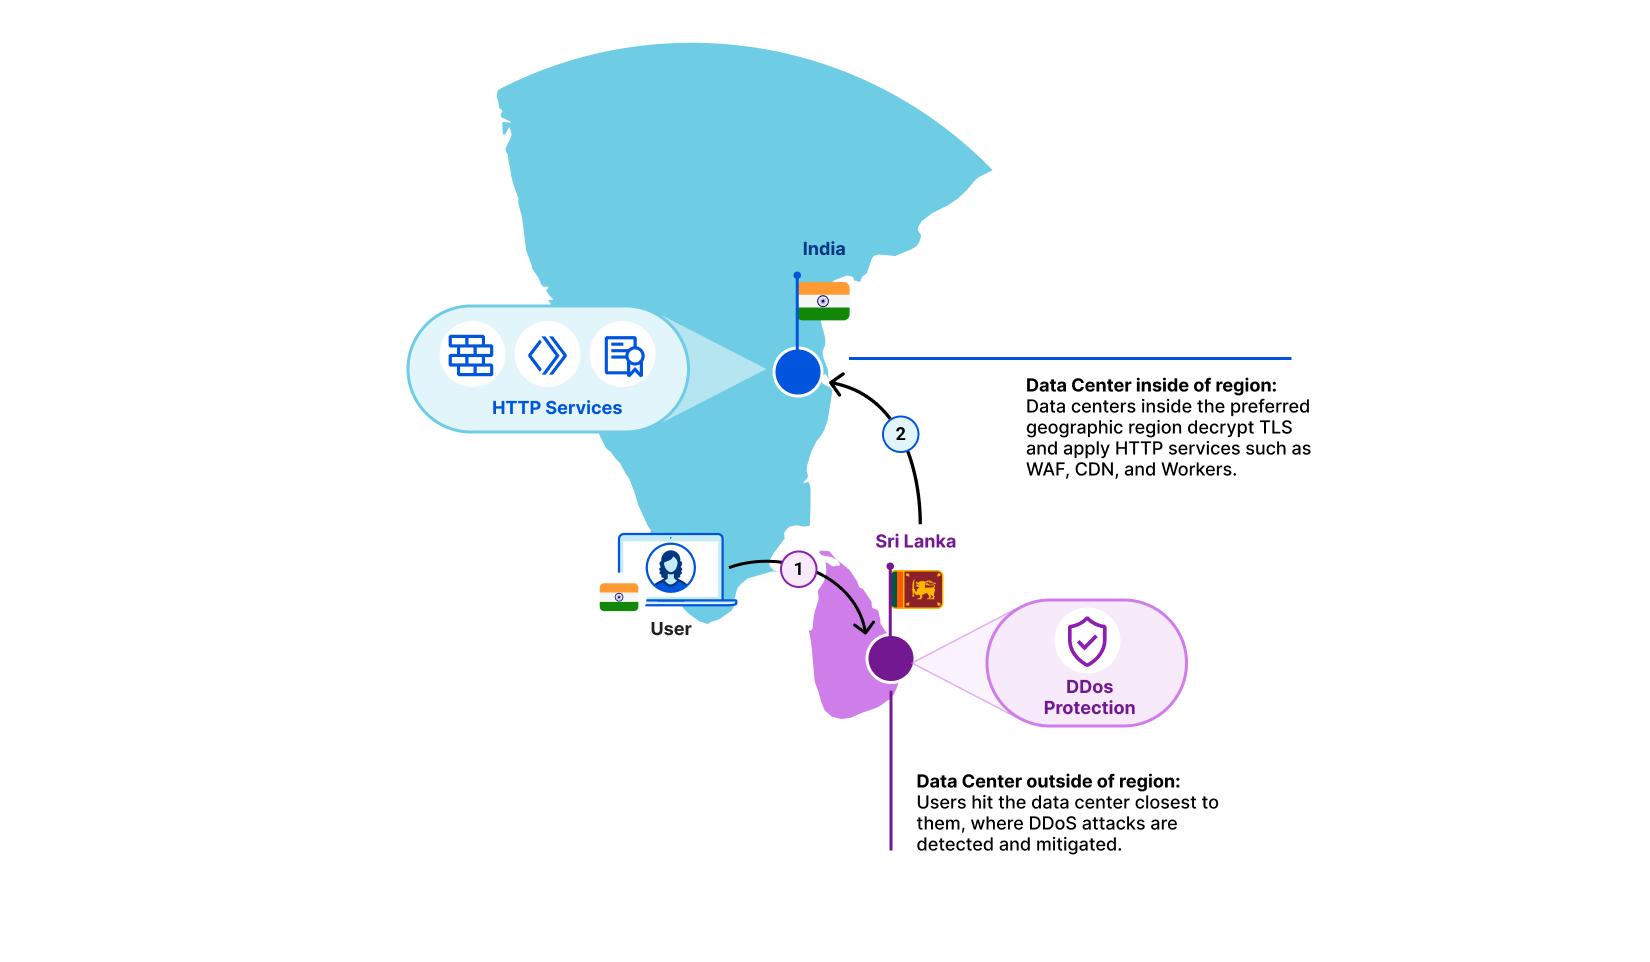
What does General Availability mean? In October 2022 we enabled X25519+Kyber as a beta for all websites and APIs served through Cloudflare. However, it takes two to tango: the connection is only secured if the browser also supports post-quantum cryptography. Starting August 2023, Chrome is slowly enabling X25519+Kyber by default.
The user’s request is routed through Cloudflare’s network (2). We have upgraded many of these internal connections to use post-quantum cryptography, and expect to be done upgrading all of our internal connections by the end of 2024. That leaves as the final link the connection (3) between us and the origin server.
We are happy to announce that we are rolling out support for X25519+Kyber for most inbound and outbound connectionsas Generally Available for use including origin servers and Cloudflare Workersfetch()es.
Plan
Support for post-quantum outbound connections
Free
Started roll-out. Aiming for 100% by the end of the October.
Pro and business
Aiming for 100% by the end of year.
Enterprise
Roll-out begins February 2024. 100% by March 2024.
For our Enterprise customers, we will be sending out additional information regularly over the course of the next six months to help prepare you for the roll-out. Pro, Business, and Enterprise customers can skip the roll-out and opt-in within your zone today, or opt-out ahead of time using an API described in our companion blog post. Before rolling out for Enterprise in February 2024, we will add a toggle on the dashboard to opt out.
With an upgrade of this magnitude, we wanted to focus on our most used products first and then expand outward to cover our edge cases. This process has led us to include the following products and systems in this roll out:
1.1.1.1
AMP
API Gateway
Argo Smart Routing
Auto Minify
Automatic Platform Optimization
Automatic Signed Exchange
Cloudflare Egress
Cloudflare Images
Cloudflare Rulesets
Cloudflare Snippets
Cloudflare Tunnel
Custom Error Pages
Flow Based Monitoring
Health checks
Hermes
Host Head Checker
Magic Firewall
Magic Network Monitoring
Network Error Logging
Project Flame
Quicksilver
R2 Storage
Request Tracer
Rocket Loader
Speed on Cloudflare Dash
SSL/TLS
Traffic Manager
WAF, Managed Rules
Waiting Room
Web Analytics
If a product or service you use is not listed here, we have not started rolling out post-quantum cryptography to it yet. We are actively working on rolling out post-quantum cryptography to all products and services including our Zero Trust products. Until we have achieved post-quantum cryptography support in all of our systems, we will publish an update blog in every Innovation Week that covers which products we have rolled out post-quantum cryptography to, the products that will be getting it next, and what is still on the horizon.
Products we are working on bringing post-quantum cryptography support to soon:
Cloudflare Gateway
Cloudflare DNS
Cloudflare Load Balancer
Cloudflare Access
Always Online
Zaraz
Logging
D1
Cloudflare Workers
Cloudflare WARP
Bot Management
Why now?
As we announced earlier this year, post-quantum cryptography will be included for free in all Cloudflare products and services that can support it. The best encryption technology should be accessible to everyone – free of charge – to help support privacy and human rights globally.
“What was once an experimental frontier has turned into the underlying fabric of modern society. It runs in our most critical infrastructure like power systems, hospitals, airports, and banks. We trust it with our most precious memories. We trust it with our secrets. That’s why the Internet needs to be private by default. It needs to be secure by default.”
Our work on post-quantum cryptography is driven by the thesis that quantum computers that can break conventional cryptography create a similar problem to the Year 2000 bug. We know there is going to be a problem in the future that could have catastrophic consequences for users, businesses, and even nation states. The difference this time is we don’t know how the date and time that this break in the computational paradigm will occur. Worse, any traffic captured today could be decrypted in the future. We need to prepare today to be ready for this threat.
We are excited for everyone to adopt post-quantum cryptography into their systems. To follow the latest developments of our deployment of post-quantum cryptography and third-party client/server support, check out pq.cloudflareresearch.com and keep an eye on this blog.
***
1We are using a preliminary version of Kyber, NIST’s pick for post-quantum key agreement. Kyber has not been finalized. We expect a final standard to be published in 2024 under the name ML-KEM, which we will then adopt promptly while deprecating support for X25519Kyber768Draft00.
A lot of people rely on Cloudflare. We serve over 46 million HTTP requests per second on average; millions of customers use our services, including 31% of the Fortune 1000. And these numbers are only growing.
That’s why today we are excited to announce Incident Alerts — available via email, webhook, or PagerDuty. These notifications are accessible easily in the Cloudflare dashboard, and they’re customizable to prevent notification overload. And best of all, they’re available to everyone; you simply need a free account to get started.
Lifecycle of an incident
Without proper transparency, incidents cause confusion and waste resources for anyone that relies on the Internet. With so many different entities working together to make the Internet operate, diagnosing and troubleshooting can be complicated and time-consuming. By far the best solution is for providers to have transparent and proactive alerting, so any time something goes wrong, it’s clear exactly where the problem is.
Cloudflare incident response
We understand the importance of proactive and transparent alerting around incidents. We have worked to improve communications by directly alerting enterprise level customers and allowing everyone to subscribe to an RSS feed or leverage the Cloudflare Status API. Additionally, we update the Cloudflare status page — which catalogs incident reports, updates, and resolutions — throughout an incident’s lifecycle, as well as tracking scheduled maintenance.
However, not everyone wants to use the Status API or subscribe to an RSS feed. Both of these options require some infrastructure and programmatic efforts from the customer’s end, and neither offers simple configuration to filter out noise like scheduled maintenance. For those who don’t want to build anything themselves, visiting the status page is still a pull, rather than a push, model. Customers themselves need to take it upon themselves to monitor Cloudflare’s status — and timeliness in these situations can make a world of difference.
Without a proactive channel of communication, there can be a disconnect between Cloudflare and our customers during incidents. Although we update the status page as soon as possible, the lack of a push notification represents a gap in meeting our customers’ expectations. The new Cloudflare Incident Alerts aim to remedy that.
Simple, free, and fast notifications
We want to proactively notify you as soon as a Cloudflare incident may be affecting your service —- without any programmatic steps on your end. Unlike the Status API and an RSS feed, Cloudflare Incident Alerts are configurable through just a few clicks in the dashboard, and you can choose to receive email, PagerDuty, or web hook alerts for incidents involving specific products at different levels of impact. The Status API will continue to be available.
With this multidimensional granularity, you can filter notifications by specific service and severity. If you are, for example, a Cloudflare for SaaS customer, you may want alerts for delays in custom hostname activation but not for increased latency on Stream. Likewise, you may only care about critical incidents instead of getting notified for minor incidents. Incident Alerts give you the ability to choose.
Lifecycle of an Incident
How to filter incidents to fit your needs
You can filter incident notifications with the following categories:
Cloudflare Sites and Services: get notified when an incident is affecting certain products or product areas.
Impact level: get notified for critical, major, and/or minor incidents.
These categories are not mutually exclusive. Here are a few possible configurations:
Notify me via email for all critical incidents.
Notify me via webhook for critical & major incidents affecting Pages.
Notify me via PagerDuty for all incidents affecting Stream.
With over fifty different alerts available via the dashboard, you can tailor your notifications to what you need. You can customize not only which alerts you are receiving but also how you would like to be notified. With PagerDuty, webhooks, and email integrated into the system, you have the flexibility of choosing what will work best with your working environment. Plus, with multiple configurations within many of the available notifications, we make it easy to only get alerts about what you want, when you want them.
Try it out
You can start to configure incident alerts on your Cloudflare account today. Here’s how:
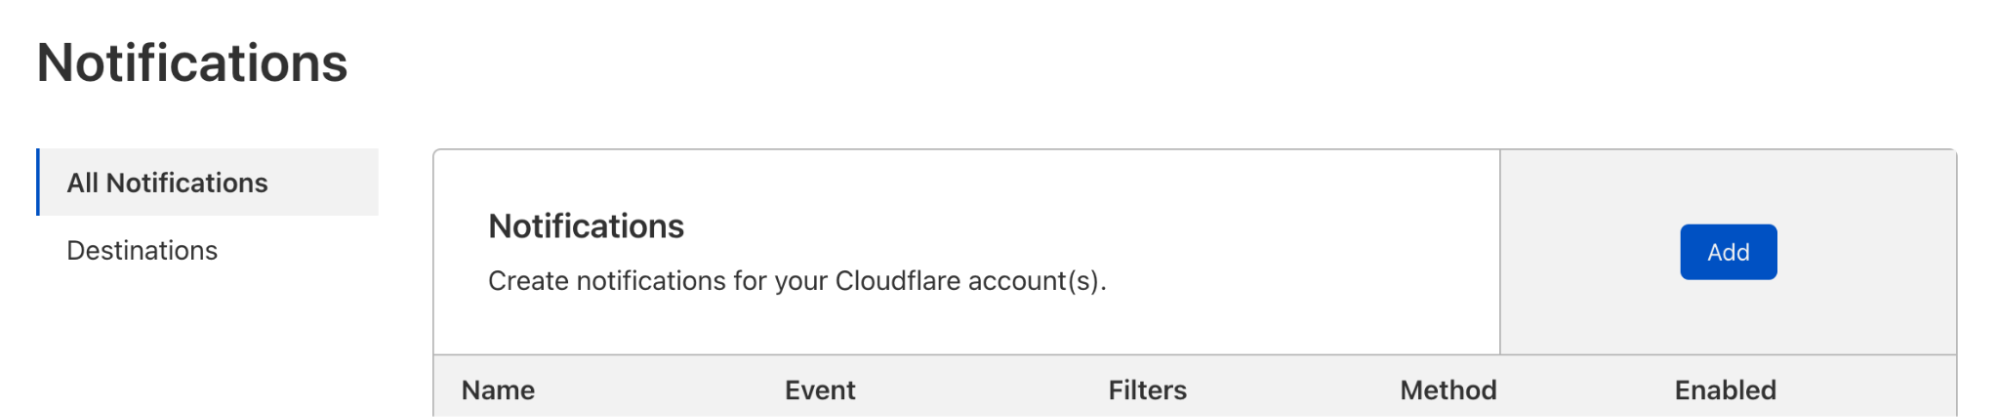
Navigate to the Cloudflare dashboard → Notifications.
Select “Add”.
Select “Incident Alerts”.
Enter your notification name and description.
Select the impact level(s) and component(s) for which you would like to be notified. If either field is left blank, it will default to all impact levels or all components, respectively.
Select how you want to receive the notifications:
Check PagerDuty
Add Webhook
Add email recipient
Select “Save”.
Test the notification by selecting “Test” on the right side of its row.
For more information on Cloudflare’s Alert Notification System, visit our documentation here.
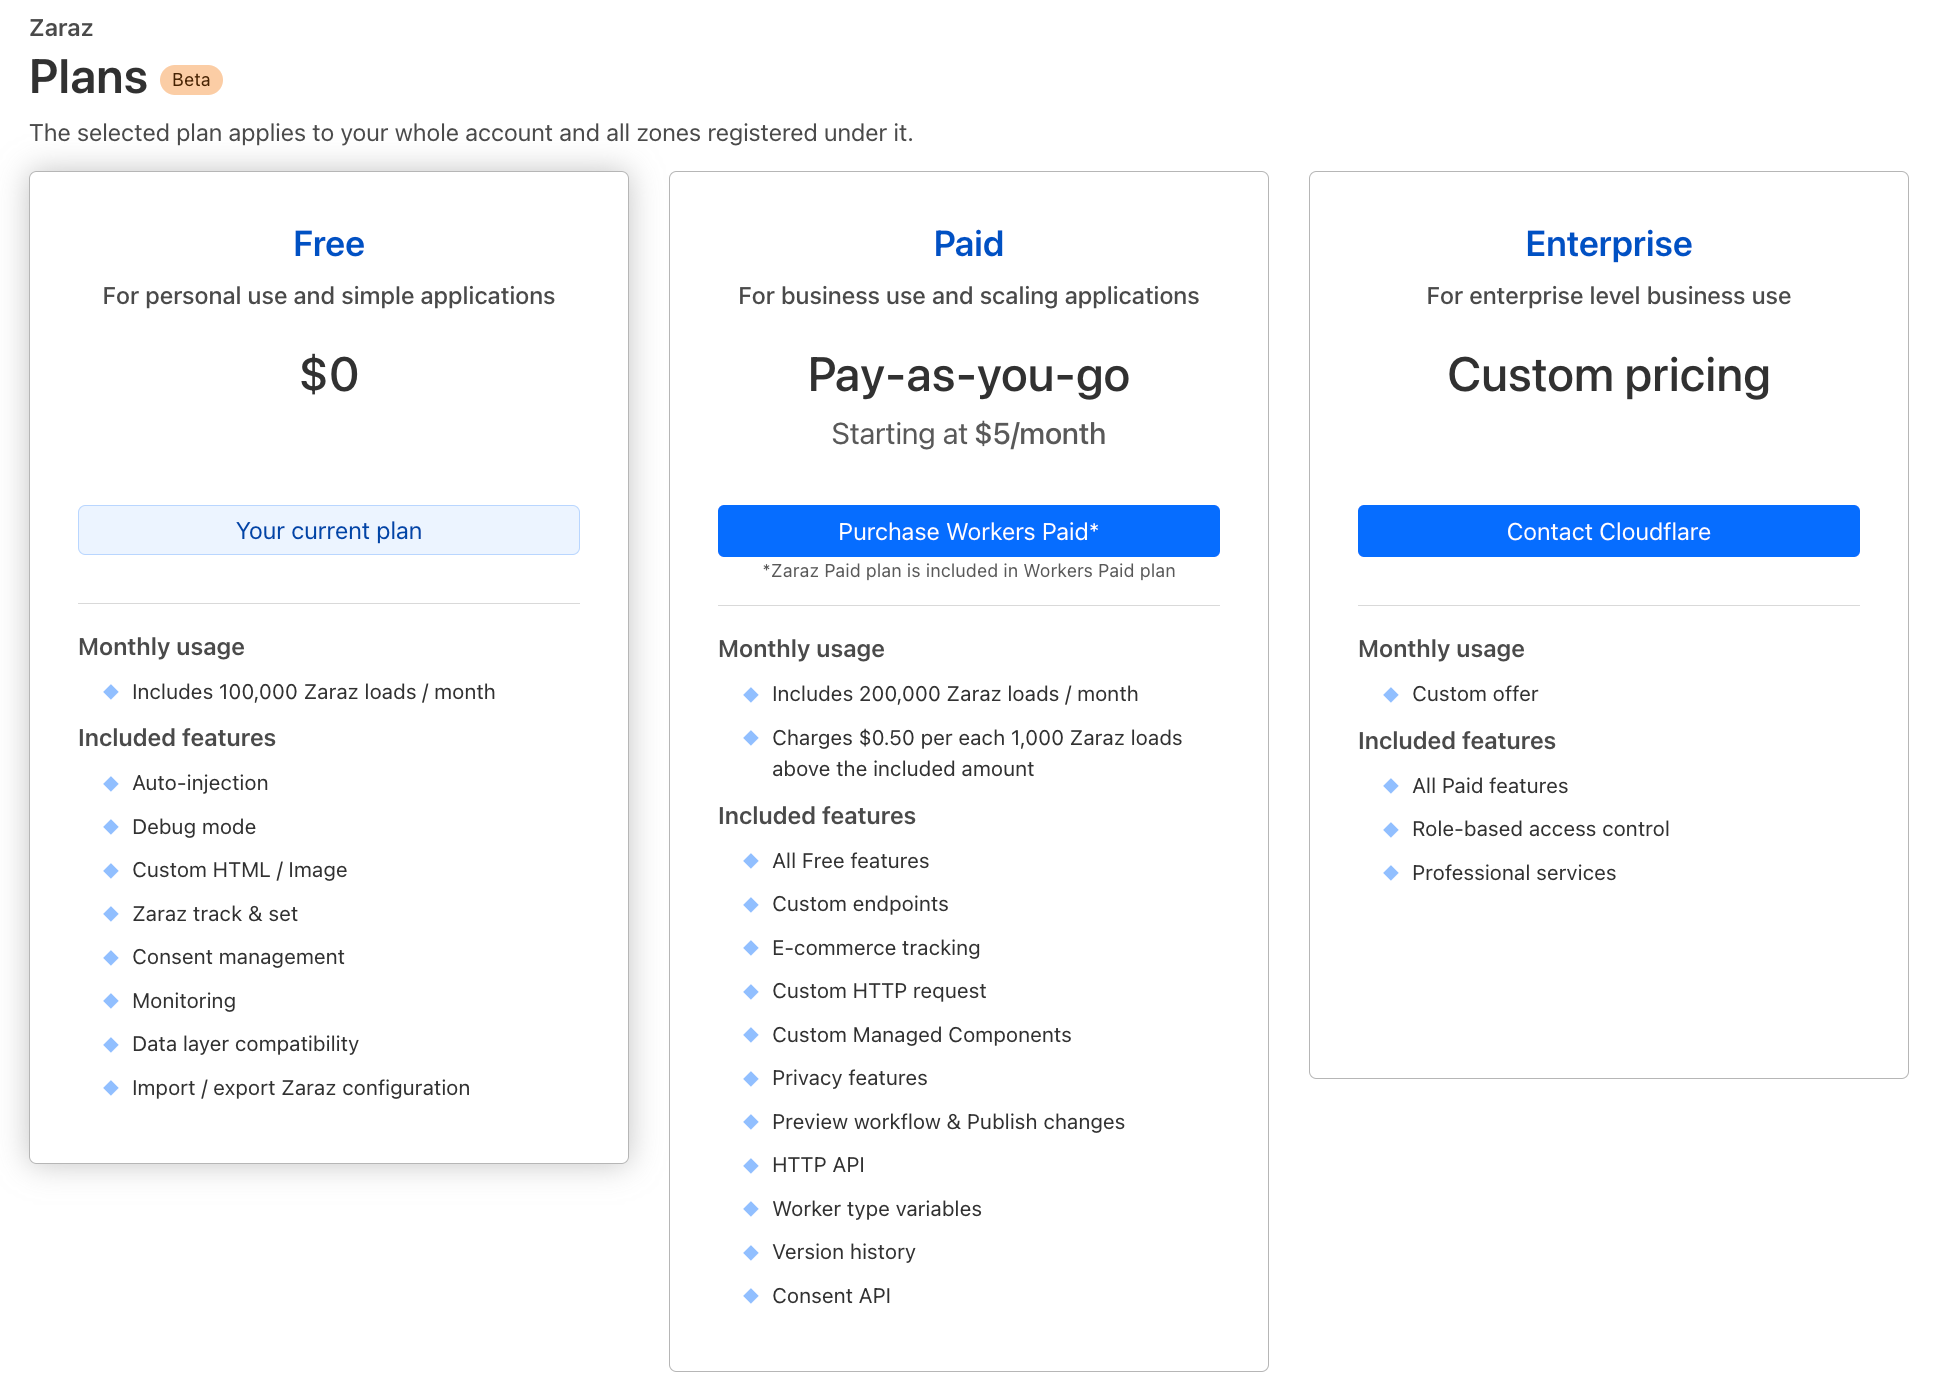
Cloudflare Zaraz has transitioned out of beta and is now generally available to all customers. It is included under the free, paid, and enterprise plans of the Cloudflare Developer Platform. Visit our docs to learn more on our different plans.
Zaraz Is part of Cloudflare Developer Platform
Cloudflare Zaraz is a solution that developers and marketers use to load third-party tools like Google Analytics 4, Facebook CAPI, TikTok, and others. With Zaraz, Cloudflare customers can easily transition to server-side data collection with just a few clicks, without the need to set up and maintain their own cloud environment or make additional changes to their website for installation. Server-side data collection, as facilitated by Zaraz, simplifies analytics reporting from the server rather than loading numerous JavaScript files on the user's browser. It's a rapidly growing trend due to browser limitations on using third-party solutions and cookies. The result is significantly faster websites, plus enhanced security and privacy on the web.
We've had Zaraz in beta mode for a year and a half now. Throughout this time, we've dedicated our efforts to meeting as many customers as we could, gathering feedback, and getting a deep understanding of our users' needs before addressing them. We've been shipping features at a high rate and have now reached a stage where our product is robust, flexible, and competitive. It also offers unique features not found elsewhere, thanks to being built on Cloudflare’s global network, such as Zaraz’s Worker Variables. We have cultivated a strong and vibrant discord community, and we have certified Zaraz developers ready to help anyone with implementation and configuration.
With more than 25,000 websites running Zaraz today – from personal sites to those of some of the world's biggest companies – we feel confident it's time to go out of beta, and introduce our new pricing system. We believe this pricing is not only generous to our customers, but also competitive and sustainable. We view this as the next logical step in our ongoing commitment to our customers, for whom we're building the future.
If you're building a web application, there's a good chance you've spent at least some time implementing third-party tools for analytics, marketing performance, conversion optimization, A/B testing, customer experience and more. Indeed, according to the Web Almanac report, 94% percent of mobile pages used at least one third-party solution in 2022, and third-party requests accounted for 45% of all requests made by websites. It's clear that third-party solutions are everywhere. They have become an integral part of how the web has evolved. Third-party tools are here to stay, and they require effective developer solutions. We are building Zaraz to help developers manage the third-party layer of their website properly.
Starting today, Cloudflare Zaraz is available to everyone for free under their Cloudflare dashboard, and the paid version of Zaraz is included in the Workers Paid plan. The Free plan is designed to meet the needs of most developers who want to use Zaraz for personal use cases. For a price starting at $5/month, customers of the Workers Paid plan can enjoy the extensive list of features that makes Zaraz powerful, deploy Zaraz on their professional projects, and utilize the pay-as-you-go system. This is in addition to everything else included in the Workers Paid plan. The Enterprise plan, on the other hand, addresses the needs of larger businesses looking to leverage our platform to its fullest potential.
How is Zaraz priced
Zaraz pricing is based on two components: Zaraz Loads and the set of features. A Zaraz Load is counted each time a web page loads the Zaraz script within it, and/or the Pageview trigger is being activated. For Single Page Applications, each URL navigation is counted as a new Zaraz Load. Under the Zaraz Monitoring dashboard, you can find a report showing how many Zaraz Loads your website has generated during a specific time period. Zaraz Loads and features are factored into our billing as follows:
Free plan
The Free Plan has a limit of 100,000 Zaraz Loads per month per account. This should allow almost everyone wanting to use Zaraz for personal use cases, like personal websites or side projects, to do so for free. After 100,000 Zaraz Loads, Zaraz will simply stop functioning.
If your websites generate more than 100,000 Zaraz loads combined, you will need to upgrade to the Workers Paid plan to avoid service interruption. If you desire some of the more advanced features, you can upgrade to Workers Paid and get access for only $5/month.
Paid plan
The Workers Paid Plan includes the first 200,000 Zaraz Loads per month per account, free of charge.
If you exceed the free Zaraz Loads allocations, you'll be charged $0.50 for every additional 1,000 Zaraz Loads, but the service will continue to function. (You can set notifications to get notified when you exceed a certain threshold of Zaraz Loads, to keep track of your usage.)
If your websites generate Zaraz Loads in the millions, you might want to consider the Workers Enterprise plan. Beyond the free 200,000 Zaraz Loads per month for your account, it offers additional volume discounts based on your Zaraz Loads usage as well as Cloudflare’s professional services.
Enterprise plan
The Workers Enterprise Plan includes the first 200,000 Zaraz Loads per month per account free of charge. Based on your usage volume, Cloudflare’s sales representatives can offer compelling discounts. Get in touch with us here. Workers Enterprise customers enjoy all paid enterprise features.
I already use Zaraz, what should I do?
If you were using Zaraz under the free beta, you have a period of two months to adjust and decide how you want to go about this change. Nothing will change until September 20, 2023. In the meantime we advise you to:
Get more clarity of your Zaraz Loads usage. Visit Monitoring to check how many Zaraz Loads you had in the previous couple of months. If you are worried about generating more than 100,000 Zaraz Loads per month, you might want to consider upgrading to Workers Paid via the plans page, to avoid service interruption. If you generate a big amount of Zaraz Loads, you’d probably want to reach out to your sales representative and get volume discounts. You can leave your details here, and we’ll get back to you.
Check if you are using one of the paid features as listed in the plans page. If you are, then you would need to purchase a Workers Paid subscription, starting at $5/month via the plans page. On September 20, these features will cease to work unless you upgrade.
* Please note, as of now, free plan users won't have access to any paid features. However, if you're already using a paid feature without a Workers Paid subscription, you can continue to use it risk-free until September 20. After this date, you'll need to upgrade to keep using any paid features.
We are here for you
As we make this important transition, we want to extend our sincere gratitude to all our beta users who have provided invaluable feedback and have helped us shape Zaraz into what it is today. We are excited to see Zaraz move beyond its beta stage and look forward to continuing to serve your needs and helping you build better, faster, and more secure web experiences. We know this change comes with adjustments, and we are committed to making the transition as smooth as possible. In the next couple of days, you can expect an email from us, with clear next steps and a way to get advice in case of need. You can always get in touch directly with the Cloudflare Zaraz team on Discord, or the community forum.
Thank you for joining us on this journey and for your ongoing support and trust in Cloudflare Zaraz. Let's continue to build the future of the web together!
Back in 2019, we worked on a chart for Cloudflare’s IPO S-1 document that showed major releases since Cloudflare was launched in 2010. Here’s that chart:
Of course, that chart doesn’t show everything we’ve shipped, but the curve demonstrates a truth about a growing company: we keep shipping more and more products and services. Some of those things start with a beta, sometimes open and sometimes private. But all of them become generally available after the beta period.
Back in, say, 2014, we only had a few major releases per year. But as the years have progressed and the company has grown we have constant updates, releases and changes. This year a confluence of products becoming generally available in September meant it made sense to wrap them all up into GA Week.
GA Week has now finished, and the team is working to put the finishing touches on Birthday Week (coming this Sunday!), but here’s a recap of everything that we launched this week.
It is possible to scope your users’ access to specific domains with Domain Scoped Roles. This will allow all users access to roles, and the ability to access within zones.
Currently available to all Free plans, and coming to Enterprise shortly.
Users can manage and configure the WAF for all of their zones from a single pane of glass. This includes custom rulesets and managed rulesets (Core/OWASP and Managed).
Cloudflare’s new Adaptive DDoS Protection system learns your unique traffic patterns and constantly adapts to protect you against sophisticated DDoS attacks.
By leveraging API-driven integrations, receive comprehensive visibility and control over SaaS apps to prevent data leaks, detect Shadow IT, block insider threats, and avoid compliance violations.
Cloudflare started using Area 1 in 2020 and later acquired the company in 2022. We were most impressed how phishing, responsible for 90+% of cyberattacks, basically became a non-issue overnight when we deployed Area 1. But our vision is much bigger than preventing phishing attacks.
R2 gives developers object storage minus the egress fees. With the GA of R2, developers will be free to focus on innovation instead of worrying about the costs of storing their data.
Logpush jobs can now be filtered to contain only logs of interest. Also, you can receive alerts when jobs are failing, as well as get statistics on the health of your jobs.
Enterprise
Of course, you won’t have to wait a year for more products to become GA. We’ll be shipping betas and making products generally available throughout the year. And we’ll continue iterating on our products so that all of them become leaders.
“But it’s not just about making products work and be available, it’s about making the best-of-breed. We ship early and iterate rapidly. We’ve done this over the years for WAF, DDoS mitigation, bot management, API protection, CDN and our developer platform. Today, analyst firms such as Gartner, Forrester and IDC recognize us as leaders in all those areas.”
Logs are a critical part of every successful application. Cloudflare products and services around the world generate massive amounts of logs upon which customers of all sizes depend. Structured logging from our products are used by customers for purposes including analytics, debugging performance issues, monitoring application health, maintaining security standards for compliance reasons, and much more.
Logpush is Cloudflare’s product for pushing these critical logs to customer systems for consumption and analysis. Whenever our products generate logs as a result of traffic or data passing through our systems from anywhere in the world, we buffer these logs and push them directly to customer-defined destinations like Cloudflare R2, Splunk, AWS S3, and many more.
Today we are announcing three new key features related to Cloudflare’s Logpush product. First, the ability to have only logs matching certain criteria be sent. Second, the ability to get alerted when logs are failing to be pushed due to customer destinations having issues or network issues occurring between Cloudflare and the customer destination. In addition, customers will also be able to query for analytics around the health of Logpush jobs like how many bytes and records were pushed, number of successful pushes, and number of failing pushes.
Filtering logs before they are pushed
Because logs are both critical and generated with high volume, many customers have to maintain complex infrastructure just to ingest and store logs, as well as deal with ever-increasing related costs. On a typical day, a real, example customer receives about 21 billion records, or 2.1 terabytes (about 24.9 TB uncompressed) of gzip compressed logs. Over the course of a month, that could easily be hundreds of billions of events and hundreds of terabytes of data.
It is often unnecessary to store and analyze all of this data, and customers could get by with specific subsets of the data matching certain criteria. For example, a customer might want just the set of HTTP data that had status code >= 400, or the set of firewall data where the action taken was to block the user. We can now achieve this in our Logpush jobs by setting specific filters on the fields of the log messages themselves. You can use either our API or the Cloudflare dashboard to set up filters.
To do this in the dashboard, either create a new Logpush job or modify an existing job. You will see the option to set certain filters. For example, an ecommerce customer might want to receive logs only for the checkout page where the bot score was non-zero:
Logpush job alerting
When logs are a critical part of your infrastructure, you want peace of mind that logging infrastructure is healthy. With that in mind, we are announcing the ability to get notified when your Logpush jobs have been retrying to push and failing for 24 hours.
To set up alerts in the Cloudflare dashboard:
1. First, navigate to “Notifications” in the left-panel of the account view
2. Next, Click the “add” button
3. Select the alert “Failing Logpush Job Disabled”
4. Configure the alert and click Save.
That’s it — you will receive an email alert if your Logpush job is disabled.
Logpush Job Health API
We have also added the ability to query for stats related to the health of your Logpush jobs to our graphql API. Customers can now use our GraphQL API to query for things like the number of bytes pushed, number of compressed bytes pushed, number of records pushed, the status of each push, and much more. Using these stats, customers can have greater visibility into a core part of infrastructure. The GraphQL API is self documenting so full details about the new logpushHealthAdaptiveGroups node can be found using any GraphQL client, but head to GraphQL docs for more information.
Below are a couple example queries of how you can use the GraphQL to find stats related to your Logpush jobs.
Query for number of pushes to S3 that resulted in status code != 200
Logpush is a robust and flexible platform for customers who need to integrate their own logging and monitoring systems with Cloudflare. Different Logpush jobs can be deployed to support multiple destinations or, with filtering, multiple subsets of logs.
Customers who haven’t created Logpush jobs are encouraged to do so. Try pushing your logs to R2 for safe-keeping! For customers who don’t currently have access to this powerful tool, consider upgrading your plan.
When it comes to privacy, much is in your control as a website owner. You decide what information to collect, how to transmit it, how to process it, and where to store it. If you care for the privacy of your users, you’re probably taking action to ensure that these steps are handled sensitively and carefully. If your website includes no third party tools at all – no analytics, no conversion pixels, no widgets, nothing at all – then it’s probably enough! But… If your website is one of the other 94% of the Internet, you have some third-party code running in it. Unfortunately, you probably can’t tell what exactly this code is doing.
Third-party tools are great. Your product team, marketing team, BI team – they’re all right when they say that these tools make a better website. Third-party tools can help you understand your users better, embed information such as maps, chat widgets, or measure and attribute conversions more accurately. The problem doesn’t lay with the tools themselves, but with the way they are implemented – third party scripts.
Third-party scripts are pieces of JavaScript that your website is loading, often from a remote web server. Those scripts are then parsed by the browser, and they can generally do everything that your website can do. They can change the page completely, they can write cookies, they can read form inputs, URLs, track visitors and more. It is mostly a restrictions-less system. They were built this way because it used to be the only way to create a third-party tool.
Over the years, companies have suffered a lot of third party scripts. Those scripts were sometimes hacked, and started hijacking information from visitors to websites that were using them. More often, third party scripts are simply collecting information that could be sensitive, exposing the website visitors in ways that the website owner never intended.
Recently we announced that we’re open sourcing Managed Components. Managed Components are a new API to load third-party tools in a secure and privacy-aware way. It changes the way third-party tools load, because by default there are no more third-party scripts in it at all. Instead, there are components, which are controlled with a Components Manager like Cloudflare Zaraz.
In this blogpost we will discuss how to use Cloudflare Zaraz for granting and revoking permissions from components, and for controlling what information flows into components. Even more exciting, we’re also announcing the upcoming DLP features of Cloudflare Zaraz, that can report, mask and remove PII from information shared with third-parties by mistake.
How are Managed Components better
Because Managed Components run isolated inside a Component Manager, they are more private by design. Unlike a script that gets unlimited access to everything on your website, a Managed Component is transparent about what kind of access it needs, and operates under a Component Manager that grants and revokes permissions.
When you add a Managed Component to your website, the Component Manager will list all the permissions required for this component. Such permissions could be “setting cookies”, “making client-side network requests”, “installing a widget” and more. Depending on the tool, you’ll be able to remove permissions that are optional, if your website maintains a more restrictive approach to privacy.
Aside from permissions, the Component Manager also lets you choose what information is exposed to each Managed Component. Perhaps you don’t want to send IP addresses to Facebook? Or rather not send user agent strings to Mixpanel? Managed Components put you in control by telling you exactly what information is consumed by each tool, and letting you filter, mask or hide it according to your needs.
Data Loss Prevention with Cloudflare Zaraz
Another area we’re working on is developing DLP features that let you decide what information to forward to different Managed Components not only by the field type, e.g. “user agent header” or “IP address”, but by the actual content. DLP filters can scan all information flowing into a Managed Component and detect names, email addresses, SSN and more – regardless of which field they might be hiding under.
Our DLP Filters will be highly flexible. You can decide to only enable them for users from specific geographies, for users on specific pages, for users with a certain cookie, and you can even mix-and-match different rules. After configuring your DLP filter, you can set what Managed Components you want it to apply for – letting you filter information differently according to the receiving target.
For each DLP filter you can choose your action type. For example, you might want to not send any information in which the system detected a SSN, but to only report a warning if a first name was detected. Masking will allow you to replace an email address like [email protected] with [email protected], making sure events containing email addresses are still sent, but without exposing the address itself.
While there are many DLP tools available in the market, we believe that the integration between Cloudflare Zaraz’s DLP features and Managed Components is the safest approach, because the DLP rules are effectively fencing the information not only before it is being sent, but before the component even accesses it.
Getting started with Managed Components and DLP
Cloudflare Zaraz is the most advanced Component Manager, and you can start using it today. We recently also announced an integrated Consent Management Platform. If your third-party tool of course is missing a Managed Component, you can always write a Managed Component of your own, as the technology is completely open sourced.
While we’re working on bringing advanced permissions handling, data masking and DLP Filters to all users, you can sign up for the closed beta, and we’ll contact you shortly.
The Internet is an endless flow of conversations between computers. These conversations, the constant exchange of information from one computer to another, are what allow us to interact with the Internet as we know it. Application Programming Interfaces (APIs) are the vital channels that carry these conversations, and their usage is quickly growing: in fact, more than half of the traffic handled by Cloudflare is for APIs, and this is increasing twice as fast as traditional web traffic.
In March, we announced that we’re expanding our API Shield into a full API Gateway to make it easy for our customers to protect and manage those conversations. We already offer several features that allow you to secure your endpoints, but there’s more to endpoints than their security. It can be difficult to keep track of many endpoints over time and understand how they’re performing. Customers deserve to see what’s going on with their API-driven domains and have the ability to manage their endpoints.
Today, we’re excited to announce that the ability to save, update, and monitor the performance of all your API endpoints is now generally available to API Shield customers. This includes key performance metrics like latency, error rate, and response size that give you insights into the overall health of your API endpoints.
A Refresher on APIs
The bar for what we expect an application to do for us has risen tremendously over the past few years. When we open a browser, app, or IoT device, we expect to be able to connect to data instantly, compare dozens of flights within seconds, choose a menu item from a food delivery app, or see the weather for ten locations at once.
How are applications able to provide this kind of dynamic engagement for their users? They rely on APIs, which provide access to data and services—either from the application developer or from another company. APIs are fundamental in how computers (or services) talk to each other and exchange information.
You can think of an API as a waiter: say a customer orders a delicious bowl of Mac n Cheese. The waiter accepts this order from the customer, communicates the request to the chef in a format the chef can understand, and then delivers the Mac n Cheese back to the customer (assuming the chef has the ingredients in stock). The waiter is the crucial channel of communication, which is exactly what the API does.
Managing API Endpoints
The first step in managing APIs is to get a complete list of all the endpoints exposed to the internet. API Discovery automatically does this for any traffic flowing through Cloudflare. Undiscovered APIs can’t be monitored by security teams (since they don’t know about them) and they’re thus less likely to have proper security policies and best practices applied. However, customers have told us they also want the ability to manually add and manage APIs that are not yet deployed, or they want to ignore certain endpoints (for example those in the process of deprecation). Now, API Shield customers can choose to save endpoints found by Discovery or manually add endpoints to API Shield.
But security vulnerabilities aren’t the only risk or area of concern with APIs – they can be painfully slow or connections can be unsuccessful. We heard questions from our customers such as: what are my most popular endpoints? Is this endpoint significantly slower than it was yesterday? Are any endpoints returning errors that may indicate a problem with the application?
That’s why we built Performance Metrics into API Shield, which allows our customers to quickly answer these questions themselves with real-time data.
Prioritizing Performance
Once you’ve discovered, saved, or removed endpoints, you want to know what’s going well and what’s not. To end-users, a huge part of what defines the experience as “going well” is good performance. Poor performance can lead to a frustrating experience: when you’re shopping online and press a button to check out, you don’t want to wait around for minutes for the page to load. And you certainly never want to see a dreaded error symbol telling you that you can’t get what you came for.
Exposing performance metrics of API endpoints puts concrete numerical data into your developers’ hands to tell you how things are going. When things are going poorly, these dashboard metrics will point out exactly which aspect of performance is causing concern: maybe you expected to see a spike in requests, but find out that request count is normal and latency is just higher than usual.
Empowering our customers to make data-driven decisions to better manage their APIs ends up being a win for our customers and our customers’ customers, who expect to seamlessly engage with the domain’s APIs and get exactly what they came for.
Management and Performance Metrics in the Dashboard
So, what’s available today? Log onto your Cloudflare dashboard, go to the domain-level Security tab, and open up the API Shield page. Here, you’ll see the Endpoint Management tab, which shows you all the API endpoints that you’ve saved, alongside placeholders for metrics that will soon be gathered.
Here you can easily delete endpoints you no longer want to track, or click manually add additional endpoints. You can also export schemas for each host to share internally or externally.
Once you’ve saved the endpoints that you want to keep tabs on, Cloudflare will start collecting data on its performance and make it available to you as soon as possible.
In Endpoint Management, you can see a few summary metrics in the collapsed view of each endpoint, including recommended rate limits, average latency, and error rate. It can be difficult to tell whether things are going well or not just from seeing a value alone, so we added sparklines that show relative performance, comparing an endpoint’s current metrics with its usual or previous data.
If you want to view further details about a given endpoint, you can expand it for additional metrics such as response size and errors separated by 4xx and 5xx. The expanded view also allows you to view all metrics at a single timestamp by hovering over the charts.
For each saved endpoint, customers can see the following metrics:
Request count: total number of requests to the endpoint over time.
Rate limiting recommendation per 10 minutes, which is guided by the request count.
Latency: average origin response time, in milliseconds (ms). How long does it take from the moment a visitor makes a request to the moment the visitor gets a response back from the origin?
Error rate vs. overall traffic: grouped by 4xx, 5xx, and their sum.
Response size: average size of the response (in bytes) returned to the request.
You can toggle between viewing these metrics on a 24-hour period or a 7-day period, depending on the scale on which you’d like to view your data. And in the expanded view, we provide a percentage difference between the averages of the current vs. the previous period. For example, say I’m viewing my metrics on a 24-hour timeline. My average latency yesterday was 10 ms, and my average latency today is 30 ms, so the dashboard shows a 200% increase. We also use anomaly detection to bring attention to endpoints that have concerning performance changes.
Additional improvements to Discovery and Schema Validation
As part of making endpoint management GA, we’re also adding two additional enhancements to API Shield.
First, API Discovery now accepts cookies — in addition to authorization headers — to discover endpoints and suggest rate limiting thresholds. Previously, you could only identify an API session with HTTP headers, which didn’t allow customers to protect endpoints that use cookies as session identifiers. Now these endpoints can be protected as well. Simply go to the API Shield tab in the dashboard, choose edit session identifiers, and either change the type, or click Add additional identifier.
Second, we added the ability to validate the body of requests via Schema Validation for all customers. Schema Validation allows you to provide an OpenAPI schema (a template for your API traffic) and have Cloudflare block non-conformant requests as they arrive at our edge. Previously, you provided specific headers, cookies, and other features to validate. Now that we can validate the body of requests, you can use Schema Validation to confirm every element of a request matches what is expected. If a request contains strange information in the payload, we’ll notice. Note: customers who have already uploaded schemas will need to re-upload to take advantage of body validation.
Endpoint Management, performance metrics, schema exporting, discovery via cookies, and schema body validation are all available now for all API Shield customers. To use them, log into the Cloudflare dashboard, click on Security in the navigation bar, and choose API Shield. Once API Shield is enabled, you’ll be able to start discovering endpoints immediately. You can also use all features through our API.
If you aren’t yet protecting a website with Cloudflare, it only takes a few minutes to sign up.
We announced the Data Localization Suite in 2020, when requirements for data localization were already important in the European Union. Since then, we’ve witnessed a growing trend toward localization globally. We are thrilled to expand our coverage to these countries in Asia Pacific, allowing more customers to use Cloudflare by giving them precise control over which parts of the Cloudflare network are able to perform advanced functions like WAF or Bot Management that require inspecting traffic.
Regional Services, a recap
In 2020, we introduced (Regional Services), a new way for customers to use Cloudflare. With Regional Services, customers can limit which data centers actually decrypt and inspect traffic. This helps because certain customers are affected by regulations on where they are allowed to service traffic. Others have agreements with their customers as part of contracts specifying exactly where traffic is allowed to be decrypted and inspected.
As one German bank told us: “We can look at the rules and regulations and debate them all we want. As long as you promise me that no machine outside the European Union will see a decrypted bank account number belonging to one of my customers, we’re happy to use Cloudflare in any capacity”.
Under normal operation, Cloudflare uses its entire network to perform all functions. This is what most customers want: leverage all of Cloudflare’s data centers so that you always service traffic to eyeballs as quickly as possible. Increasingly, we are seeing customers that wish to strictly limit which data centers service their traffic. With Regional Services, customers can use Cloudflare’s network but limit which data centers perform the actual decryption. Products that require decryption, such as WAF, Bot Management and Workers will only be applied within those data centers.
How does Regional Services work?
You might be asking yourself: how does that even work? Doesn’t Cloudflare operate an anycast network? Cloudflare was built from the bottom up to leverage anycast, a routing protocol. All of Cloudflare’s data centers advertise the same IP addresses through Border Gateway Protocol. Whichever data center is closest to you from a network point of view is the one that you’ll hit.
This is great for two reasons. The first is that the closer the data center to you, the faster the reply. The second great benefit is that this comes in very handy when dealing with large DDoS attacks. Volumetric DDoS attacks throw a lot of bogus traffic at you, which overwhelms network capacity. Cloudflare’s anycast network is great at taking on these attacks because they get distributed across the entire network.
Anycast doesn’t respect regional borders, it doesn’t even know about them. Which is why out of the box, Cloudflare can’t guarantee that traffic inside a country will also be serviced there. Although typically you’ll hit a data center inside your country, it’s very possible that your Internet Service Provider will send traffic to a network that might route it to a different country.
Regional Services solves that: when turned on, each data center becomes aware of which region it is operating in. If a user from a country hits a data center that doesn’t match the region that the customer has selected, we simply forward the raw TCP stream in encrypted form. Once it reaches a data center inside the right region, we decrypt and apply all Layer 7 products. This covers products such as CDN, WAF, Bot Management and Workers.
Let’s take an example. A user is in Kerala, India and their Internet Service Provider has determined that the fastest path to one of our data centers is to Colombo, Sri Lanka. In this example, a customer may have selected India as the sole region within which traffic should be serviced. The Colombo data center sees that this traffic is meant for the India region. It does not decrypt, but instead forwards it to the closest data center inside India. There, we decrypt and products such as WAF and Workers are applied as if the traffic had hit the data center directly.
Bringing Regional Services to Asia
Historically, we’ve seen most interest in Regional Services in geographic regions such as the European Union and the Americas. Over the past few years, however, we are seeing a lot of interest from Asia Pacific. Based on customer feedback and analysis on regulations we quickly concluded there were three key regions we needed to support: India, Japan and Australia. We’re proud to say that all three are now generally available for use today.
But we’re not done yet! We realize there are many more customers that require localization to their particular region. We’re looking to add many more in the near future and are working hard to make it easier to support more of them. If you have a region in mind, we’d love to hear it!
India, Japan and Australia are all live today! If you’re interested in using the Data Localization Suite, contact your account team!
Following today’s announcement of General Availability of Cloudflare R2 object storage, we’re excited to announce that customers can also store and retrieve their logs on R2.
Cloudflare’s Logging and Analytics products provide vital insights into customers’ applications. Though we have a breadth of capabilities, logs in particular play a pivotal role in understanding what occurs at a granular level; we produce detailed logs containing metadata generated by Cloudflare products via events flowing through our network, and they are depended upon to illustrate or investigate anything (and everything) from the general performance or health of applications to closely examining security incidents.
Until today, we have only provided customers with the ability to export logs to 3rd-party destinations – to both store and perform analysis. However, with Log Storage on R2 we are able to offer customers a cost-effective solution to store event logs for any of our products.
The cost conundrum
We’ve unpacked the commercial impact in a previous blog post, but to recap, the cost of storage can vary broadly depending on the volume of requests Internet properties receive. On top of that – and specifically pertaining to logs – there’s usually more expensive fees to access that data whenever the need arises. This can be incredibly problematic, especially when customers are having to balance their budget with the need to access their logs – whether it’s to mitigate a potential catastrophe or just out of curiosity.
With R2, not only do we not charge customers egress costs, but we also provide the opportunity to make further operational savings by centralizing storage and retrieval. Though, most of all, we just want to make it easy and convenient for customers to access their logs via our Retrieval API – all you need to do is provide a time range!
Logs on R2: get started!
Why would you want to store your logs on Cloudflare R2? First, R2 is S3 API compatible, so your existing tooling will continue to work as is. Second, not only is R2 cost-effective for storage, we also do not charge any egress fees if you want to get your logs out of Cloudflare to be ingested into your own systems. You can store logs for any Cloudflare product, and you can also store what you need for as long as you need; retention is completely within your control.
Storing Logs on R2
To create Logpush jobs pushing to R2, you can use either the dashboard or Cloudflare API. Using the dashboard, you can create a job and select R2 as the destination during configuration:
To use the Cloudflare API to create the job, do something like:
Now that you have critical logging infrastructure on Cloudflare, you probably want to be able to monitor the health of these Logpush jobs as well as get relevant alerts when something needs your attention.
Looking forward
While we have a vision to build out log analysis and forensics capabilities on top of R2 – and a roadmap to get us there – we’d still love to hear your thoughts on any improvements we can make, particularly to our retrieval options.
Get setup on R2 to start pushing logs today! If your current plan doesn’t include Logpush, storing logs on R2 is another great reason to upgrade!
Cloudflare Images was announced one year ago on this very blog to help you solve the problem of delivering images in the right size, right quality and fast. Very fast.
It doesn’t really matter if you only run a personal blog, or a portal with thousands of vendors and millions of end-users. Doesn’t matter if you need one hundred images to be served one thousand times each at most, or if you deal with tens of millions of new, unoptimized, images that you deliver billions of times per month.
We want to remove the complexity of dealing with the need to store, to process, resize, re-encode and serve the images using multiple platforms and vendors.
At the time we wrote:
Images is a single product that stores, resizes, optimizes and serves images. We built Cloudflare Images, so customers of all sizes can build a scalable and affordable image pipeline in minutes.
We supported the most common formats, such as JPG, WebP, PNG and GIF.
We did not feel the need to support SVG files. SVG files are inherently scalable, so there is nothing to resize on the server side before serving them to your audience. One can even argue that SVG files are documents that can generate images through mathematical formulas of vectors and nodes, but are not images per se.
There was also the clear notion that SVG files were a potential risk due to known and well documented vulnerabilities. We knew we could do something from the security angle, but still, why go through that workload if it didn’t make sense in the first place to consider an SVG as a supported format.
If you relied on SVGs, you had to select a second storage location or a second image platform elsewhere. That commonly resulted in an egress fee when serving an uncached file from that source, and it goes against what we want for our product: one image pipeline to cover all your needs.
We heard loud and clear, and starting from today, you can store and serve SVG files, safely, with Cloudflare Images.
SVG, what is so special about them?
The Scalable Vector Graphics file type is great for serving all kinds of illustrations, charts, logos, and icons.
SVG files don’t represent images as pixels, but as geometric shapes (lines, arcs, polygons) that can be drawn with perfect sharpness at any resolution.
Let’s use now a complex image as an example, filled with more than four hundred paths and ten thousand nodes:
Contrary to the bitmaps where pixels arrange together to create the visual perception of an image to the human eye, that vector image can be resized with no quality loss. That happens because resizing that SVG to 300% of its original size is redefining the size of the vectors to 300%, not expanding pixels to 300%.
This becomes evident when we’re dealing with small resolution images.
Here is the 100px width SVG from the Toroid shown above:
and the correspondent 100 pixels width PNG:
Now here is the same SVG with the HTML width attribute set at 300px:
and the same PNG you saw before, but, upscaled by 3x, so the width is also 300px:
The visual quality loss on the PNG is obvious when it gets scaled up.
Keep in mind: The Toroid shown above is stored in an SVG file of 142Kb. And that is a very complex and heavy SVG file already.
Now, if you do want to display a PNG with an original width of 1024px to present a high quality image of the same Toroid above, the size will become an issue:
The new 1024px PNG, however, weighs 344 KB. That’s about 2.4 times the weight of the unique SVG that you could use in any size.
Think about the storage and bandwidth savings when all you need to do with an SVG, to get the exact same displayed image is use a width=”1024” in your HTML. It requires less than half of the kilobytes used on the PNG.
Couple all of this with the flexibility of using attributes like viewbox in your HTML code, and you can pan, zoom, crop, scale, all without ever needing anything other than the one and original SVG file.
Here’s an example of an SVG being resized on the client side, with no visual quality loss:
Let’s do a quick summary of what we covered so far: SVG files are wonderful for vector images like illustrations, charts, logos, and are infinitely scalable with no need to resize on the server side;
the same generated image, but on a bitmap is either heavier than the SVG when used in high resolutions, or with very noticeable loss of visual quality when scaled up from a lower resolution.
So, what are the downsides of using SVG files?
SVG files aren’t just images. They are XML-based documents that are as powerful as HTML pages. They can contain arbitrary JavaScript, fetch external content from other URLs or embed HTML elements. This gives SVG files much more power than expected from a simple image.
Throughout the years, numerous exploits have been known, identified and corrected.
Entities can be something as simple as a declaration of a text string, or a nested reference to other previous entities.
If you defined a first entity with a simple string, and then created a second entity calling 10 times the first one, and then a third entity calling 10 times the second one up until a 10th one of the same kind, you were requiring a parser to generate an output of a billion strings as defined on the very simple first entity. This would most commonly exhaust resources on the server parsing the XML, and form a DoS. While that particular limitation from the XML parsing got widely addressed through XML parser memory caps and lazy loading of entities, more complex attacks became a regular thing in recent years.
The common themes in these more recent attacks have been XSS (cross-site-scripting) and foreign objects referenced in the XML content. In both cases, using SVG inside <object> tags in your HTML is an invitation for any ill-intended file to reach your end-users. So, what exactly can we do about it and make you trust any SVG file you serve?
The SVG filter
We’ve developed a filter that simplifies SVG files to only features used for images, so that serving SVG images from any source is just as safe as serving a JPEG or PNG, while preserving SVG’s vector graphics capabilities.
We remove scripting. This prevents SVG files from being used for cross-site scripting attacks. Although browsers don’t allow scripts in <img>, they would run scripts when SVG files are opened directly as a top-level document.
We remove hyperlinks to other documents. This makes SVG files less attractive for SEO spam and phishing.
We remove references to cross-origin resources. This stops 3rd parties from tracking who is viewing the image.
What’s left is just an image.
SVG files can also contain embedded images in other formats, like JPEG and PNG, in the form of Data URLs. We treat these embedded images just like other images that we process, and optimize them too. We don’t support SVG files embedded in SVG recursively, though. It does open the door to recursive parsing leading to resource exhaustion on the parser. While the most common browsers are already limiting SVG recursion to one level, the potential to exploit that door led us to not include, at least for now, this capability on our filter.
We do set Content-Security-Policy (CSP) headers in all our HTTP response headers to disable unwanted features, and that alone acts as first defense, but filtering acts in more depth in case these headers are lost (e.g. if the image was saved as a file and served elsewhere).
Our tool is open-source. It’s written in Rust and can filter SVG files in a streaming fashion without buffering, so it’s fast enough for filtering on the fly.
The SVG format is pretty complex, with lots of features. If there is safe SVG functionality that we don’t support yet, you can report issues and contribute to development of the filter.
You can see how the tool actually works by looking at the tests folder in the open-source repository, where a sample unfiltered XML and the already filtered version are present.
Here’s how a diff of those files looks like:
Removed are the external references, foreignObjects and any other potential threats.
How you can use SVG files in Cloudflare Images
Starting now you can upload SVG files to Cloudflare Images and serve them at will. Uploading the images can be done like for any other supported format, via UI or API.
Variants, named or flexible, are intended to transform bitmap (raster) images into whatever size you want to serve them.
SVG files, as vector images, do not require resizing inside the Images pipeline.
This results in a banner with the following message when you’re previewing an SVG in the UI:
And as a result, all variants listed will show the exact same image in the exact same dimensions.
Because an image is worth a thousand words, especially when trying to describe behaviors, here is what will it look like if you scroll through the variants preview:
With Cloudflare Images you do get a default Public Variant listed when you start using the product, and so you can immediately start serving your SVG files using it, just like this:
And, as shown from above, you can use any of your variant names to serve the image, as it won’t affect the output at all.
If you’re an Image Resizing customer, you can also benefit from serving your files with our tool. Make sure you head to the Developer Documentation pages to see how.
What’s next?
You can subscribe to Cloudflare Images directly in the dashboard, and starting from today you can use the product to store and serve SVG files.
If you want to contribute to further developments of the filtering too and help expand its abilities, check out our SVG-Hush Tool repo.
A few months ago we launched Custom Domains into an open beta. Custom Domains allow you to hook up your Workers to the Internet, without having to deal with DNS records or certificates – just enter a valid hostname and Cloudflare will do the rest! The beta’s over, and Custom Domains are now GA.
Custom Domains aren’t just about a seamless developer experience; they also allow you to build a globally distributed instantly scalable application on Cloudflare’s Developer Platform. That’s because Workers leveraging Custom Domains have no concept of an ‘Origin Server’. There’s no ‘home’ to phone to – and that also means your application can use the power of Cloudflare’s global network to run your application, well, everywhere. It’s truly serverless.
Let’s build “Todo”, but without the servers
Today we’ll start a series of posts outlining a simple todo list application. We’ll start with an API and hook it up to the Internet using Custom Domains.
With Custom Domains, you’re treating the whole network as the application server. Any time a request comes into a Cloudflare data center, Workers are triggered in that data center and connect to resources across the network as needed. Our developers don’t need to think about regions, or replication, or spinning up the right number of instances to handle unforeseen load. Instead, just deploy your Workers and Cloudflare will handle the rest.
For our todo application, we begin by building an API Gateway to perform routing, any authorization checks, and drop invalid requests. We then fan out to each individual use case in a separate Worker, so our teams can independently make updates or add features to each endpoint without a full redeploy of the whole application. Finally, each Worker has a D1 binding to be able to create, read, update, and delete records from the database. All of this happens on Cloudflare’s global network, so your API is truly available everywhere. The architecture will look something like this:
Bootstrap the D1 Database
First off, we’re going to need a D1 database set up, with a schema for our todo application to run on. If you’re not familiar with D1, it’s Cloudflare’s serverless database offering – explained in more detail here. To get started, we use the wrangler d1 command to create a new database:
After executing this command, you will be asked to add a snippet of code to your wrangler.tomlfile that looks something like this:
[[ d1_databases ]]
binding = "db" # i.e. available in your Worker on env.db
database_name = "<todo | custom-database-name>"
database_id = "<UUID>"
Let’s save that for now, and we’ll put these into each of our private microservices in a few moments. Next, we’re going to create our database schema. It’s a simple todo application, so it’ll look something like this, with some seeded data:
db/schema.sql
DROP TABLE IF EXISTS todos;
CREATE TABLE todos (id INTEGER PRIMARY KEY, todo TEXT, todoStatus BOOLEAN NOT NULL CHECK (todoStatus IN (0, 1)));
INSERT INTO todos (todo, todoStatus) VALUES ("Fold my laundry", 0),("Get flowers for mum’s birthday", 0),("Find Nemo", 0),("Water the monstera", 1);
You can bootstrap your new D1 database by running:
Great! We’ve now got a database running entirely on Cloudflare’s global network.
Build the endpoint Workers
To talk to your database, we’ll spin up a series of private microservices for each endpoint in our application. We want to be able to create, read, update, delete, and list our todos. The full source code for each is available here. Below is code from a Worker that lists all our todos from D1.
The Worker ‘todo-list’ needs to be able to access D1 from the environment variable db. To do this, we’ll define the D1 binding in our wrangler.toml file. We also specify that workers_dev is false, preventing a preview from being generated via workers.dev (we want this to be a private microservice).
list/wrangler.toml
name = "todo-list"
main = "src/list.js"
compatibility_date = "2022-09-07"
workers_dev = false
usage_model = "unbound"

[[ d1_databases ]]
binding = "db" # i.e. available in your Worker on env.db
database_name = "<todo | custom-database-name>"
database_id = "UUID"
Finally, use wrangler publish to deploy this microservice.
todo/list on ∞main [!]
› wrangler publish
 ⛅️ wrangler 0.0.0-893830aa
-----------------------------------------------------------------------
Retrieving cached values for account from ../../../node_modules/.cache/wrangler
Your worker has access to the following bindings:
- D1 Databases:
  - db: todo (UUID)
Total Upload: 4.71 KiB / gzip: 1.60 KiB
Uploaded todo-list (0.96 sec)
No publish targets for todo-list (0.00 sec)
Notice that wrangler mentions there are no ‘publish targets’ for todo-list. That’s because we haven’t hooked todo-list up to any HTTP endpoints. That’s fine! We’re going to use Service Bindings to route requests through a gateway worker, as described in the architecture diagram above.
Next, reuse these steps to create similar microservices for each of our create, read, update, and delete endpoints. The source code is available to follow along.
Tying it all together with an API Gateway
Each of our Workers are able to talk to the D1 database, but how can our application talk to our API? We’ll build out a simple API gateway to route incoming requests to the appropriate microservice. For the purposes of our application, we’re using a combination of URL pathname and request method to detect which endpoint is appropriate.
gateway/src/gateway.js
export default {
 async fetch(request, env) {
   try{
     const url = new URL(request.url)
     const idPattern = new URLPattern({ pathname: '/:id' })
     if (idPattern.test(request.url)) {
       switch (request.method){
         case 'GET':
           return await env.get.fetch(request.clone())
         case 'PATCH':
           return await env.update.fetch(request.clone())
         case 'DELETE':
           return await env.delete.fetch(request.clone())
         default:
           return new Response("Unsupported method for endpoint /:id", {status: 405})
       }
     } else if (url.pathname == '/') {
       switch (request.method){
         case 'GET':
           return await env.list.fetch(request.clone())
         case 'POST':
           return await env.create.fetch(request.clone())
         default:
           return new Response("Unsupported method for endpoint /", {status: 405})
       }
     }
     return new Response("Not found. Supported endpoints are /:id and /", {status: 404})
   } catch(e) {
     return new Response(e, {status: 500})
   }
 },
};
With our API gateway all set, we just need to expose our application to the Internet using a Custom Domain, and hook up our Service Bindings, so the gateway Worker can access each appropriate microservice. We’ll set this up in a wrangler.toml.
Next, use wrangler publish to deploy your application to the Cloudflare network. Seconds later, you’ll have a simple, functioning todo API built entirely on Cloudflare’s Developer Platform!
› wrangler publish
 ⛅️ wrangler 0.0.0-893830aa
-----------------------------------------------------------------------
Retrieving cached values for account from ../../../node_modules/.cache/wrangler
Your worker has access to the following bindings:
- Services:
  - get: todo-get
  - delete: todo-delete
  - create: todo-create
  - update: todo-update
  - list: todo-list
Total Upload: 1.21 KiB / gzip: 0.42 KiB
Uploaded todo-gateway (0.62 sec)
Published todo-gateway (0.51 sec)
  todos.radiobox.tv (custom domain - zone name: radiobox.tv)
Natively Global
Since it’s built natively on Cloudflare, you can also include Cloudflare’s security suite in front of the application. If we want to prevent SQL Injection attacks for this endpoint, we can enable the appropriate Managed WAF rules on our todos API endpoint. Alternatively, if we wanted to prevent global access to our API (only allowing privileged clients to access the application), we can simply put Cloudflare Access in front, with custom Access Rules.
With Custom Domains on Workers, you’re able to easily create applications that are native to Cloudflare’s global network, instantly. Best of all, your developers don’t need to worry about maintaining DNS records or certificate renewal – Cloudflare handles it all on their behalf. We’d like to give a huge shout out to the 5,000+ developers who used Custom Domains during the open beta period, and those that gave feedback along the way to make this possible. Can’t wait to see what you build next! As always, if you have any questions or would like to get involved, please join us on Discord.
Tune in next time to see how we can build a frontend for our application. In the meantime, you can play around with the todos API we built today at todos.radiobox.tv.
The Software as a Service (SaaS) model has changed the way we work – 80% of businesses use at least one SaaS application. Instead of investing in building proprietary software or installing and maintaining on-prem licensed software, SaaS vendors provide businesses with out-of-the-box solutions.
SaaS has many benefits over the traditional software model: cost savings, continuous updates and scalability, to name a few. However, any managed solution comes with trade-offs. As a business, one of the biggest challenges in adopting SaaS tooling is loss of customization. Not every business uses software in the same way and as you grow as a SaaS company it’s not long until you get customers saying “if only I could do X”.
Enter Workers for Platforms – Cloudflare’s serverless functions offering for SaaS businesses. With Workers for Platforms, your customers can build custom logic to meet their requirements right into your application.
We’re excited to announce that Workers for Platforms is now in GA for all Enterprise customers! If you’re an existing customer, reach out to your Customer Success Manager (CSM) to get access. For new customers, fill out our contact form to get started.
The conundrum of customization
As a SaaS business invested in capturing the widest market, you want to build a universal solution that can be used by customers of different sizes, in various industries and regions. However, every one of your customers has a unique set of tools and vendors and best practices. A generalized platform doesn’t always meet their needs.
For SaaS companies, once you get in the business of creating customizations yourself, it can be hard to keep up with seemingly never ending requests. You want your engineering teams to focus on building out your core business instead of building and maintaining custom solutions for each of your customer’s use cases.
With Workers for Platforms, you can give your customers the ability to write code that customizes your software. This gives your customers the flexibility to meet their exact use case while also freeing up internal engineering time – it’s a win-win!
How is this different from Workers?
Workers is Cloudflare’s serverless execution environment that runs your code on Cloudflare’s global network. Workers is lightning fast and scalable; running at data centers in 275+ cities globally and serving requests from as close as possible to the end user. Workers for Platforms extends the power of Workers to our customer’s developers!
So, what’s new?
Dispatch Worker: As a platform customer, you want to have full control over how end developer code fits in with your APIs. A Dispatch Worker is written by our platform customers to run their own logic before dispatching (aka routing) to Workers written by end developers. In addition to routing, it can be used to run authentication, create boilerplate functions and sanitize responses.
User Workers: User Workers are written by end developers, that is, our customers’ developers. End developers can deploy User Workers to script automated actions, create integrations or modify response payload to return custom content. Unlike self-managed Function-as-a-Service (FaaS) options, with Workers for Platforms, end developers don’t need to worry about setting up and maintaining their code on any 3rd party platform. All they need to do is upload their code and you – or rather Cloudflare – takes care of the rest.
Unlimited Scripts: Yes, you read that correctly! With hundreds-plus end developers, the existing 100 script limit for Workers won’t cut it for Workers for Platforms customers. Some of our Workers for Platforms customers even deploy a new script each time their end developers make a change to their code in order to maintain version control and to easily revert to a previous state if a bug is deployed.
Dynamic Dispatch Namespaces: If you’ve used Workers before, you may be familiar with a feature we released earlier this year, Service Bindings. Service Bindings are a way for two Workers to communicate with each other. They allow developers to break up their applications into modules that can be chained together. Service Bindings explicitly link two Workers together, and they’re meant for use cases where you know exactly which Workers need to communicate with each other.
Service Bindings don’t work in the Workers for Platforms model because User Workers are uploaded ad hoc. Dynamic Dispatch Namespaces is our solution to this! A Dispatch Namespace is composed of a collection of User Workers. With Dispatch Namespaces, a Dispatch Worker can be used to call any User Worker in a namespace (similar to how Service Bindings work) but without needing to explicitly pre-define the relationship.
Read more about how to use these features below!
How to use Workers for Platforms
Dispatch Workers
Dispatch Workers are the entry point for requests to Workers in a Dispatch Namespace. The Dispatch Worker can be used to run any functions ahead of User Workers. They can make a request to any User Workers in the Dispatch Namespace, and they ultimately handle the routing to User Workers.
Dispatch Workers are created the same way as a regular Worker, except they need a Dispatch Namespace binding in the project’s wrangler.toml configuration file.
In the example below, this Dispatch Worker reads the subdomain from the path and calls the appropriate User Worker. Alternatively you can use KV, D1 or your data store of choice to map identifying parameters from an incoming request to a User Worker.
export default {
 async fetch(request, env) {
   try {
       // parse the URL, read the subdomain
       let worker_name = new URL(request.url).host.split('.')[0]
       let user_worker = env.dispatcher.get(worker_name)
       return user_worker.fetch(request)
   } catch (e) {
       if (e.message == 'Error: Worker not found.') {
           // we tried to get a worker that doesn't exist in our dispatch namespace
           return new Response('', {status: 404})
       }
       // this could be any other exception from `fetch()` *or* an exception
       // thrown by the called worker (e.g. if the dispatched worker has
       // `throw MyException()`, you could check for that here).
       return new Response(e.message, {status: 500})
   }
 }

}
Uploading User Workers
User Workers must be uploaded to a Dispatch Namespace through the Cloudflare API (wrangler support coming soon!). This code snippet below uses a simple HTML form to take in a script and customer id and then uploads it to the Dispatch Namespace.
It’s that simple. With Dispatch Namespaces and Dispatch Workers, we’re giving you the building blocks to customize your SaaS applications. Along with the Platforms APIs, we’re also releasing a Workers for Platforms UI on the Cloudflare dashboard where you can view your Dispatch Namespaces, search scripts and view analytics for User Workers.
We’re releasing Workers for Platforms to all Cloudflare Enterprise customers. If you’re interested, reach out to your Customer Success Manager (CSM) to get access. To get started, take a look at our Workers for Platforms starter project and developer documentation.
We also have plans to release this down to the Workers Paid plan. Stay tuned on the Cloudflare Discord (channel name: workers-for-platforms-beta) for updates.
What’s next?
We’ve heard lots of great feature requests from our early Workers for Platforms customers. Here’s a preview of what’s coming next on the roadmap:
Fine-grained controls over User Workers: custom script limits, allowlist/blocklist for fetch requests
GraphQL and Logs: Metrics for User Workers by tag
Plug and play Platform Development Kit
Tighter integration with Cloudflare for SaaS custom domains
If you have specific feature requests in mind, please reach out to your CSM or get in touch through the Discord!
Today, we’re excited to announce that Stream Live is out of beta, available to everyone, and ready for production traffic at scale. Stream Live is a feature of Cloudflare Stream that allows developers to build live video features in websites and native apps.
Since its beta launch, developers have used Stream to broadcast live concerts from some of the world’s most popular artists directly to fans, build brand-new video creator platforms, operate a global 24/7 live OTT service, and more. While in beta, Stream has ingested millions of minutes of live video and delivered to viewers all over the world.
Bring your big live events, ambitious new video subscription service, or the next mobile video app with millions of users — we’re ready for it.
Streaming live video at scale is hard
Live video uses a massive amount of bandwidth. For example, a one-hour live stream at 1080p at 8Mbps is 3.6GB. At typical cloud provider egress prices, even a little egress can break the bank.
Live video must be encoded on-the-fly, in real-time. People expect to be able to watch live video on their phone, while connected to mobile networks with less bandwidth, higher latency and frequently interrupted connections. To support this, live video must be re-encoded in real-time into multiple resolutions, allowing someone’s phone to drop to a lower resolution and continue playback. This can be complex (Which bitrates? Which codecs? How many?) and costly: running a fleet of virtual machines doesn’t come cheap.
Ingest location matters — Live streaming protocols like RTMPS send video over TCP. If a single packet is dropped or lost, the entire connection is brought to a halt while the packet is found and re-transmitted. This is known as “head of line blocking”. The further away the broadcaster is from the ingest server, the more network hops, and the more likely packets will be dropped or lost, ultimately resulting in latency and buffering for viewers.
Delivery location matters — Live video must be cached and served from points of presence as close to viewers as possible. The longer the network round trips, the more likely videos will buffer or drop to a lower quality.
Broadcasting protocols are in flux — The most widely used protocol for streaming live video, RTMPS, has been abandoned since 2012, and dates back to the era of Flash video in the early 2000s. A new emerging standard, SRT, is not yet supported everywhere. And WebRTC has only recently evolved into an option for high definition one-to-many broadcasting at scale.
The old way to solve this has been to stitch together separate cloud services from different vendors. One vendor provides excellent content delivery, but no encoding. Another provides APIs or hardware to encode, but leaves you to fend for yourself and build your own storage layer. As a developer, you have to learn, manage and write a layer of glue code around the esoteric details of video streaming protocols, codecs, encoding settings and delivery pipelines.
We built Stream Live to make streaming live video easy, like adding an <img> tag to a website. Live video is now a fundamental building block of Internet content, and we think any developer should have the tools to add it to their website or native app.
With Stream, you or your users stream live video directly to Cloudflare, and Cloudflare delivers video directly to your viewers. You never have to manage internal encoding, storage, or delivery systems — it’s just live video in and live video out.
Our network, our hardware = a solution only Cloudflare can provide
We’re not the only ones building APIs for live video — but we are the only ones with our own global network and hardware that we control and optimize for video. That lets us do things that others can’t, like sub-second glass-to-glass latency using RTMPS and SRT playback at scale.
Newer video codecs require specialized hardware encoders, and while others are beholden to the hardware limitations of public cloud providers, we’re already hard at work installing the latest encoding hardware in our own racks, so that you can deliver high resolution video with even less bandwidth. Our goal is to make what is otherwise only available to video giants available directly to you — stay tuned for some exciting updates on this next week.
Most providers limit how many destinations you can restream or simulcast to. Because we operate our own network, we’ve never even worried about this, and let you restream to as many destinations as you need.
Operating our own network lets us price Stream based on minutes of video delivered — unlike others, we don’t pay someone else for bandwidth and then pass along their costs to you at a markup. The status quo of charging for bandwidth or per-GB storage penalizes you for delivering or storing high resolution content. If you ask why a few times, most of the time you’ll discover that others are pushing their own cost structures on to you.
Encoding video is compute-intensive, delivering video is bandwidth intensive, and location matters when ingesting live video. When you use Stream, you don’t need to worry about optimizing performance, finding a CDN, and/or tweaking configuration endlessly. Stream takes care of this for you.
Free your live video from the business models of big platforms
Nearly every business uses live video, whether to engage with customers, broadcast events or monetize live content. But few have the specialized engineering resources to deliver live video at scale on their own, and wire together multiple low level cloud services. To date, many of the largest content creators have been forced to depend on a shortlist of social media apps and streaming services to deliver live content at scale.
Unlike the status quo, who force you to put your live video in their apps and services and fit their business models, Stream gives you full control of your live video, on your website or app, on any device, at scale, without pushing your users to someone else’s service.
Other platforms charge for ingestion and encoding. Many even force you to consider where you’re streaming to and from, the bitrate and frames per second of your video, and even which of their datacenters you’re using.
With Stream, encoding and ingestion are free. Other platforms charge for delivery based on bandwidth, penalizing you for delivering high quality video to your viewers. If you stream at a high resolution, you pay more.
With Stream, you don’t pay a penalty for delivering high resolution video. Stream’s pricing is simple — minutes of video delivered and stored. Because you pay per minute, not per gigabyte, you can stream at the ideal resolution for your viewers without worrying about bandwidth costs.
Other platforms charge separately for analytics, requiring you to buy another product to get metrics about your live streams.
With Stream, analytics are free. Stream provides an API and Dashboard for both server-side and client-side analytics, that can be queried on a per-video, per-creator, per-country basis, and more. You can use analytics to identify which creators in your app have the most viewed live streams, inform how much to bill your customers for their own usage, identify where content is going viral, and more.
Other platforms tack on live recordings or DVR mode as a separate add-on feature, and recordings only become available minutes or even hours after a live stream ends.
With Stream, live recordings are a built-in feature, made available instantly after a live stream ends. Once a live stream is available, it works just like any other video uploaded to Stream, letting you seamlessly use the same APIs for managing both pre-recorded and live content.
Build live video into your website or app in minutes
Cloudflare Stream enables you or your users to go live using the same protocols and tools that broadcasters big and small use to go live to YouTube or Twitch, but gives you full control over access and presentation of live streams.
Step 2: Use the RTMPS key with any live broadcasting software, or in your own native app
Copy the RTMPS URL and key, and use them with your live streaming application. We recommend using Open Broadcaster Software (OBS) to get started, but any RTMPS or SRT compatible software should be able to interoperate with Stream Live.
Enter the Stream RTMPS URL and the Stream Key from Step 1:
Step 3: Preview your live stream in the Cloudflare Dashboard
In the Stream Dashboard, within seconds of going live, you will see a preview of what your viewers will see, along with the real-time connection status of your live stream.
Step 4: Add live video playback to your website or app
For example, on iOS, all you need to do is provide AVPlayer with the URL to the HLS manifest for your live input, which you can find via the API or in the Stream Dashboard.
import SwiftUI
import AVKit

struct MyView: View {
    // Change the url to the Cloudflare Stream HLS manifest URL
    private let player = AVPlayer(url: URL(string: "https://customer-9cbb9x7nxdw5hb57.cloudflarestream.com/8f92fe7d2c1c0983767649e065e691fc/manifest/video.m3u8")!)

    var body: some View {
        VideoPlayer(player: player)
            .onAppear() {
                player.play()
            }
    }
}

struct MyView_Previews: PreviewProvider {
    static var previews: some View {
        MyView()
    }
}
To run a complete example app in XCode, follow this guide in the Stream Developer docs.
Companies are building whole new video platforms on top of Stream
Developers want control, but most don’t have time to become video experts. And even video experts building innovative new platforms don’t want to manage live streaming infrastructure.
Switcher Studio’s whole business is live video — their iOS app allows creators and businesses to produce their own branded, multi camera live streams. Switcher uses Stream as an essential part of their live streaming infrastructure. In their own words:
“Since 2014, Switcher has helped creators connect to audiences with livestreams. Now, our users create over 100,000 streams per month. As we grew, we needed a scalable content delivery solution. Cloudflare offers secure, fast delivery, and even allowed us to offer new features, like multistreaming. Trusting Cloudflare Stream lets our team focus on the live production tools that make Switcher unique.”
While Stream Live has been in beta, we’ve worked with many customers like Switcher, where live video isn’t just one product feature, it is the core of their product. Even as experts in live video, they choose to use Stream, so that they can focus on the unique value they create for their customers, leaving the infrastructure of ingesting, encoding, recording and delivering live video to Cloudflare.
Start building live video into your website or app today
It takes just a few minutes to sign up and start your first live stream, using the Cloudflare Dashboard, with no code required to get started, but APIs for when you’re ready to start building your own live video features. Give it a try — we’re ready for you, no matter the size of your audience.
R2 gives developers object storage, without the egress fees. Before R2, cloud providers taught us to expect a data transfer tax every time we actually used the data we stored with them. Who stores data with the goal of never reading it? No one. Yet, every time you read data, the egress tax is applied. R2 gives developers the ability to access data freely, breaking the ecosystem lock-in that has long tied the hands of application builders.
In May 2022, we launched R2 into open beta. In just four short months we’ve been overwhelmed with over 12k developers (and rapidly growing) getting started with R2. Those developers came to us with a wide range of use cases from podcast applications to video platforms to ecommerce websites, and users like Vecteezy who was spending six figures in egress fees. We’ve learned quickly, gotten great feedback, and today we’re excited to announce R2 is now generally available.
We wouldn’t ask you to bet on tech we weren’t willing to bet on ourselves. While in open beta, we spent time moving our own products to R2. One such example, Cloudflare Images, proudly serving thousands of customers in production, is now powered by R2.
What can you expect from R2?
S3 Compatibility
R2 gives developers a familiar interface for object storage, the S3 API. WIth S3 Compatibility, you can easily migrate your applications and start taking advantage of what R2 has to offer right out of the gate.
Let’s take a look at some basic data operations in javascript. To try this out on your own, you’ll need to generate an Access Key.
// First we import our bindings as usual
import {
  S3Client,
  ListBucketsCommand,
} from "@aws-sdk/client-s3";

// Then we create a new client. Note that while R2 requires a region for S3 compatibility, only “auto” is supported
const S3 = new S3Client({
  region: "auto",
  endpoint: `https://${ACCOUNT_ID}.r2.cloudflarestorage.com`,
  credentials: {
    accessKeyId: ACCESS_KEY_ID, //  fill in your own
    secretAccessKey: SECRET_ACCESS_KEY, // fill in your own
  },
});

// And now we can use our client to list associated buckets just like we would with any other S3 compatible object storage
console.log(
  await S3.send(
    new ListBucketsCommand('')
  )
);
Regardless of the language, the S3 API offers familiarity. We have examples in Go, Java, PHP, and Ruby.
Region: Automatic
We don’t want to live in a world where developers are spending time looking into a crystal ball and predicting where application traffic might come from. Choosing a region as the first step in application development forces optimization decisions long before the first users show up.
While S3 compatibility requires you to specify a region, the only region we support is ‘auto’. Today, R2 automatically selects a bucket location in the closest available region to the create bucket request. If I create a bucket from my home in Austin, that bucket will live in the closest available R2 region to Austin.
In the future, R2 will use data access patterns to automatically optimize where data is stored for the best user experience.
Cloudflare Workers Integration
The Workers platform offers developers powerful compute across Cloudflare’s network. When you deploy on Workers, your code is deployed to Cloudflare’s 280+ locations across the globe, automatically. When paired with R2, Workers allows developers to add custom logic around their data without any performance overhead. Workers is built on isolates and not containers, and as a result you don’t have to deal with lengthy cold starts.
Let’s try creating a simple REST API for an R2 bucket! First, create your bucket and then add an R2 binding to your worker.
export default {
  async fetch(request, env) {
    const url = new URL(request.url);
    const key = url.pathname.slice(1); // we’ll derive a key from the url path

    switch (request.method) {
      // For writes, we capture the request body and write that out to our bucket under the associated key
      case 'PUT':
        await env.MY_BUCKET.put(key, request.body);
        return new Response(`Put ${key} successfully!`);

      // For reads, we’ll use our key to perform a lookup
      case 'GET':
        const object = await env.MY_BUCKET.get(key);

        // if we don’t find the given key we’ll return a 404 error
        if (object === null) {
          return new Response('Object Not Found', { status: 404 });
        }

        const headers = new Headers();
        object.writeHttpMetadata(headers);
        headers.set('etag', object.httpEtag);

        return new Response(object.body, {
          headers,
        });
    }
  },
};
Through this Workers API, we can add all sorts of useful logic to the hot path of a R2 request.
Presigned URLs
Sometimes you’ll want to give your users permissions to specific objects in R2 without requiring them to jump through hoops. Through pre-signed URLs you can delegate your permissions to your users for any unique combination of object and action. Mint a pre-signed URL to let a user upload a file or share a file without giving access to the entire bucket.
import {
  S3Client,
  PutObjectCommand
} from "@aws-sdk/client-s3";

import { getSignedUrl } from "@aws-sdk/s3-request-presigner";

const S3 = new S3Client({
  region: "auto",
  endpoint: `https://${ACCOUNT_ID}.r2.cloudflarestorage.com`,
  credentials: {
    accessKeyId: ACCESS_KEY_ID,
    secretAccessKey: SECRET_ACCESS_KEY,
  },
});

// With getSignedUrl we can produce a custom url with a one hour expiration which will allow our end user to upload their dog pic
console.log(
  await getSignedUrl(S3, new PutObjectCommand({Bucket: 'my-bucket-name', Key: 'dog.png'}), { expiresIn: 3600 })
)
Presigned URLs make it easy for developers to build applications that let end users safely access R2 directly.
Public buckets
Enabling public access for a R2 bucket allows you to expose that bucket to unauthenticated requests. While doing so on its own is of limited use, when those buckets are linked to a domain under your account on Cloudflare you can enable other Cloudflare features such as Access, Cache and bot management seamlessly on top of your data in R2.
Bottom line: public buckets help to bridge the gap between domain oriented Cloudflare features and the buckets you have in R2.
Transparent Pricing
R2 will never charge for egress. The pricing model depends on three factors alone: storage volume, Class A operations (writes, lists) and Class B operations (reads).
Storage is priced at $0.015 / GB, per month.
Class A operations cost $4.50 / million.
Class B operations cost $0.36 / million.
But before you’re ready to start paying for R2, we allow you to get up and running at absolutely no cost. The included usage is as follows:
10 GB-months of stored data
1,000,000 Class A operations, per month
10,000,000 Class B operations, per month
What’s next?
Making R2 generally available is just the beginning of our object storage journey. We’re excited to share what we plan to build next.
Object Lifecycles
In the future R2 will allow developers to set policies on objects. For example, setting a policy that deletes an object 60 days after it was last accessed. Object Lifecycles pushes object management down to the object store.
Jurisdictional Restrictions
While we don’t have plans to support regions explicitly, we know that data locality is important for a good deal of compliance use cases. Jurisdictional restrictions will allow developers to set a jurisdiction like the ‘EU’ that would prevent guarantee data from leavingwould not leave the jurisdiction.
Live Migration without Downtime
For large datasets, migrations are live and ongoing, as it takes time to move data over. Cache reserve is an easy way to quickly migrate your assets into a managed R2 instance to reduce your egress costs at the touch of a button. In the future, we’ll be extending this mechanism so that you can migrate any of your existing S3 object storage buckets to R2.
We invite everyone to sign up and get started with R2 today. Join the growing community of developers building on Cloudflare. If you have any feedback or questions, find us on our Discord server here! We can’t wait to see what you build.
The collective thoughts of the interwebz
Manage Consent
To provide the best experiences, we use technologies like cookies to store and/or access device information. Consenting to these technologies will allow us to process data such as browsing behavior or unique IDs on this site. Not consenting or withdrawing consent, may adversely affect certain features and functions.
Functional
Always active
The technical storage or access is strictly necessary for the legitimate purpose of enabling the use of a specific service explicitly requested by the subscriber or user, or for the sole purpose of carrying out the transmission of a communication over an electronic communications network.
Preferences
The technical storage or access is necessary for the legitimate purpose of storing preferences that are not requested by the subscriber or user.
Statistics
The technical storage or access that is used exclusively for statistical purposes.The technical storage or access that is used exclusively for anonymous statistical purposes. Without a subpoena, voluntary compliance on the part of your Internet Service Provider, or additional records from a third party, information stored or retrieved for this purpose alone cannot usually be used to identify you.
Marketing
The technical storage or access is required to create user profiles to send advertising, or to track the user on a website or across several websites for similar marketing purposes.