Post Syndicated from Arturs Lontons original https://blog.zabbix.com/whats-new-in-zabbix-8-0-lts/33755/
Zabbix 8.0 LTS might just be the largest Zabbix update yet. With a focus on application performance monitoring, new event processing workflows, scalability improvements, and MCP server for connecting Zabbix to your AI agents, Zabbix 8.0 stands out as a feature-rich and scalable solution for organizations of all types and sizes.
Application performance monitoring
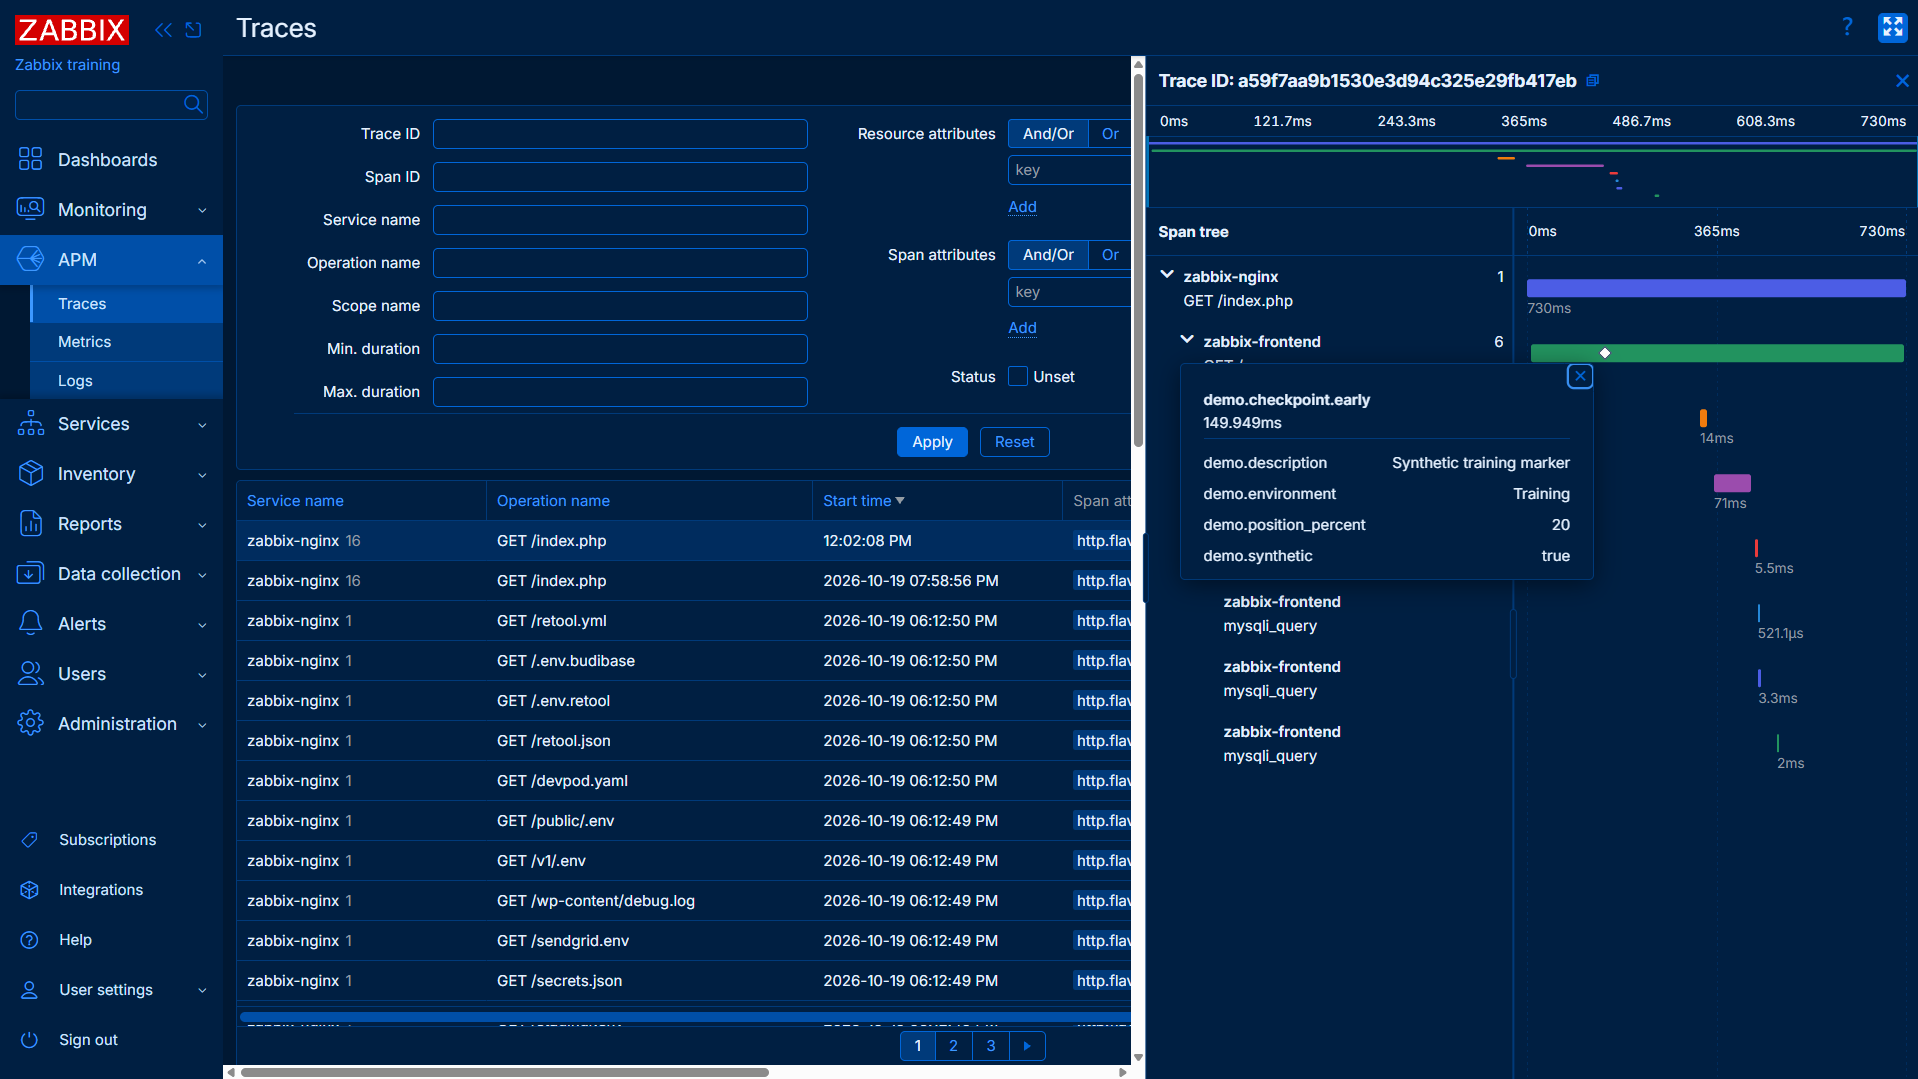
Application performance monitoring (APM) has been one of our most requested features, and with the release of Zabbix 8.0 we’re ready to introduce it to our users.
Zabbix 8.0 LTS APM features enable Zabbix to collect and analyze metrics, logs, and traces collected using the OpenTelemetry protocol (OTLP). In our current implementation, OTLP data must be stored in a ClickHouse history backend, which can be configured as a Zabbix APM data source.
OpenTelemetry protocol data can be written to the ClickHouse source database either by a Zabbix proxy (which listens and collects incoming OTLP data and writes it to the ClickHouse database) or it can be sent directly to the ClickHouse database by the application itself using third-party plugins and solutions.
Telemetry query item
Existing item types have also been expanded to support OpenTelemetry data collection. The new Telemetry query item type enables the collection of specific OpenTelemetry traces, metrics, and logs. The item supports filtering based on OpenTelemetry data fields – meaning that only the matching data is picked up by the item.
In addition, the item can be configured to collect and aggregate only specific OpenTelemetry data columns, returning a JSON with the required data. The data collection buckets can also be configured with parameters such as Time shift, Lookback limit, and Granularity.
We also offer a Generic OpenTelemetry by OTLP template which can serve as a starting point for Telemetry Query item creation and problem detection.
More detailed information regarding Telemetry query item configuration can be found in Zabbix documentation.
ClickHouse history backend
The ClickHouse history backend was specifically selected as the new history backend option because of the scalability and performance supported by ClickHouse.
ClickHouse can be configured as an additional history backend, meaning a regular MySQL or PostgreSQL database is still required to store Zabbix configuration. ClickHouse then can be configured to store specific types of data. There are a variety of benefits to implementing a ClickHouse history backend in your environment:
- Column-based storage enables faster queries
- Horizontal scaling and parallel processing by using sharding
- In synthetic tests proven to support millions of values per second
- ClickHouse is used as OpenTelemetry data storage
Complex event processing
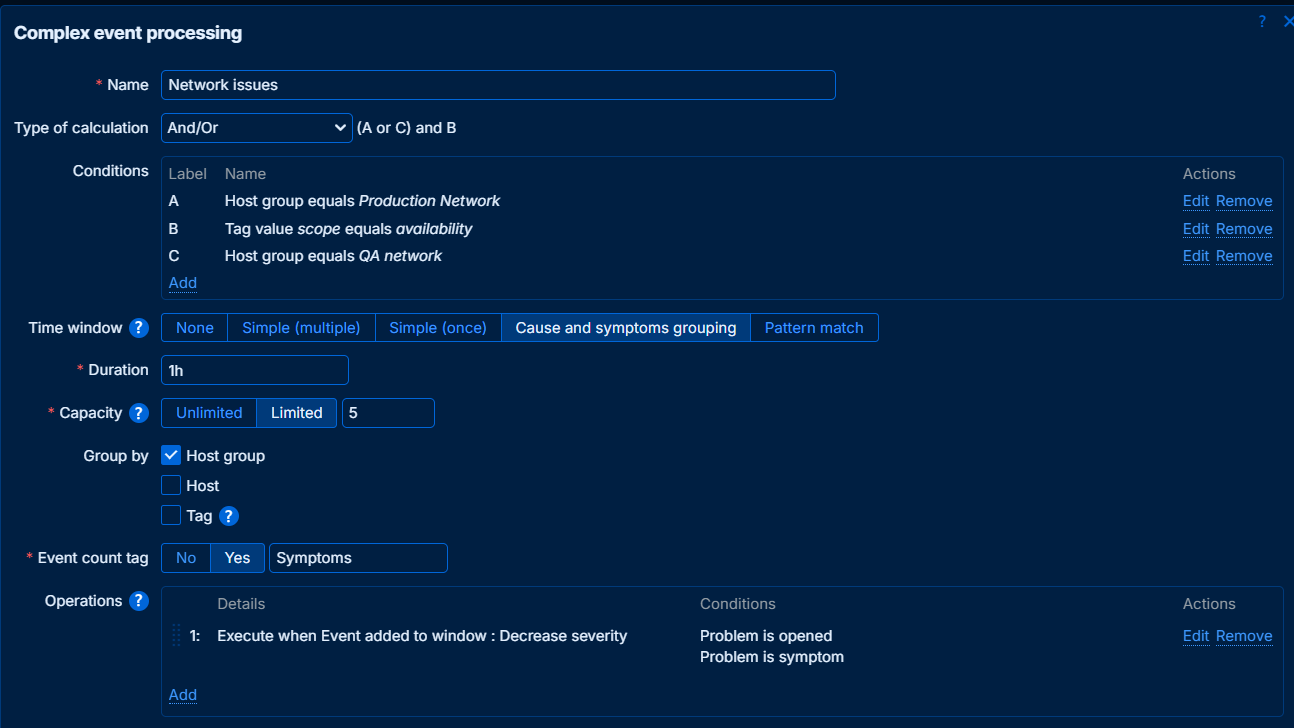
Over time we’ve introduced a variety of features and made design decisions to support the eventual introduction of our new complex event processing engine. The goal of the newly introduced complex event processing features is to support a variety of event processing scenarios, such as:
- Automated cause and symptom event ranking
- Event deduplication
- Event enrichment with contextual information
- Automatic event closure and discarding
Under the hood, the complex event processing rules are based on conditions (which events to match), a time window (the window during which event processing logic will be performed) and operations (what is going to be done with matched events).
For most complex use cases where the available event matching methods might not suffice, Zabbix administrators have the option to use JavaScript-based event pattern matching.
Zabbix MCP server
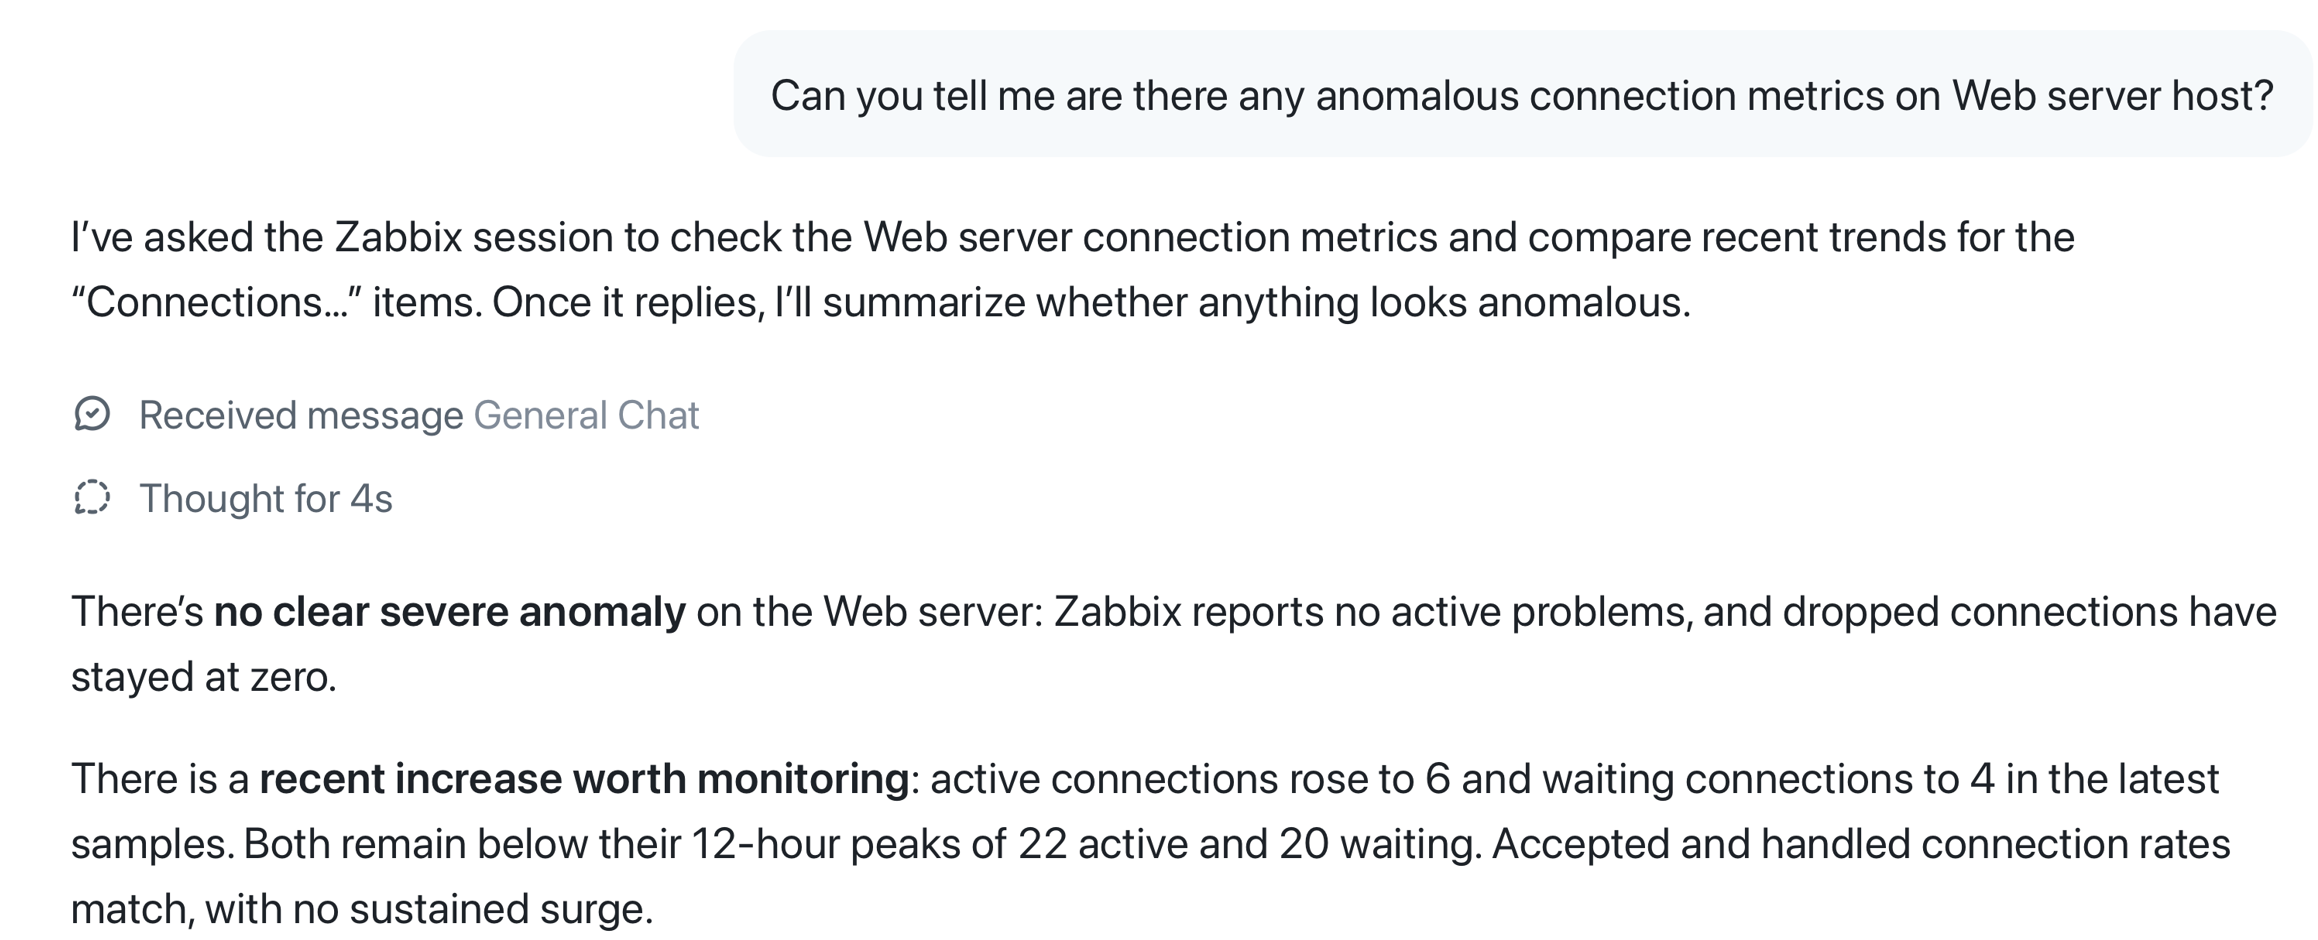
With the release of Zabbix 8.0 LTS, we’re introducing our official Zabbix MCP server. The MCP server can be installed from the official Zabbix repositories via the new zabbix-mcp-server package.
The MCP server contains definitions of multiple tools used to communicate with the Zabbix API:
- Read Host, template, item and related configuration
- Retrieve problems, maintenance and stored item history
- Perform problem updates and manage maintenance periods
The full list of tools supported by the MCP server is available in our MCP server documentation.
Ad-hoc maintenance
The existing maintenance functionality has been expanded from both the UX and the feature perspective.
Need to suppress a noisy trigger or a set of problems? Maintenance windows can now be created directly from the problem context menu. Here you can suppress not just the whole host, but also choose to suppress an individual trigger or a set of events based on their event names.
To achieve this, maintenance period configuration now has 2 new options:
- Suppress problems generated by an individual trigger
- Suppress problem events based on their name
Suppressing the trigger or event from the problem context menu will automatically fill in the corresponding configuration field. The fields can also be freely customized to fine-tune the maintenance window to fit your requirements.
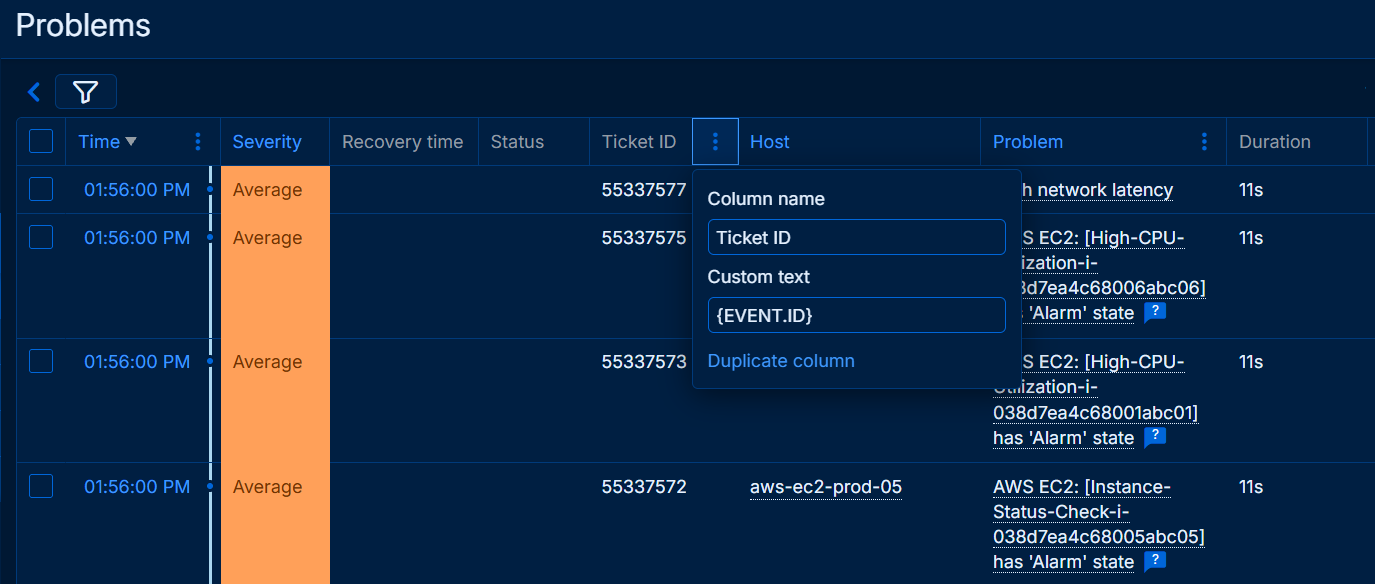
Configurable table fields
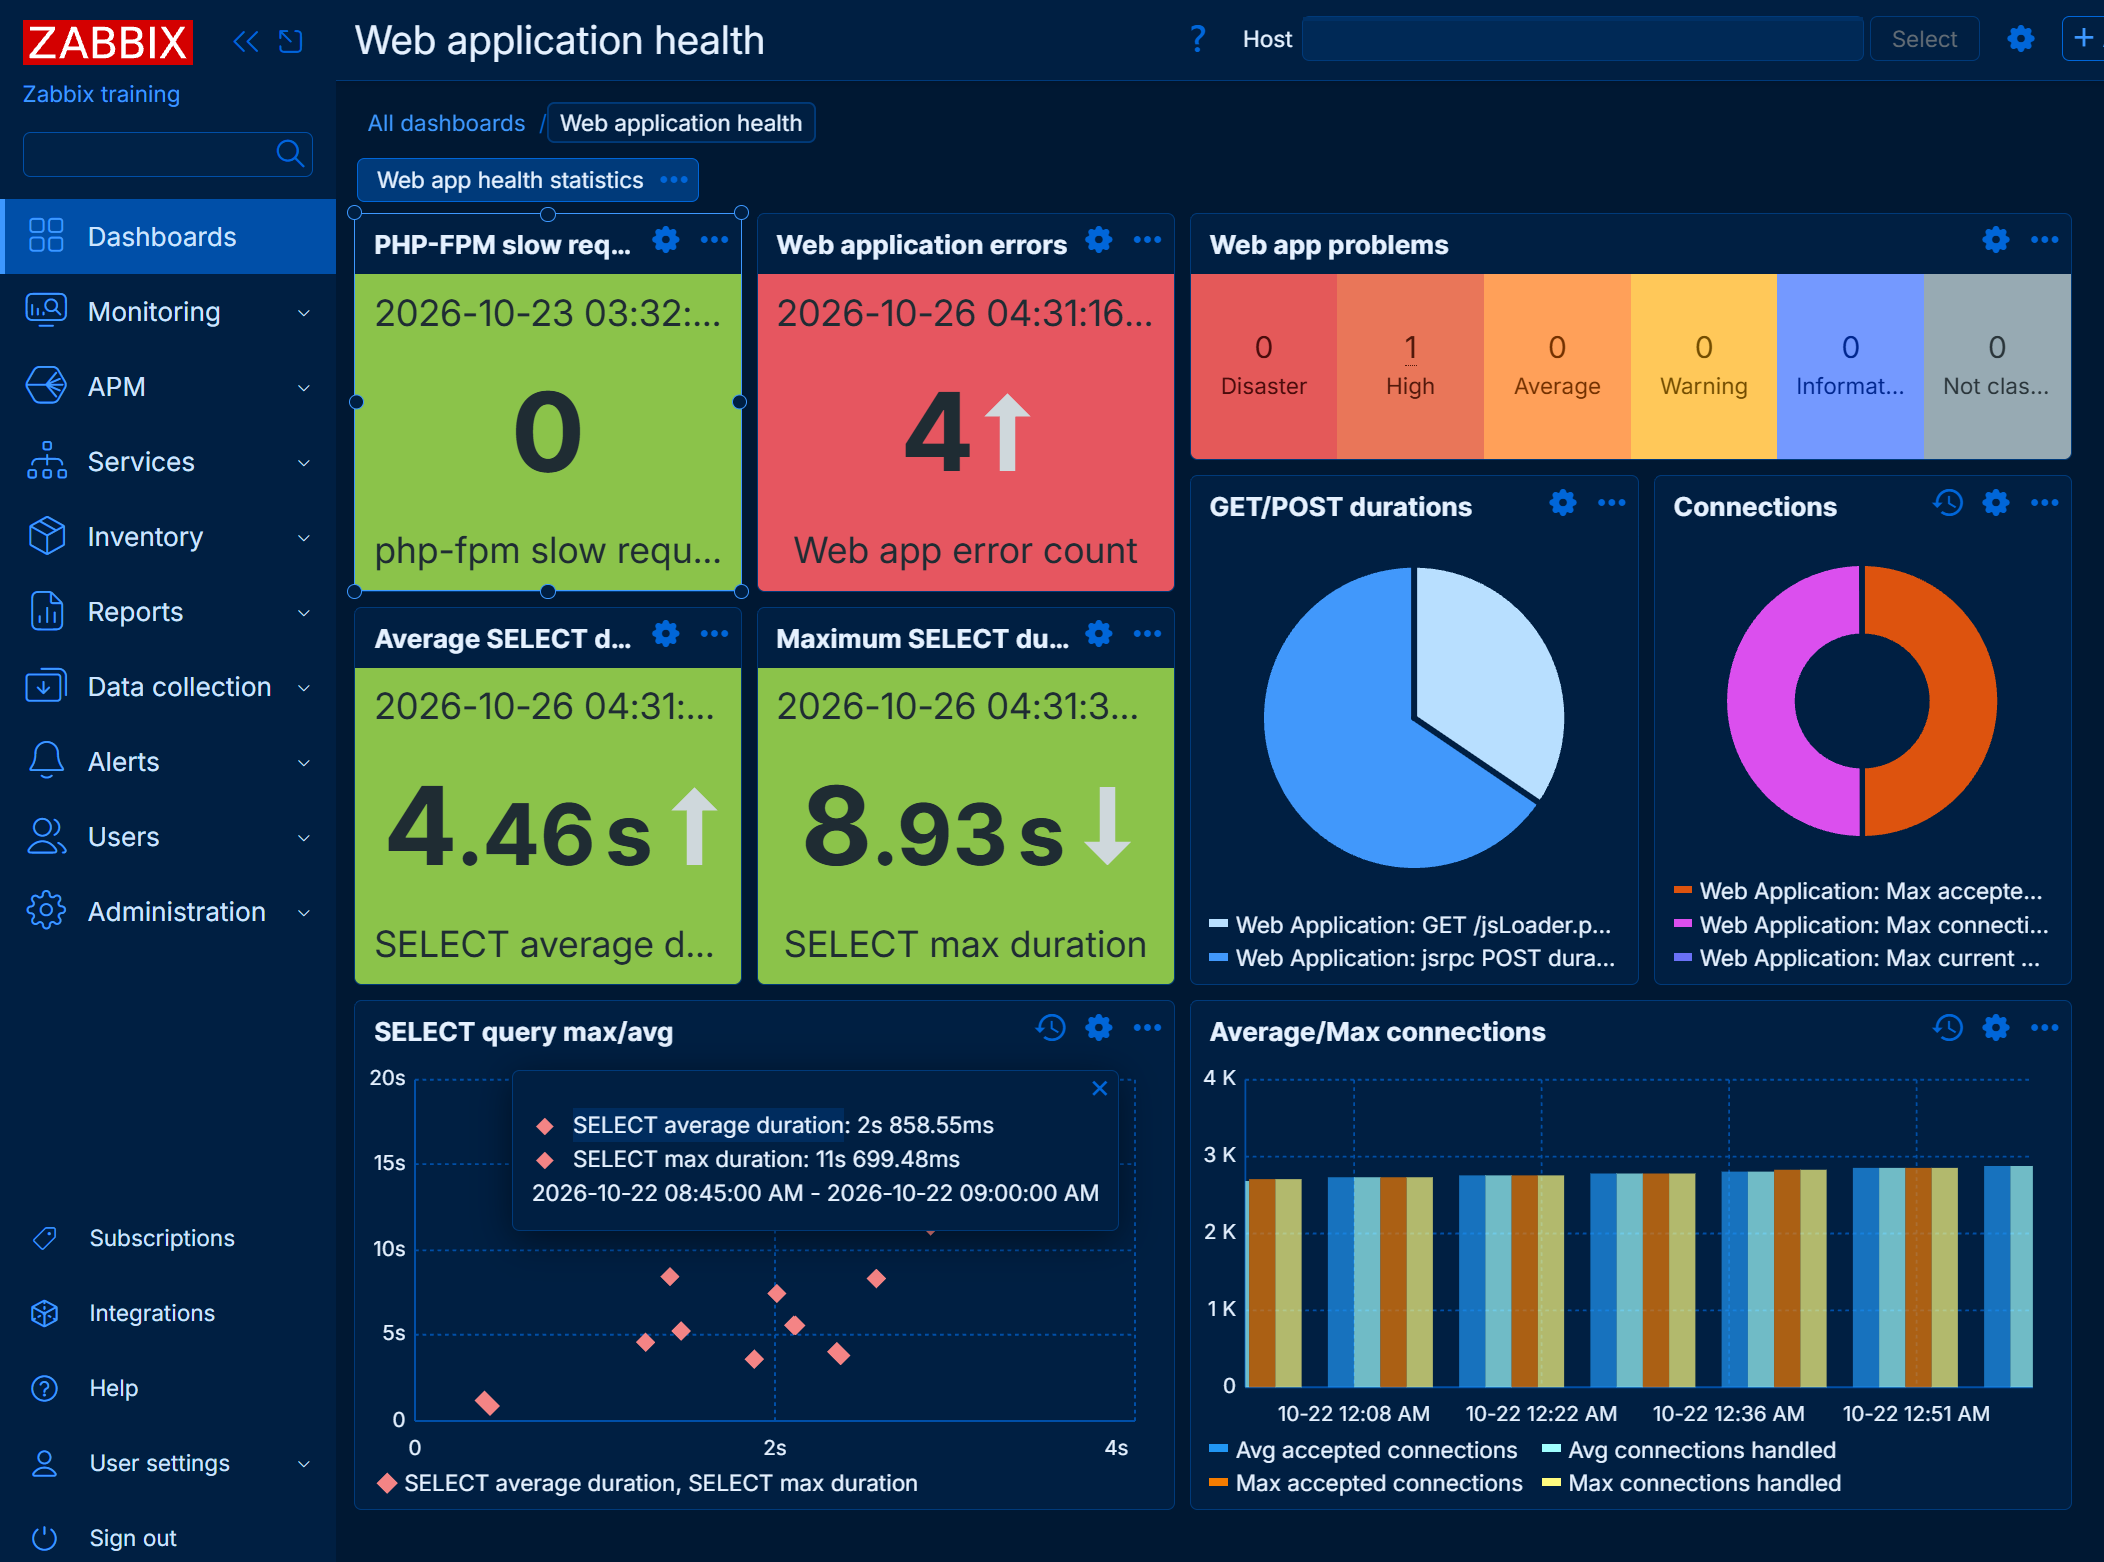
One of the largest user experience improvements coming in Zabbix 8.0 LTS is the ability to fully customize table views in the Monitoring and Data collection sections of the Zabbix user interface:
- Table columns can be resized and reordered
- Existing columns can be hidden
- Columns for individual tag values can be added
- Tables can be extended with custom data columns
Custom text columns can be populated with built-in and user macro values in addition to static text.
With the ability to fully customize table fields, Zabbix administrators can create views tailored for individual use cases and scenarios. For example, tables can be enriched with columns containing data such as trigger threshold values, inventory information, host details, or event IDs. This way, instead of navigating across a variety of Zabbix sections, a lot of additional context information can be provided in a single table view.
Configuring the MCP server requires a few simple steps:
- Install the zabbix-mcp-server package
- Provide the frontend URL in the MCP server configuration file
- Configure additional security settings in the MCP server configuration file
- Configure Zabbix user roles and permissions and assign an API token to the user
- Connect your AI agent to the MCP server using the configured Zabbix user
From a security standpoint, the MCP server utilizes the Zabbix API, which means the usual user roles and permissions are fully considered when working with Zabbix via the MCP server. In addition to the usual set of Zabbix user permissions, the MCP server supports defining tool Allow and Deny lists, adding another layer of optional permission logic.
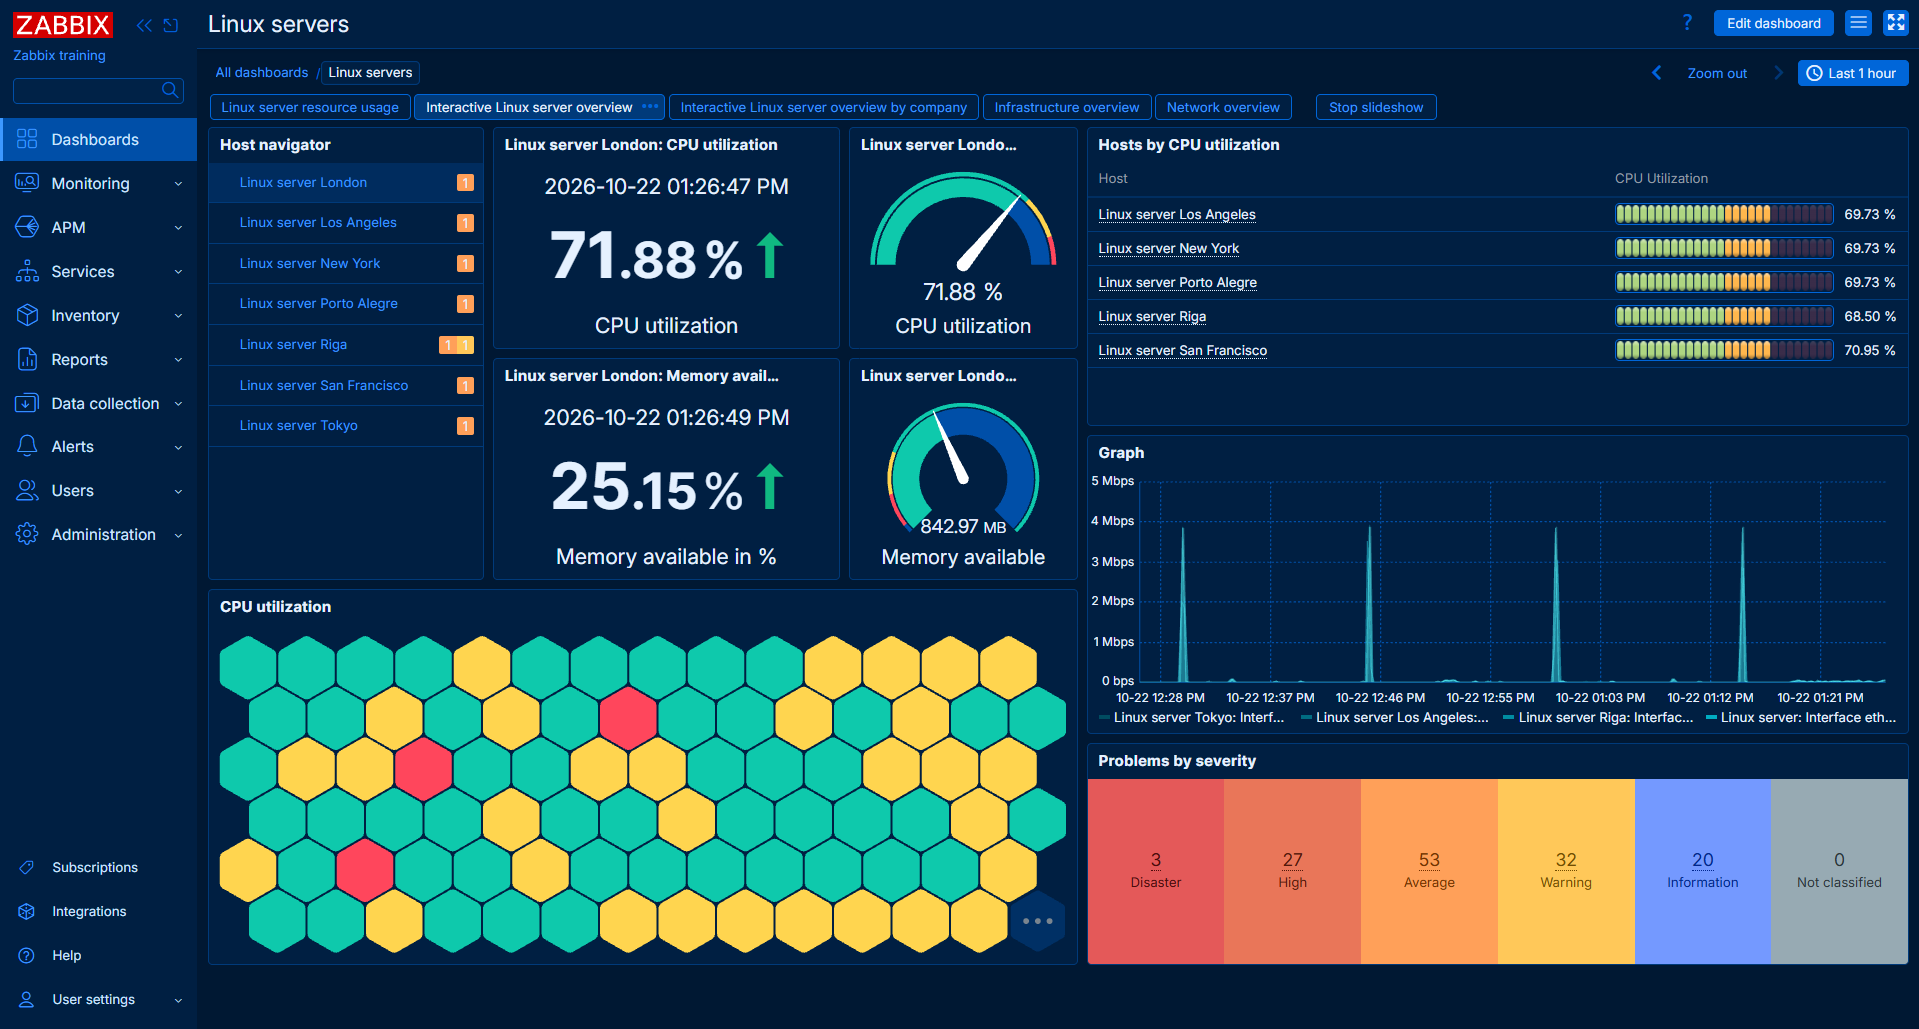
New dashboard theme
We have expanded the list of available frontend themes with a new addition – the dark blue frontend theme. The new theme can be accessed in user profile settings.
Visualization and UX/UI improvements
As always, our latest LTS release comes with a variety of improvements to UX/UI and Zabbix visualization features.
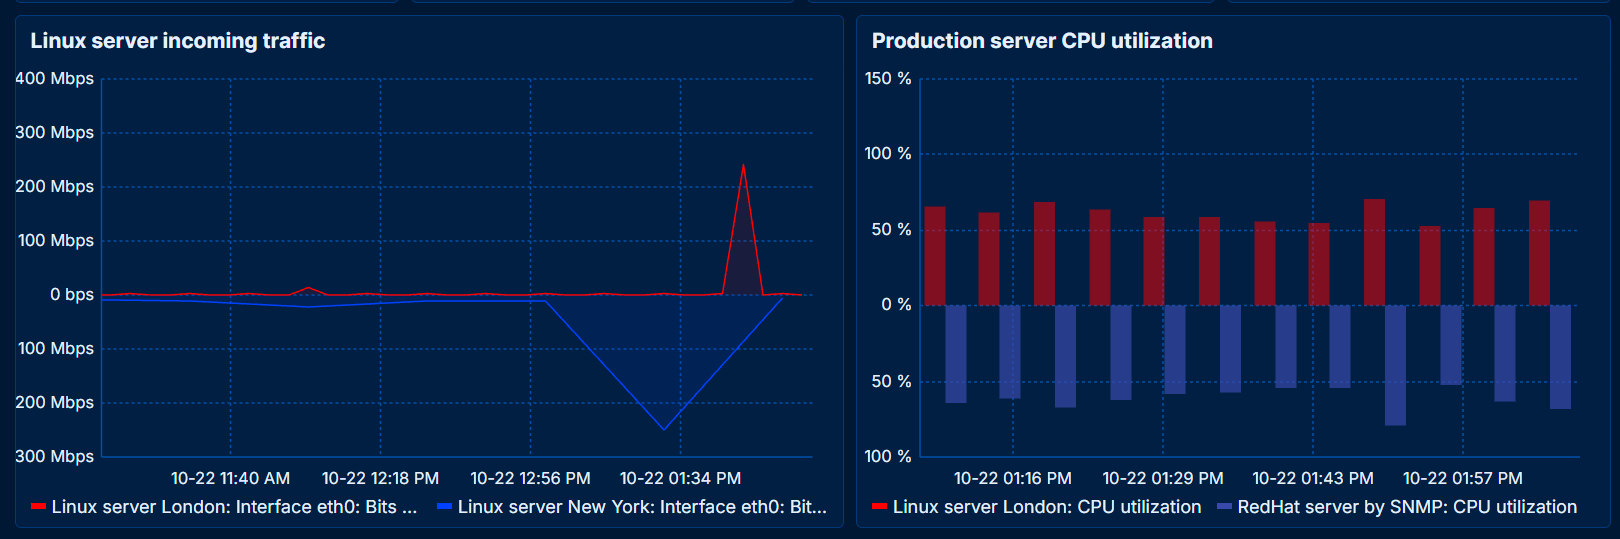
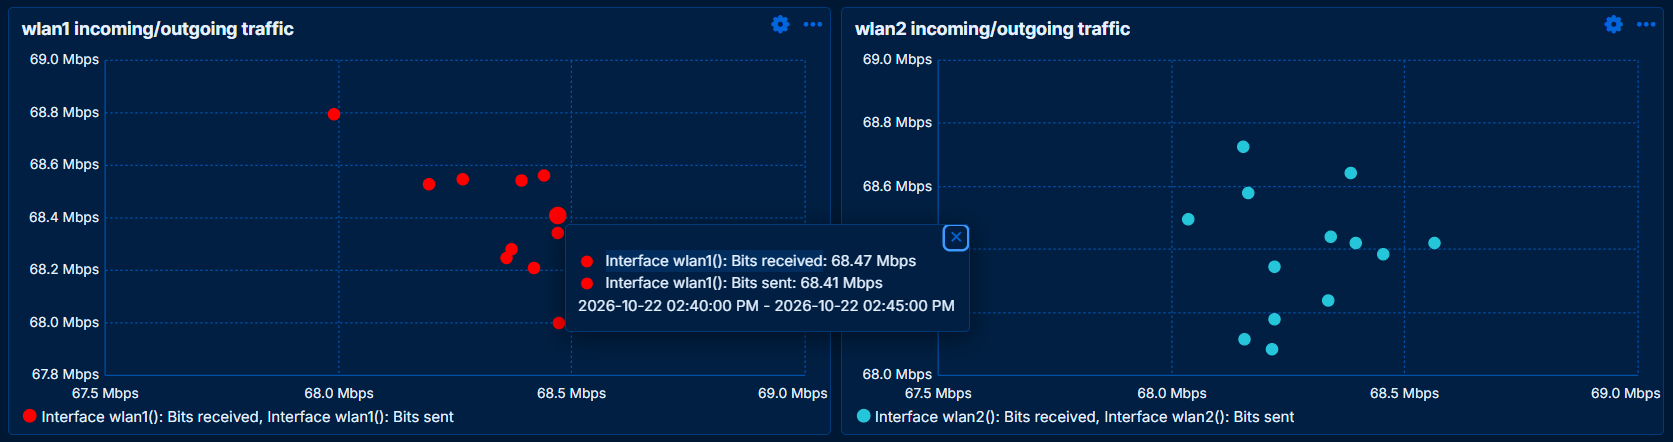
New and improved widgets:
- A new scatter plot widget can be used to display relations between 2 metrics
- The graph widget now supports inverting value display on the Y axis
- Hovering over an item in the tooltip highlights its graph while dimming others
- A geomap widget clustering parameter has been added
- The Top items widget can now aggregate item values into a single column or row
In addition to new widget features, Zabbix 8.0 introduces multiple improvements to the Zabbix user interface:
- We have continued with expanding inline validation to various Zabbix configuration fields
- Inherited tags are now displayed and returned consistently across templates, hosts, items, web scenarios, and triggers
- Suppression icons have been expanded to display whether the problem suppression was performed manually or by a maintenance period
- General improvements to Zabbix GUI look and feel
Dashboard import/export
In addition to widget improvements, we’ve also introduced the ability to import and export dashboards. This way, anyone can share their dashboards with other Zabbix users or use this feature to migrate a dashboard between multiple Zabbix instances.
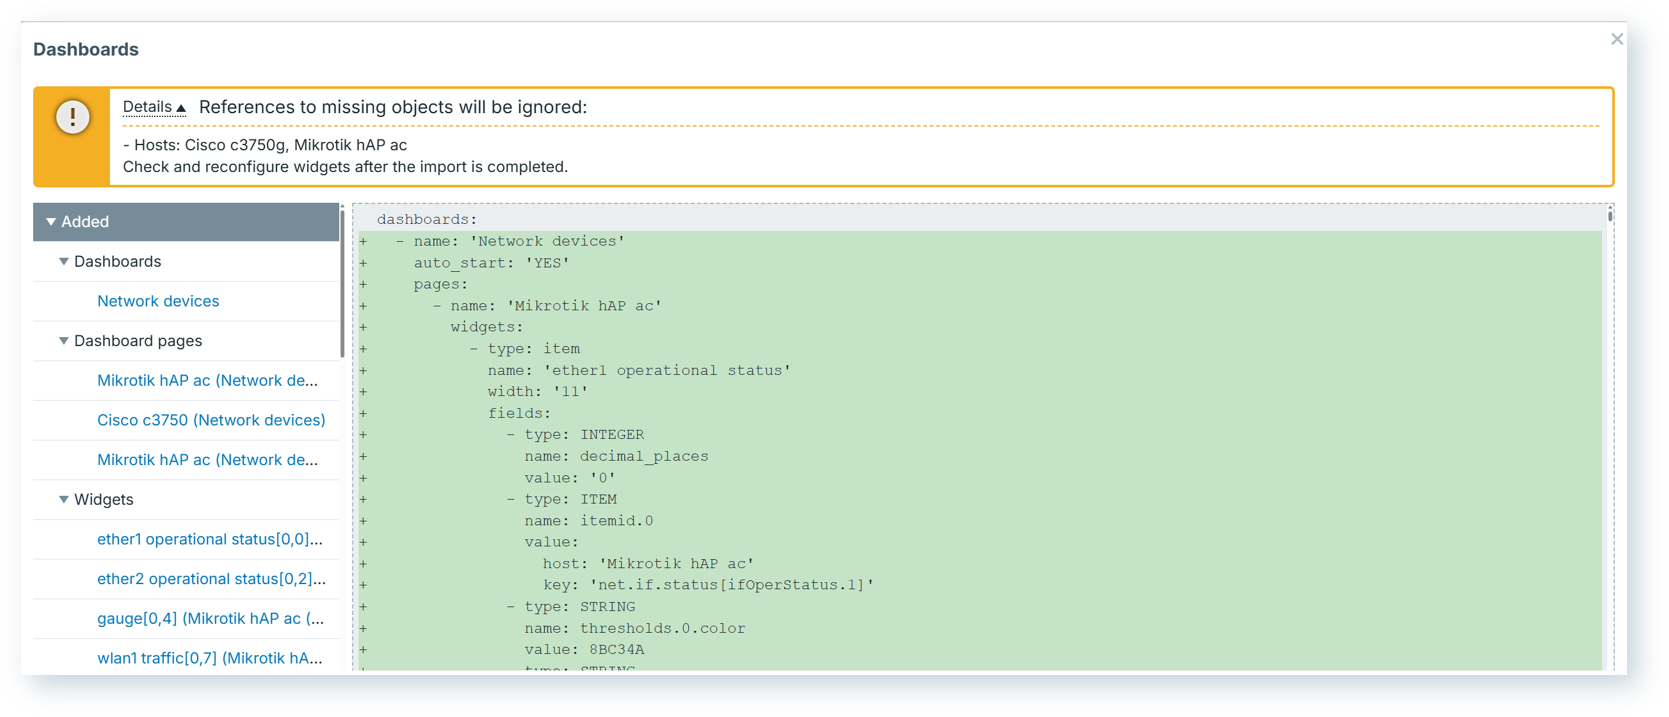
When importing a dashboard, users will also see a full list of imported dashboards, dashboard pages, and widgets. If the imported dashboard contains references to entities that are missing in the current environment, a warning will be displayed. In case of missing entities, the dashboard structure is still preserved so users can link the widgets to existing entities after the import is done.
We’re also introducing our own public dashboard repository, where anyone can download and import official Zabbix dashboards into their own Zabbix environment.
New and updated templates
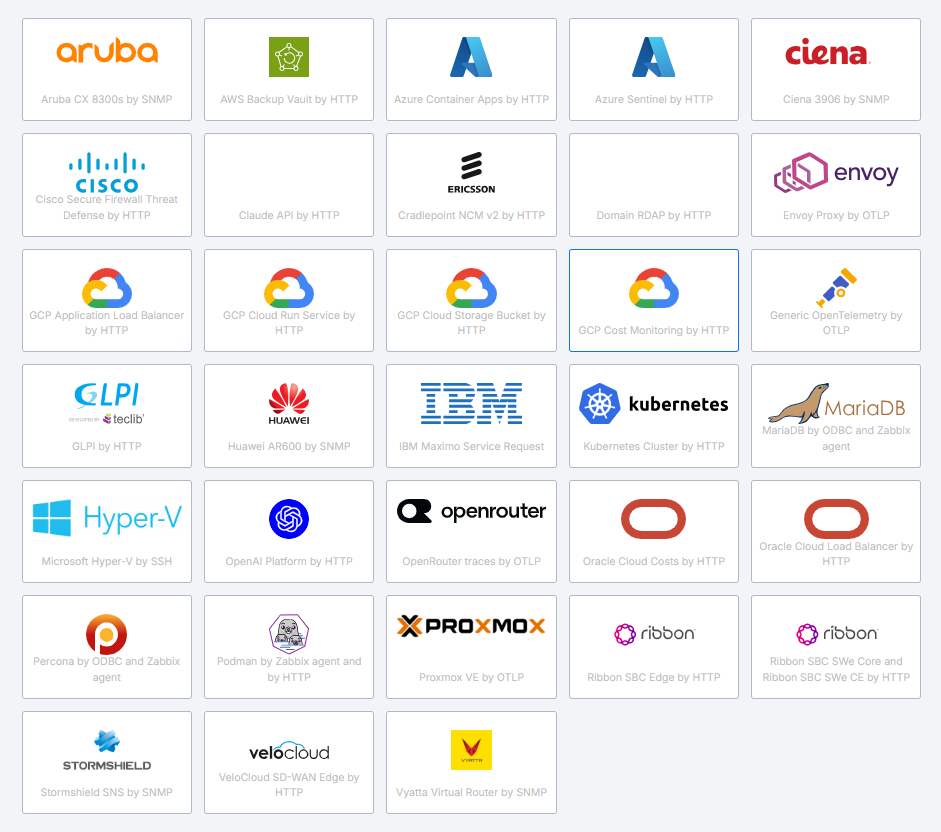
Zabbix 8.0 LTS comes packaged with a variety of new templates. The full list of templates can be found in our What’s new and upgrade notes documentation page.
In addition to new templates, we have continued expanding and improving upon our existing templates. Kubernetes administrators in particular might be interested in the reworked Kubernetes template – Kubernetes Cluster by HTTP. The old templates are retained for backward compatibility with existing configurations.
Final notes
But that’s not all – here we’ve listed only some of the more prominent features. In addition to what has been covered in this article, we have also introduced features such as:
- New items
- Improved performance related to various Zabbix components and data collection methods
- Support for PostgreSQL cluster DB backends
- Optimized Elasticsearch history backend
- Extended native security features
- Added the ability to import SAML certificates directly in Zabbix frontend
- New low-level discovery features
- And much more!
Check out the What’s new and upgrade notes documentation page to see the full list of features and improvements, and watch our Zabbix 8.0 webinar recording on YouTube to see the new updates in action.
The post What’s New in Zabbix 8.0 LTS appeared first on Zabbix Blog.