All posts by Arturs Lontons

What’s new in Zabbix 7.4

Post Syndicated from Arturs Lontons original https://blog.zabbix.com/whats-new-in-zabbix-7-4/30597/

With the release of Zabbix 7.4, Zabbix users will be able to further extend their existing resource discovery workflows and enjoy a wastly improved user experience when it comes to configuring Zabbix entities. In addition, the latest release introduces multiple dashboard and network map improvements which will further enhance the visualization of infrastructure and resources.

Host Wizard

Host creation can be somewhat confusing for Zabbix beginners. Creating a host and applying a template involves numerous steps – from creating a host and assigning it to a host group, to configuring appropriate host interfaces, applying a template, and editing template-level macros to adjust the default problem thresholds and filters.

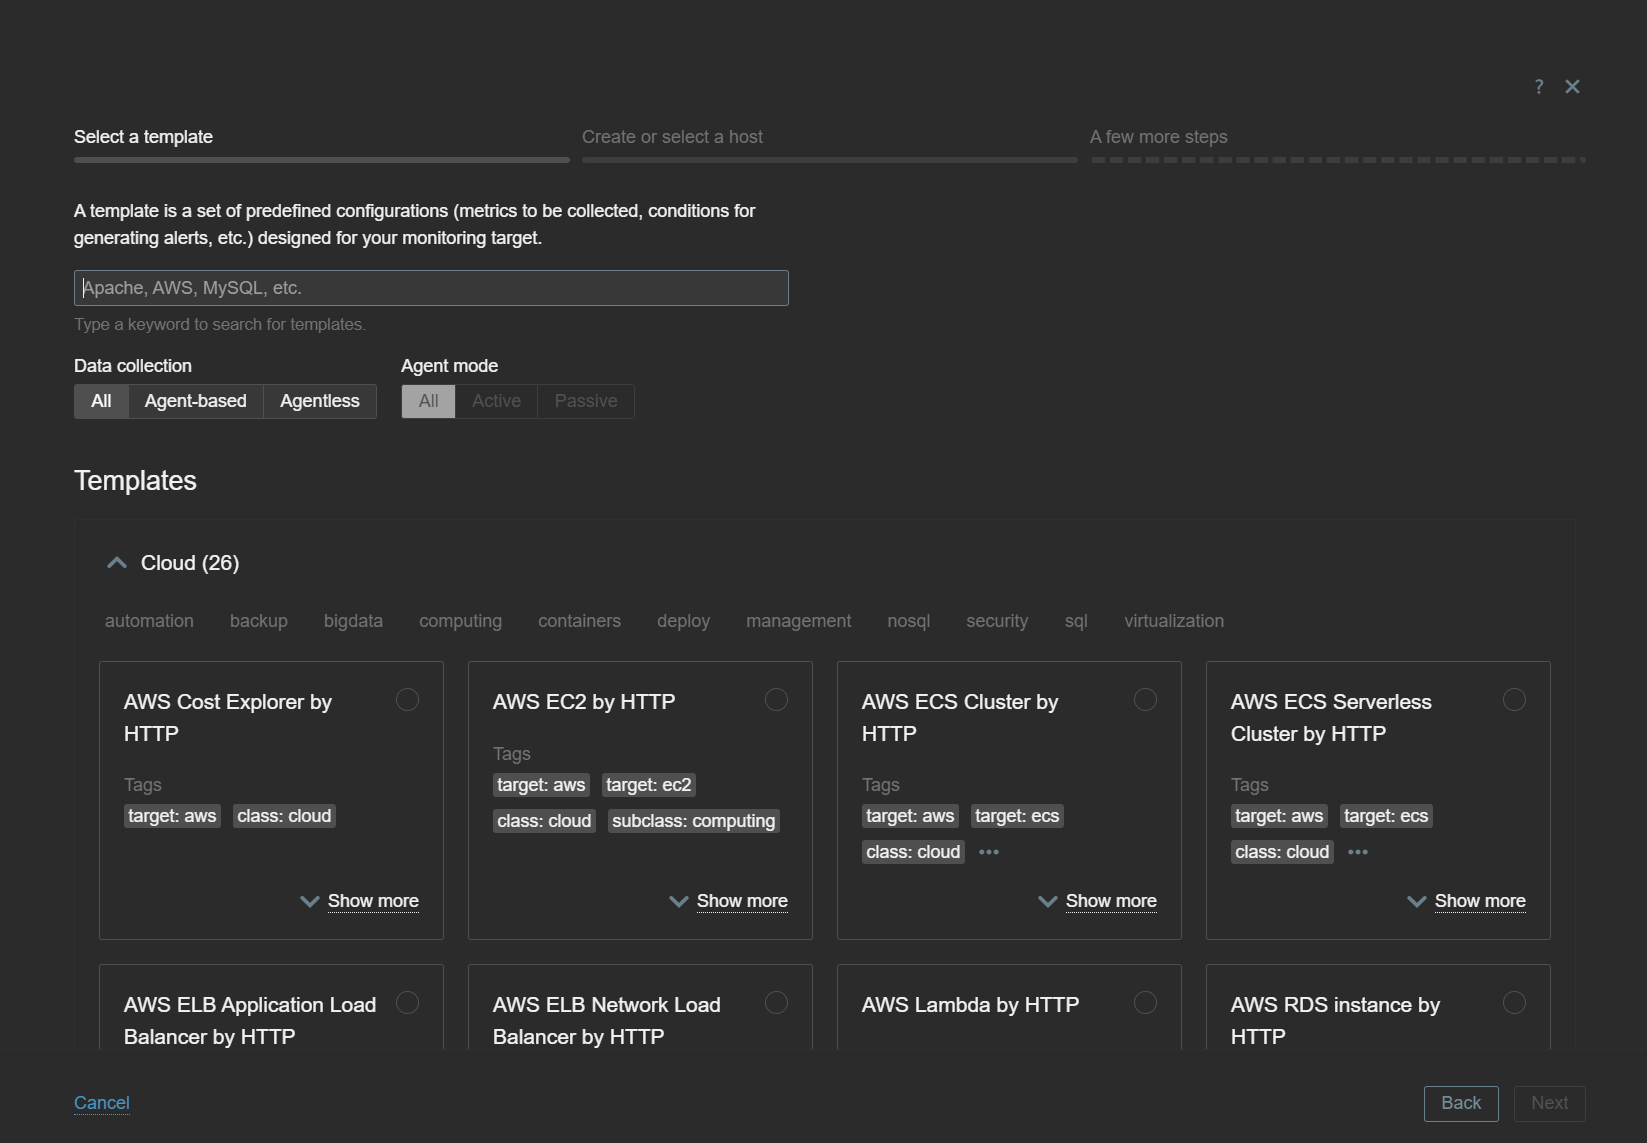
The Host Wizard aims to simplify the host onboarding process by providing a step-by-step guide for creating and configuring a host.

The Host Wizard can be opened from the Data Collection – Hosts section

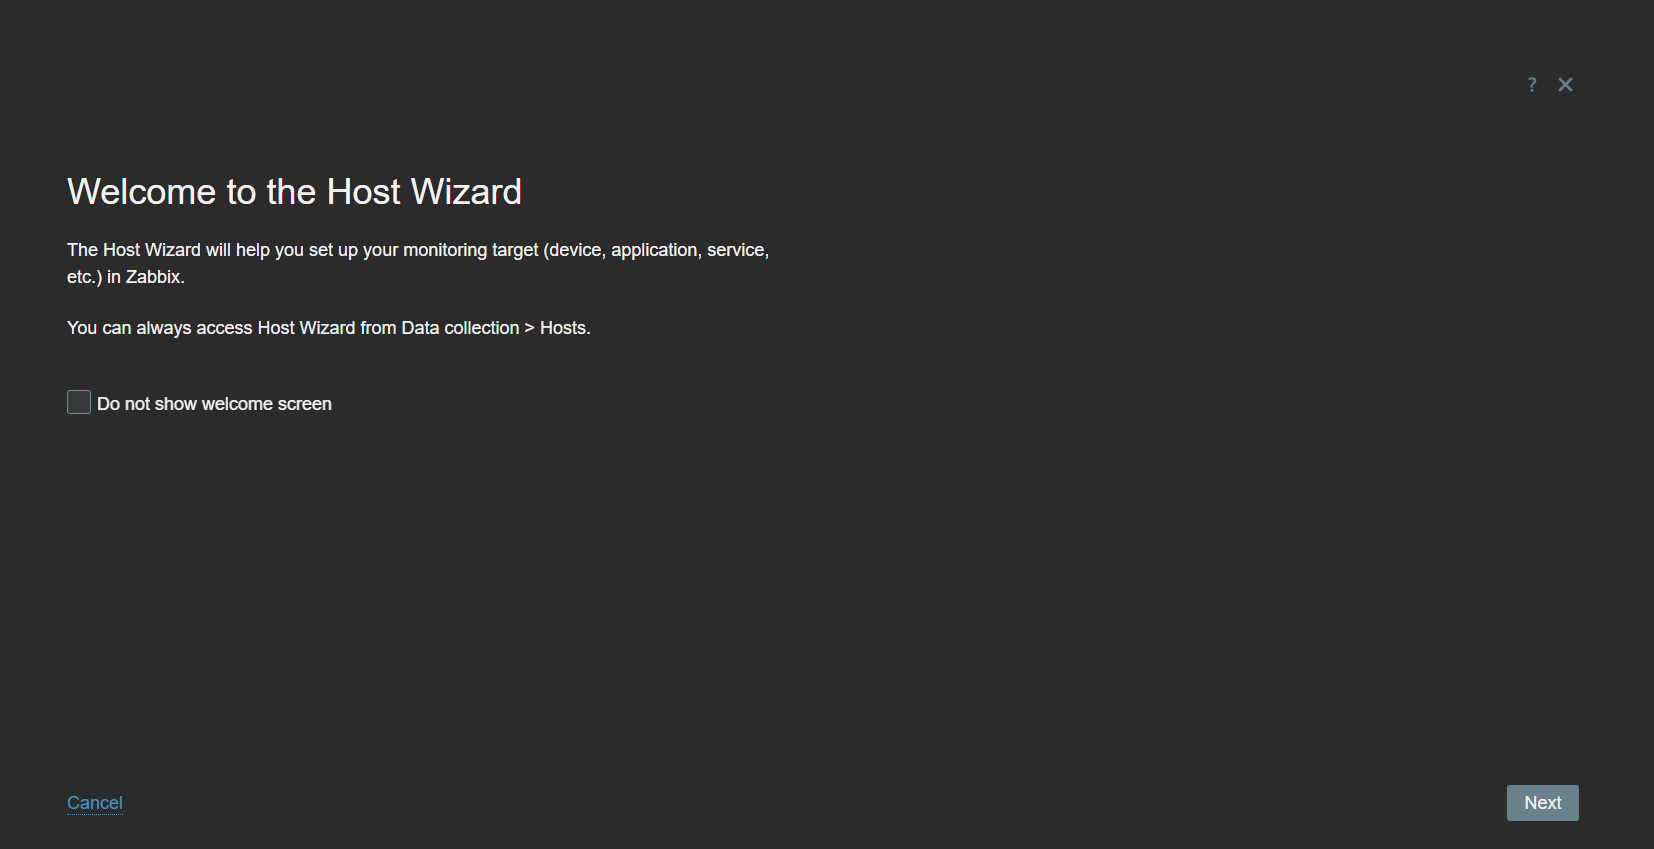
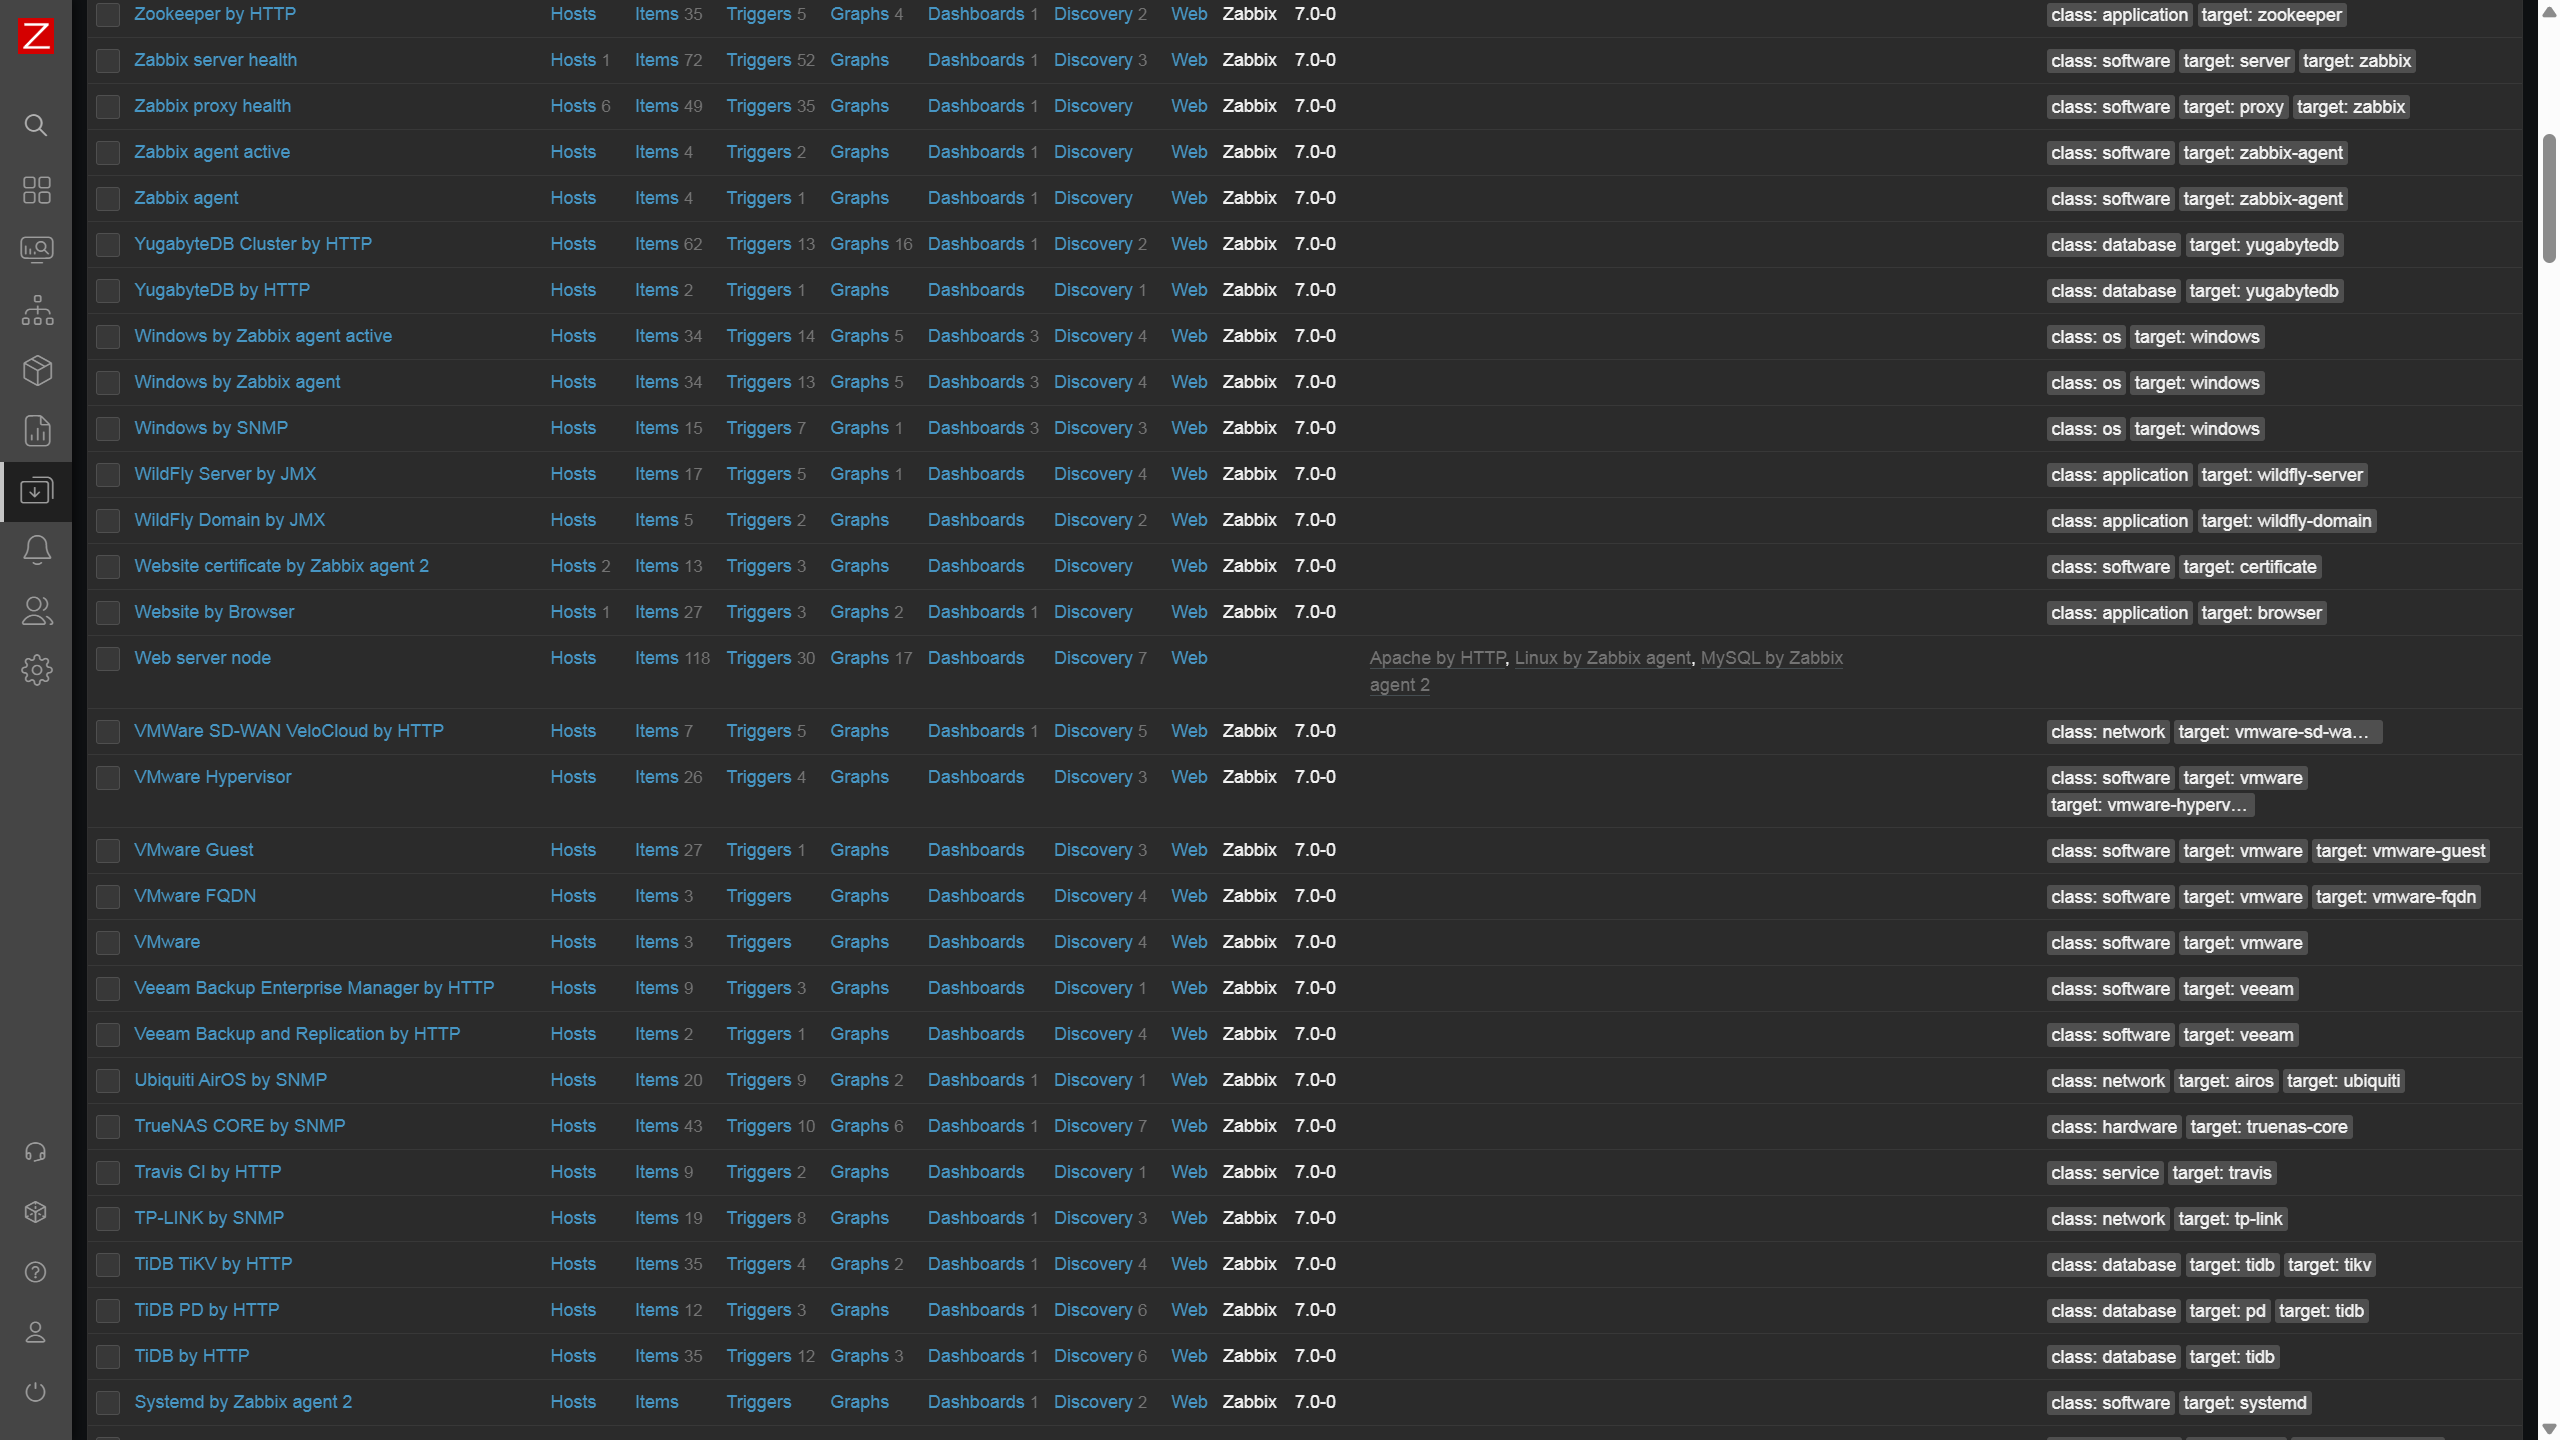
A new Host Wizard button has been added to the Data Collection – Hosts section. Once you click on it, you will first have to select the template you wish to apply on the new host. Only one template can be applied at a time, so if you wish to apply multiple templates on a single host via Host Wizard, you will have to do so via one template and one Host Wizard session at a time.

Under the hood, if we look at the template files, the templates have also received 2 new parameters: wizard_ready and readme. Only templates marked with wizard_ready: ‘YES’ can be selected in the Host Wizard.

Filter for and select the required template

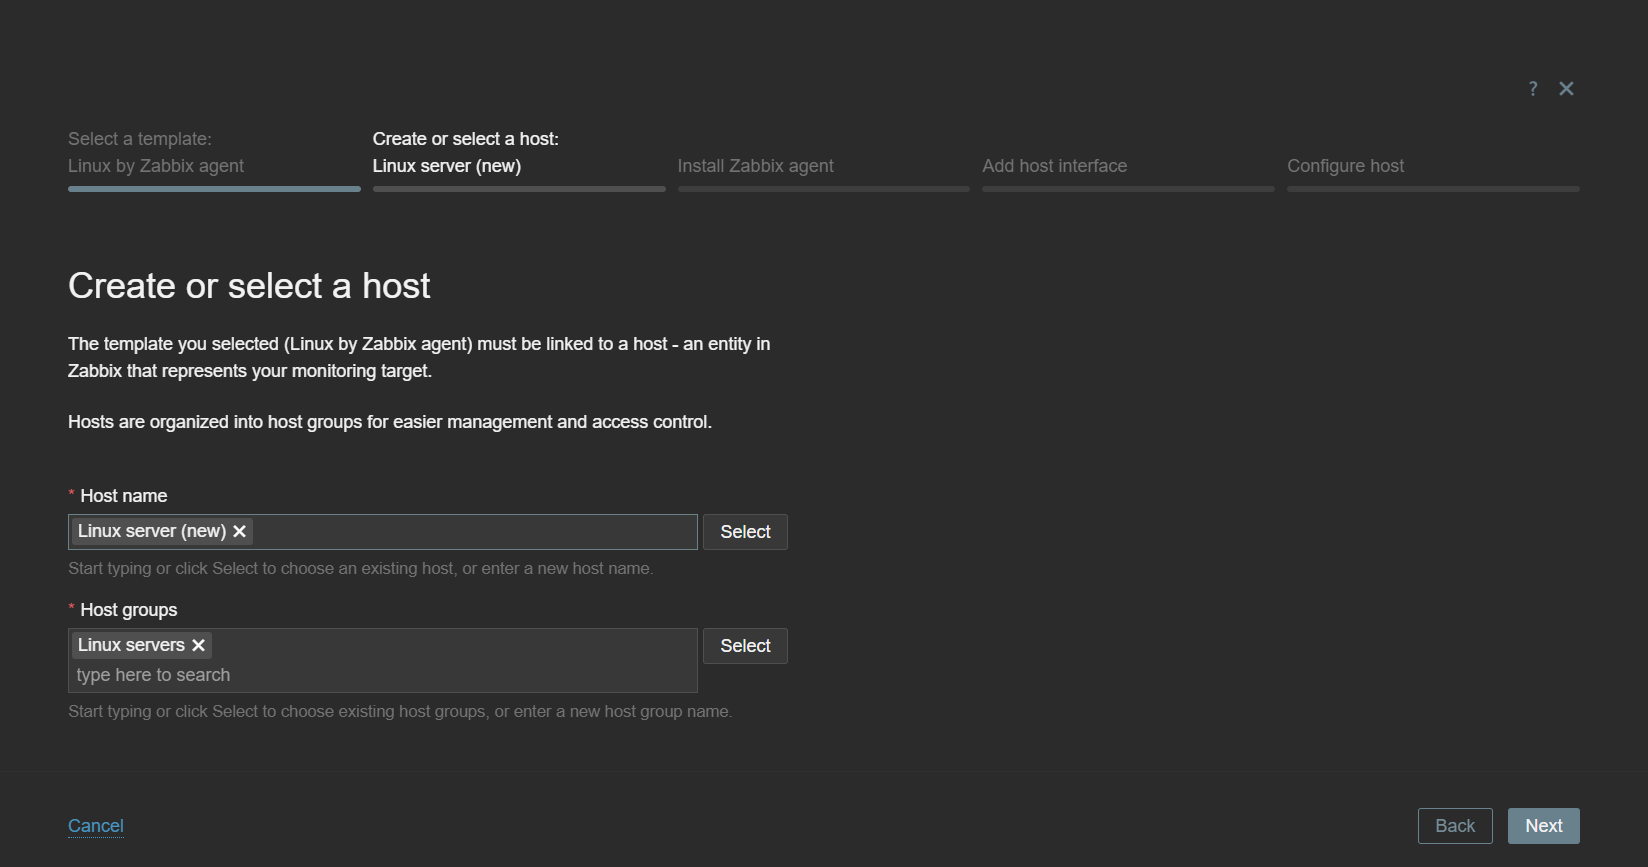
After you have selected the template, you will be prompted to enter a host name and select host groups. You can create a new host or apply the template on an existing host.

Provide a host name and select host groups

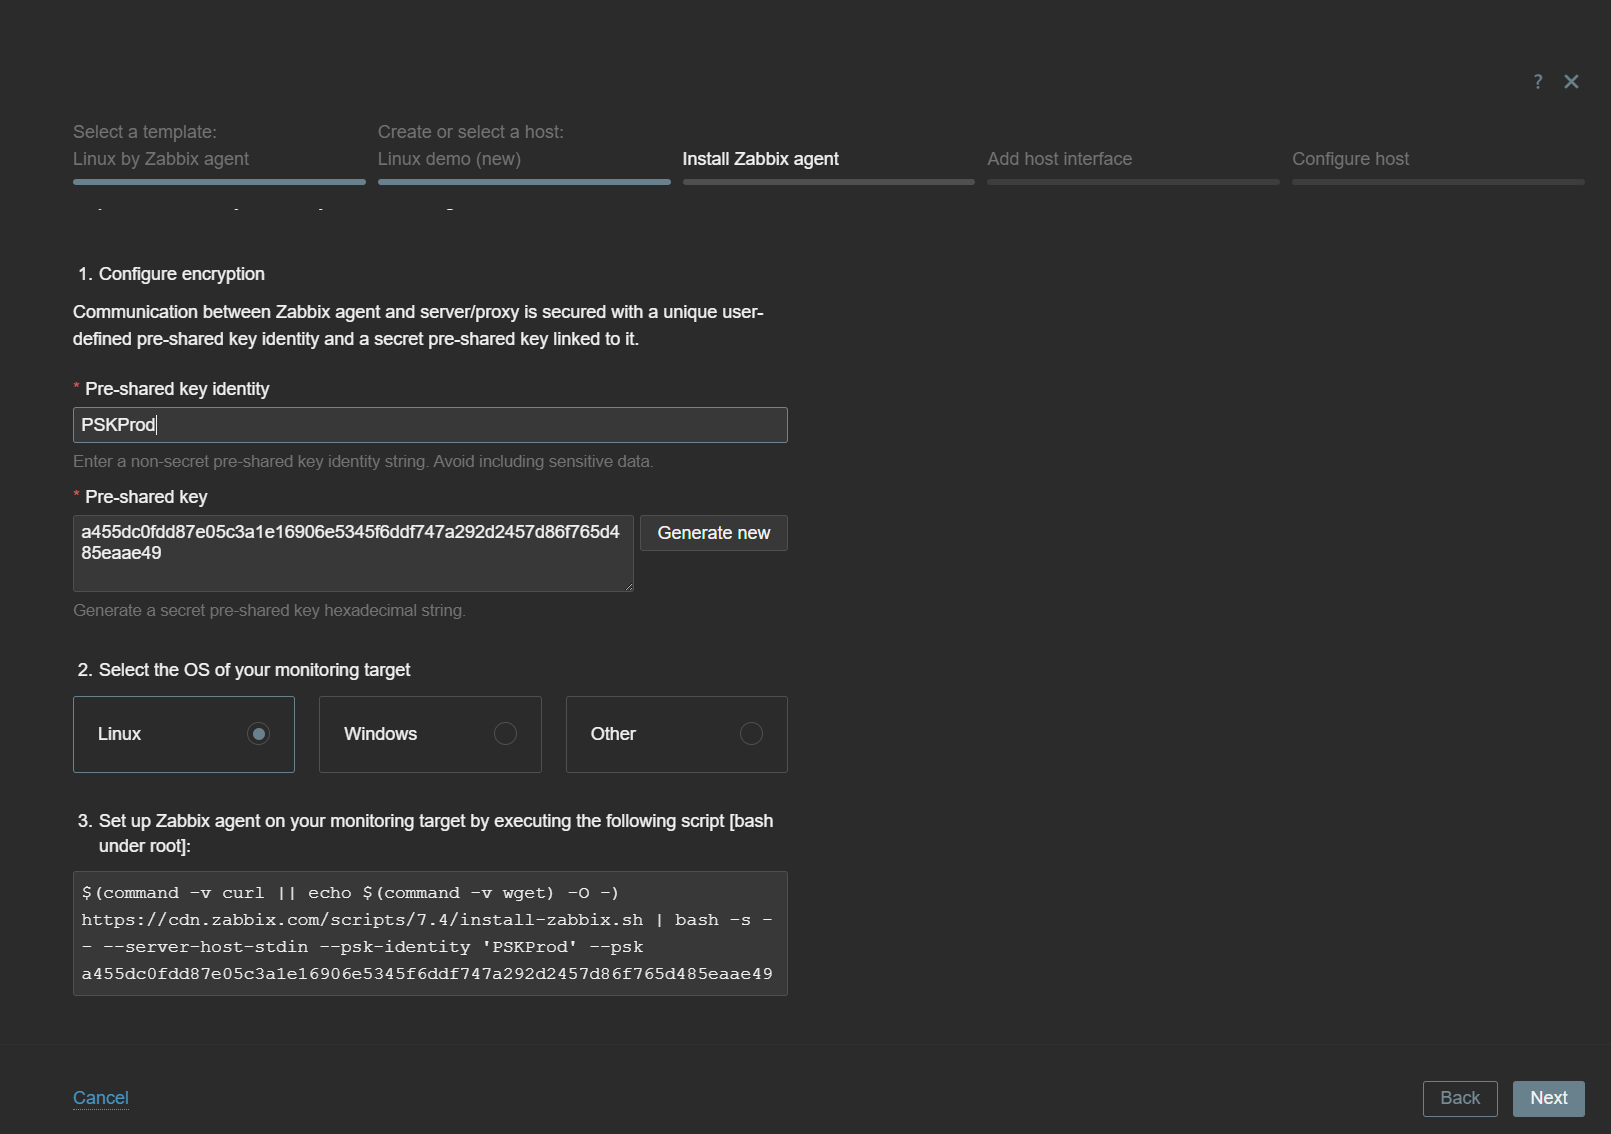
The next steps include the deployment instructions. Depending on the selected template type, the Host Wizard will provide all of the required instructions to start monitoring the host with the chosen template.

The Host Wizard will provide the required host configuration steps

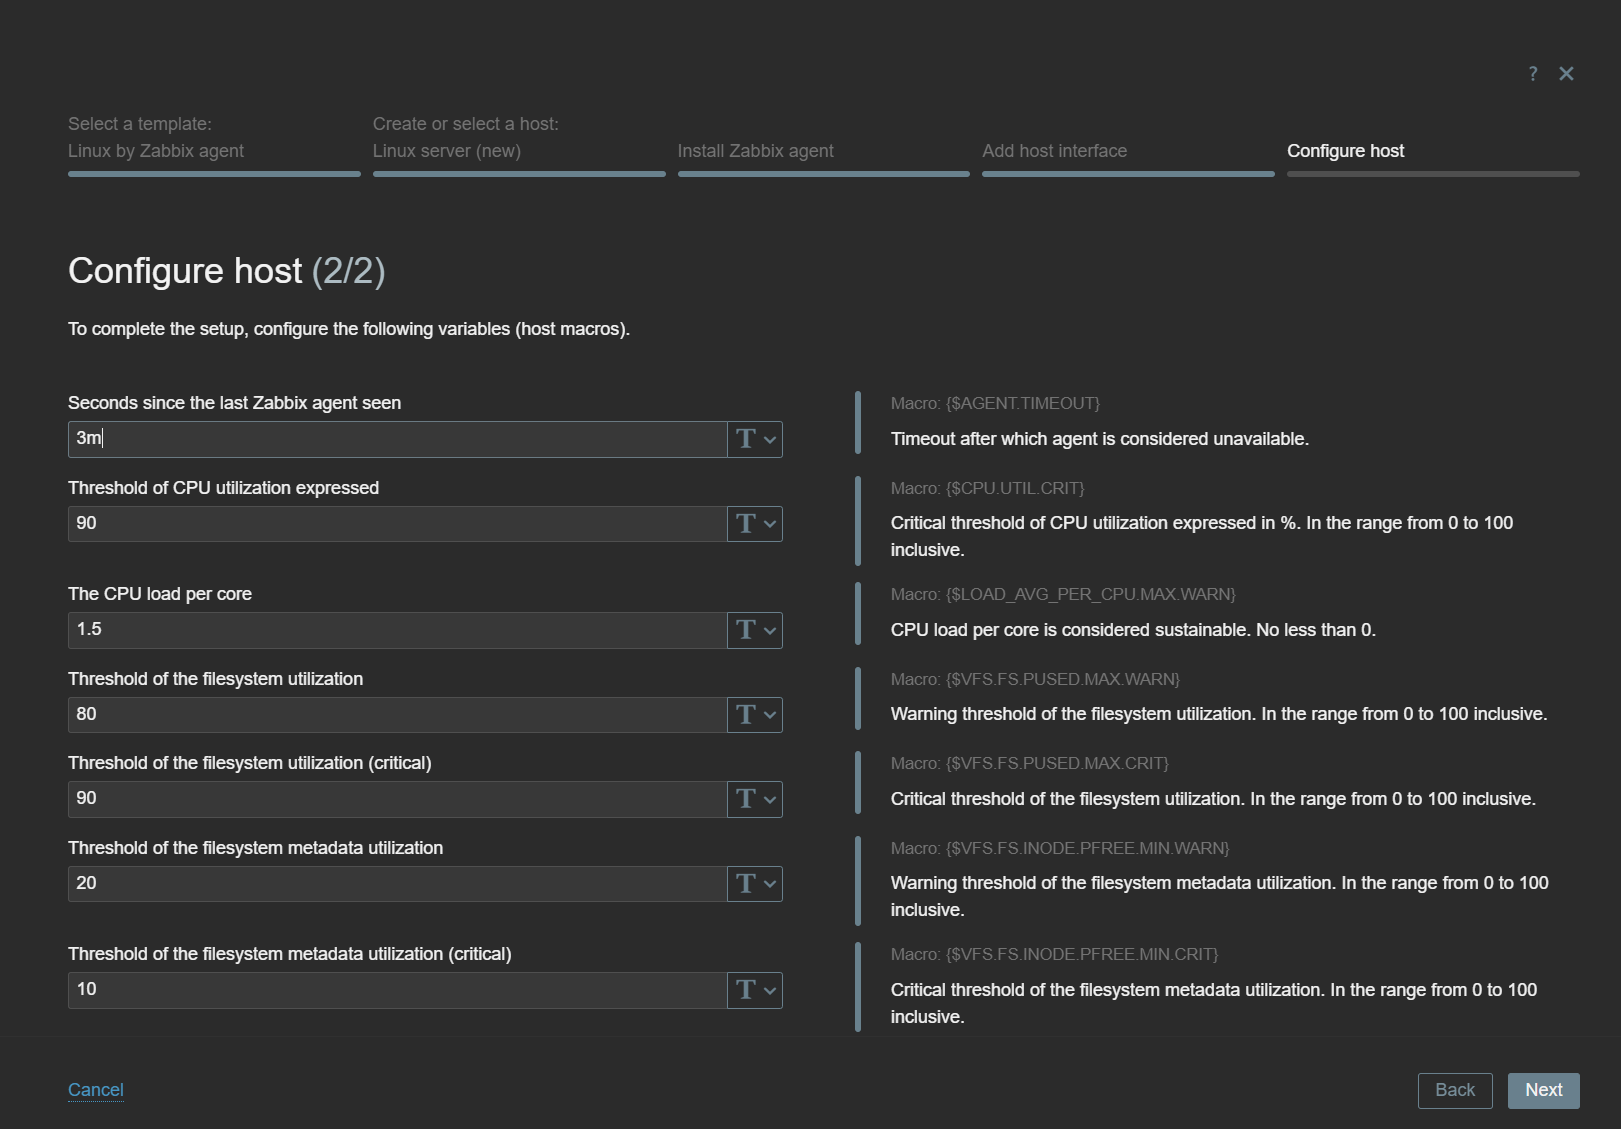
In the final Host Wizard steps, you will be prompted to add the required host interface, read the template notes, and customize the template-level macros.

Customize template-level macros to modify the default filters, problem thresholds, and other parameters

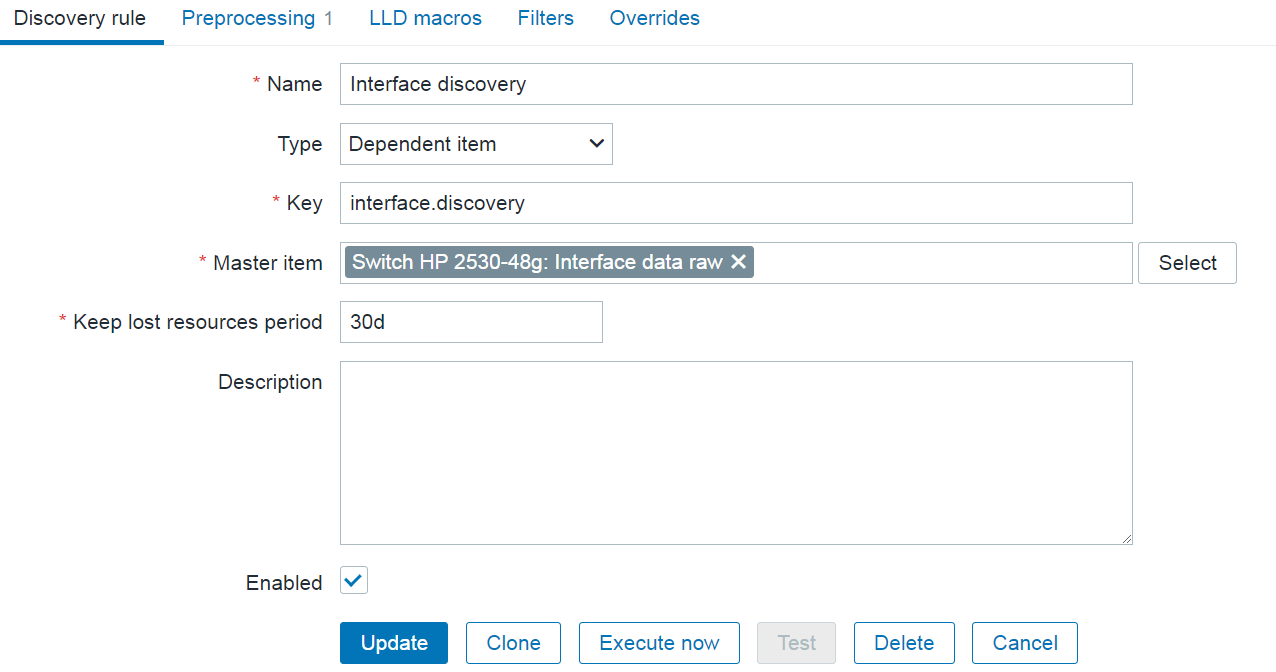
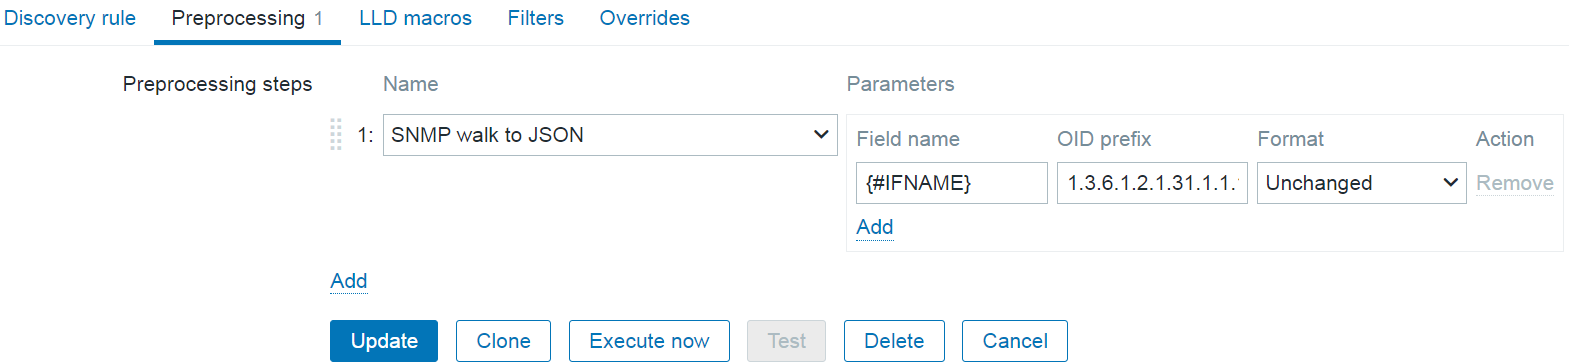
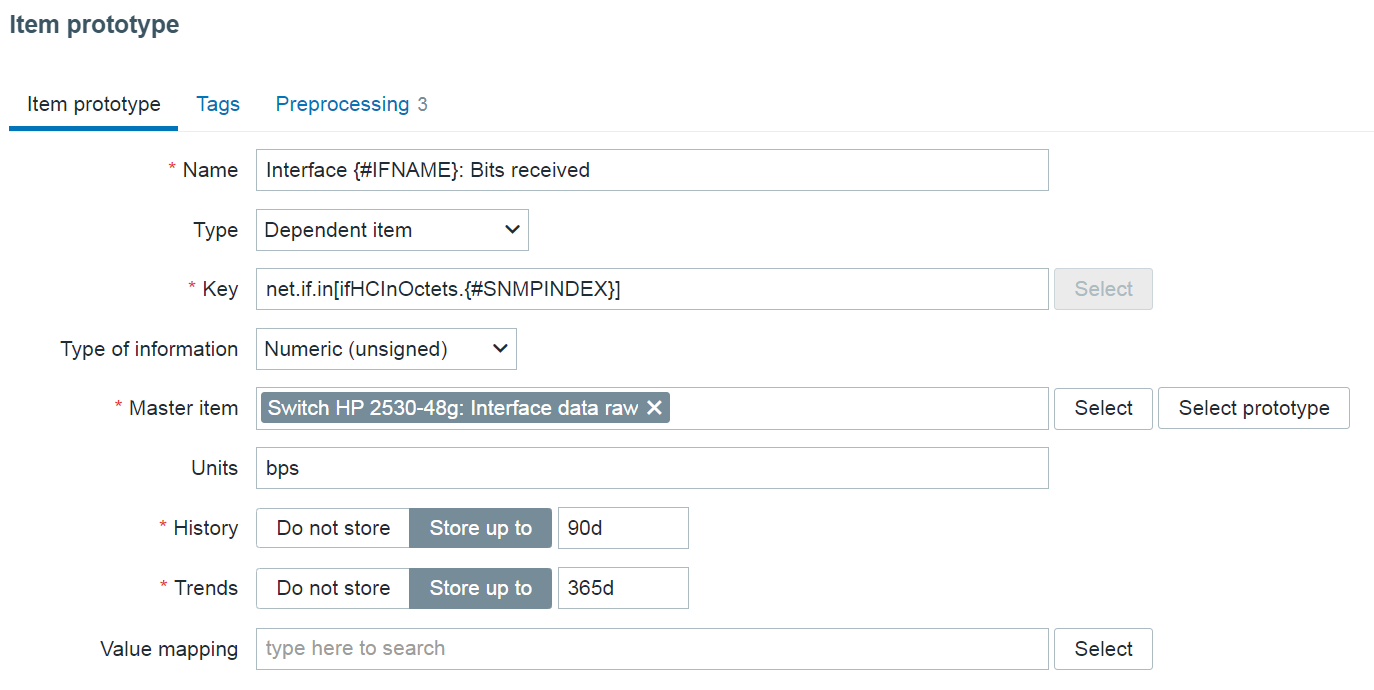
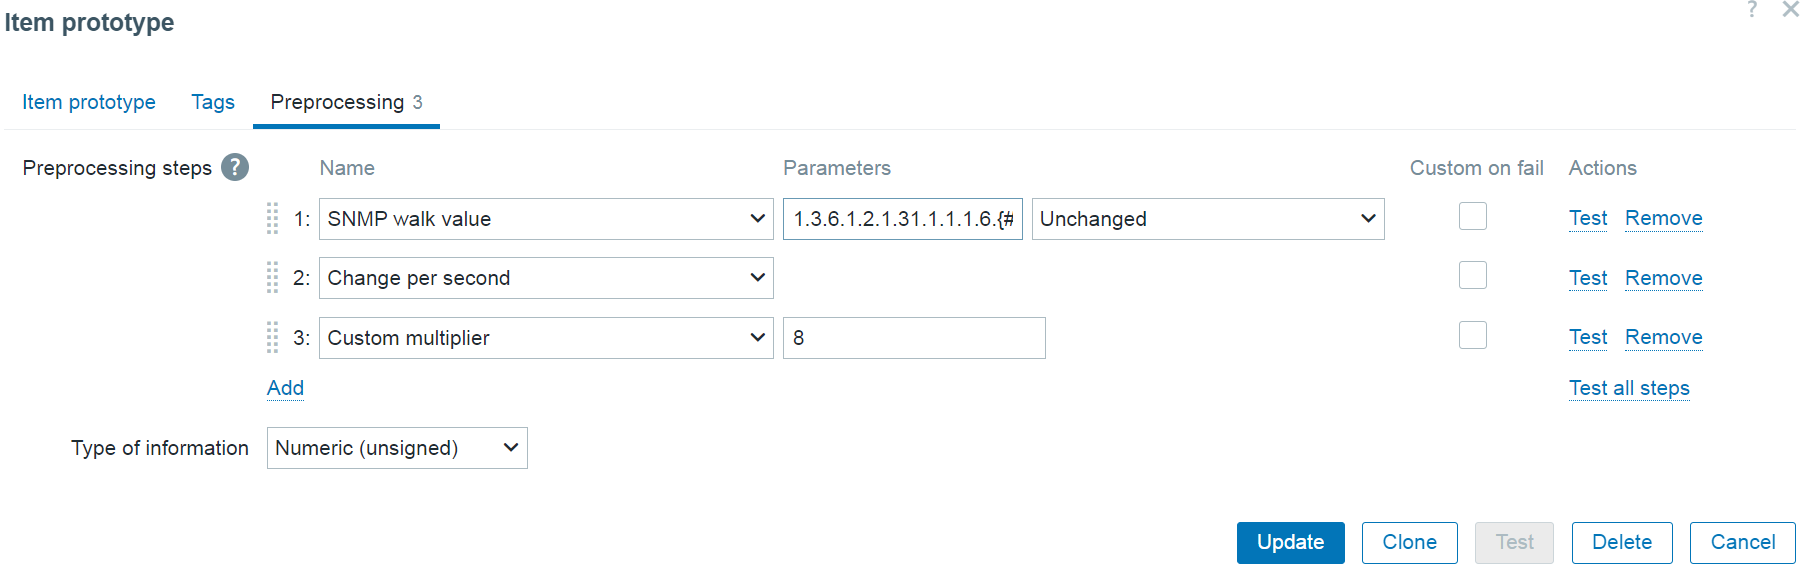
Nested low-level discovery rules and host prototypes

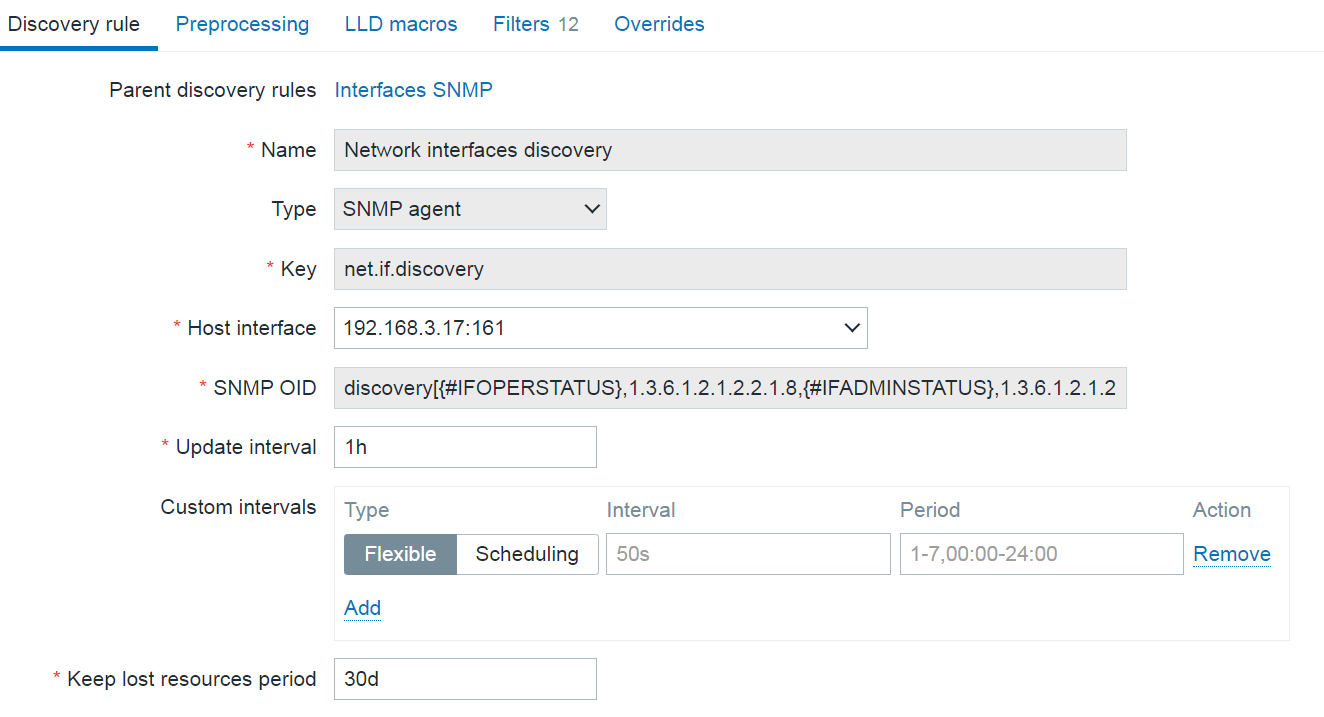
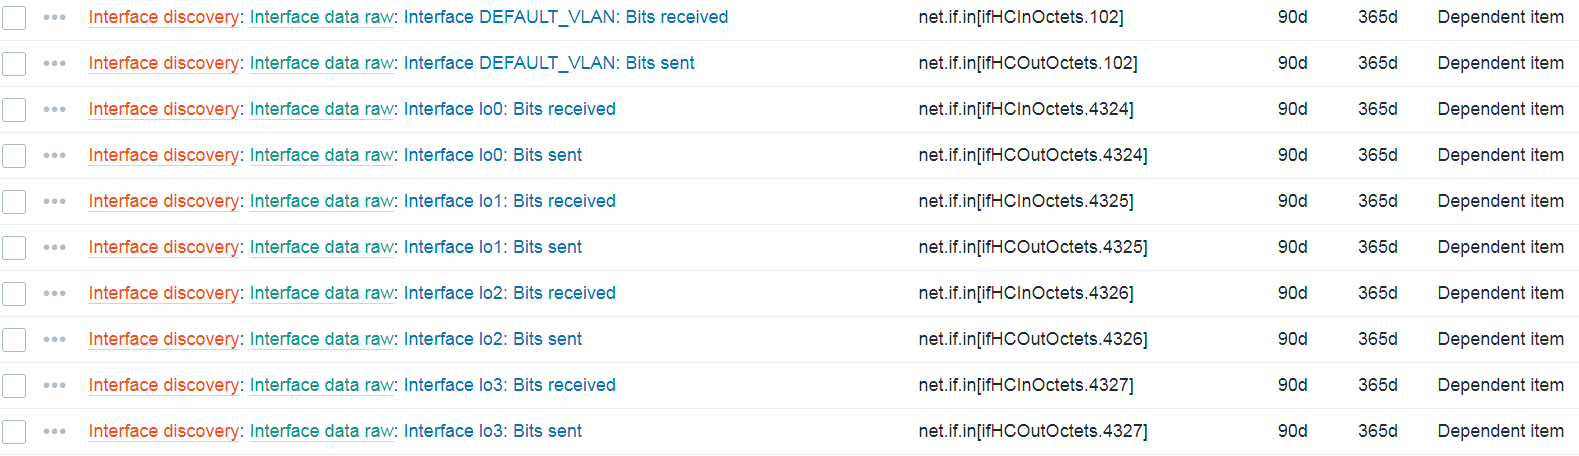
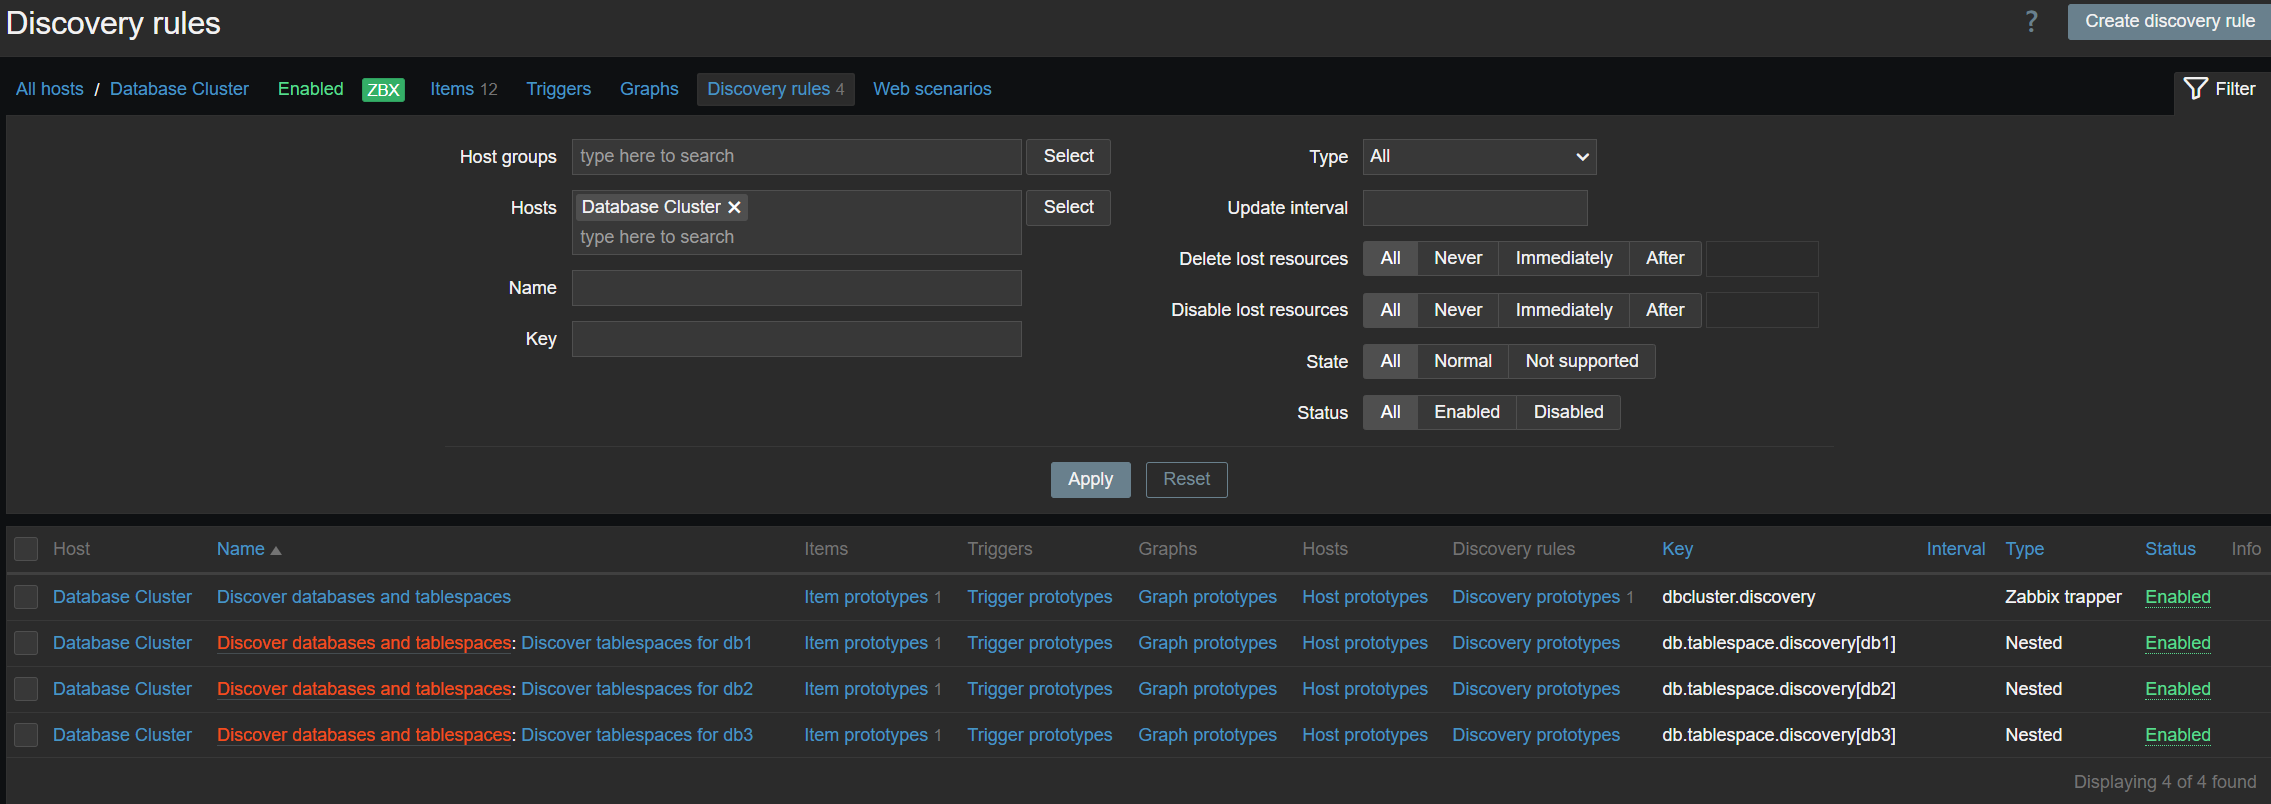
Low-level discovery rules have received major improvements in Zabbix 7.4. It is now possible to create nested low-level discovery rules, while host prototypes are now capable of discovering hosts of their own with low-level discovery.

A new type of prototype has been added to low-level discovery rules – discovery prototype. These prototypes are used together with low-level discovery macros to automatically create low-level discovery rules for resource discovery.

Discovery prototypes can now be created in low-level discovery rules

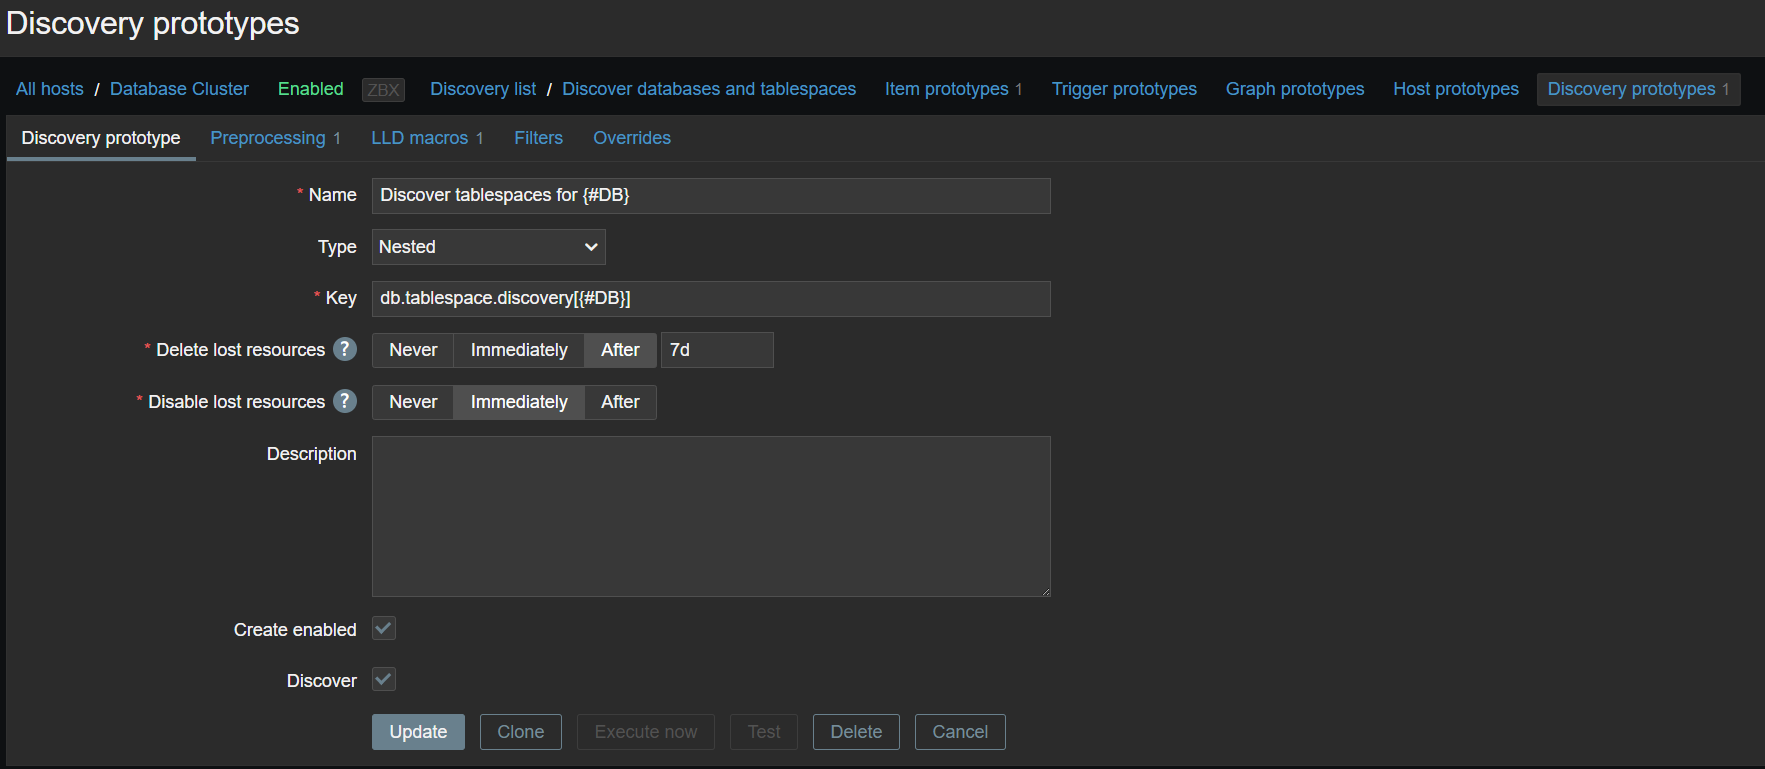
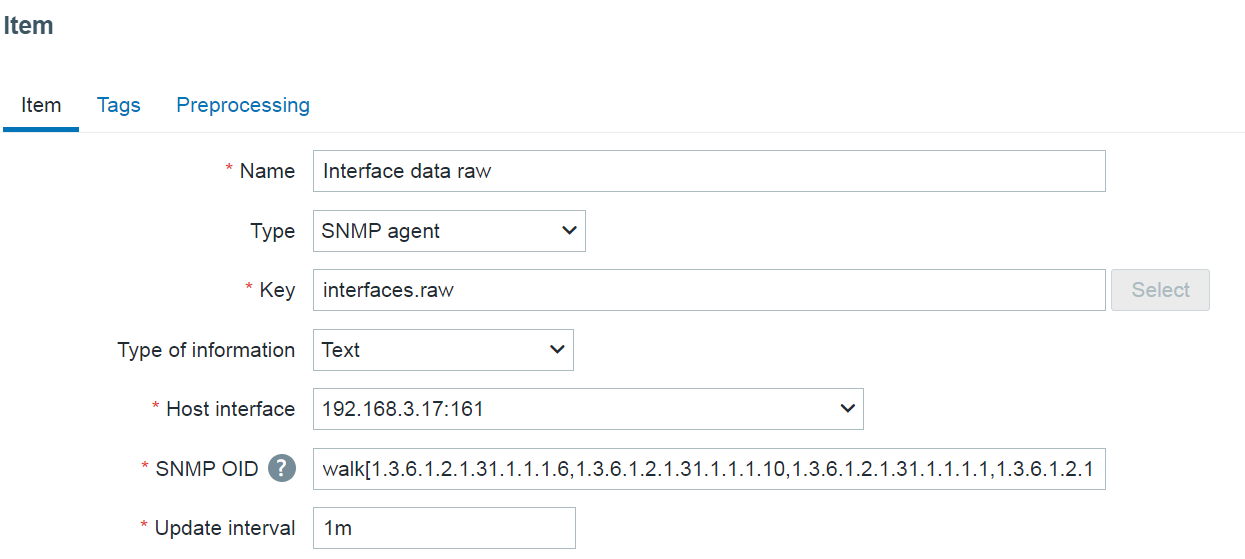
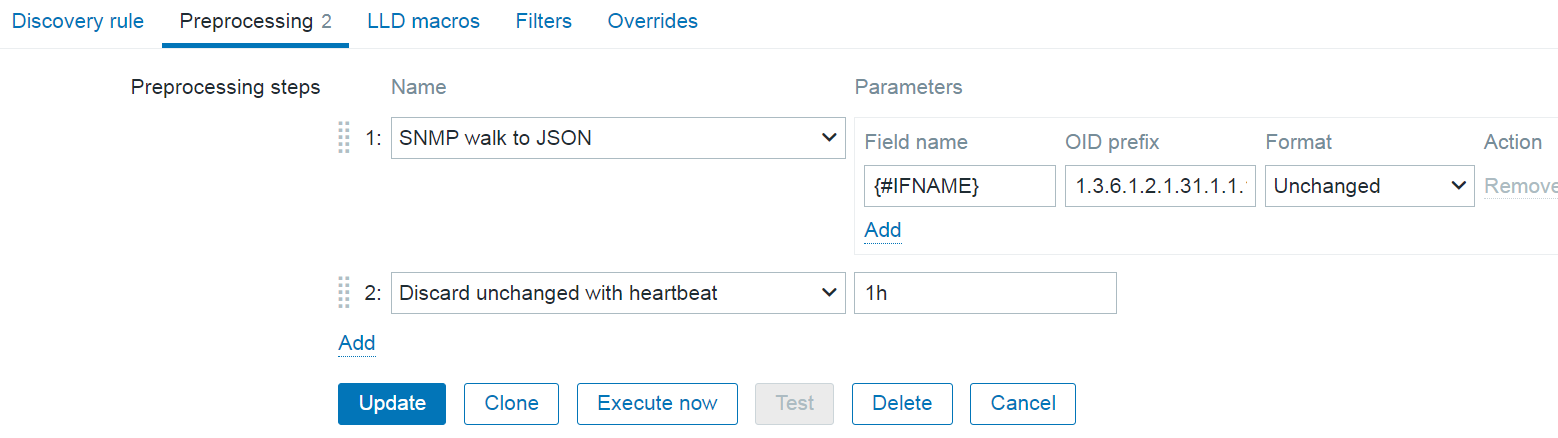
A new item type has been added for discovery rule prototypes – Nested. This type of discovery rule iterates through the JSON file received by the parent low-level discovery rule to discover child entities. For example:

[   {     "database""db1",     "created_at""2024-02-01T12:30:00Z",     "encoding""UTF8",     "tablespaces": [       "name""ts1""max_size""10GB" },       "name""ts2""max_size""20GB" },       "name""ts3""max_size""15GB" }     ]   },   {     "database""db2",     "created_at""2023-11-15T08:45:00Z",     "encoding""UTF16",     "tablespaces": [       "name""ts1""max_size""5GB" },       "name""ts2""max_size""25GB" },       "name""ts3""max_size""30GB" }     ]   },   {     "database""db3",     "created_at""2024-01-05T15:10:00Z",     "encoding""UTF8",     "tablespaces": [       "name""ts1""max_size""12GB" },       "name""ts2""max_size""18GB" },       "name""ts3""max_size""22GB" }     ]   } ]

If we set the jsonpath preprocessing in the discovery rule prototype to JSONPath=$.tablespaces and set the low-level discovery macro to {#TSNAME}=$.name, the nested low-level discovery rule will create discovery rules to discover tablespaces for each database.

Low-level discovery rules are created from the discovery prototype

Inline form validation

Inline validation has been introduced with the goal of improving the overall user experience when configuring a variety of Zabbix entities. As of Zabbix 7.4, inline form validation is supported in:
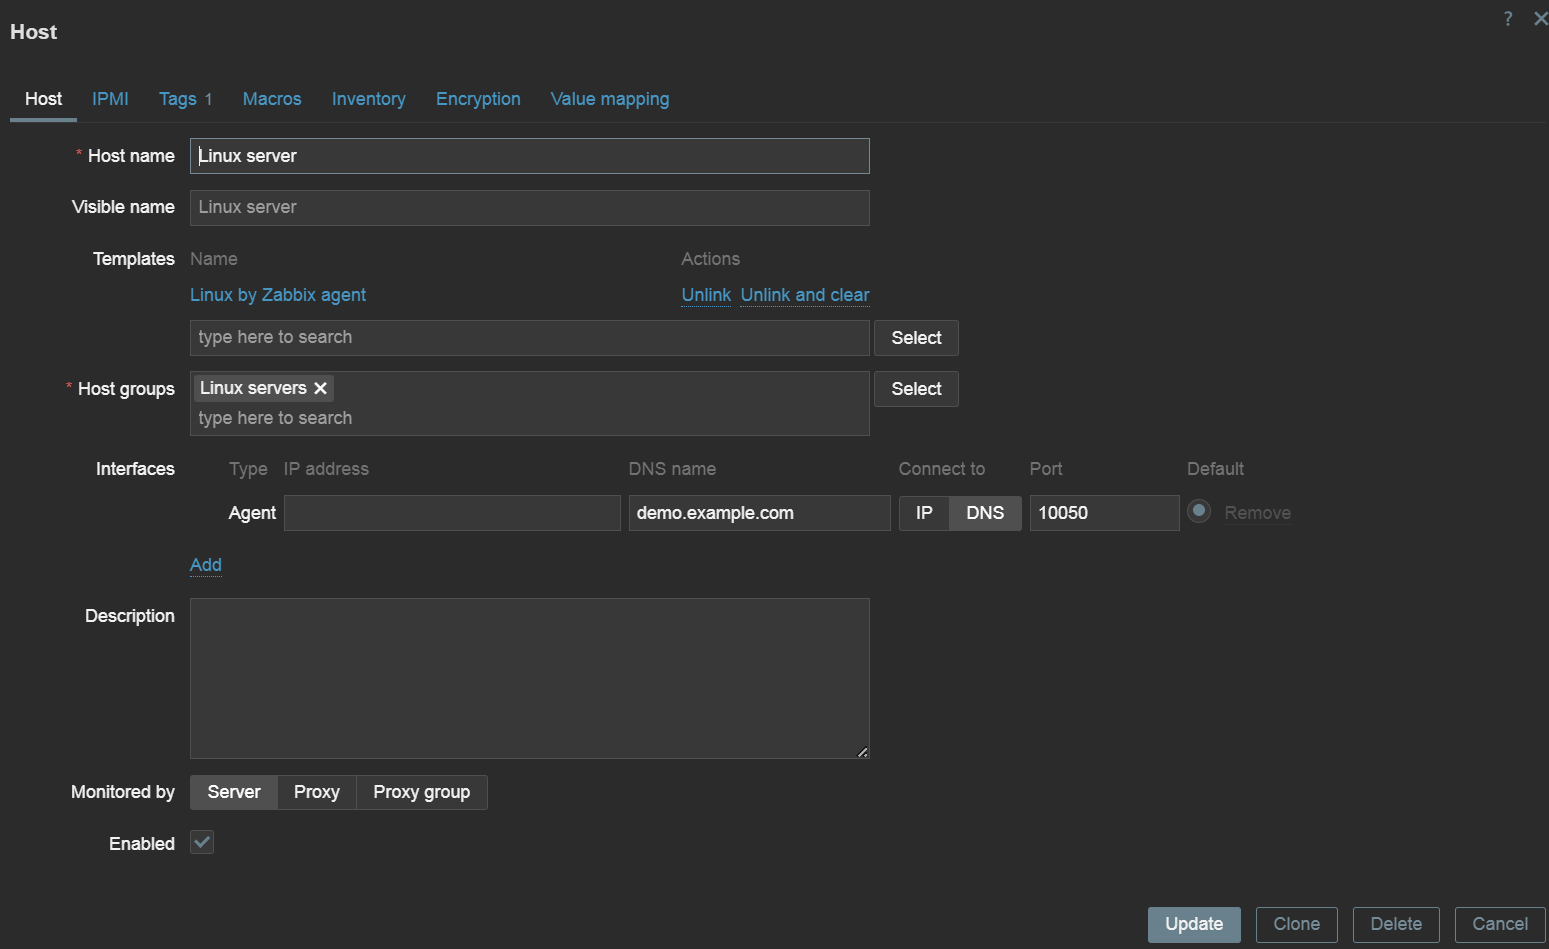
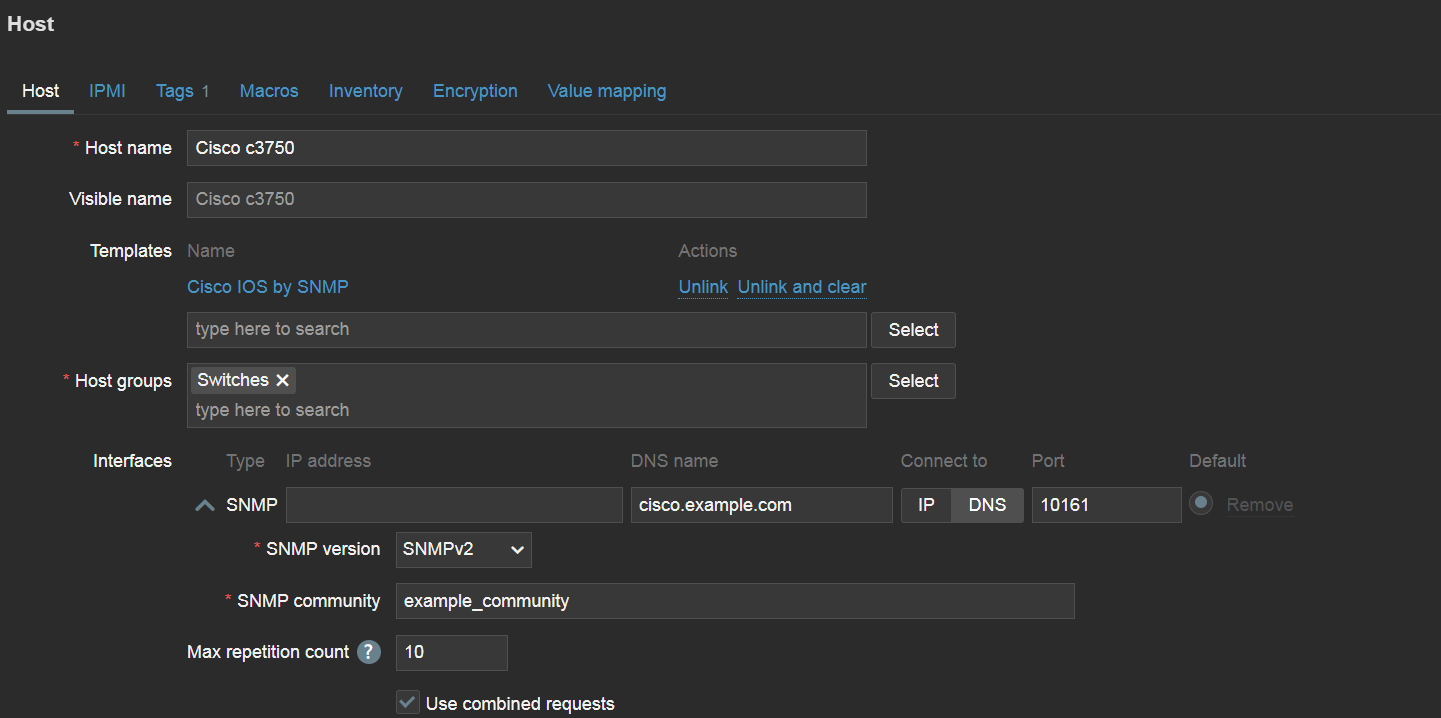
  • Host configuration
  • Template configuration
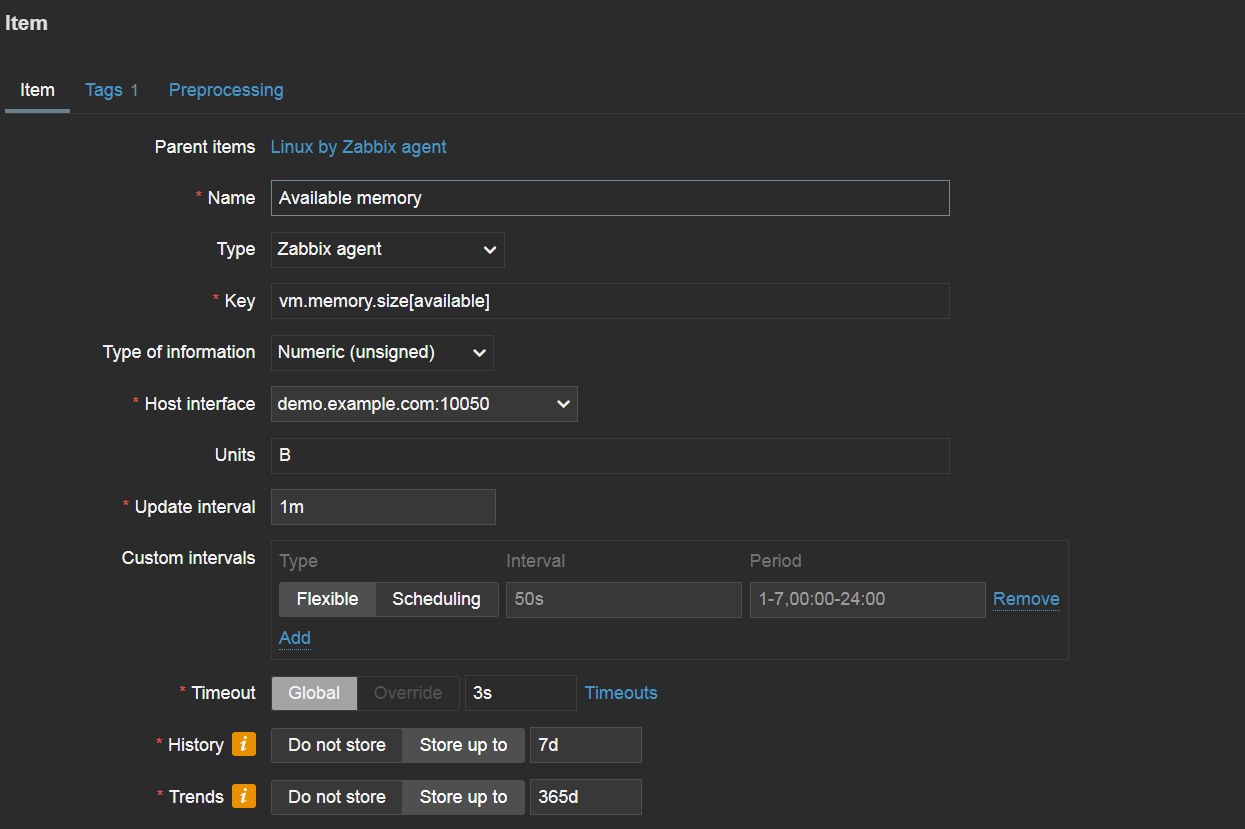
  • Item configuration
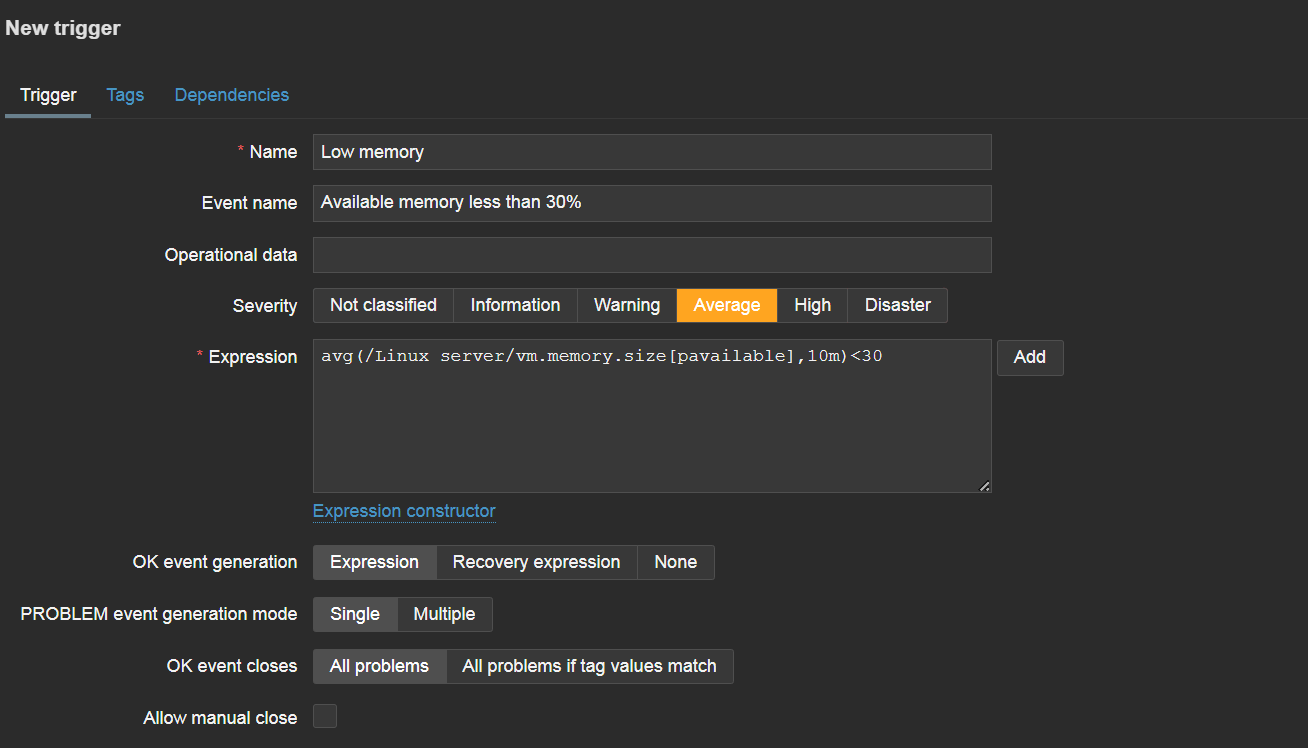
  • Trigger configuration
Inline validation detects any configuration errors on the fly and displays a corresponding error message

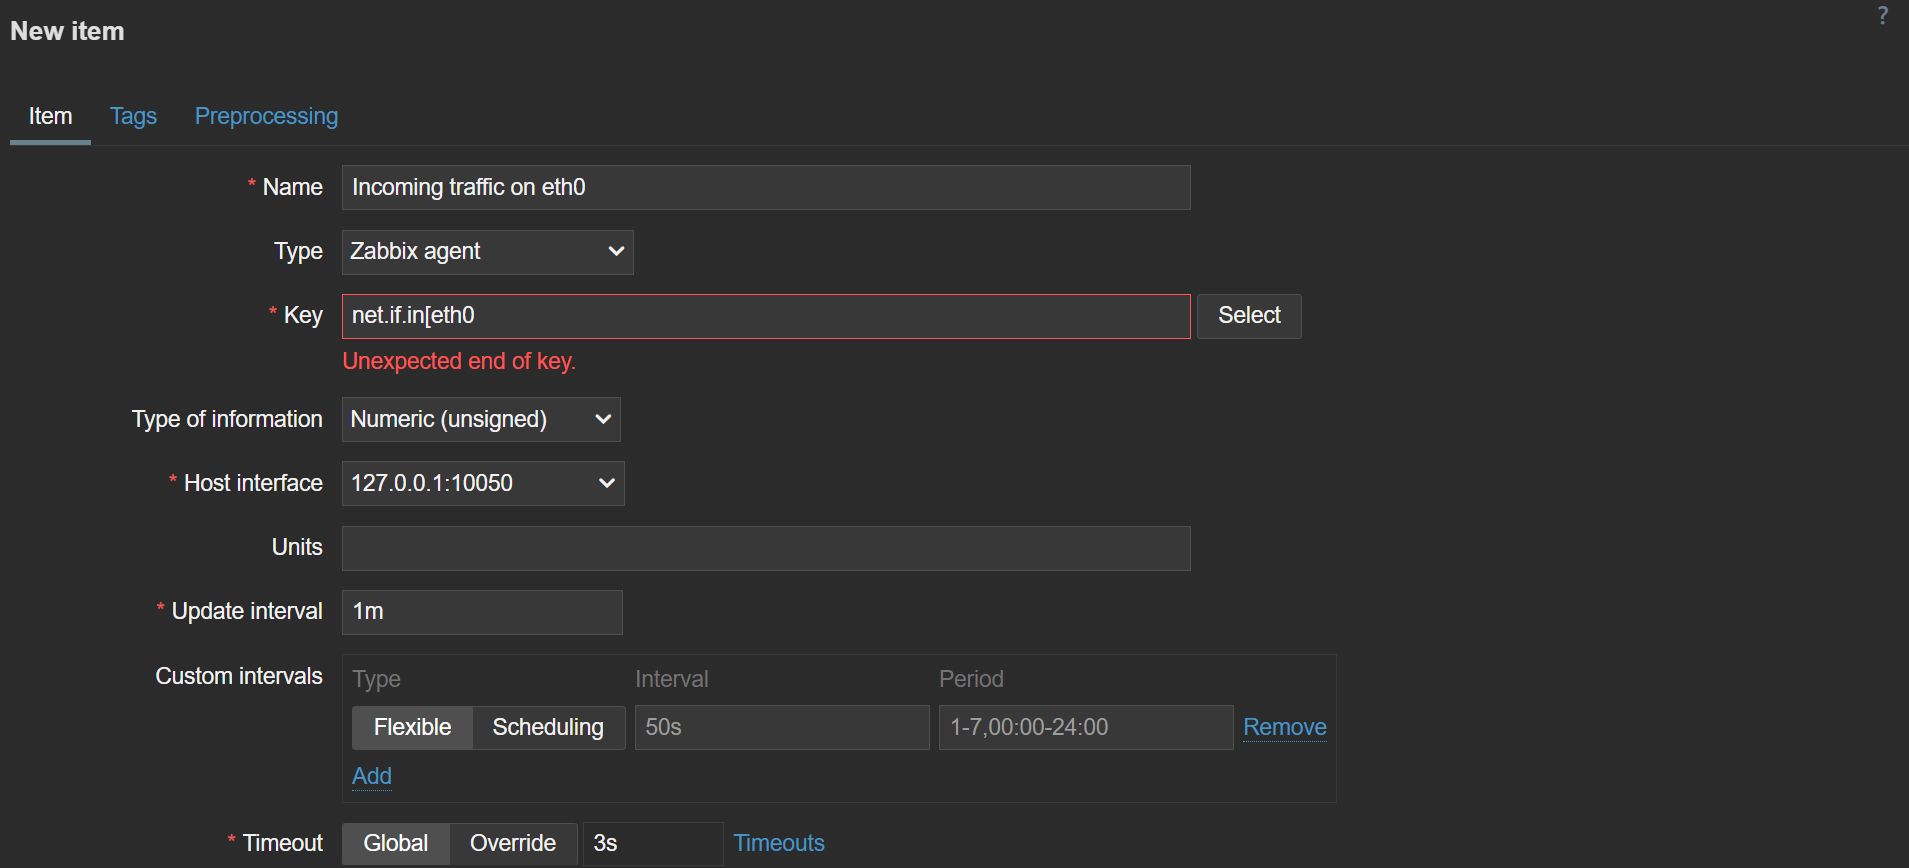
With inline validation in place, users will now receive immediate feedback regarding any configuration mistakes they have made in the sections above. Configuring new entities, especially items and triggers with complex keys and expressions, is now faster than ever.

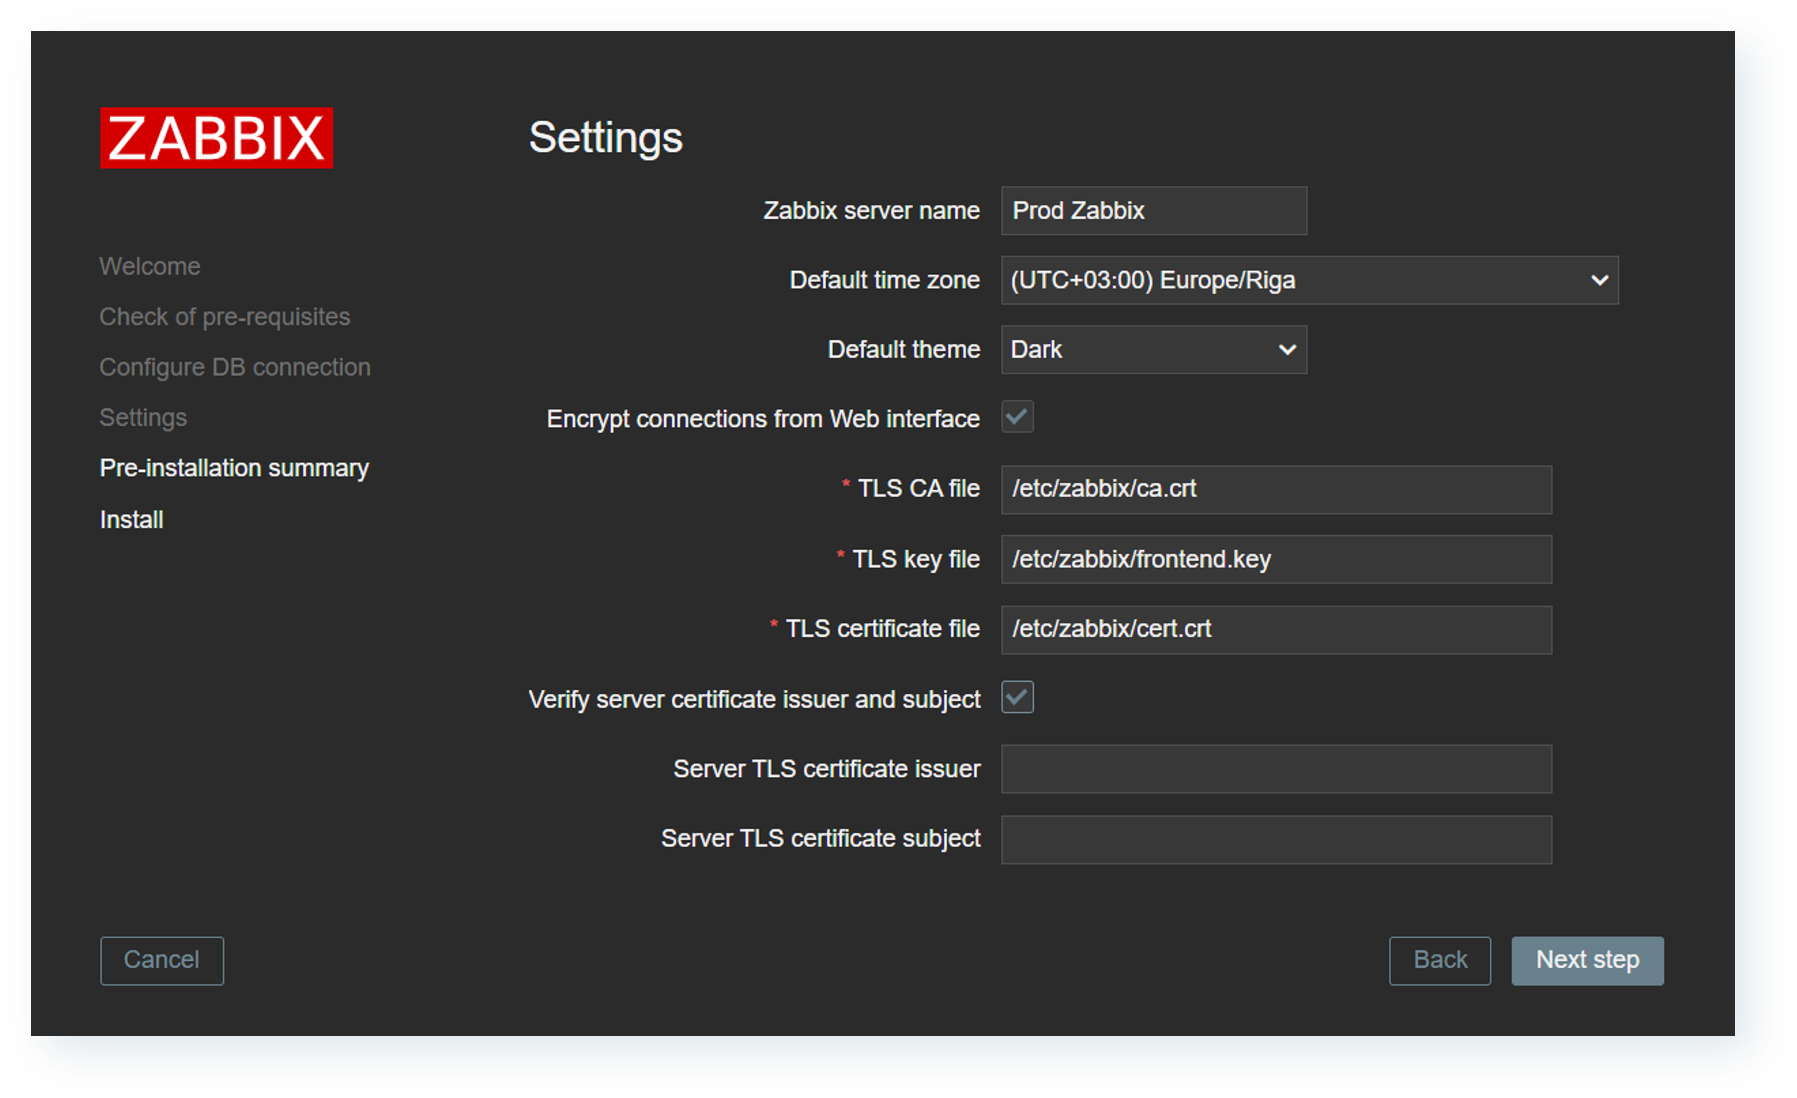
Frontend-to-server communication encryption

To further strengthen Zabbix communication flow security, Zabbix 7.4 introduces the ability to secure frontend to server communication with certificate encryption. The encryption must be configured from two sides, and the frontend setup now includes the options to enable and configure encrypted connections to the server.


Zabbix 7.4 introduces the ability to encrypt frontend-to-server connections

On the Zabbix server side, multiple new configuration parameters have been added:

  • TLSFrontendAccept – which incoming connections to accept from frontend
  • TLSFrontendCertIssuer – allowed frontend certificate issuer
  • TLSFrontendCertSubject – allowed frontend certificate subject
  • FrontendAllowedIP – frontend connections will be accepted only from addresses listed here if the parameter is set

New widgets and visualization improvements

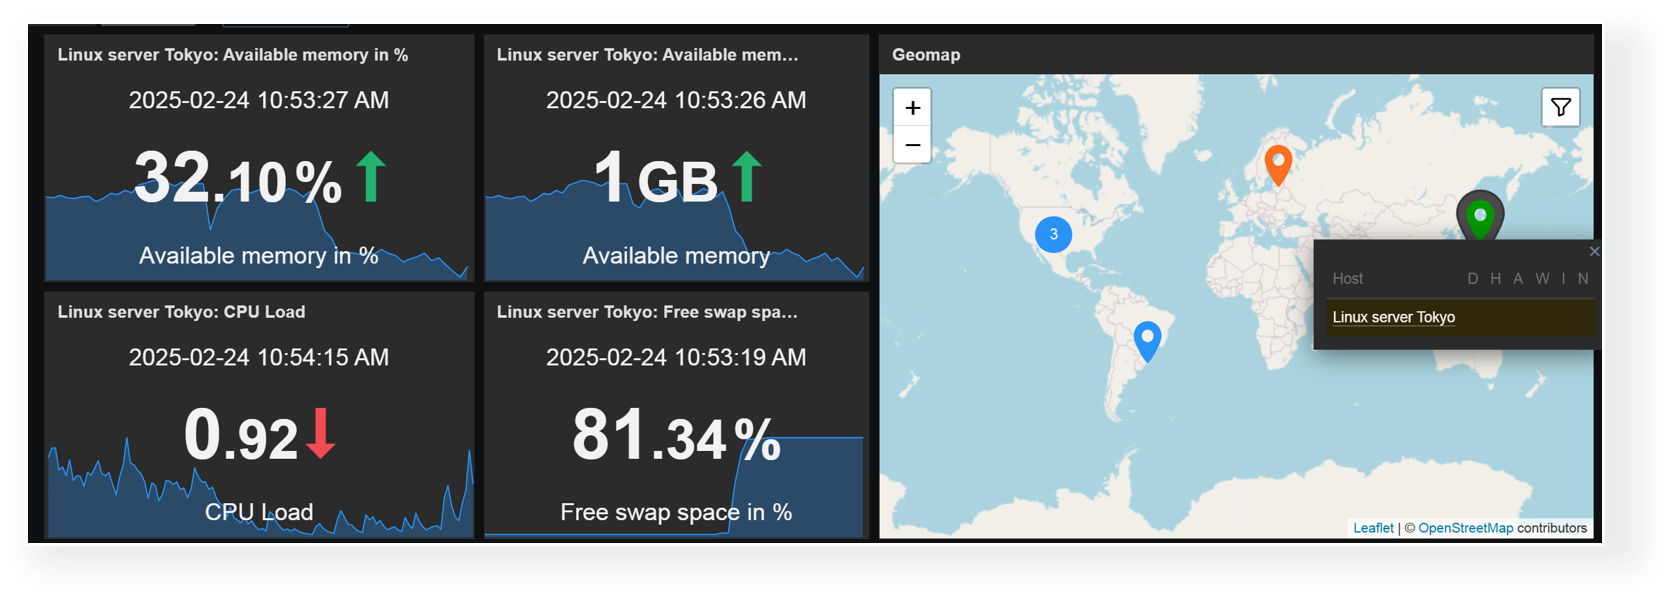
Zabbix 7.4 introduces a new widget (Item card) and multiple visualization improvements for dashboards and network maps.
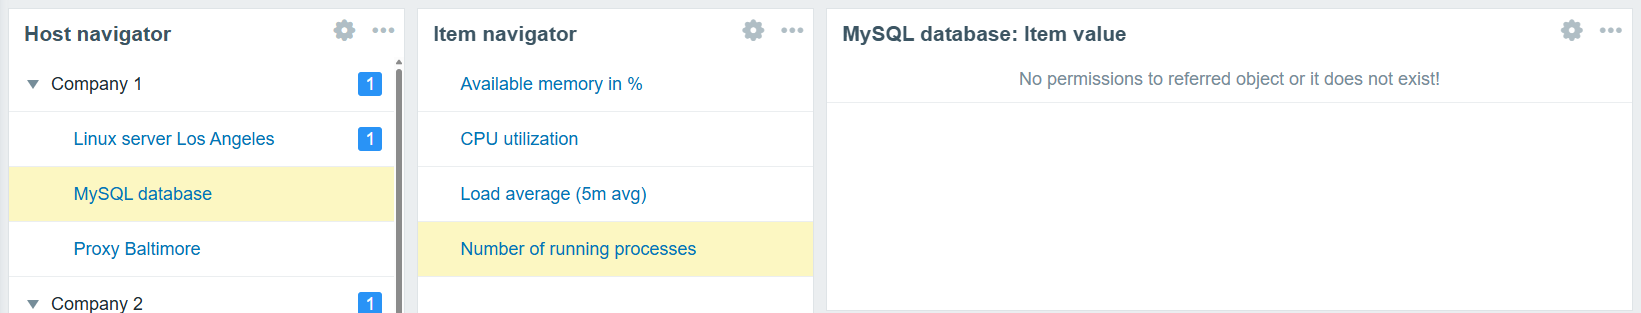
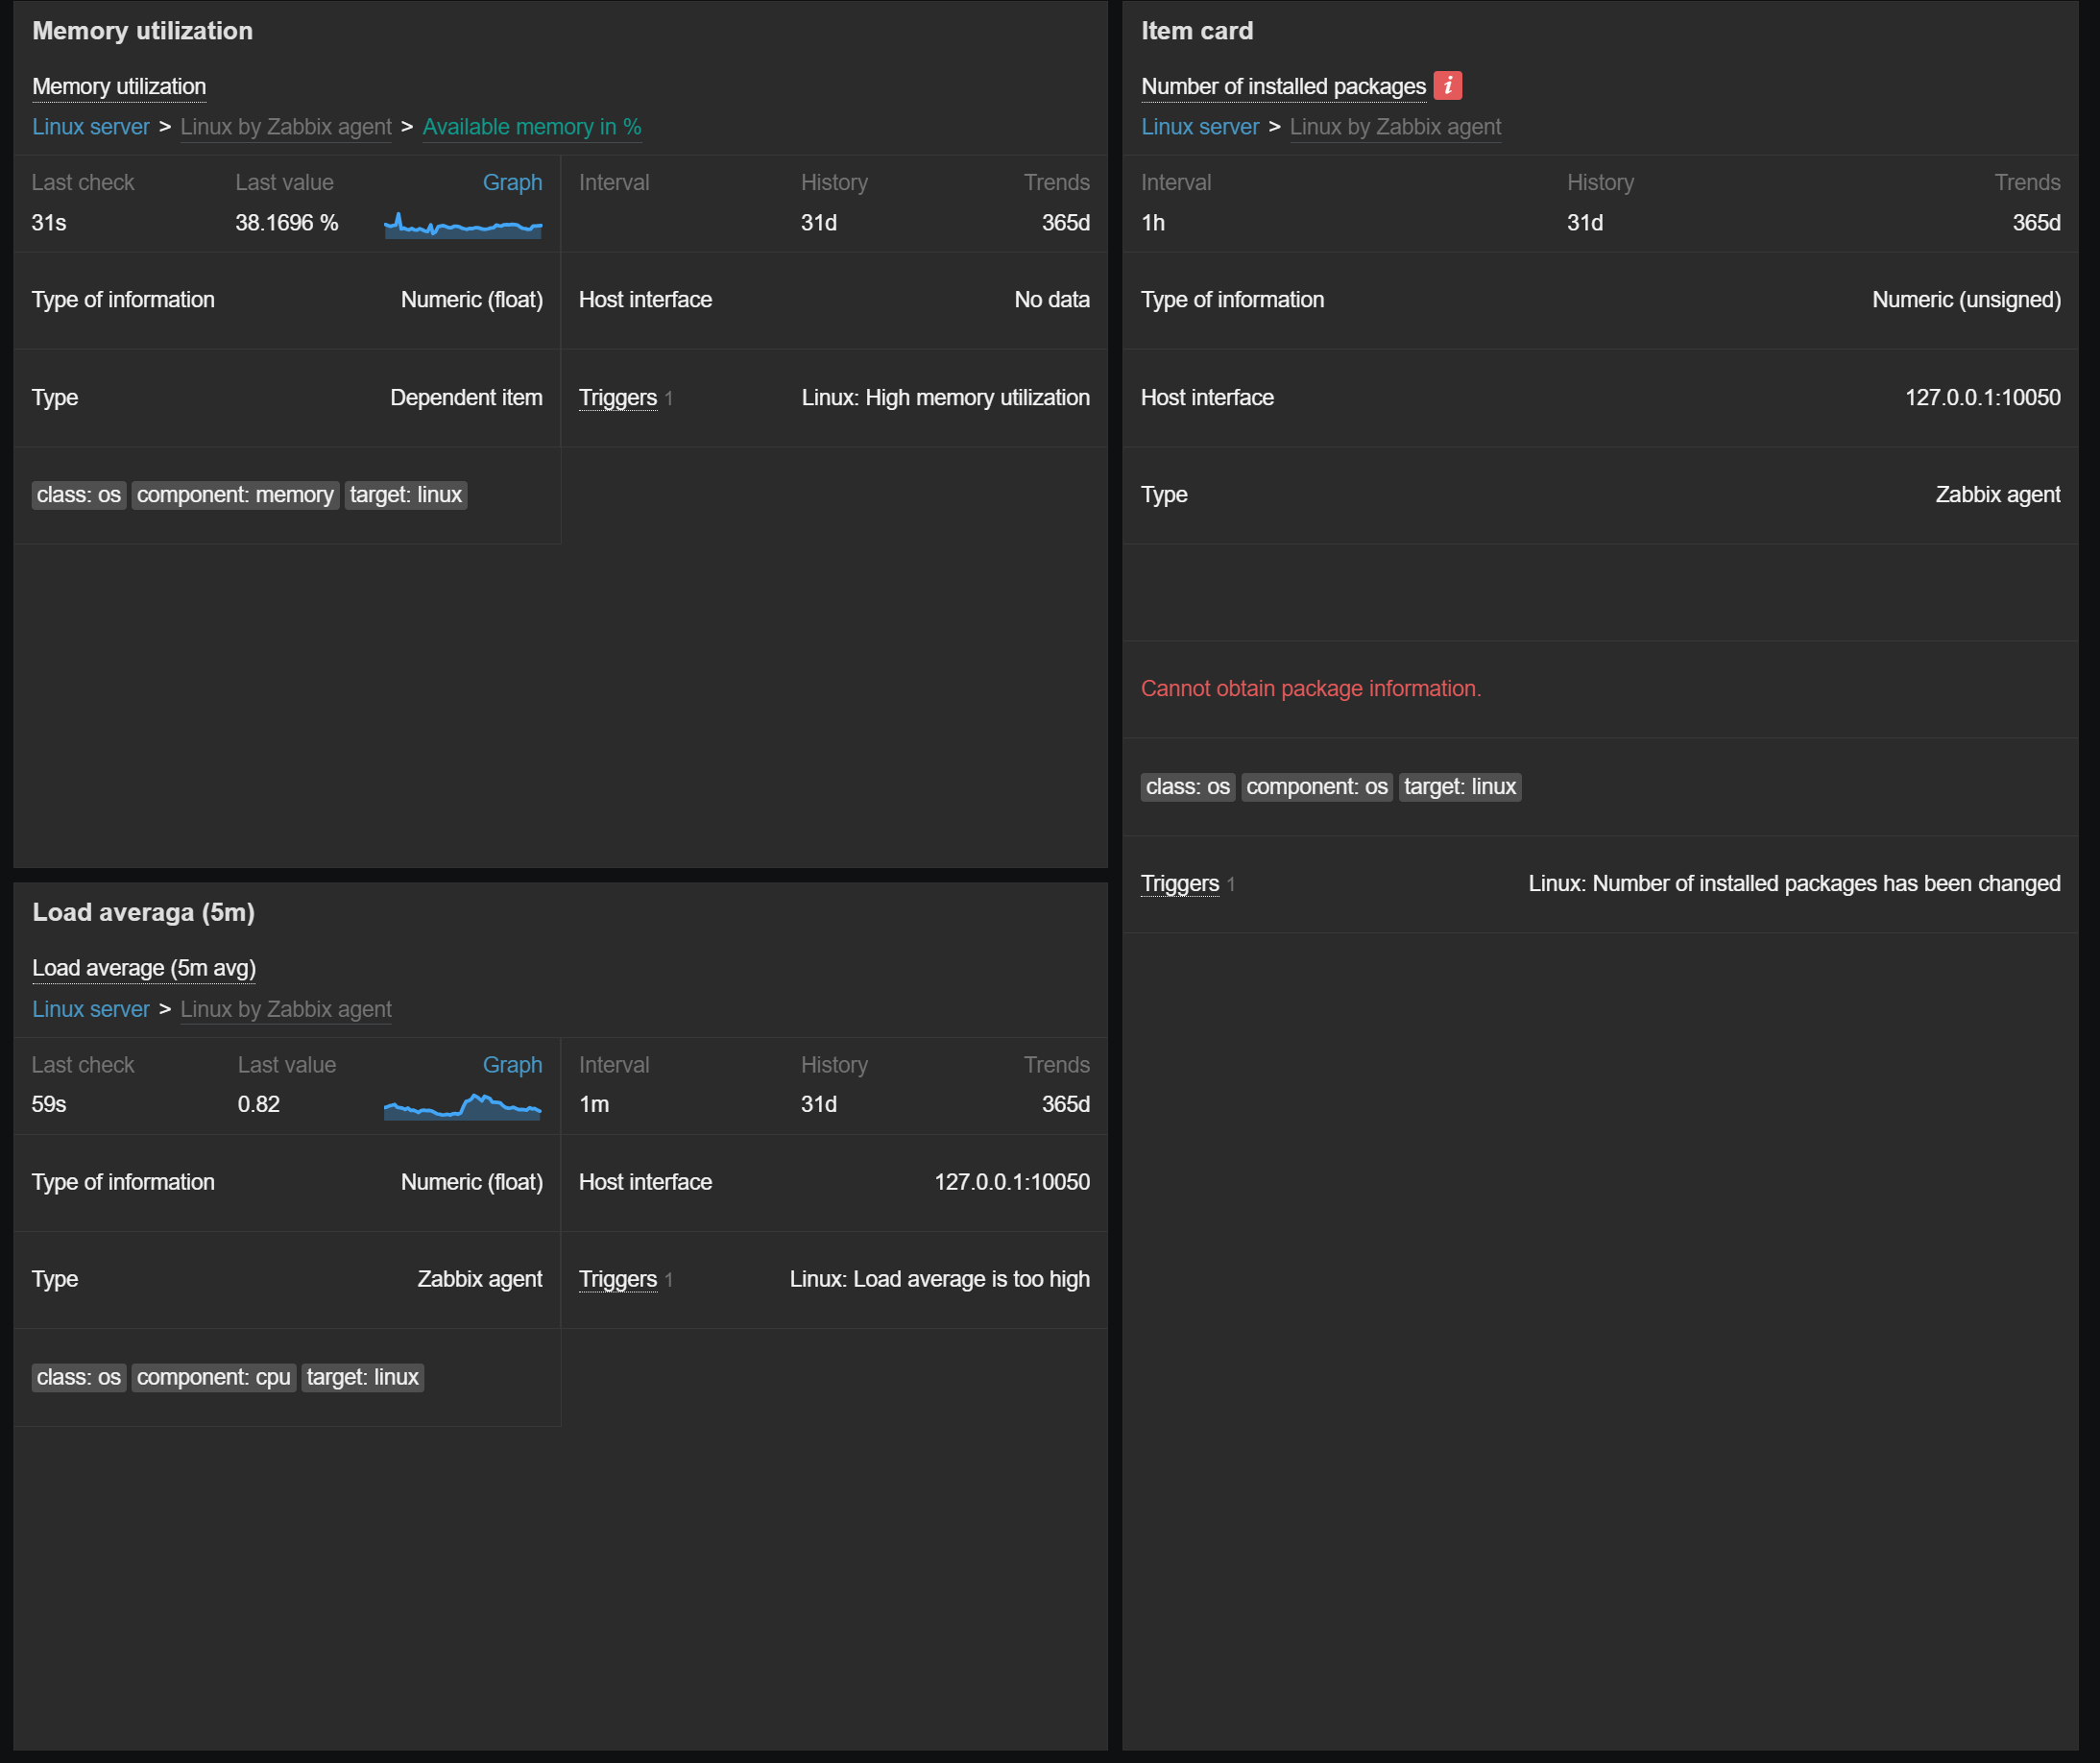
Item card widget

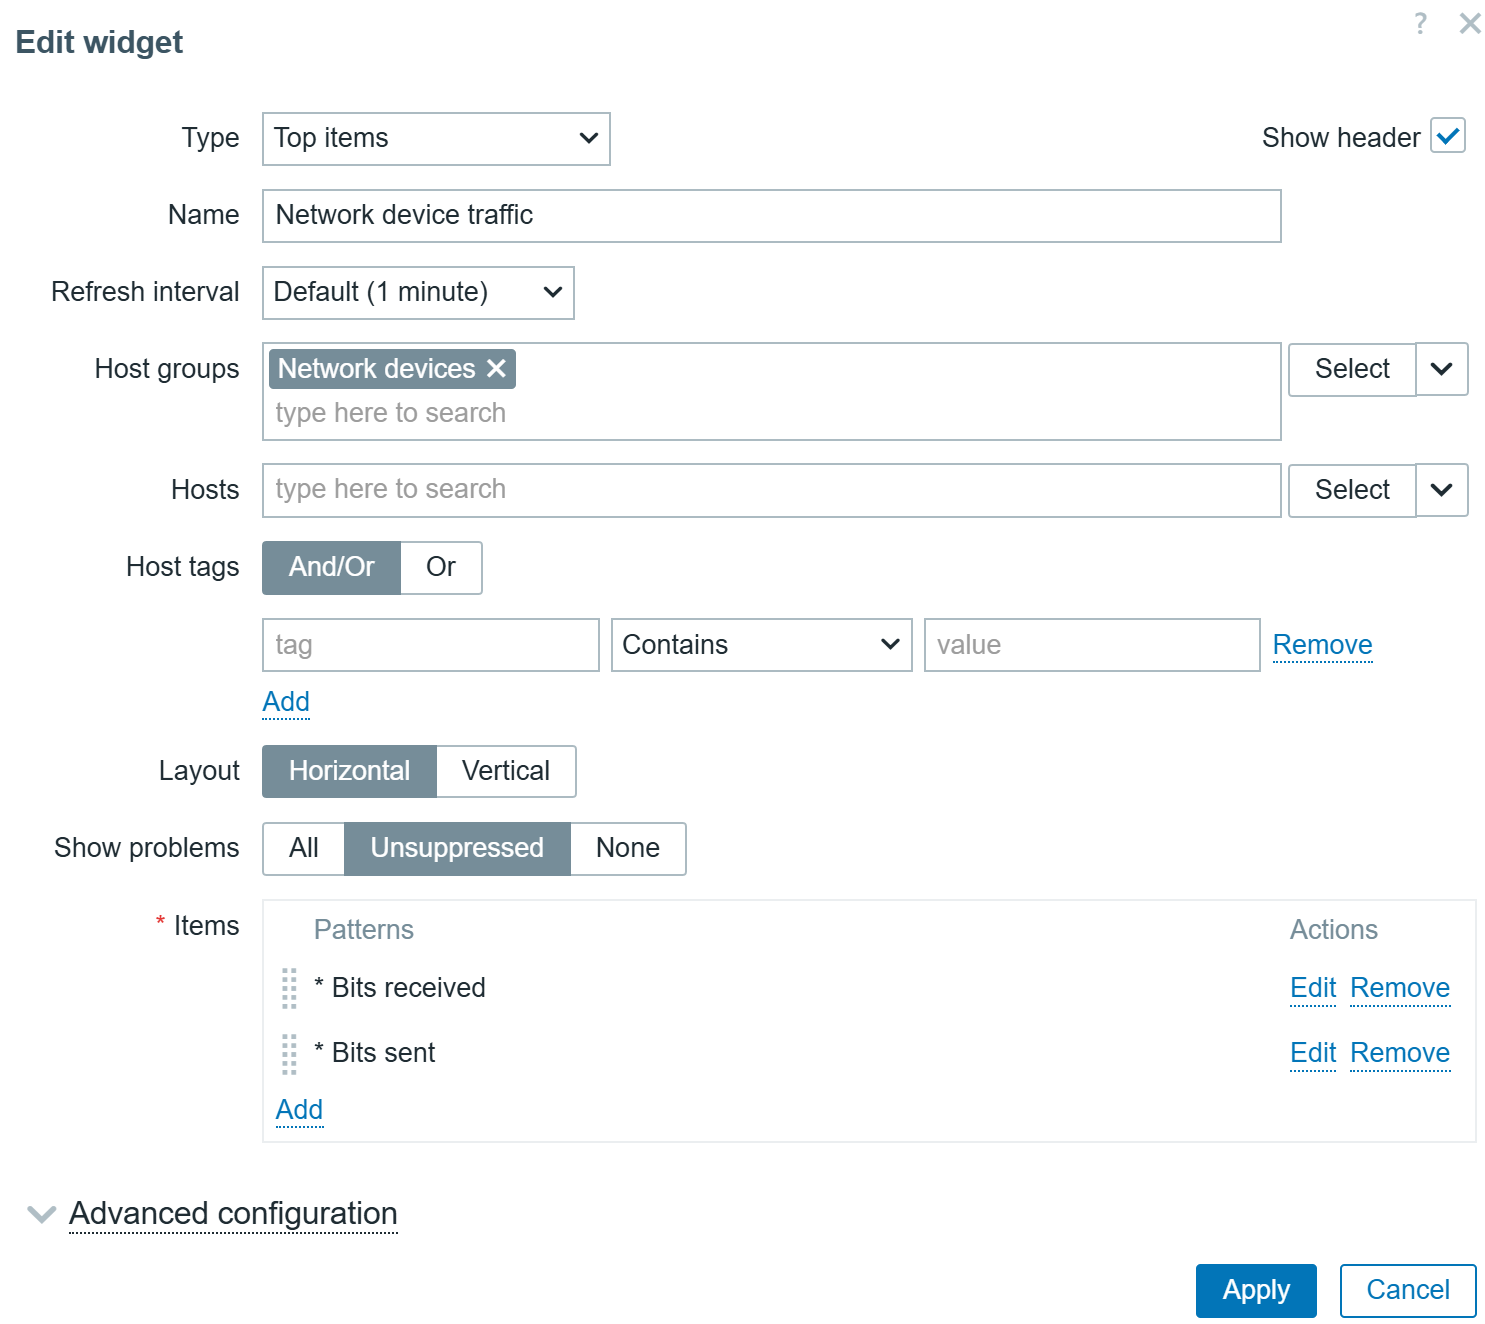
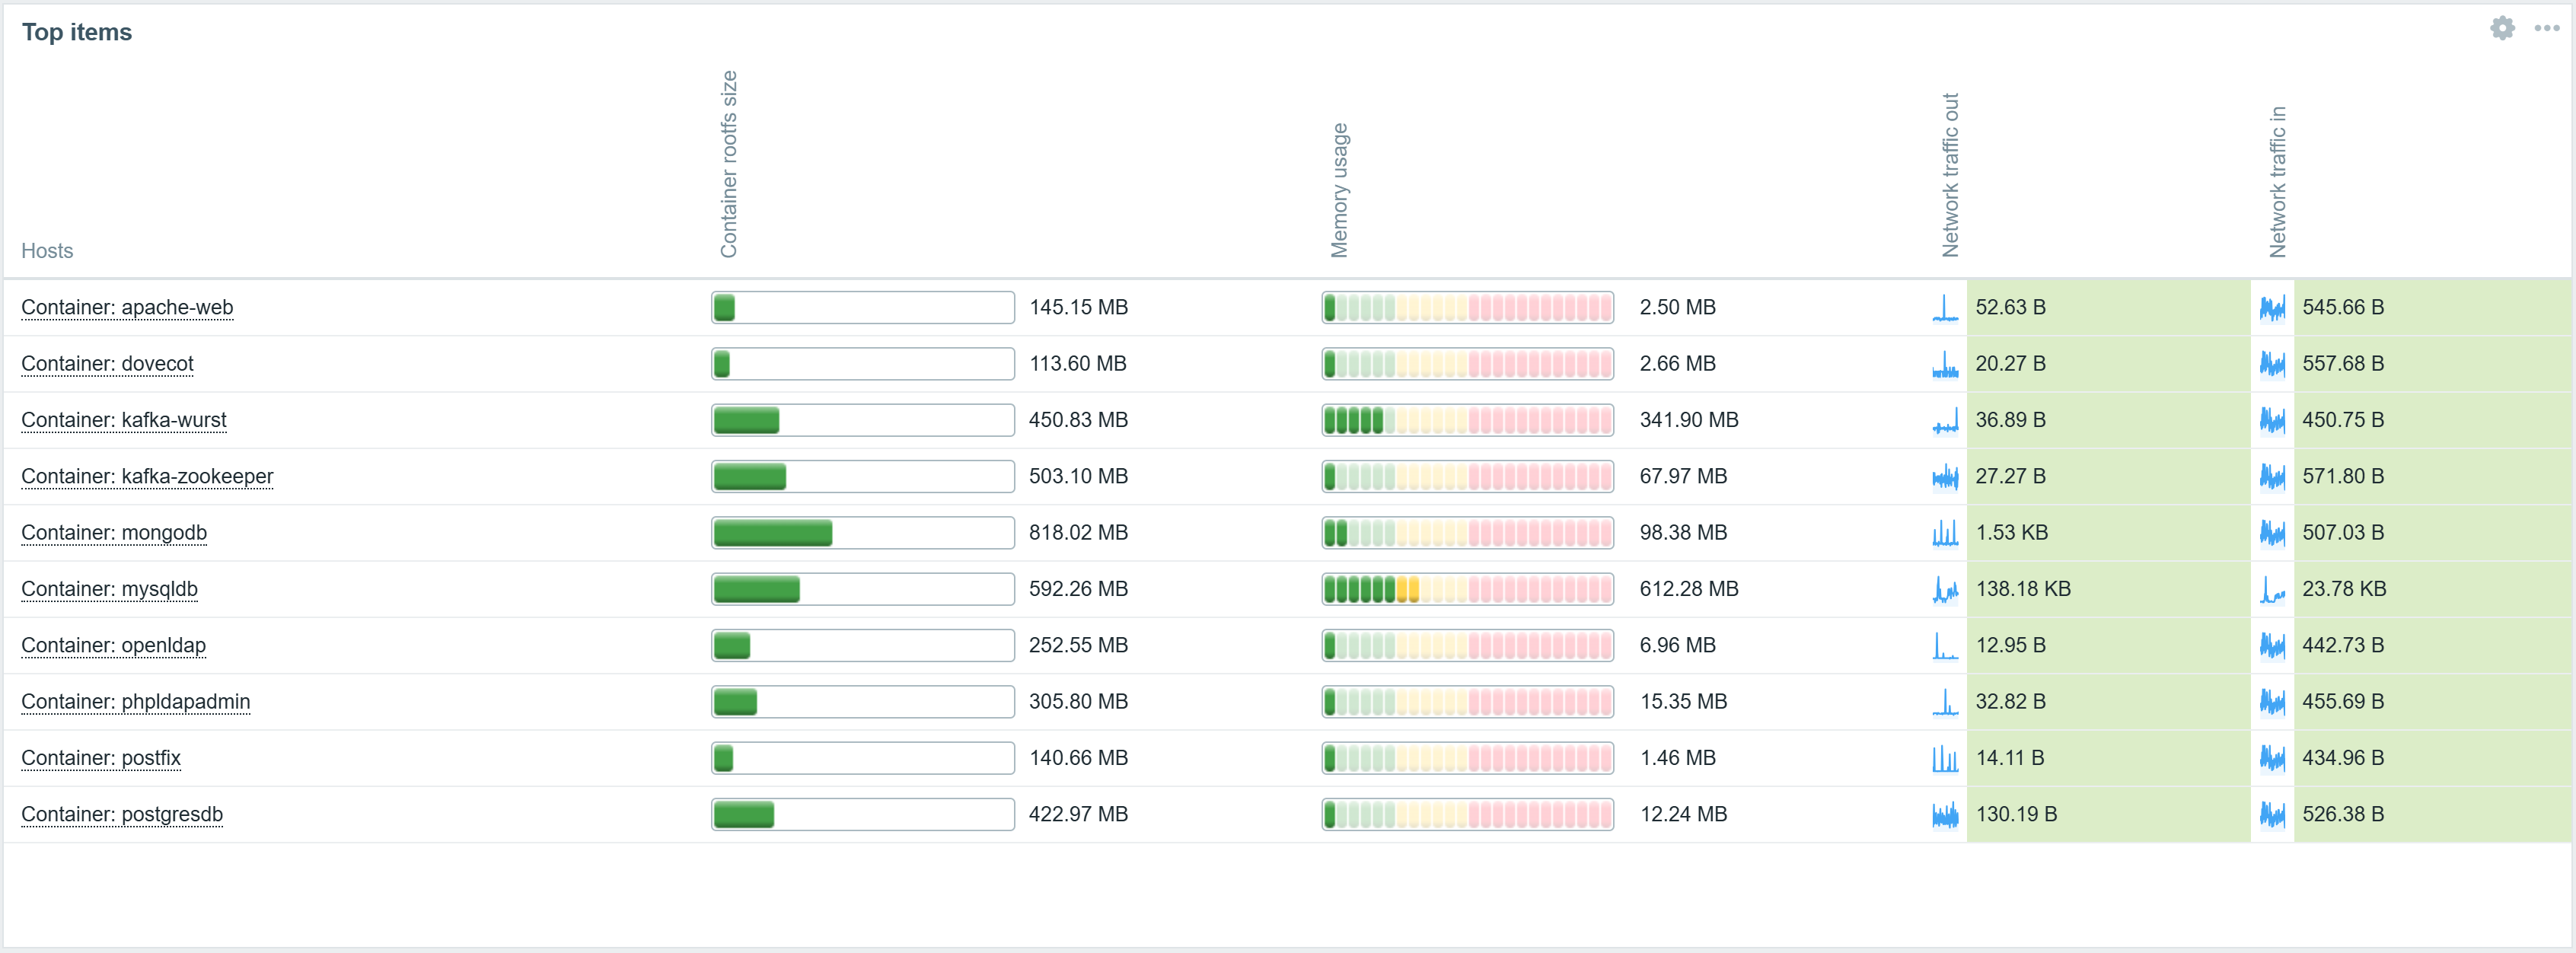
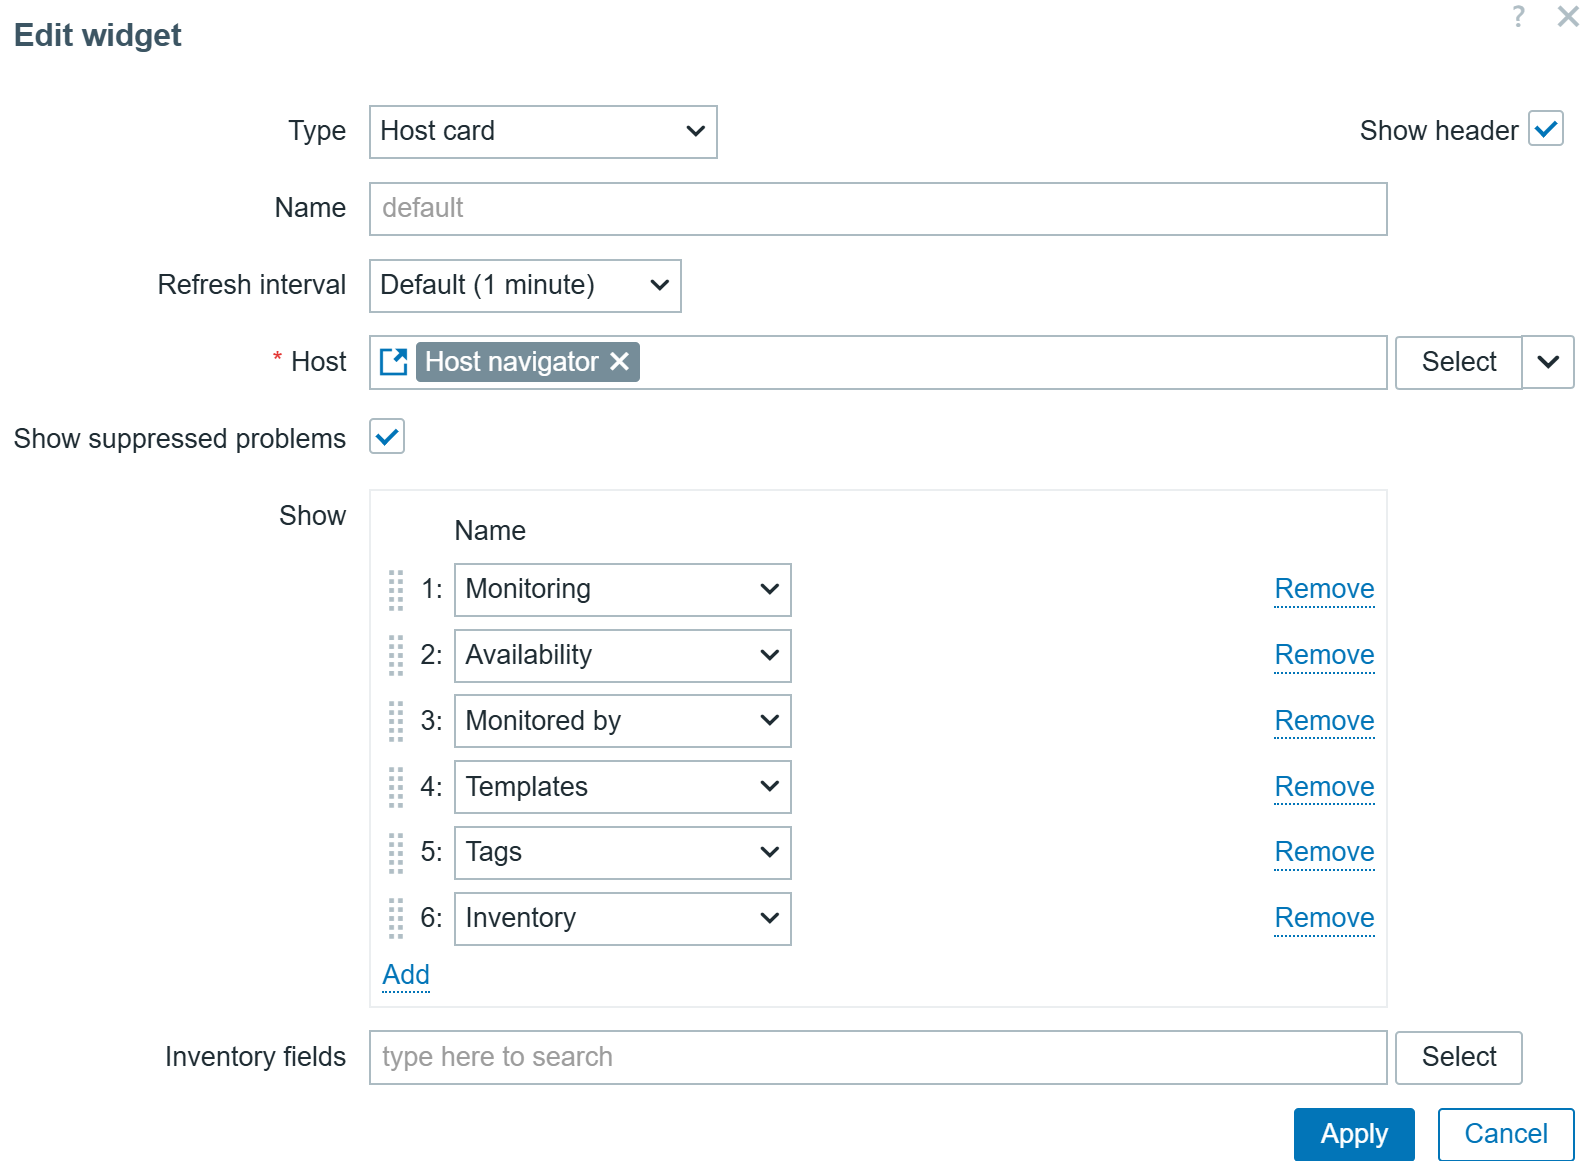
The new Item card widget behaves similarly to the existing Host card widget introduced in Zabbix 7.2. The Item card widget provides a customizable view of an item and its attributes, such as latest data together with a sparkling chart, error messages, interfaces, tags, triggers, and more. The attributes for display can be selected and ordered in the widget configuration.

Various item attributes can be displayed in the item card widget

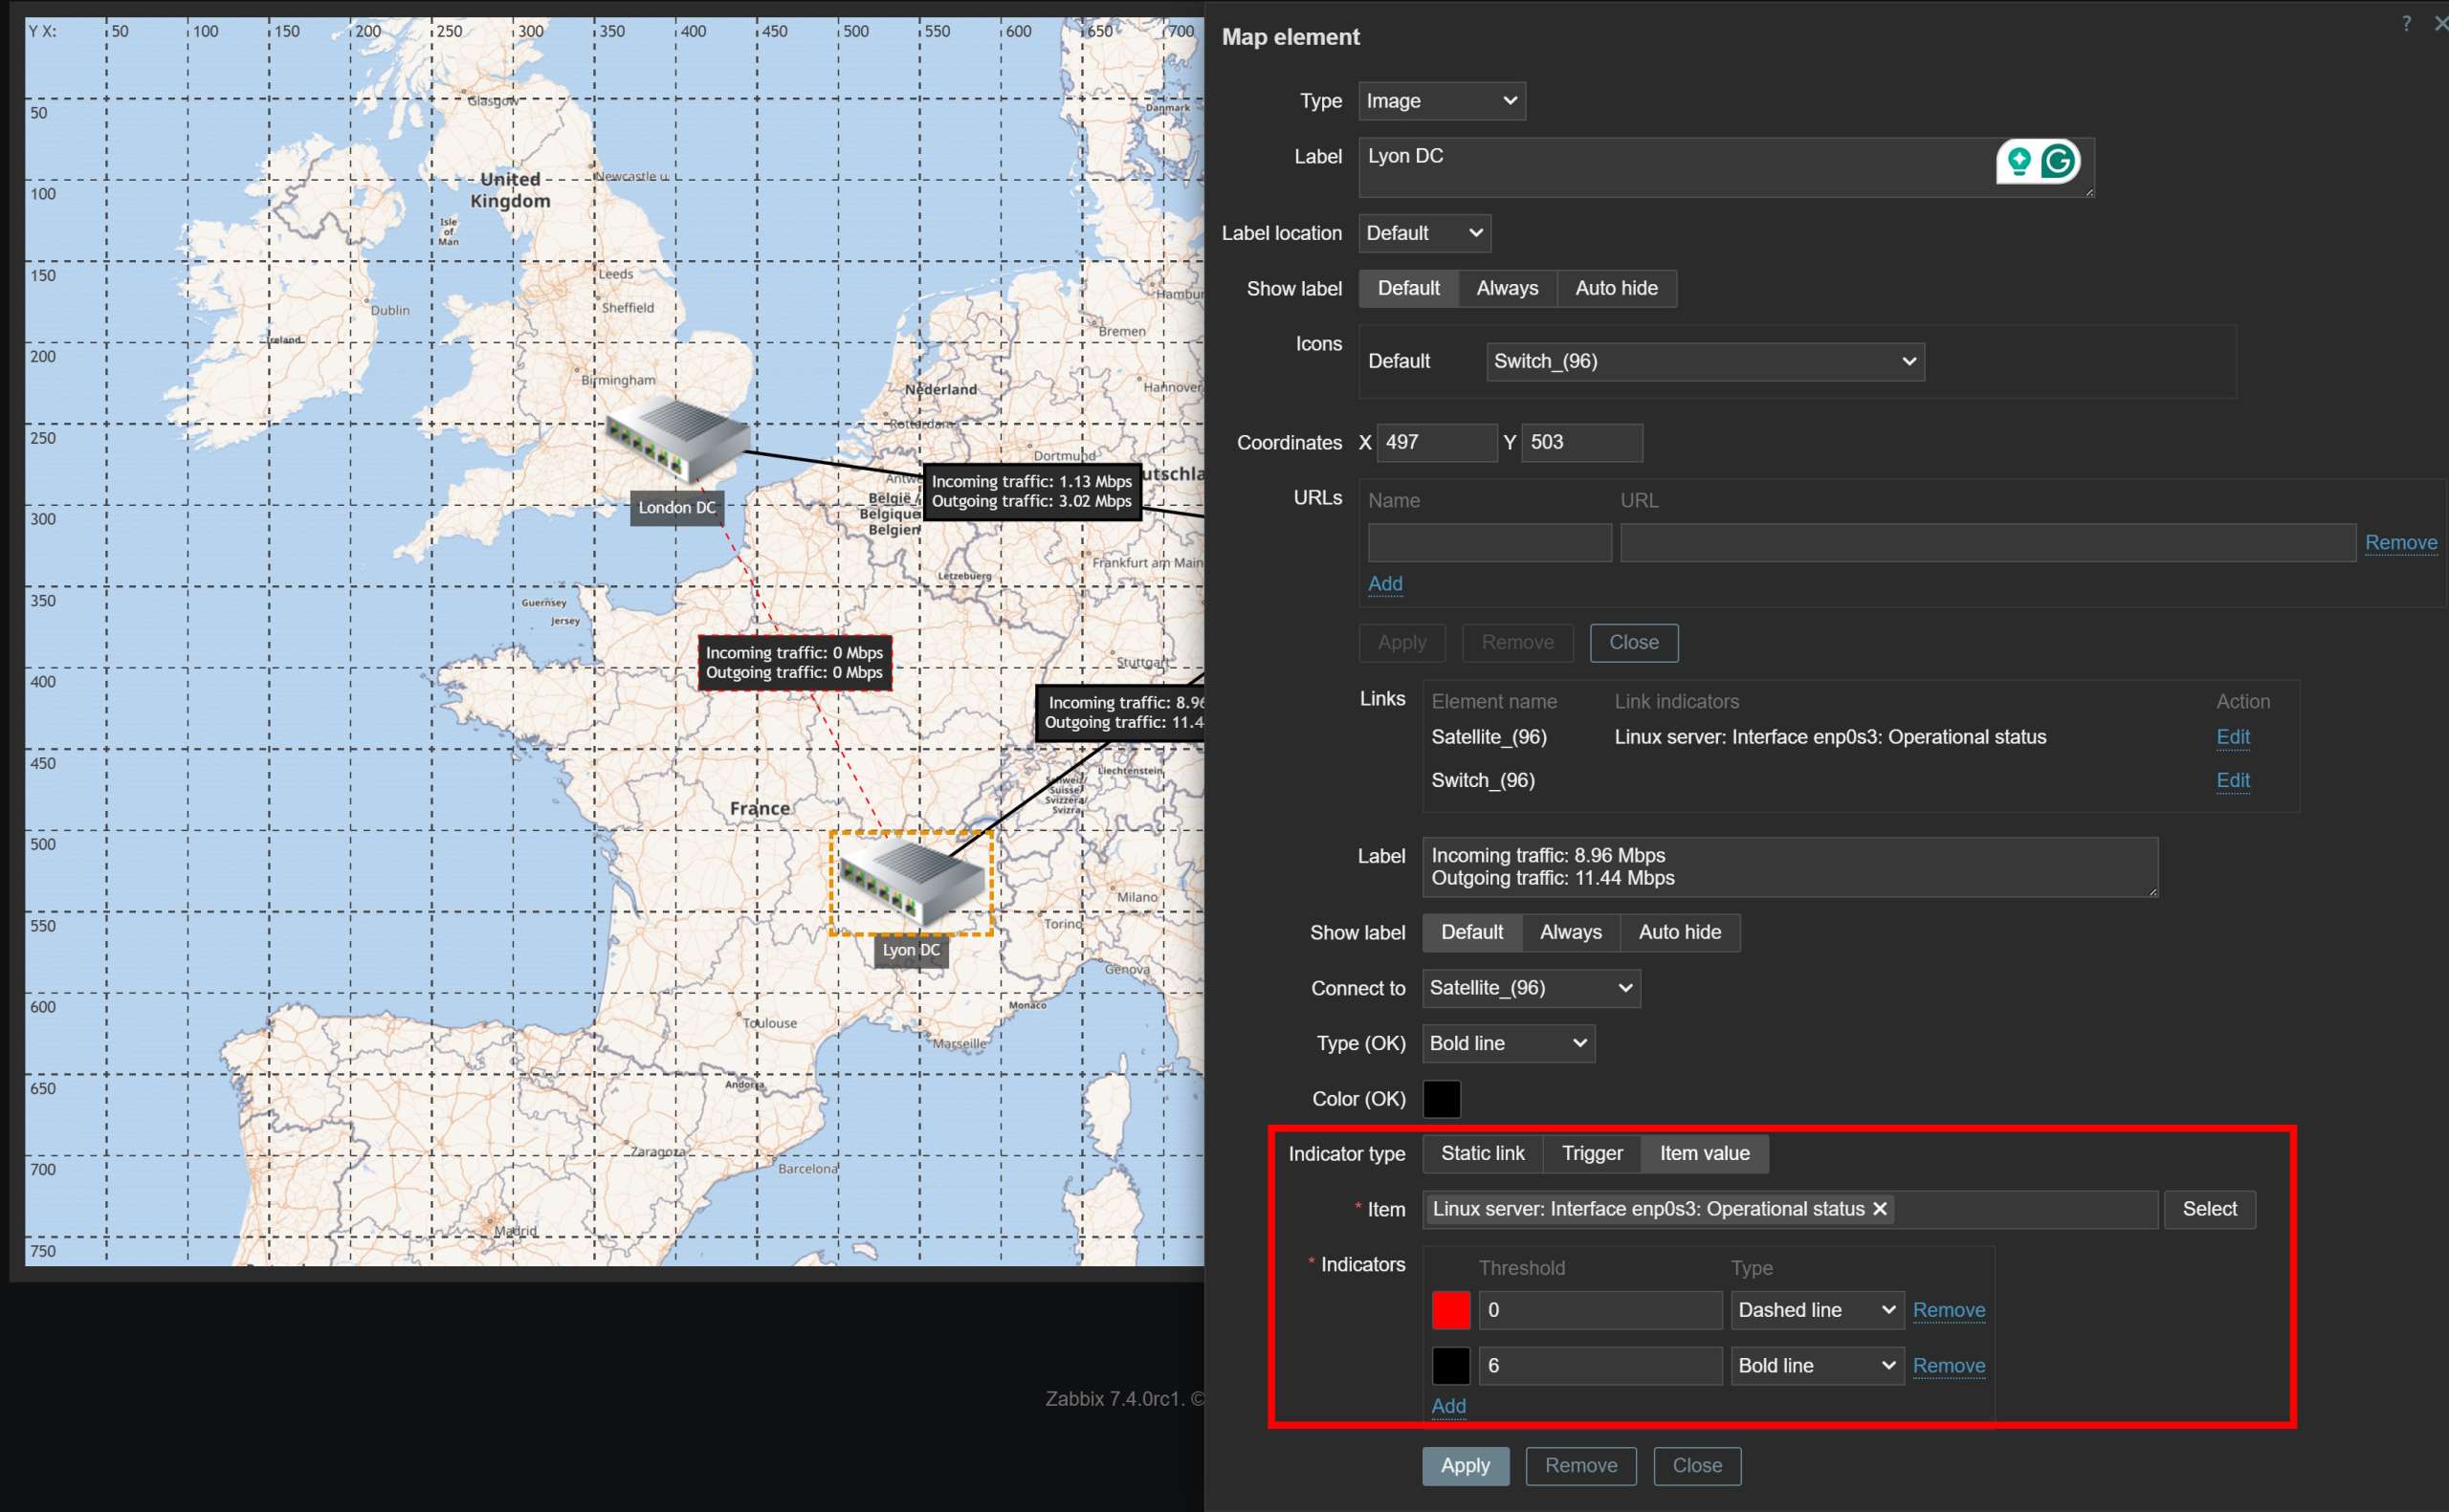
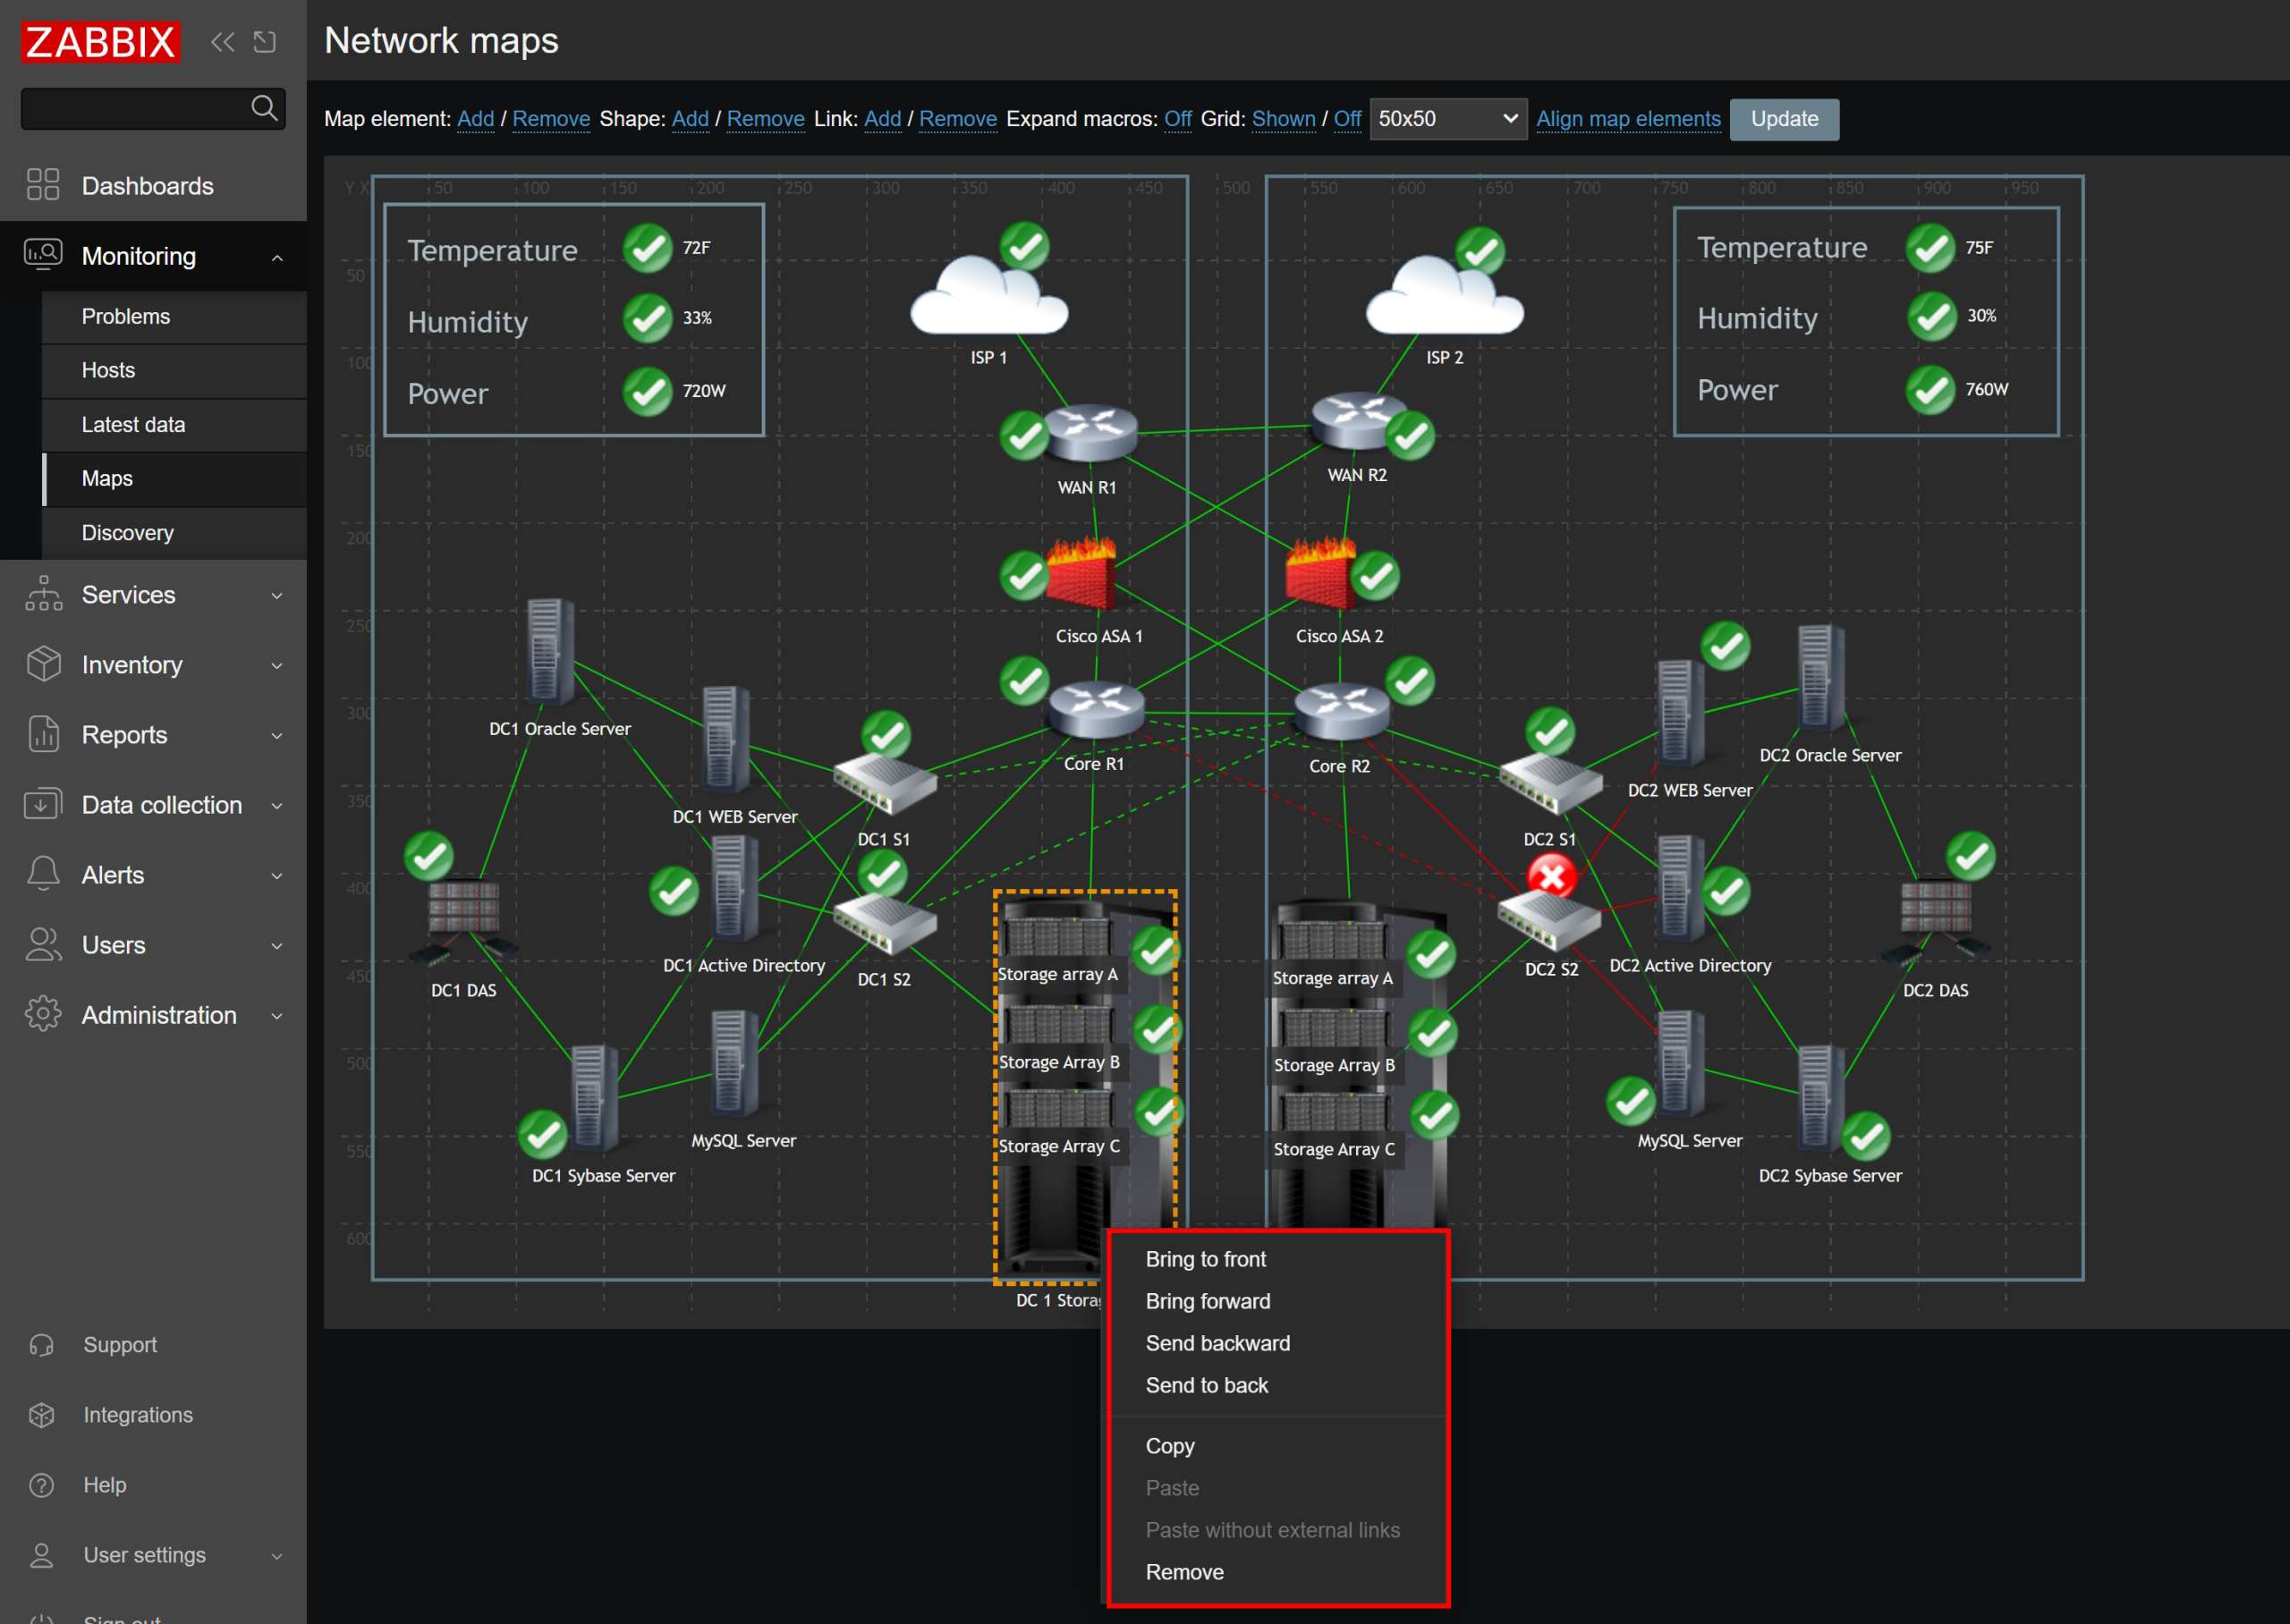
Network map improvements

Network maps have also received multiple improvements, enabling new use cases and simplifying existing network map scenarios.

  • Map background images can now be scaled proportionally to the map dimensions
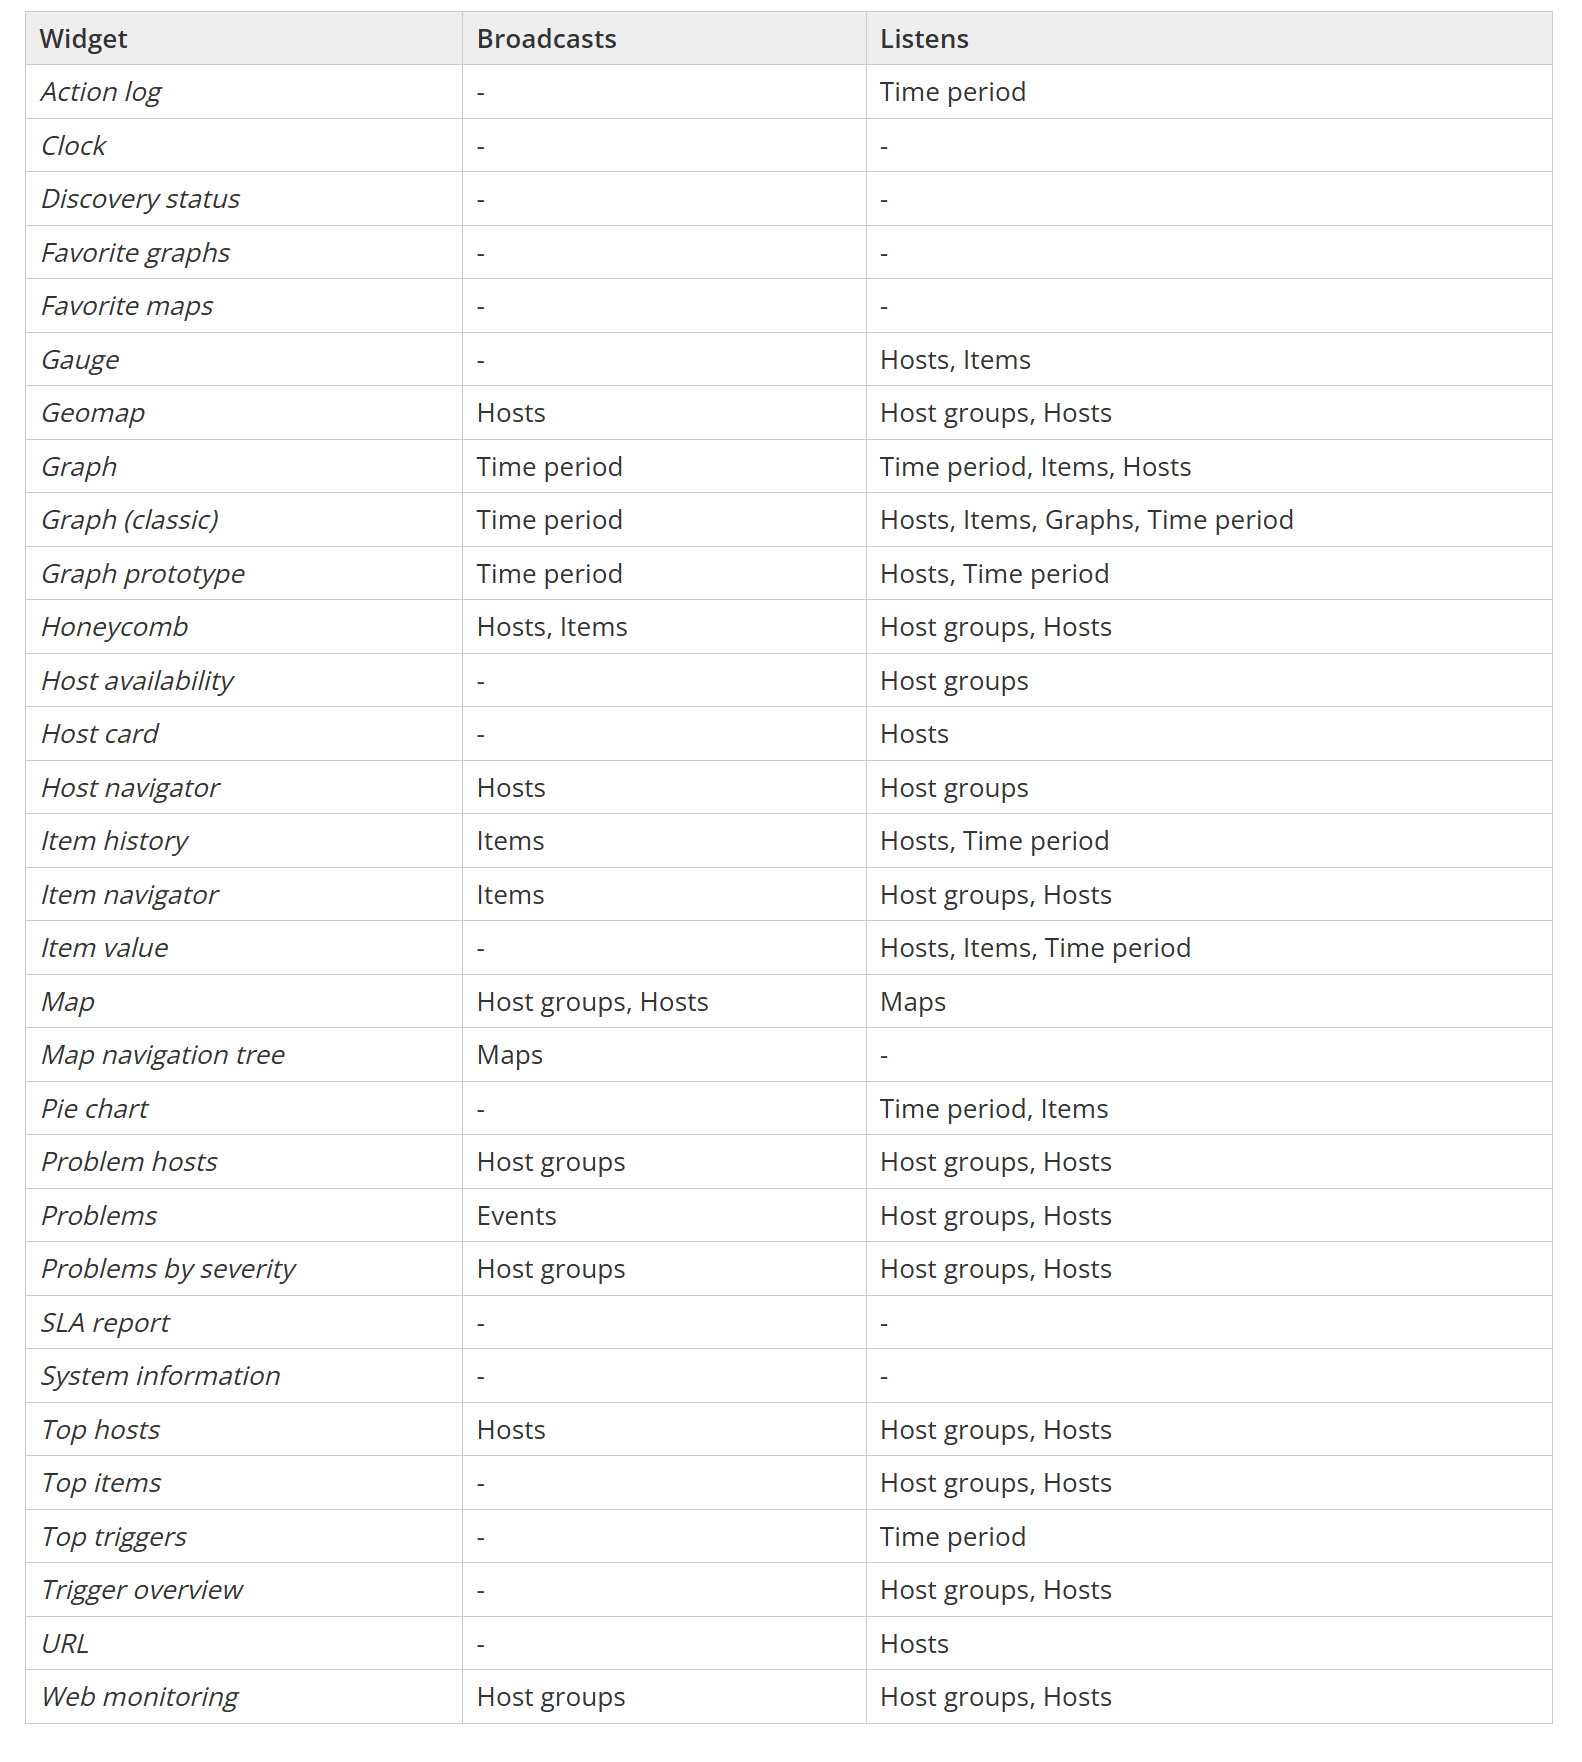
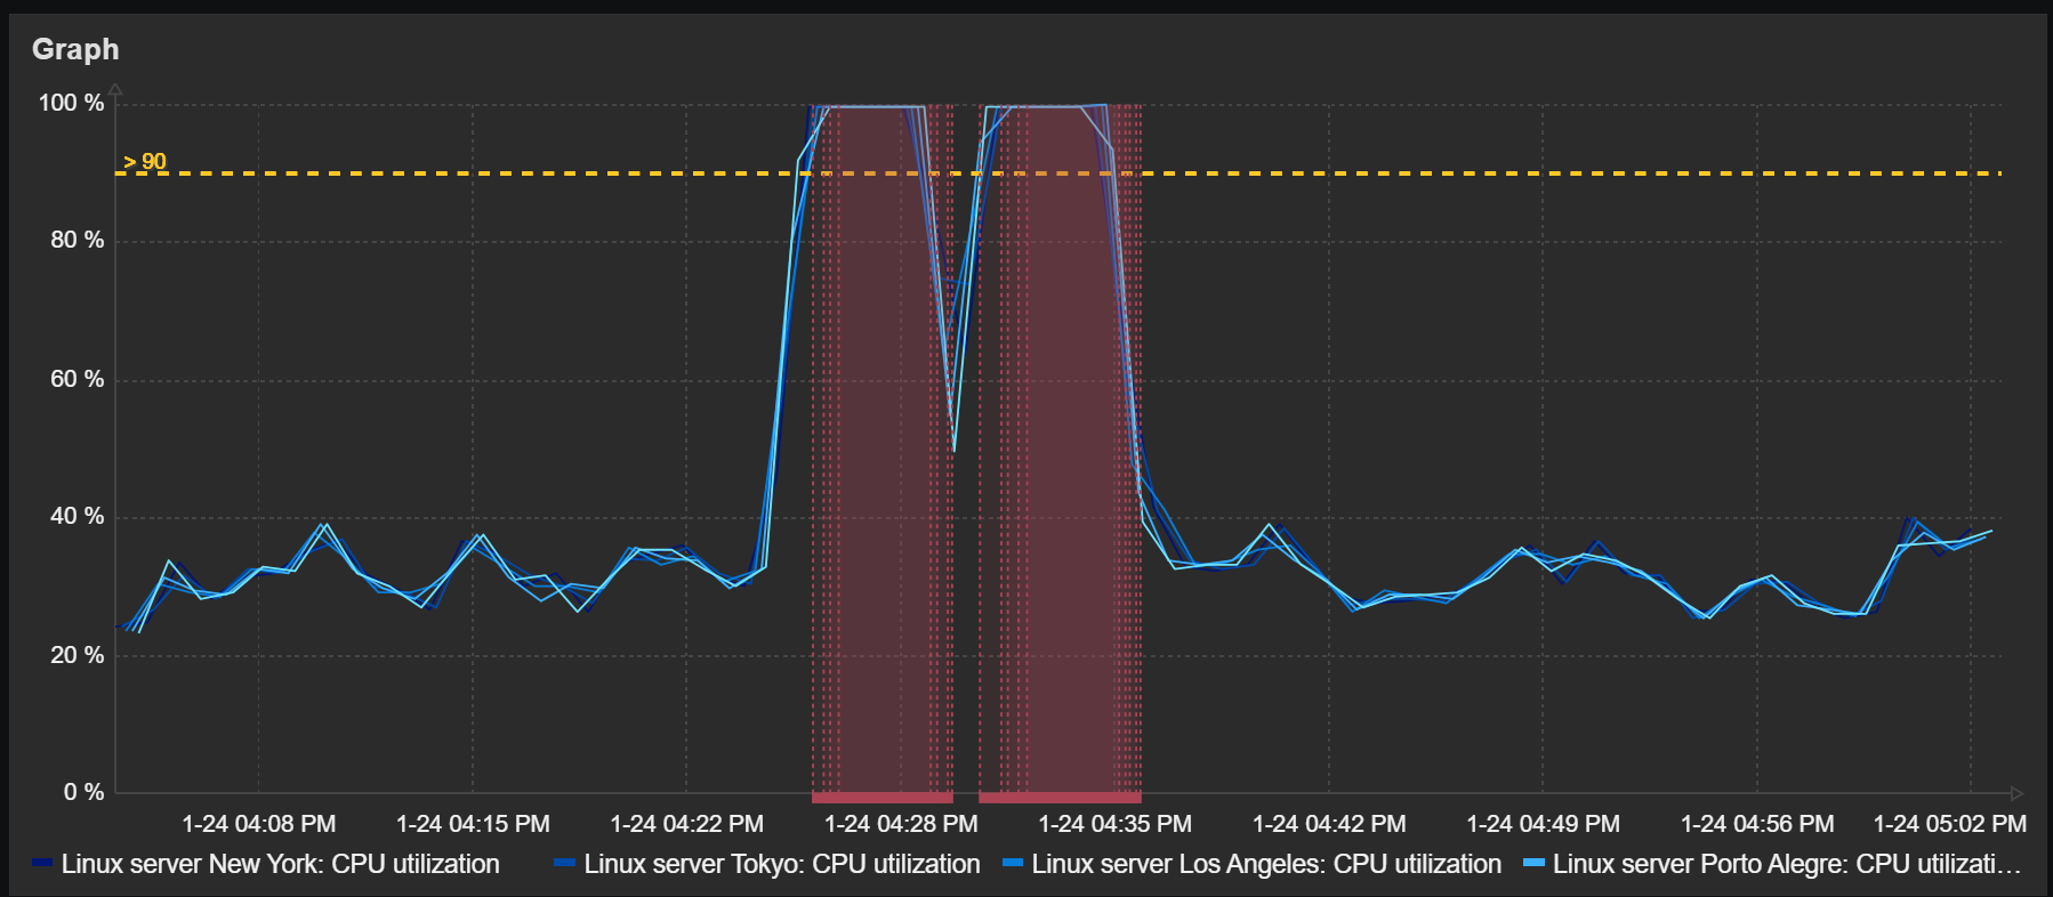
  • Map links now support link indicators based on item value thresholds
  • Map element icons can now be ordered when placed on top of one another
Item value thresholds can be defined for link indicators
  • Map element icons can now be ordered when placed on top of one another
  • Host group map elements will now take into account nested host groups when displaying host group-related information
  • Map link and element labels can now be hidden and only displayed on mouse hover
Map elements can be ordered on top of each other

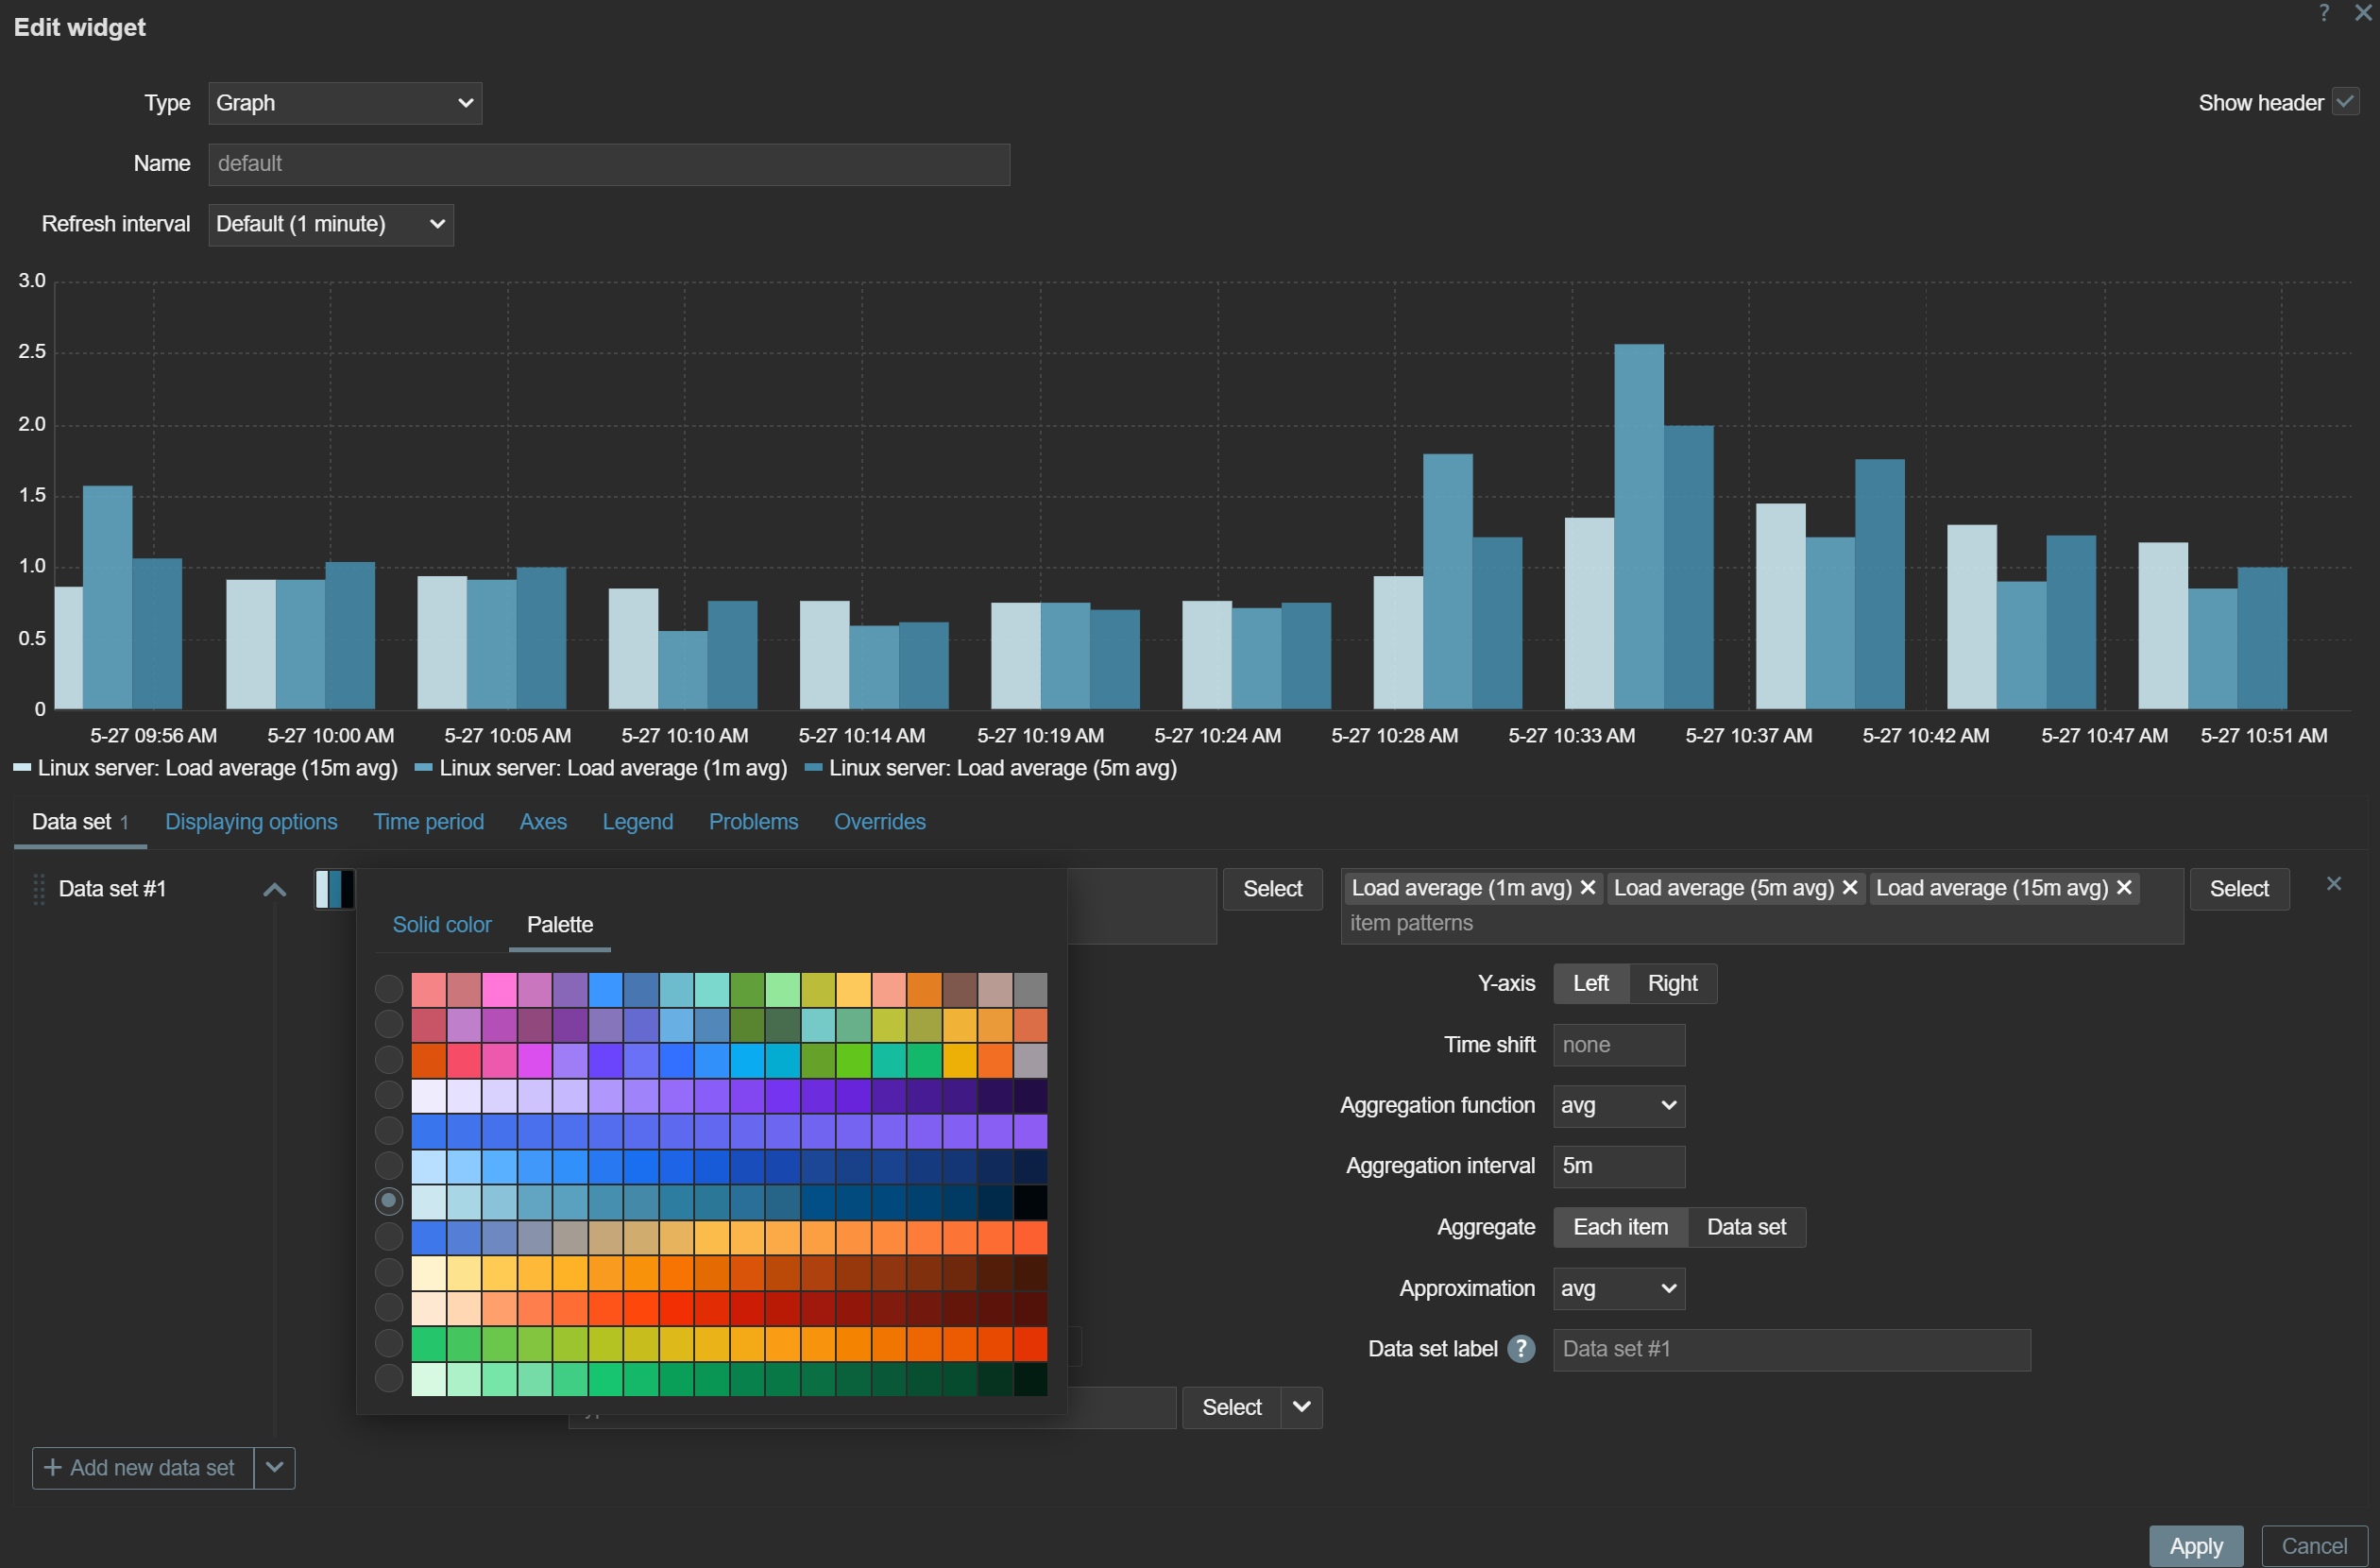
Dashboard improvements

Zabbix 7.4 introduces multiple dashboard improvements to facilitate faster and smoother dashboard configuration.

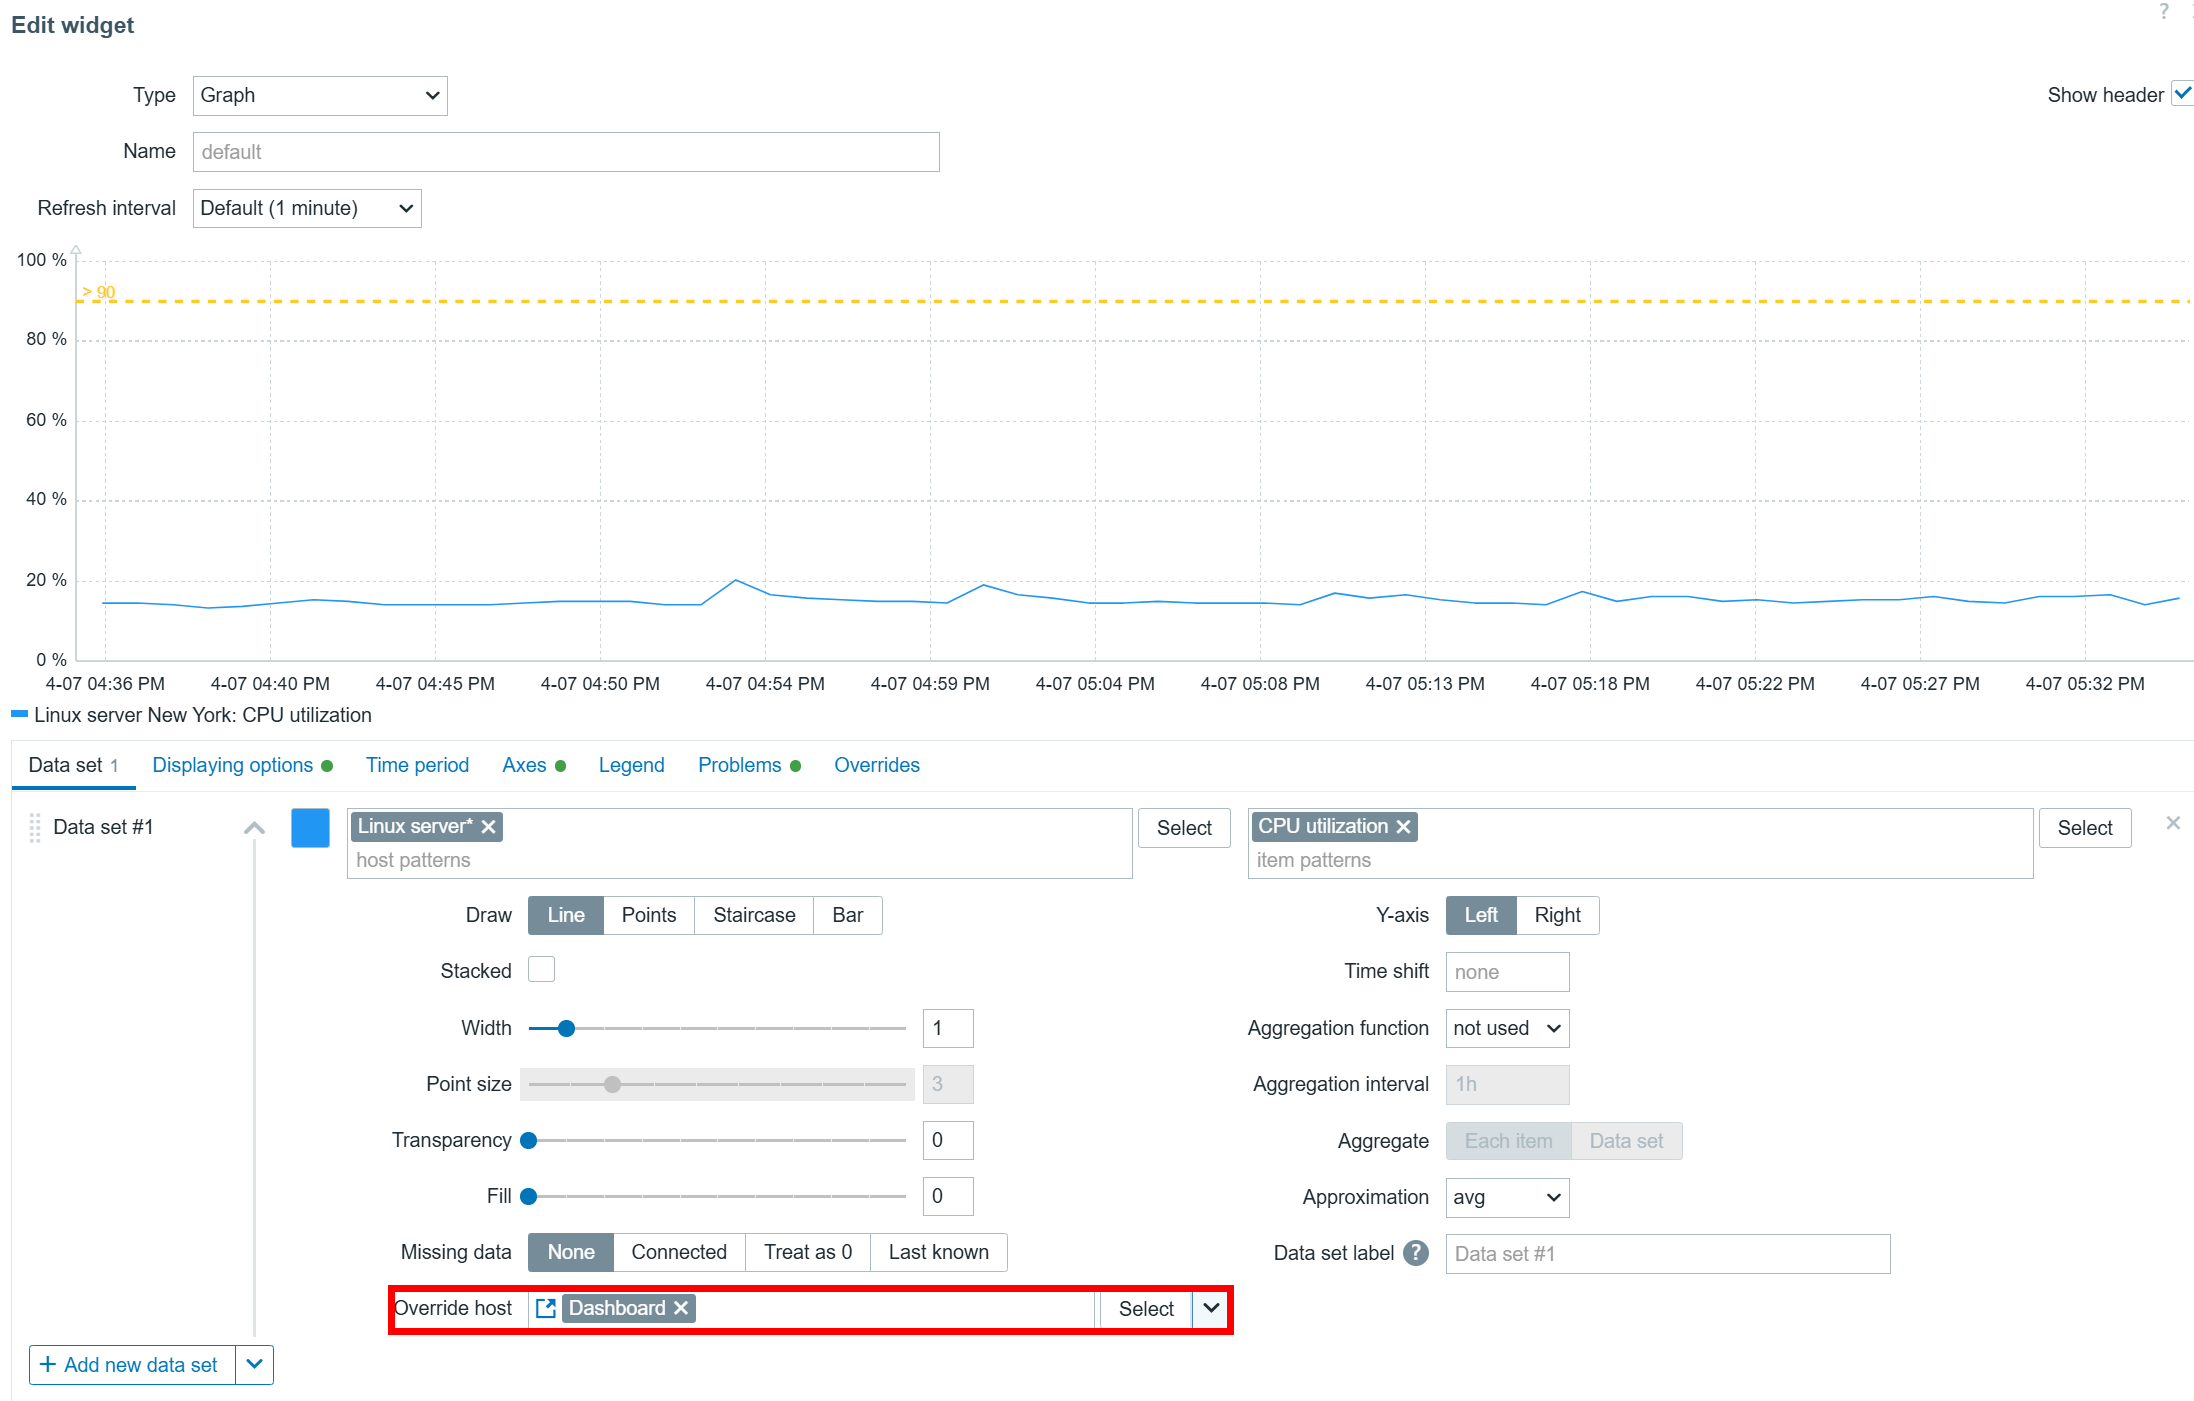
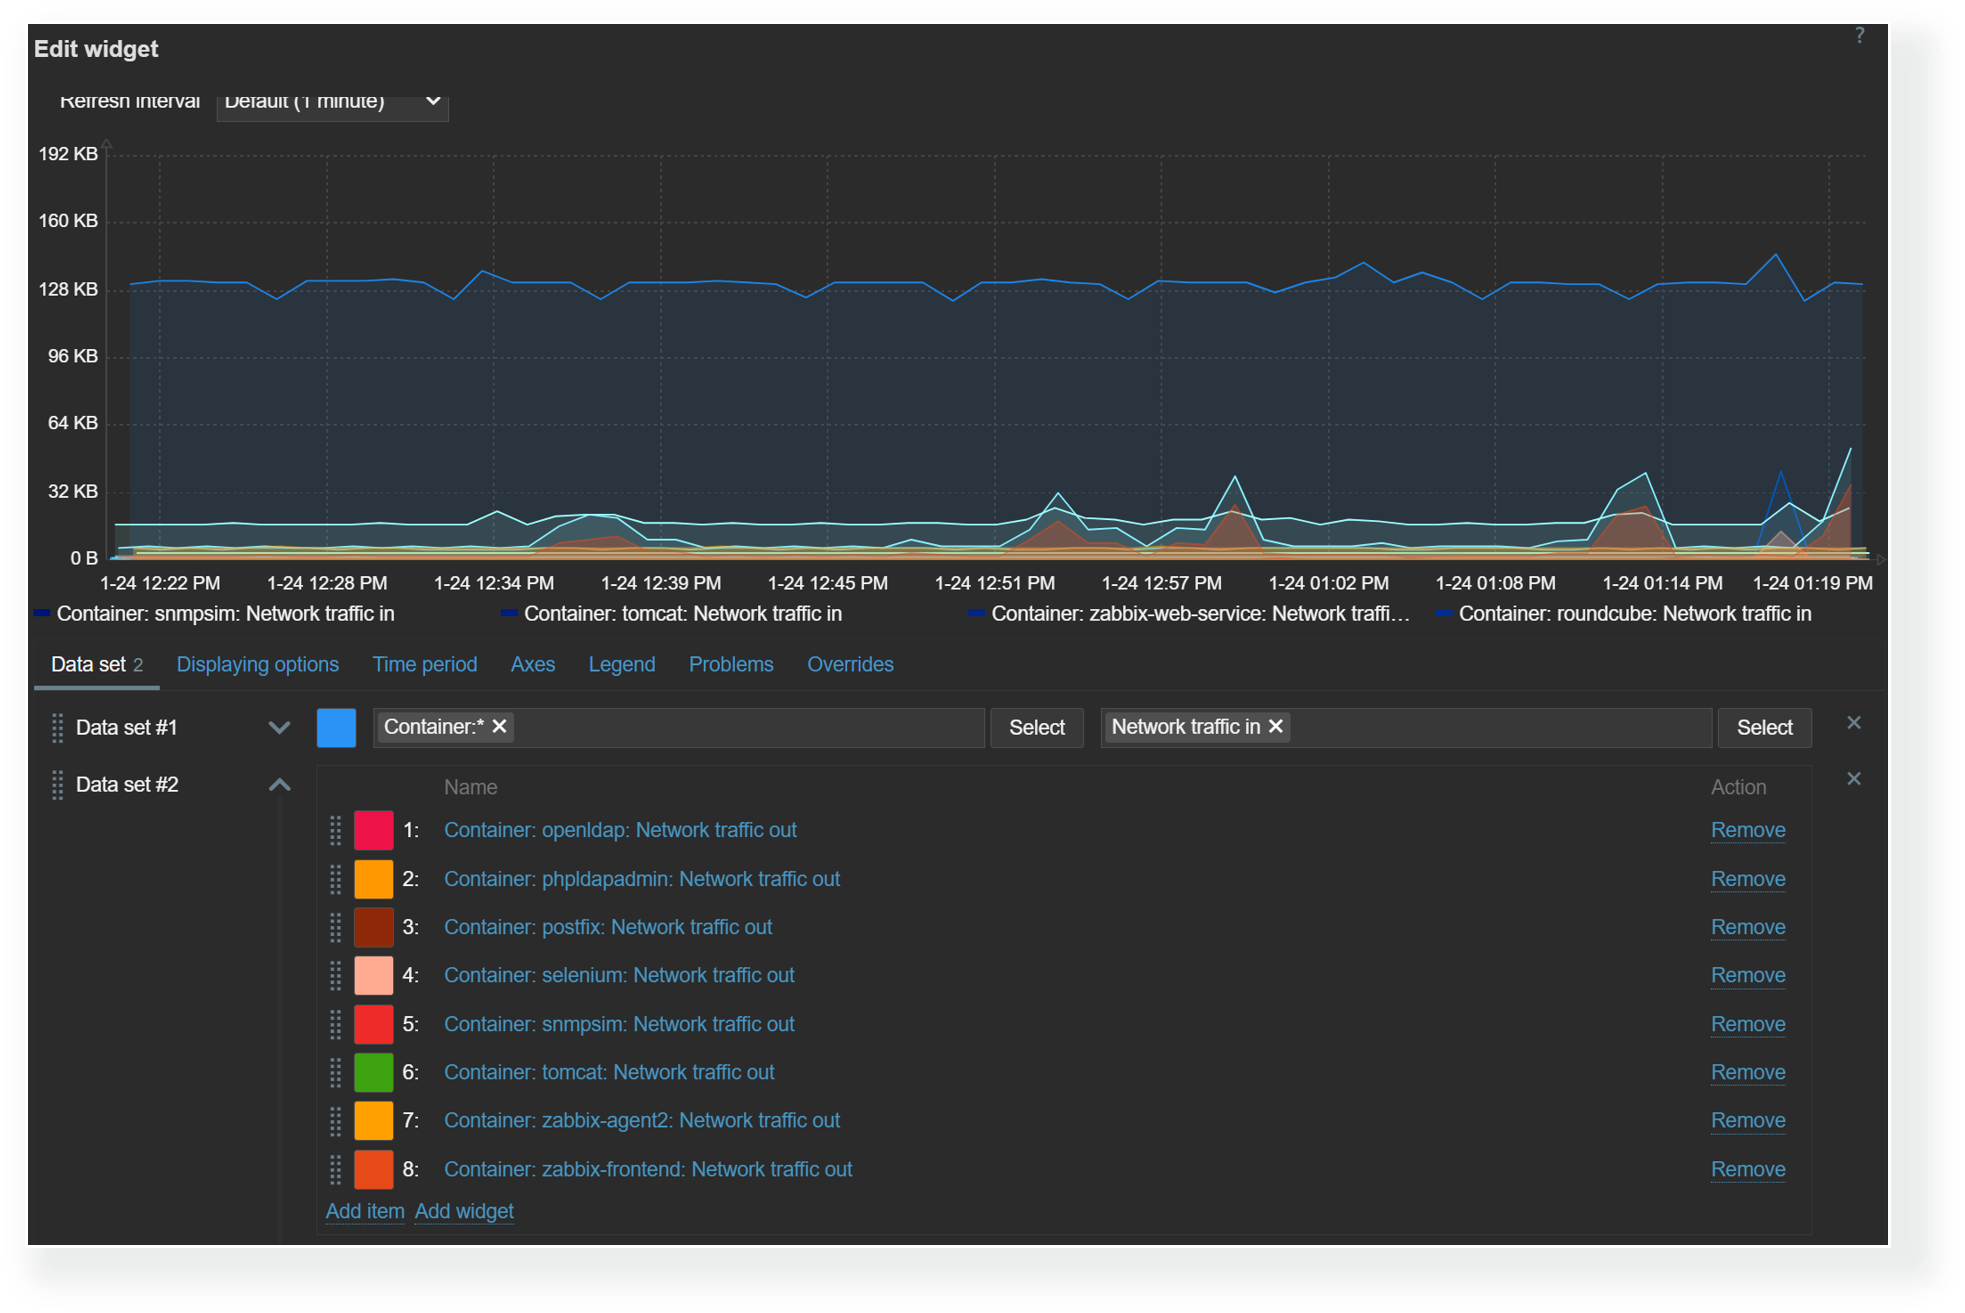
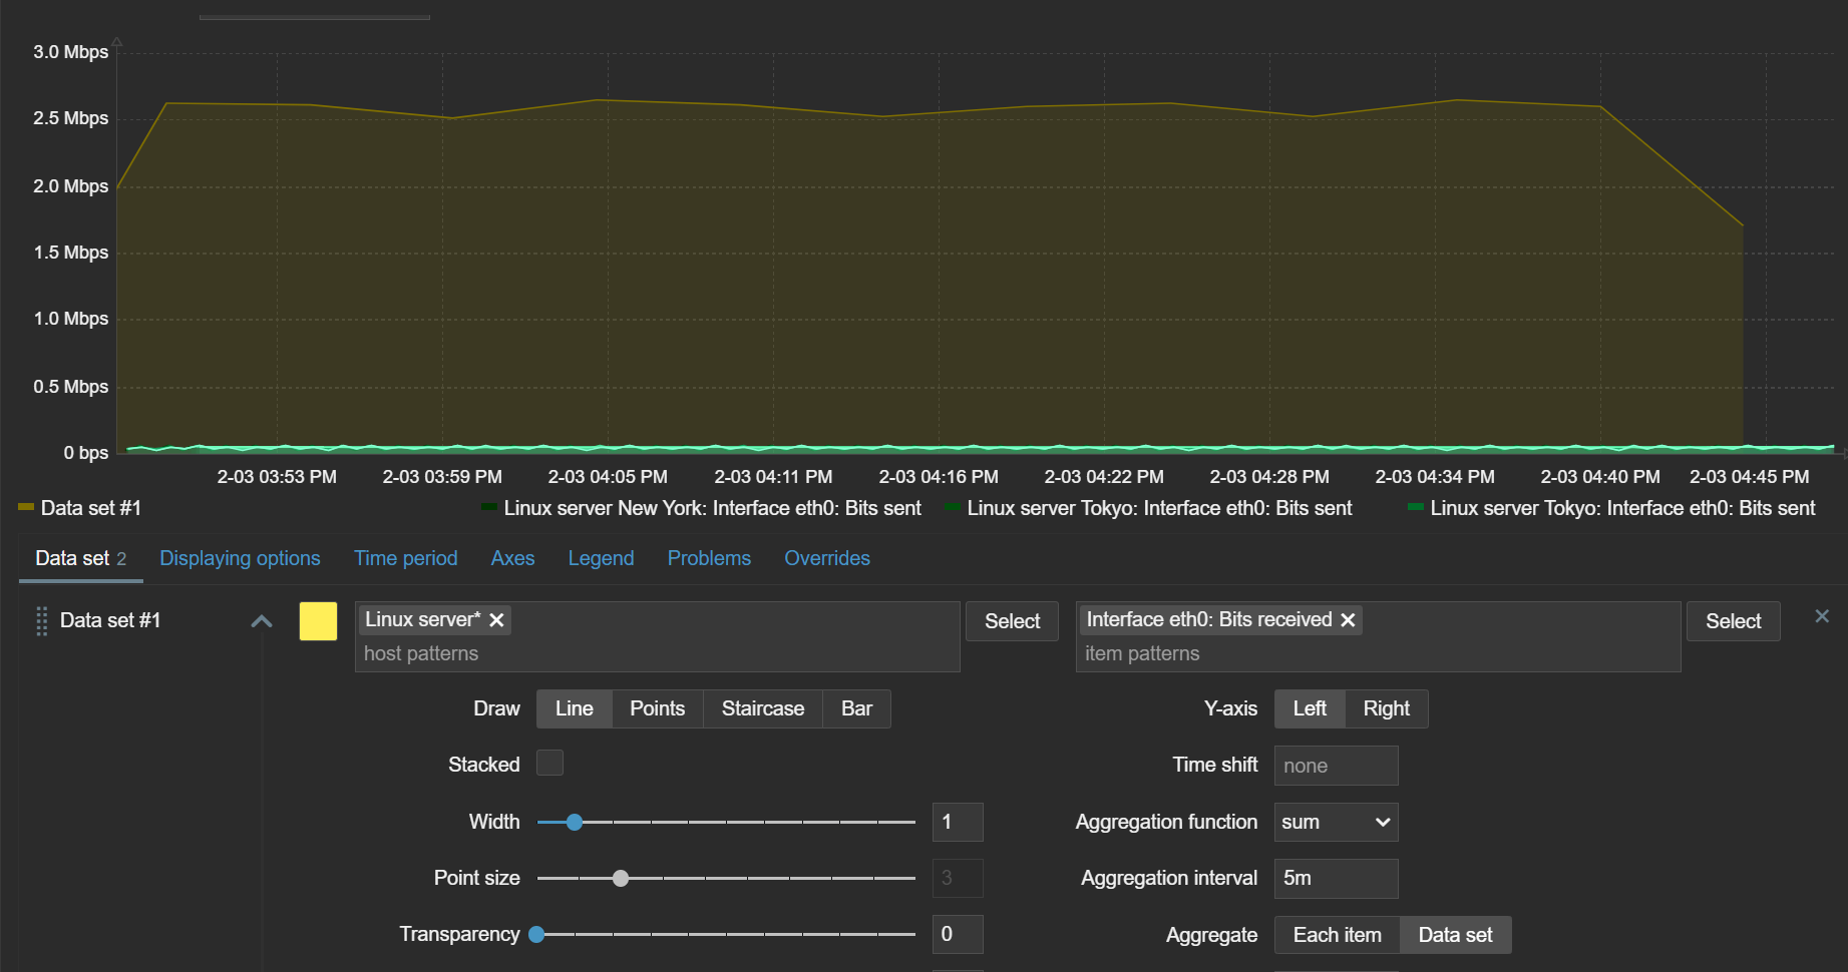
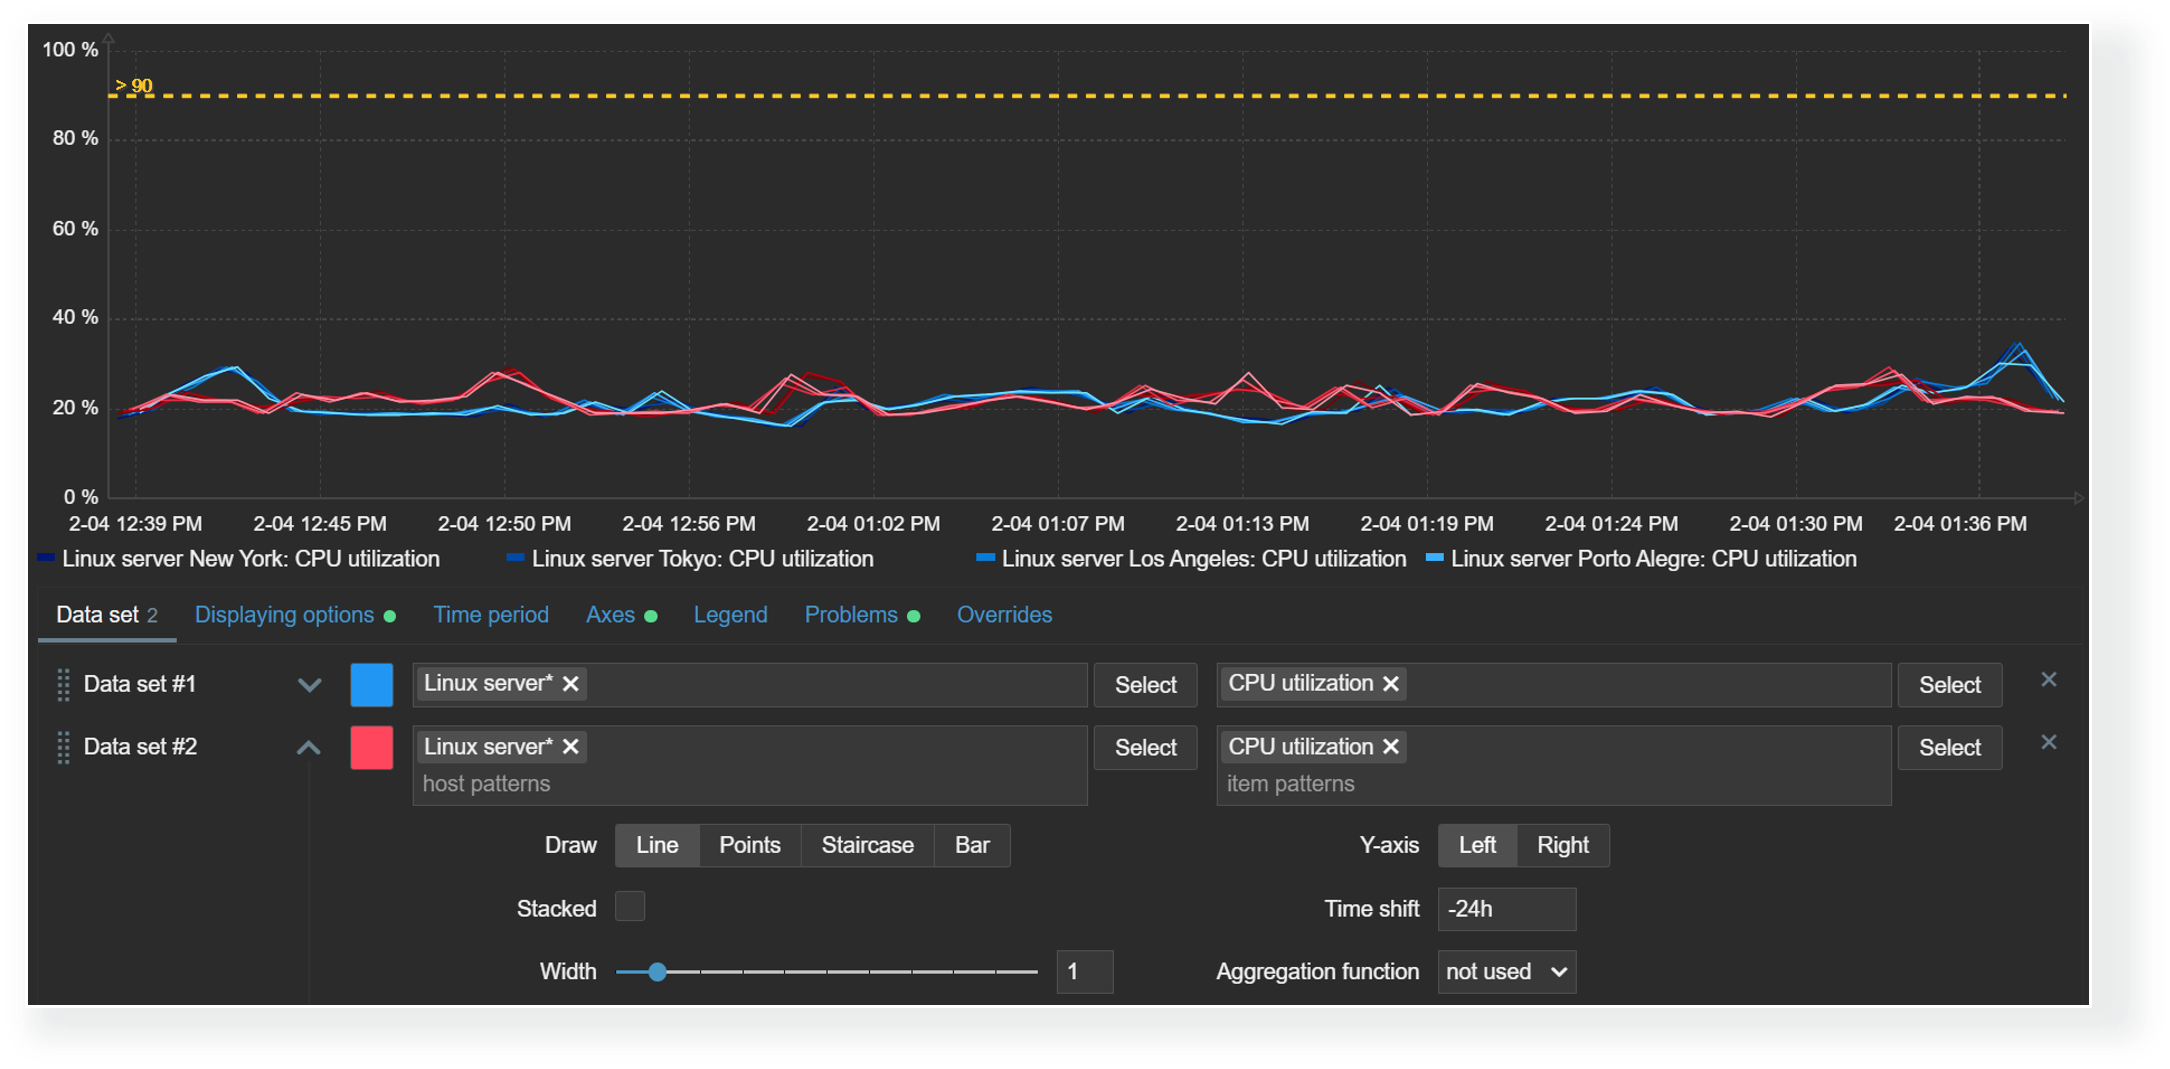
The color picker in graph and pie chart widgets has been extended with the new palette color scheme in addition to the existing solid color scheme. Users can choose from the available palette color schemes. The new palette color schemes display the values within a data set in a more distinguishable way, while the existing solid color scheme displays the data set values in shades of the selected color.

The new palette color scheme is available in graph and pie chart widgets

Widget configuration changes are also displayed instantly in Zabbix 7.4 – there’s  no need anymore to apply the changes to see them reflected in the widget.

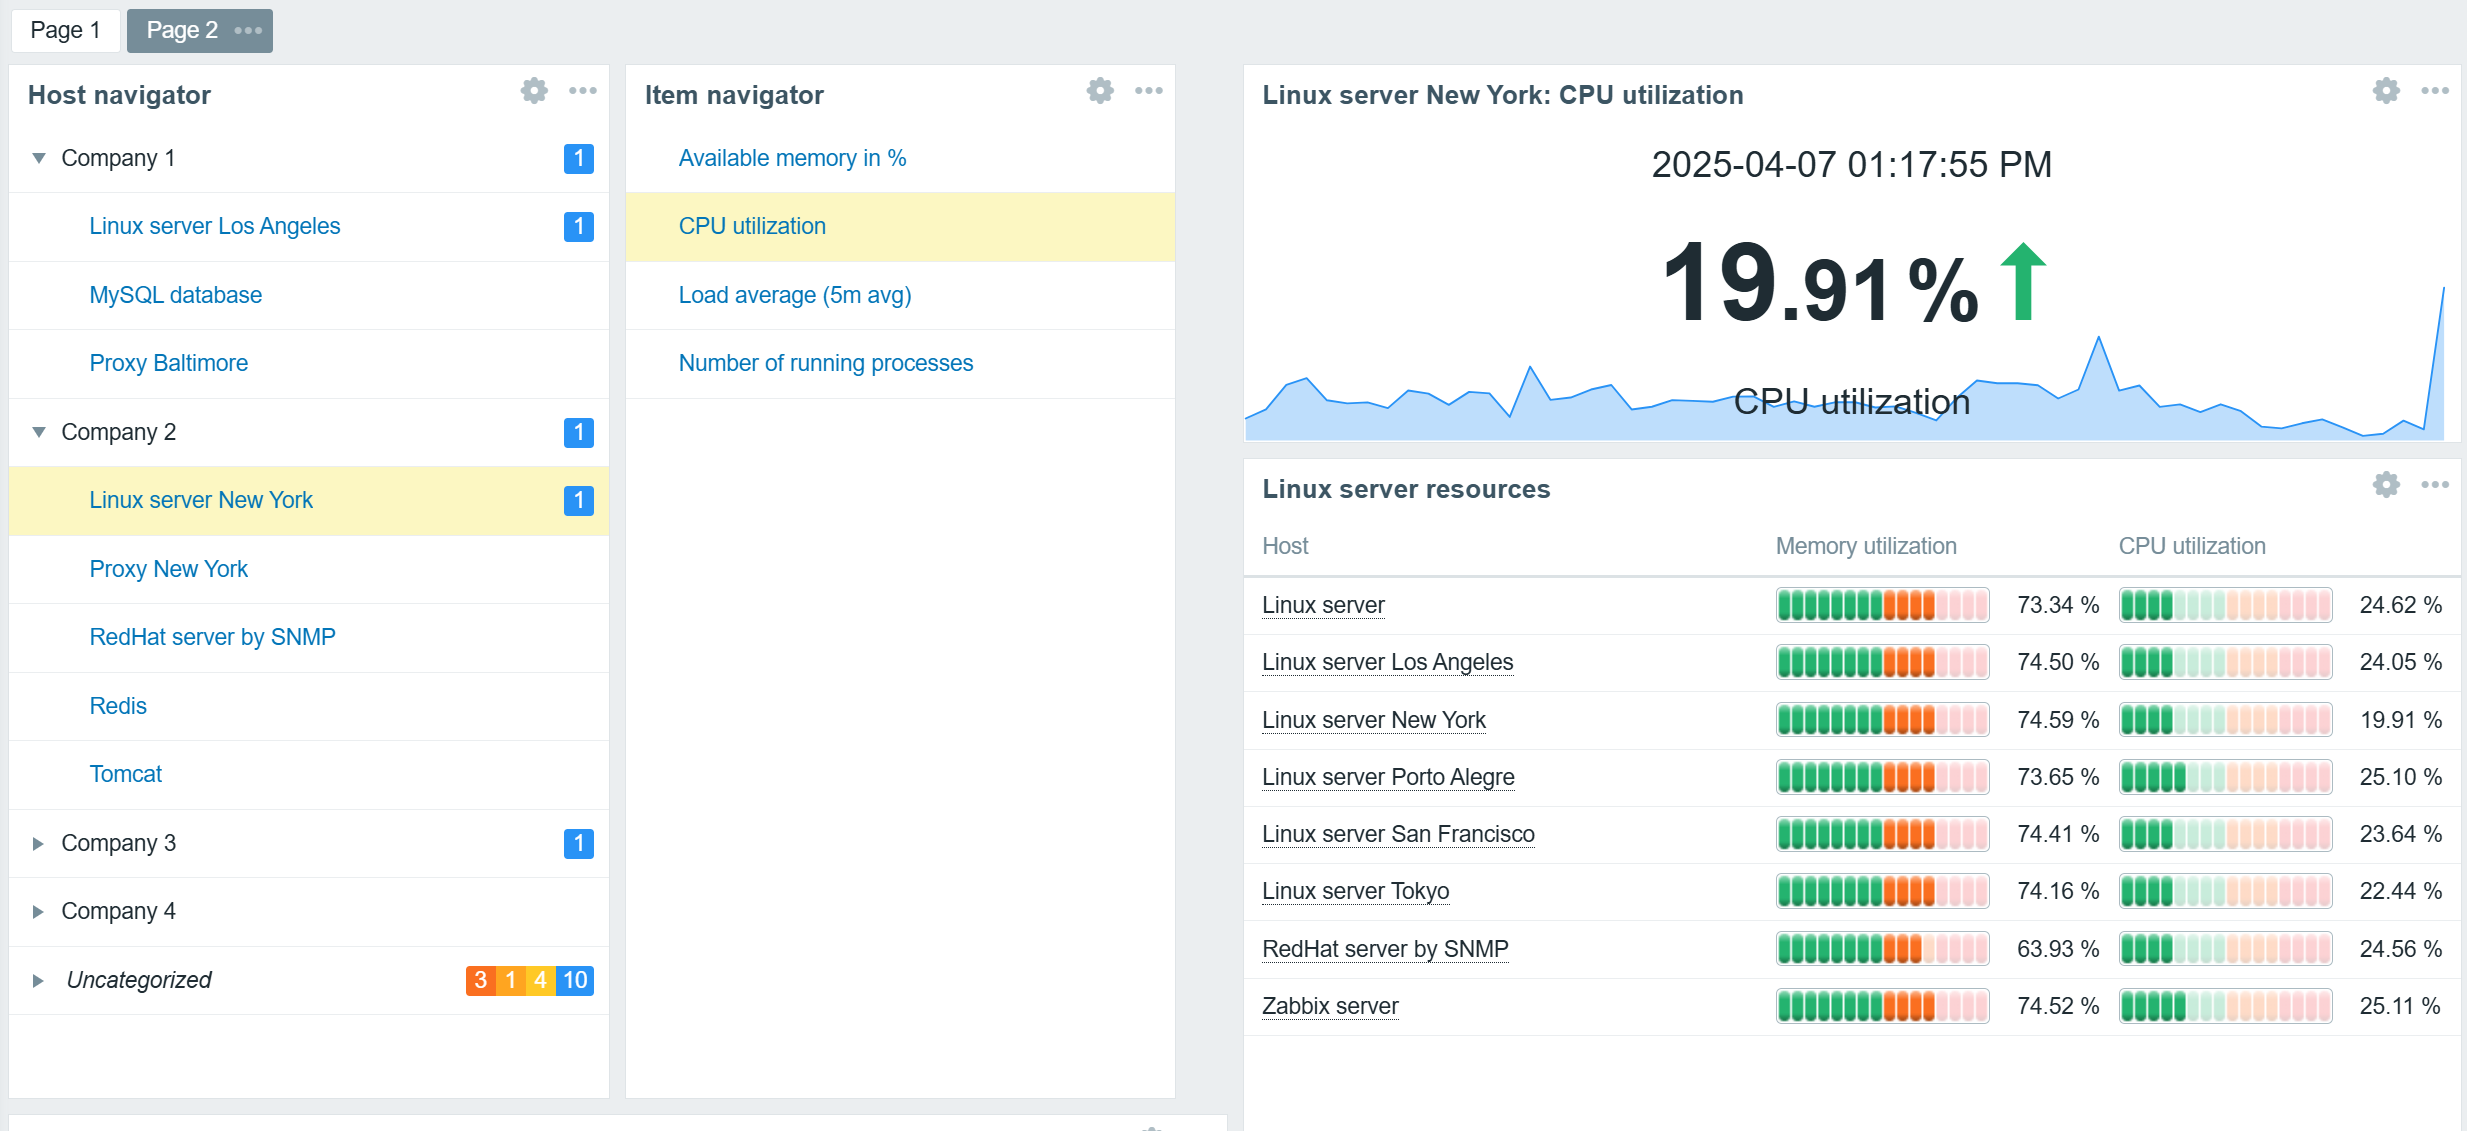
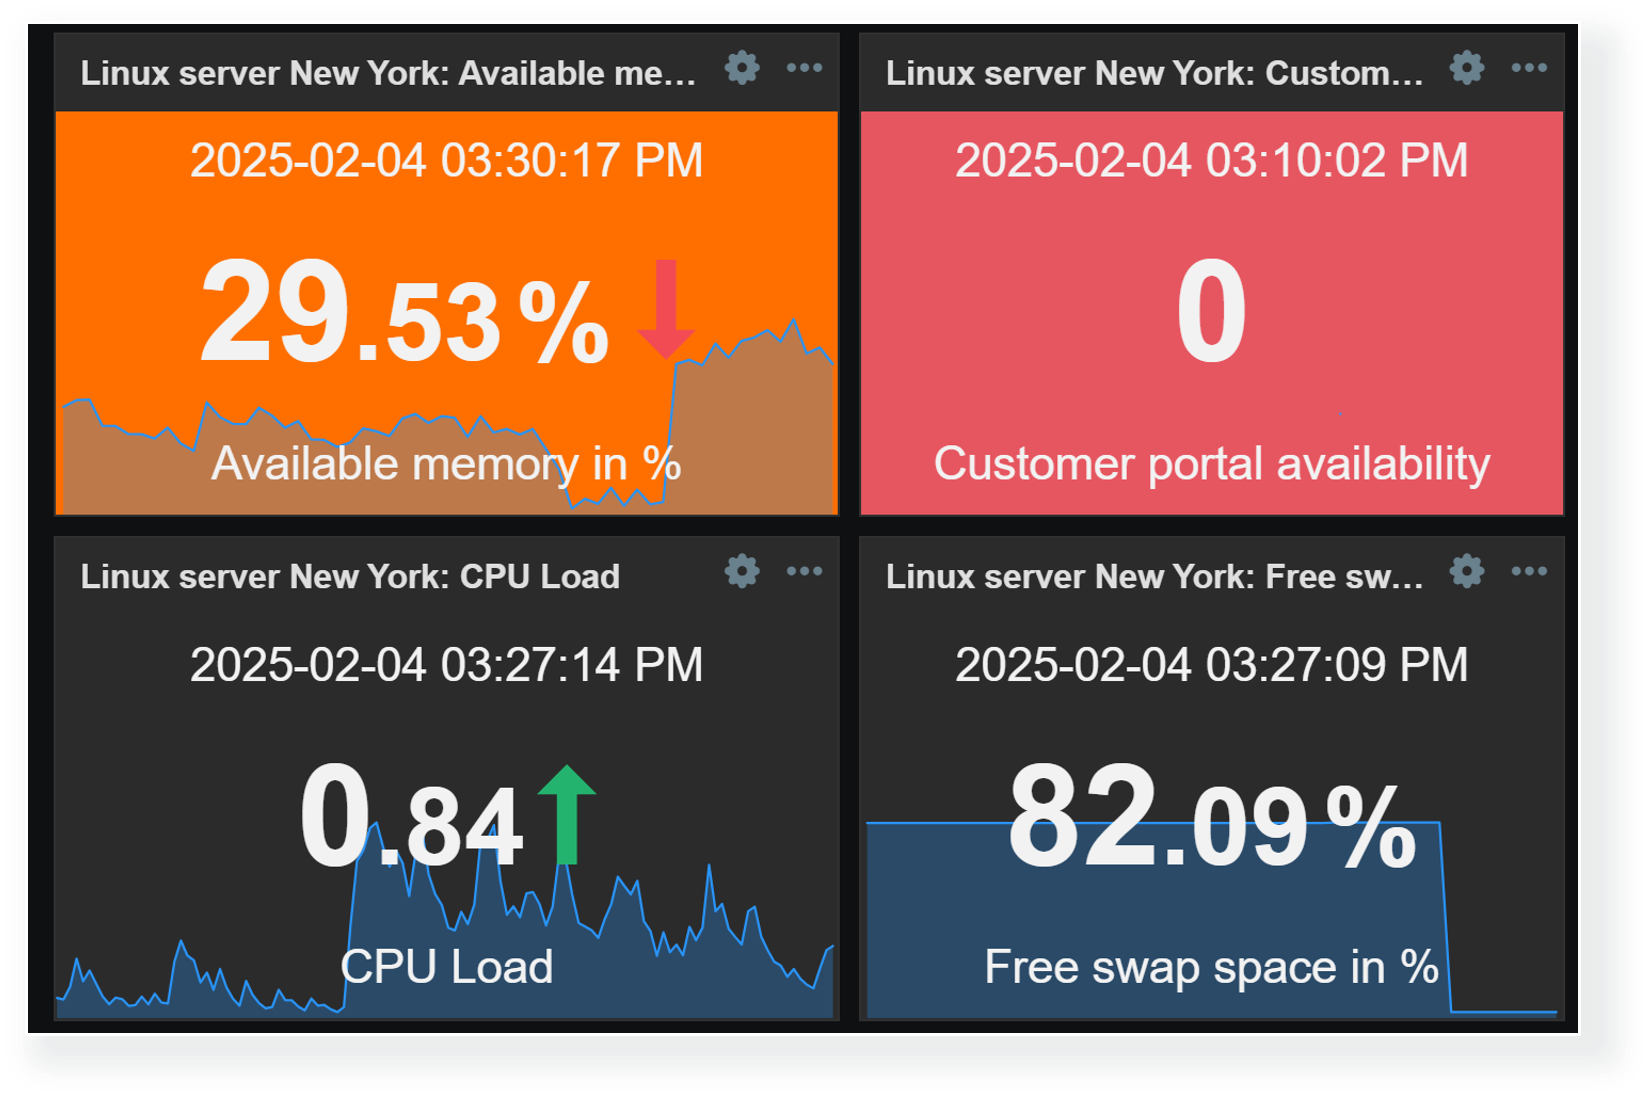
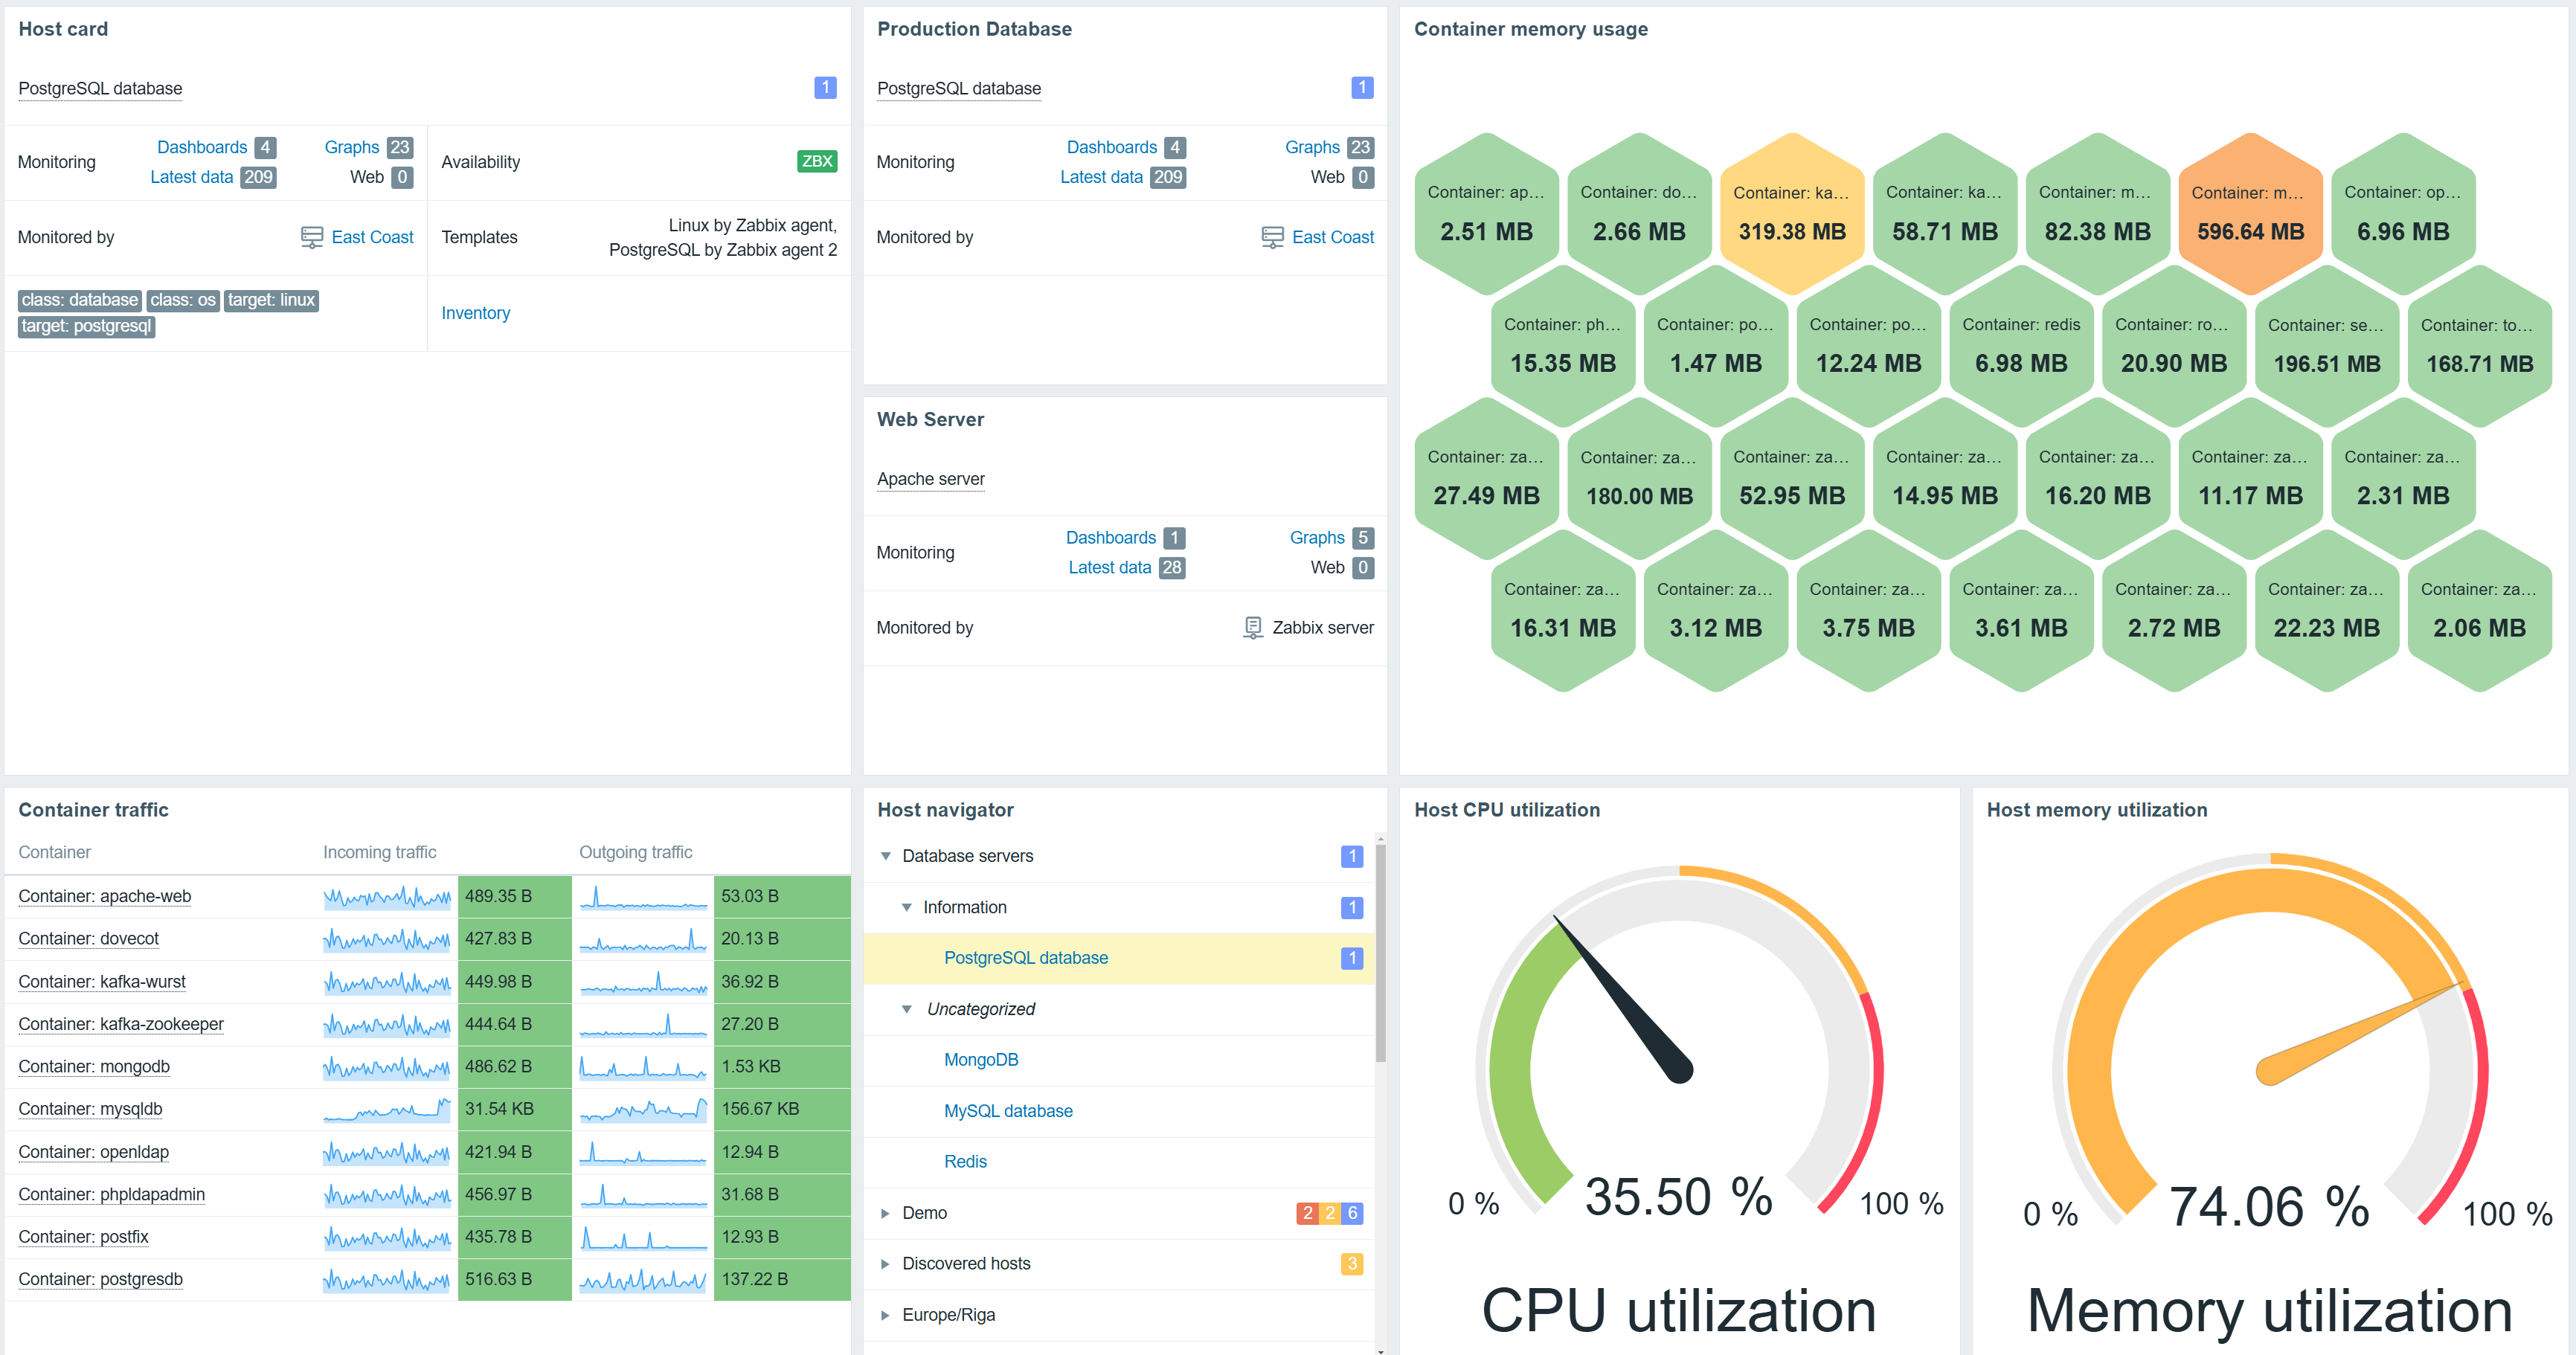
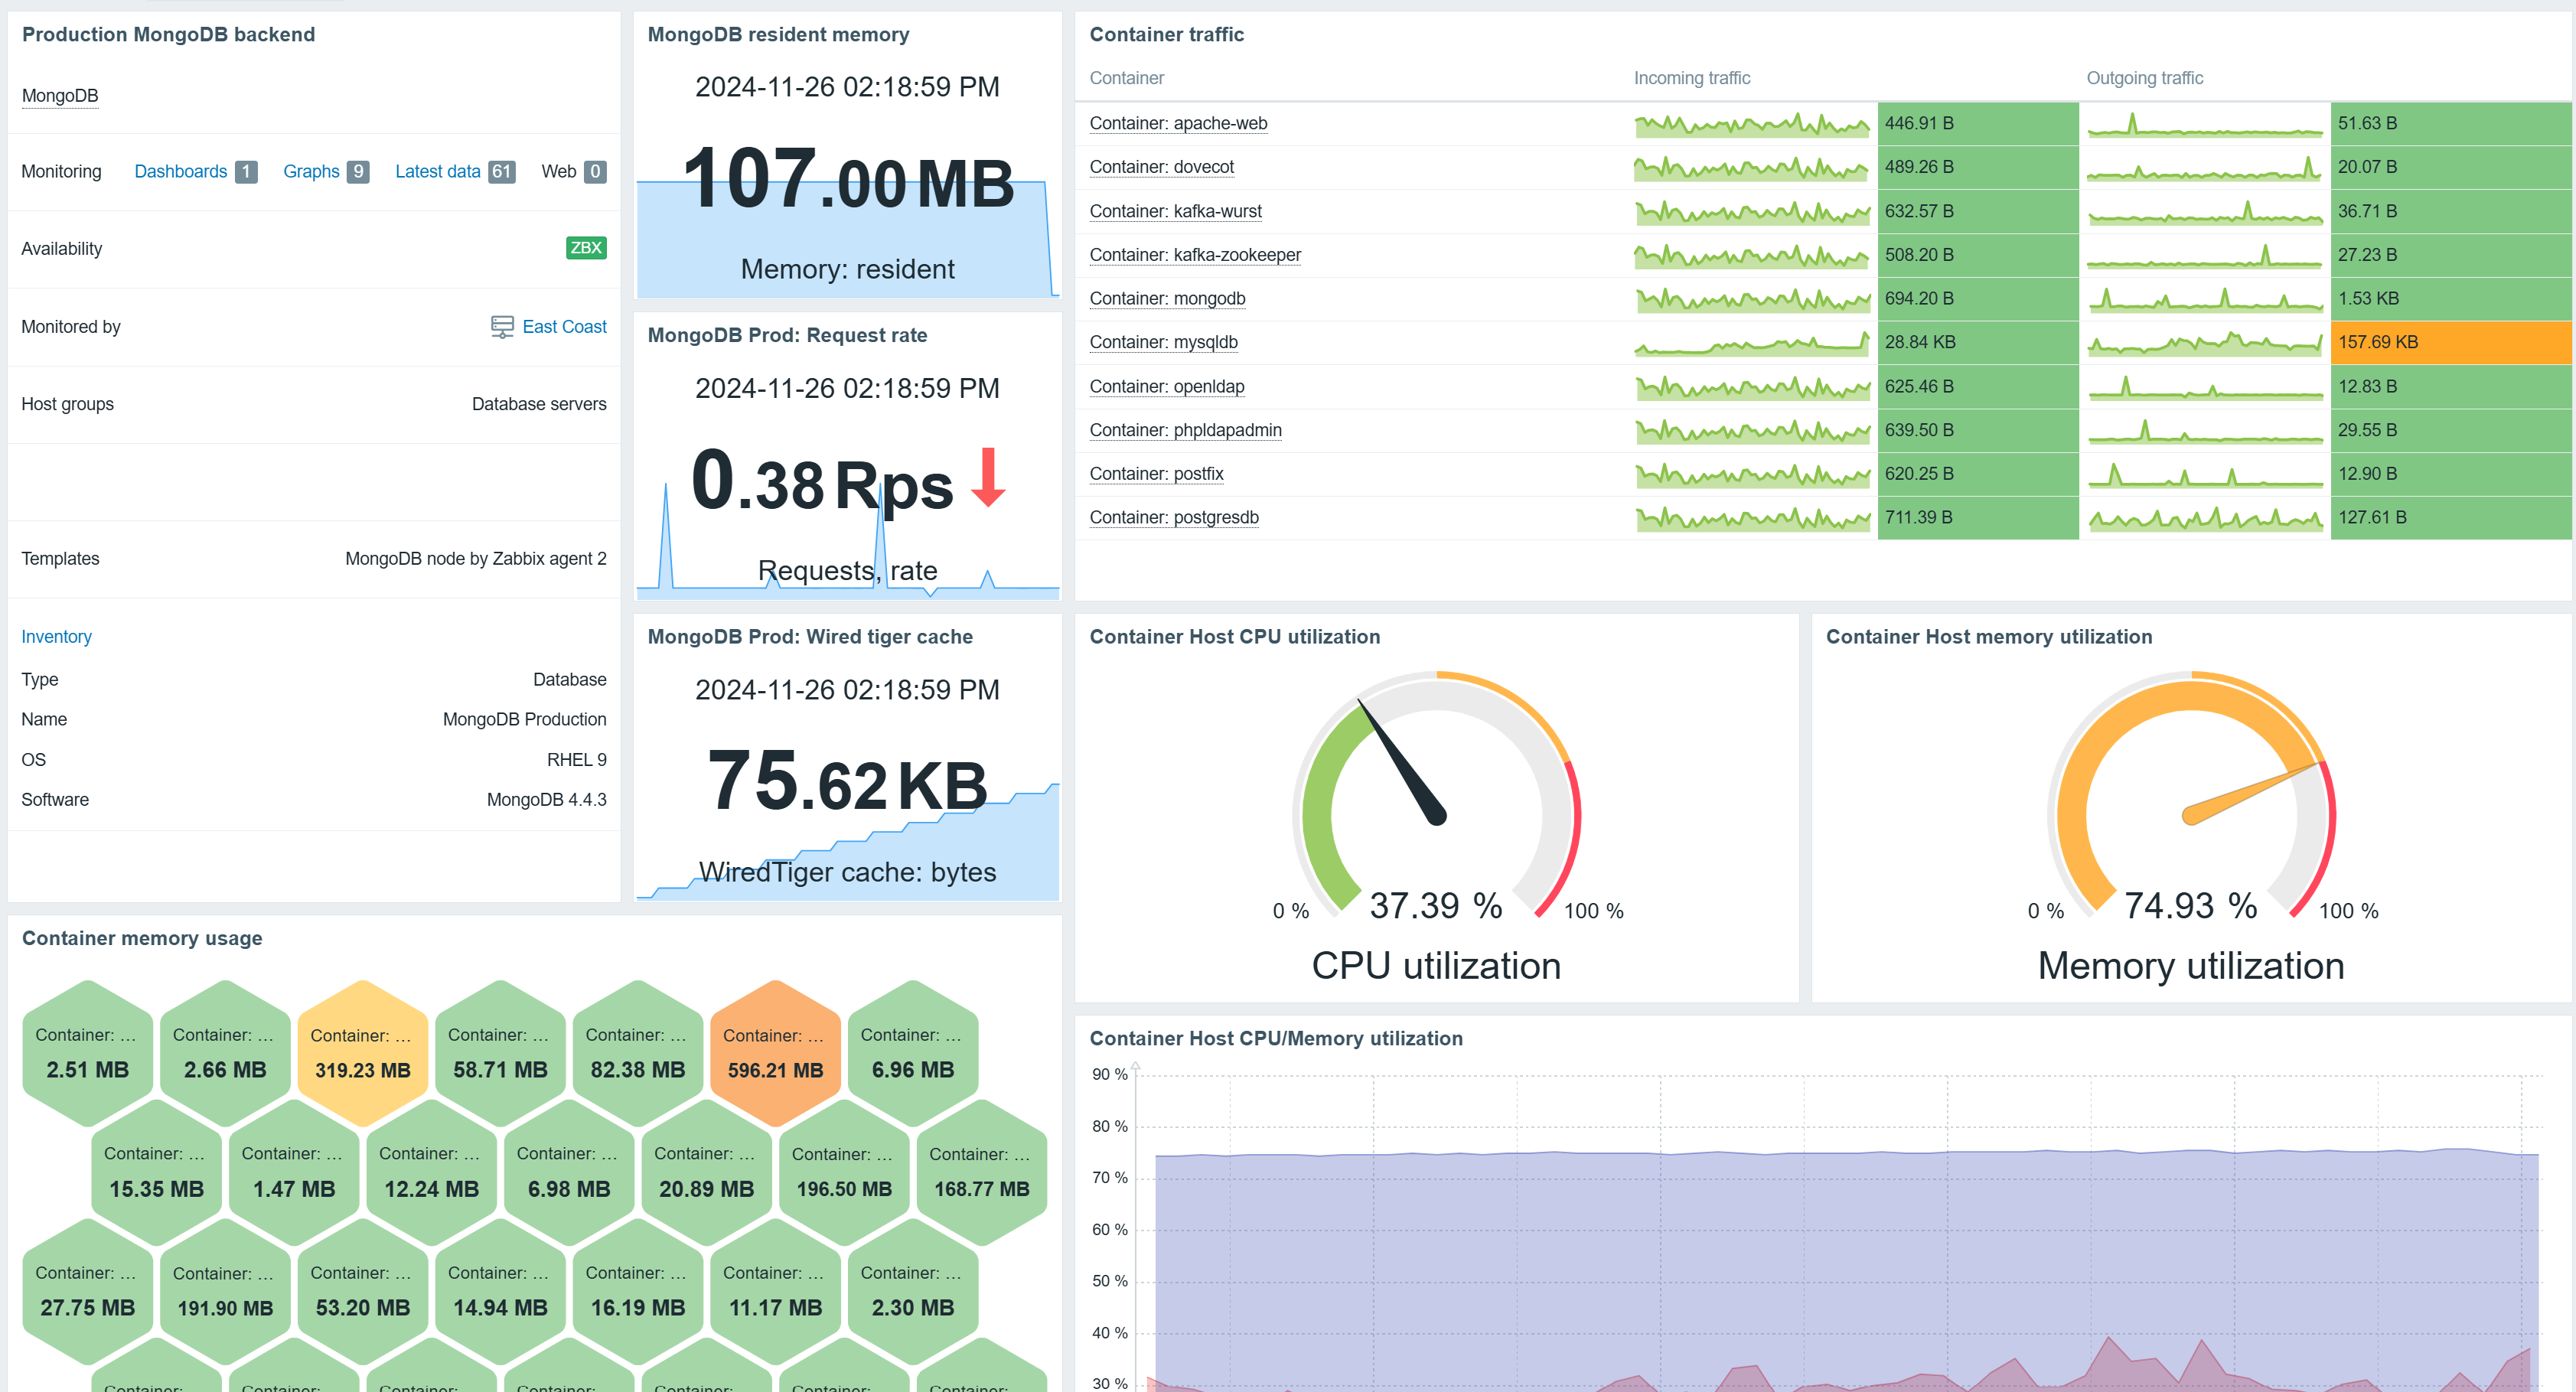
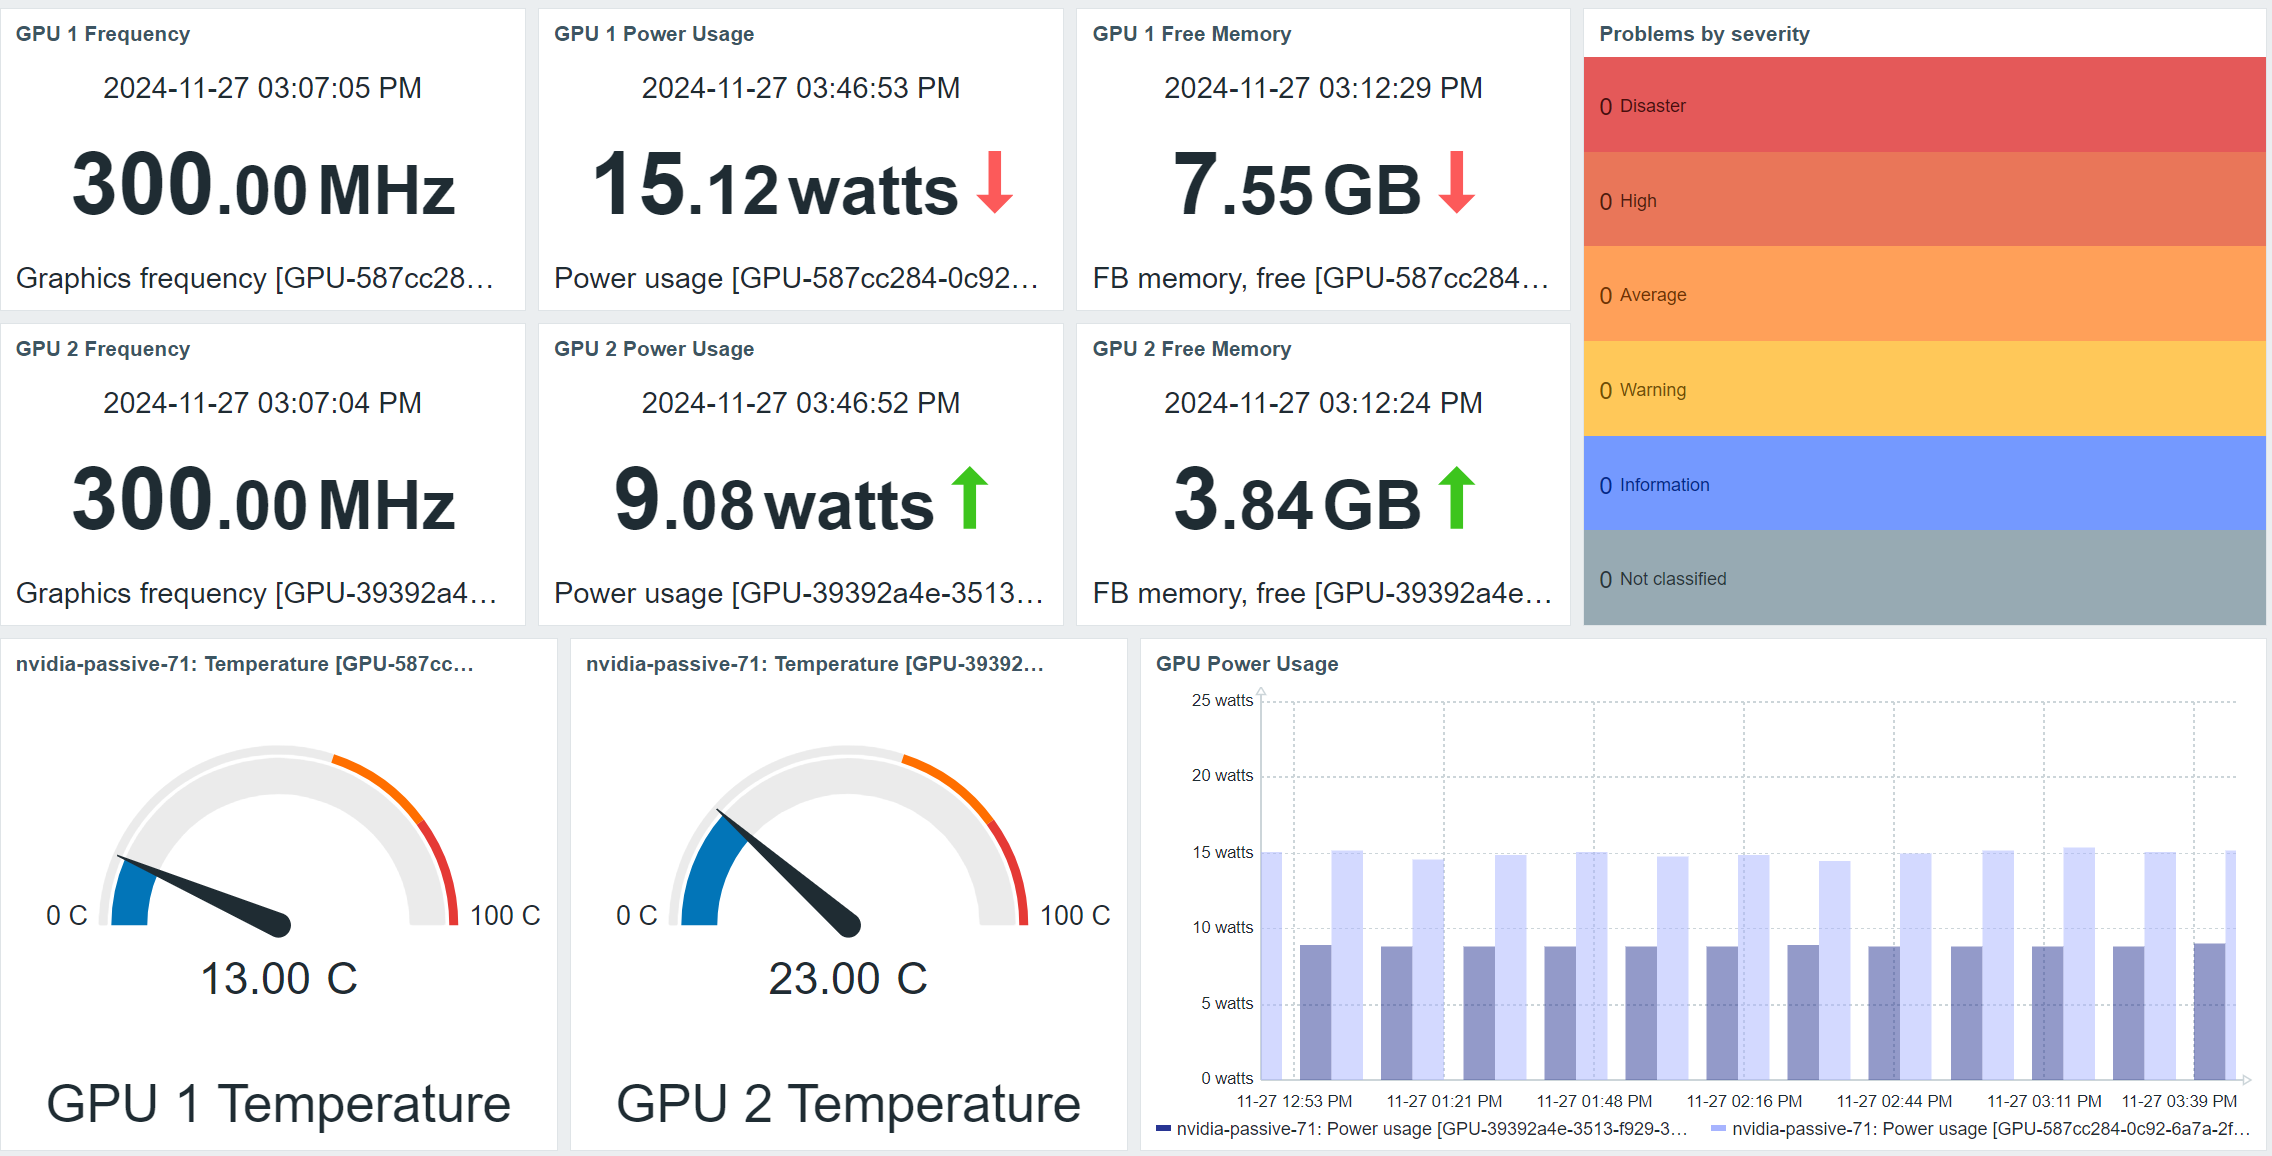
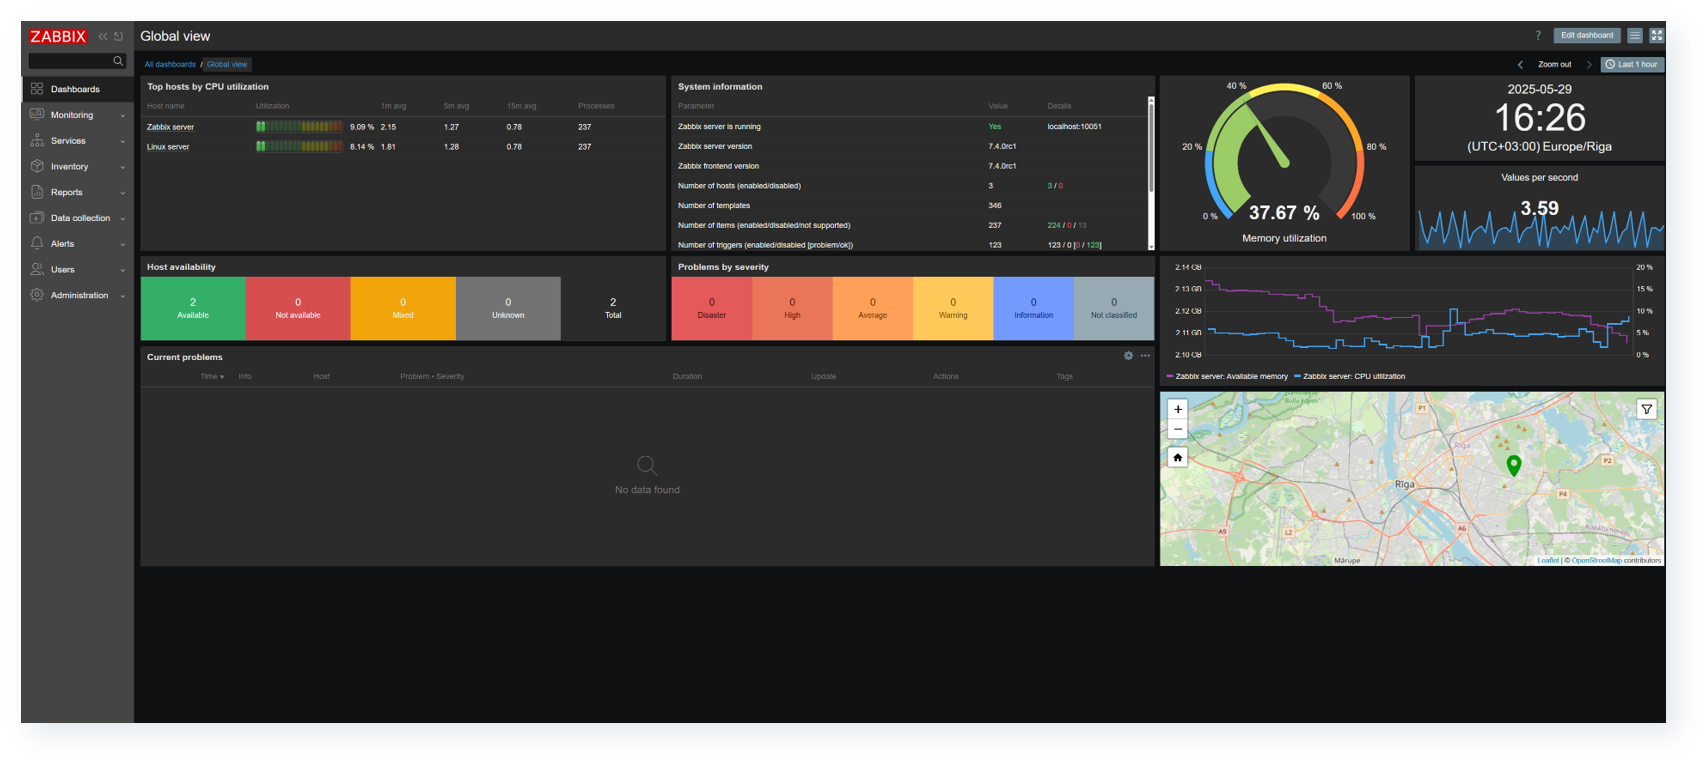
In addition, the default Global view dashboard has received an overhaul and now utilizes the latest Zabbix widgets to provide additional insights about the Zabbix instance.

The default Global view dashboard has received an overhaul

Other changes in Zabbix 7.4

Multiple smaller fixes have been introduced in Zabbix 7.4, such as new history functions, new macros, security fixes, and more:

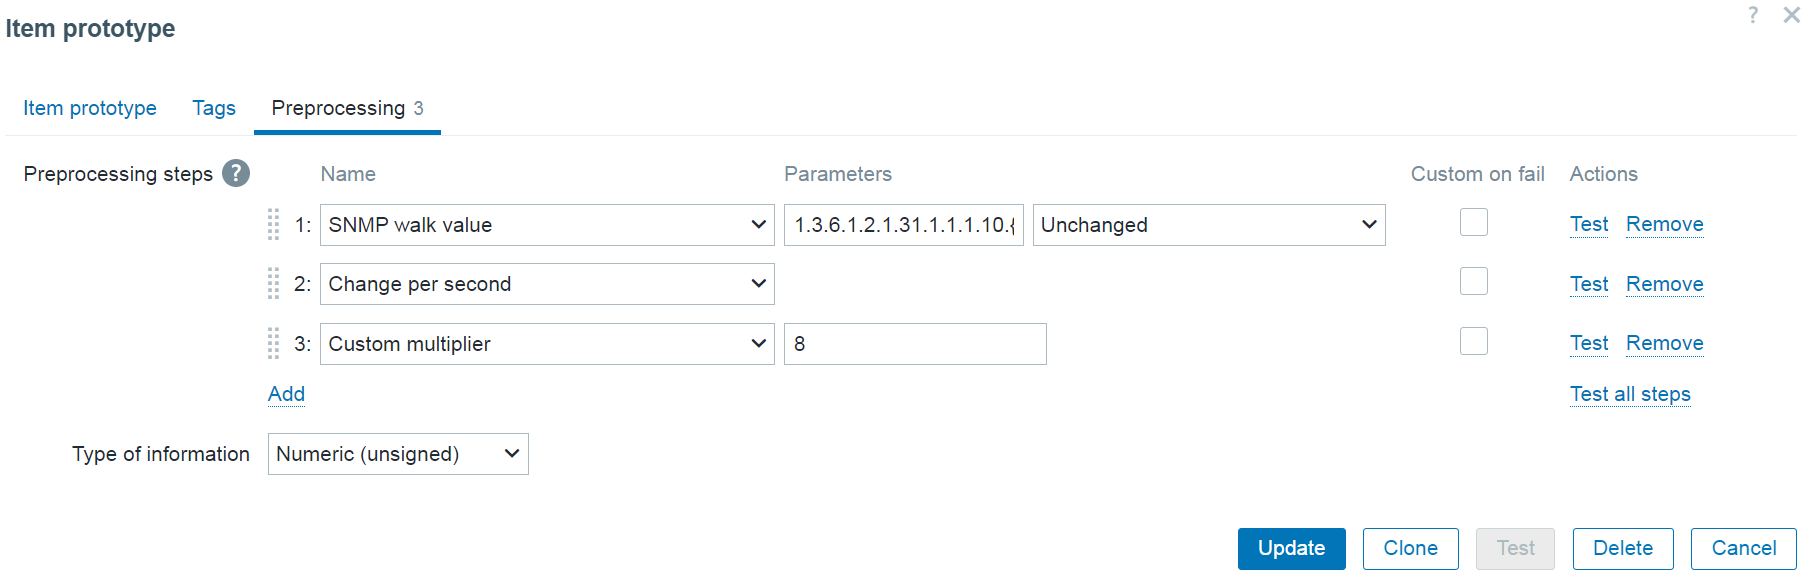
  • Preprocessing results can now be copied directly to clipboard by using the “Copy to clipboard” button
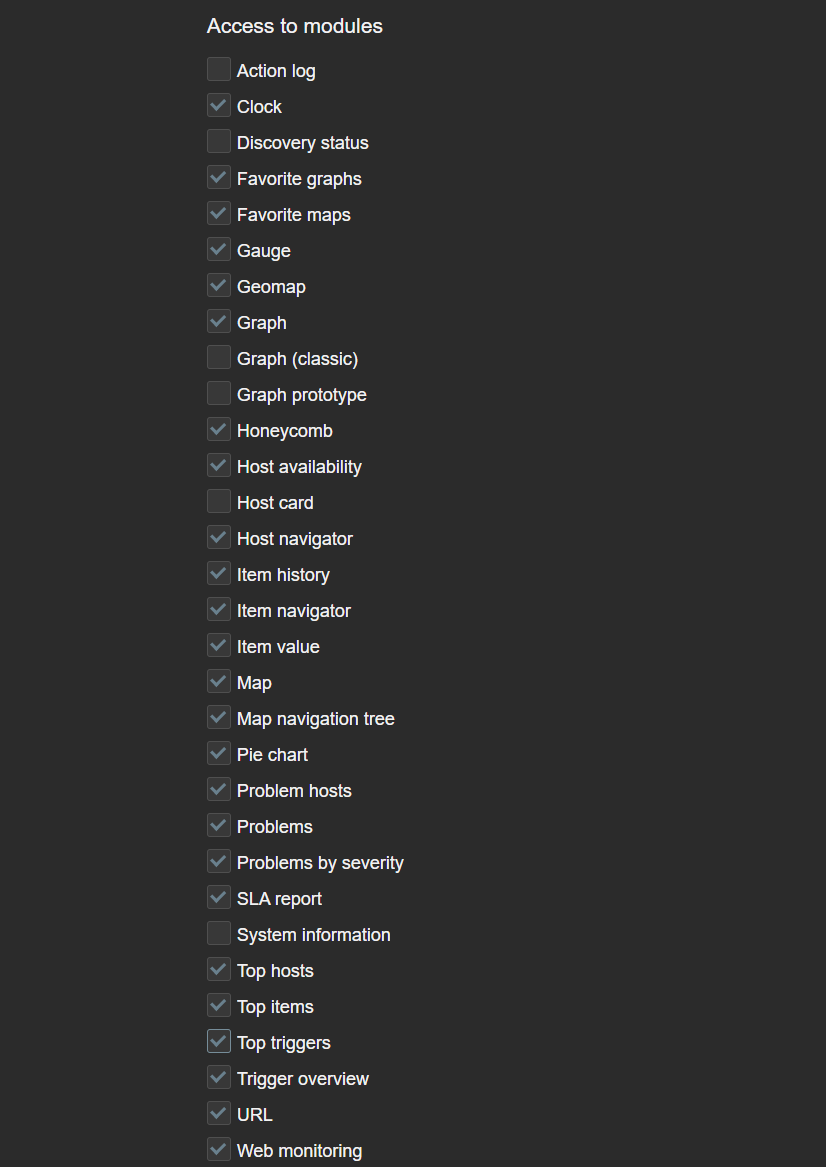
  • All users are now allowed to manage their own media by default. These permissions can now be revoked in user role settings
  • A new Notifications section for customizing notification settings has been added under “User Settings”
  • Vault secret macros can now be resolved by either the Zabbix server or Zabbix proxy
  • A new icmppingretry simple check has been added to monitor host responses to ICMP ping with the ability to modify retries
  • New timestamp tracking history functions have been added
  • Multiple new macros added for item-value time tracking
  • Zabbix server/proxy automatically logs history cache diagnostic information when the history cache is full
  • Disabled items are now immediately removed from the history cache
  • It is now possible to manually clear the history cache for a specific item by its id with the history_cache_clear=target runtime command
  • Added support of Gmail OAuth authentication

New templates and integrations in Zabbix 7.4

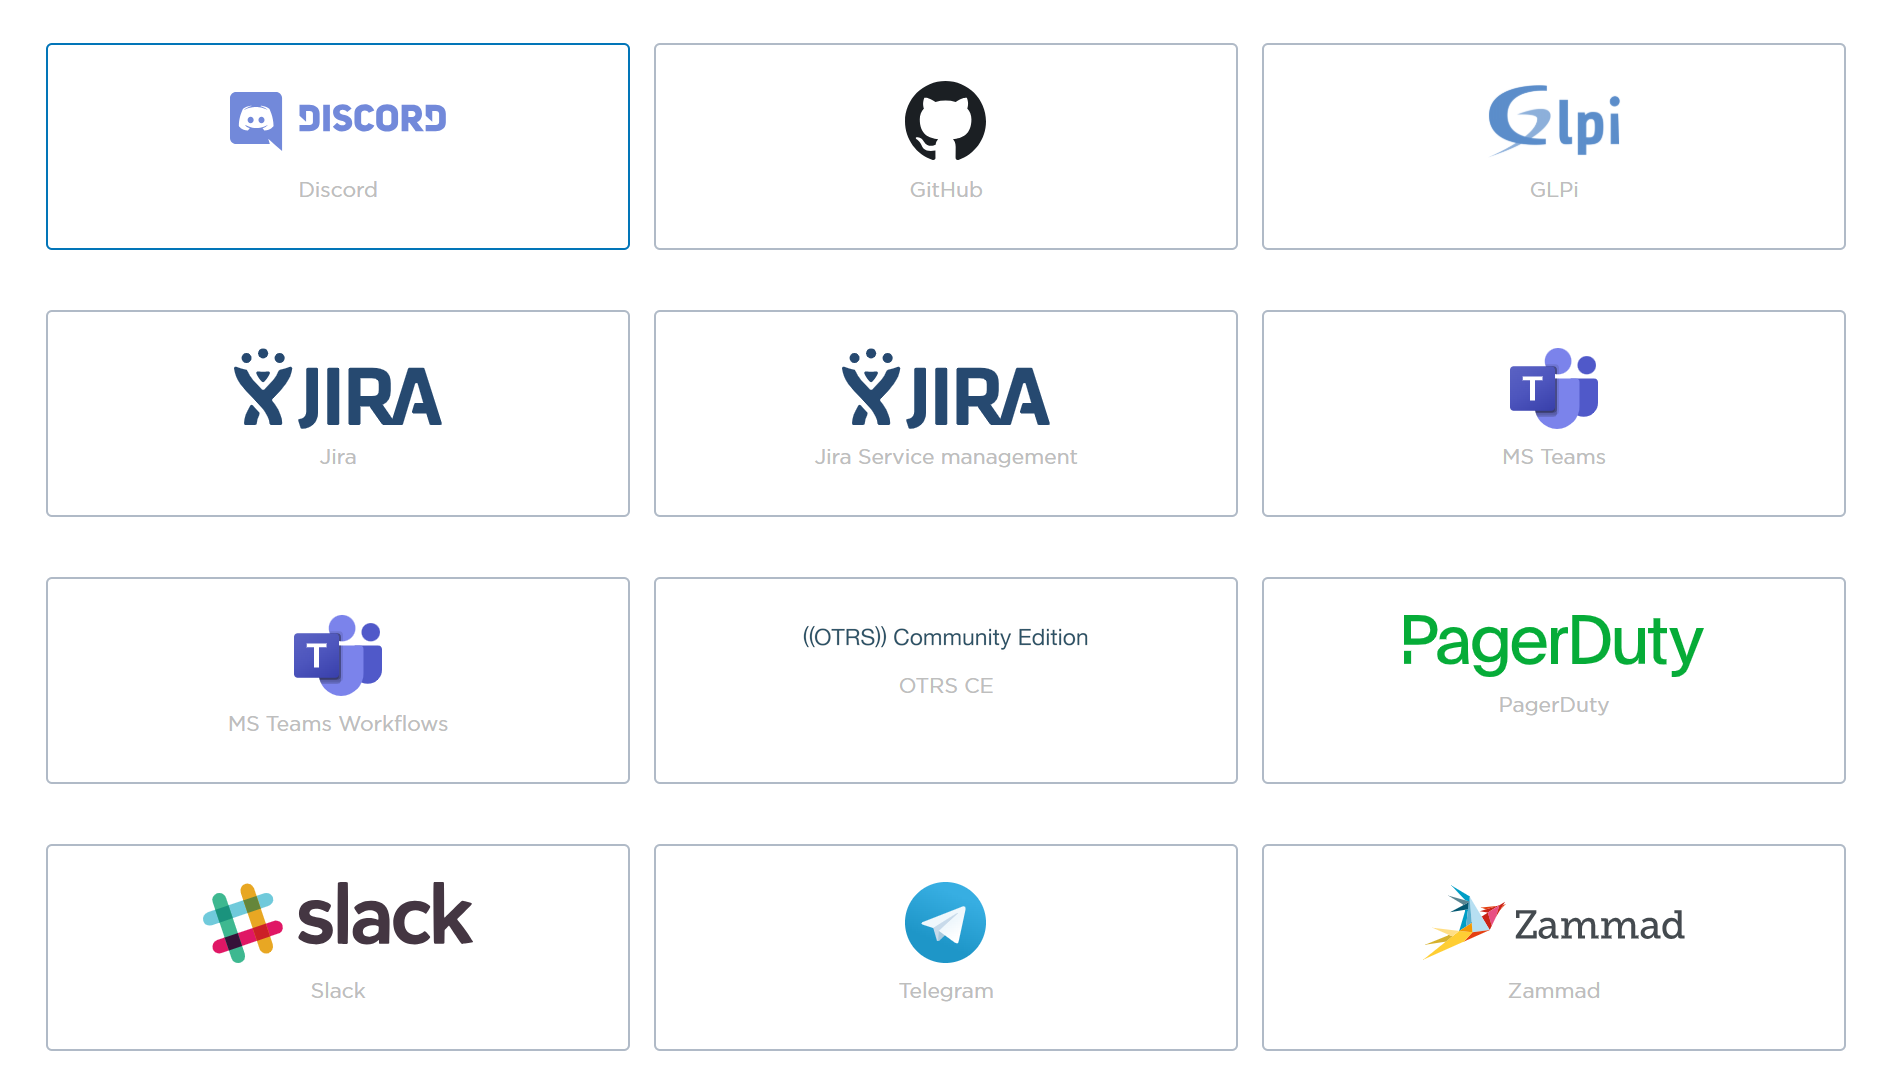
Many of the existing webhook integrations have been refactored in Zabbix 7.4. The webhooks have been optimized for the best possible performance and include a variety of fixes:

  • Discord
  • GitHub
  • GLPi
  • Jira
  • Jira Service management
  • MS Teams
  • MS Teams Workflows
  • OTRS CE
  • PagerDuty
  • Slack
  • Telegram
  • Zammad
Many of the existing webhook integrations have been refactored in Zabbix 7.4

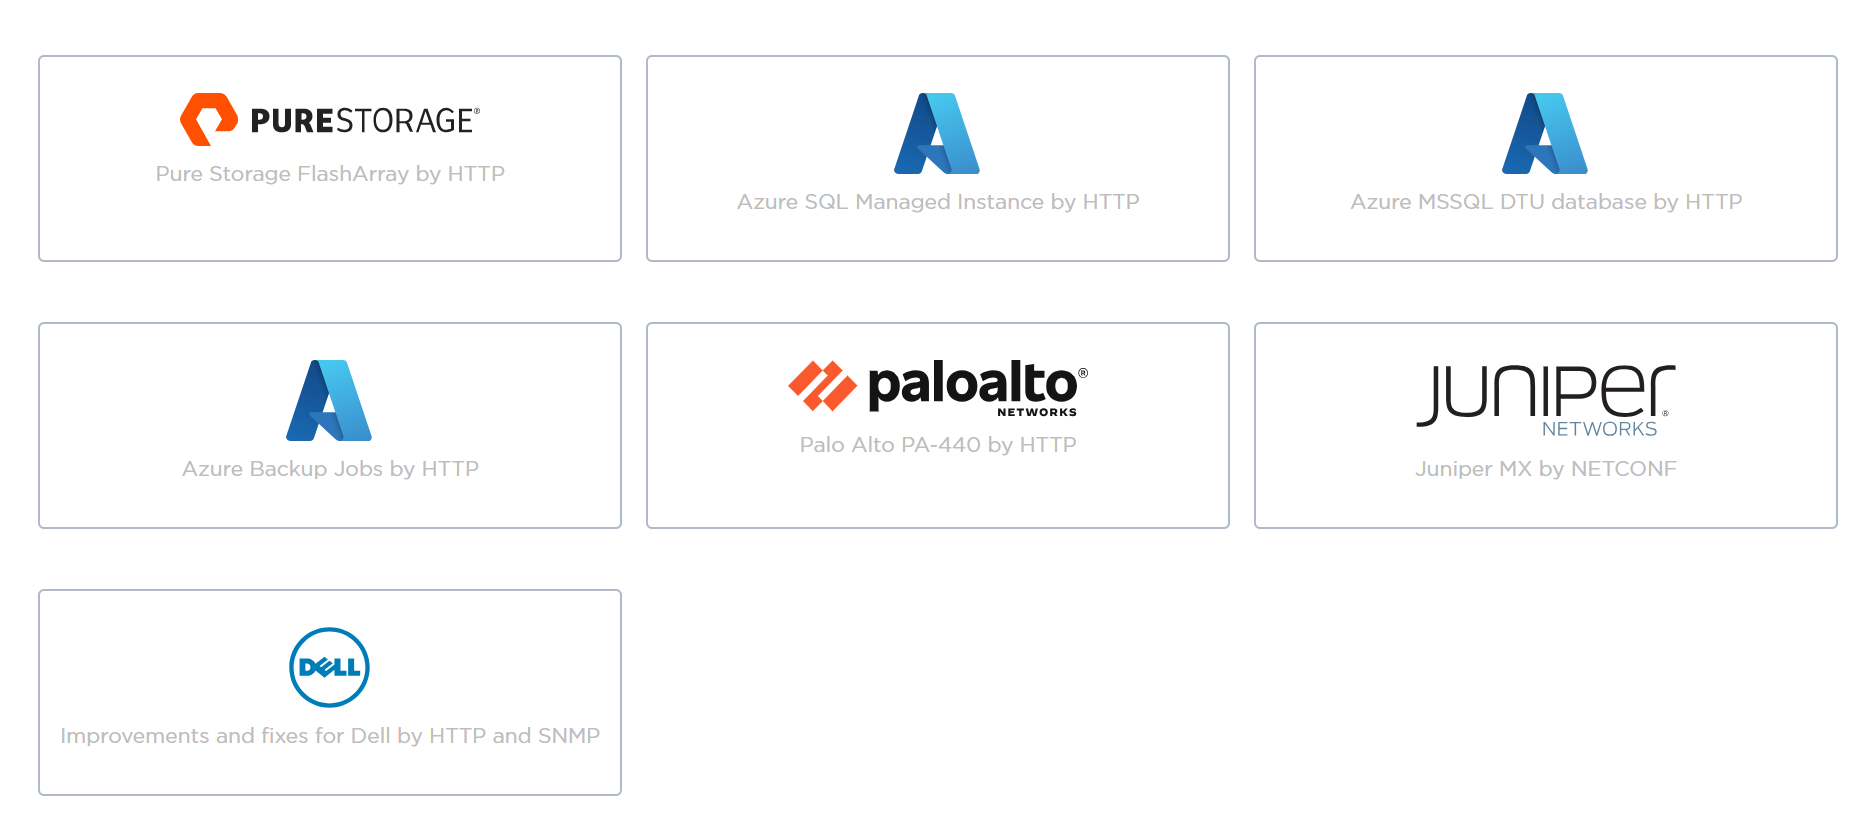
Multiple new templates have also been introduced:

  • Pure Storage FlashArray
  • Azure SQL Managed Instance
  • Azure MSSQL DTU database by HTTP
  • Azure Backup Jobs by HTTP
  • Palo Alto PA-440
  • Juniper MX
  • Improvements for Dell by HTTP and SNMP templates
Zabbix 7.4 introduces multiple new templates

The post What’s new in Zabbix 7.4 appeared first on Zabbix Blog.

Interactive Dashboard Creation for Large Organizations and MSPs

Post Syndicated from Arturs Lontons original https://blog.zabbix.com/interactive-dashboard-creation-for-large-organizations-and-msps/30132/

Dashboard widgets have received substantial improvements in the latest Zabbix releases – everything from brand-new widgets to greatly expanding upon existing widget features. The post will cover some of the new improvements as well as lesser-known dashboard and widget features, while discussing multiple dashboard use cases targeted at large organizations and MSPs.

Broadcast and listen capabilities

Zabbix widgets can be used to not only display static data, but they can also be linked together by using widget broadcast and listen capabilities. Depending on the built-in capabilities, widgets can either broadcast data (such as the item, host, event, or time interval selected in the widget) or listen and display the selected data points – multiple widgets support both broadcast and listen capabilities.

Widgets can broadcast and listen for the following entities:

  • Hosts
  • Host groups
  • Time periods
  • Items
  • Events
  • Maps

Zabbix documentation contains the full list of widget broadcast and listen capabilities.

Widget broadcast and listen capabilities

Host and Item navigator widgets serve as simple examples of broadcast widgets. The sole purpose of these widgets is to display an organized, interactive list of hosts or items. The selected hosts and items can be broadcast to other widgets such as graphs, gauges, problem widgets, an item value widget, and many others.

In addition to regular widget filters based on hosts, host groups, and tags, navigator widgets can be configured to group hosts or items based on tags, host groups, and existing problem severities. This can be used to provide an organized overview of hosts or items based on MSP clients, organization departments, and any other grouping.

Hosts grouped by MSP clients based on host group names

Any combination of widgets from the above table can be used to create interactive dashboards. For example, you could combine the Item value widget listen capabilities with the Geomap widget broadcast capabilities to display item values for hosts selected on the Geomap.

Broadcast hosts from the Geomap widget to Item value widgets

Dashboard-level host broadcast

Host overrides can also be performed on a dashboard level. Once you have set the Override host setting in your widgets to Dashboard, you can select the host in the top right corner of the dashboard. After the host is selected, the widgets will start displaying information related to the selected host.

Host information can also be broadcast on Dashboard level

Selecting non-existing items

One final thing you should consider when implementing widgets with host/item sources from broadcast widgets is what happens if the selected item does not exist on the selected host. In that case, your widget will display a message “No permission to referred object or it does not exist!” – the same error message the users will see if they lack the read permissions on an item. Ideally, you’d want to define widget filters and broadcast/listen configuration in a way where such errors can be avoided – especially if Zabbix is used as a central monitoring hub for users from multiple departments or organizations.

The item value widget displays an error message since the selected item does not exist on the selected host


Advanced graph widget use cases

The Zabbix graph widget has a variety of advanced features that can enable many new use cases and provide new insights based on the collected item values.

Data sets

The graph widget utilizes data sets to select, match, and group items that would be displayed in the graph. There are two types of data sets – item pattern and item list. When using item list data sets, you have to individually select each item that you wish to display on the graph. On the other hand,  item pattern data sets provide more flexibility. Here we can utilize wildcards in host and item names to match items and hosts by name. This is especially useful for items discovered by low-level discovery in dynamic environments. With item pattern data sets, the addition or removal of items matching the pattern will be automatically reflected in the graph.

Item list and item pattern data sets in the graph widget

Trigger and problem display

Detected problems and trigger thresholds can also be displayed in dashboard graph widgets. The time periods during which a trigger related to the displayed items has been in a problem state will be highlighted in red. The graphs also provide an option to display a trigger line for triggers utilizing last, min, max, and avg functions.

Graph widget can display a trigger line and highlight periods during which a problem was active

Aggregation

The ability to aggregate data directly within the widget can be an extremely useful tool for gaining new insights from existing data. With graph widget aggregations, it is possible to aggregate each individual item (for example, displaying hourly averages for network traffic on each interface) or the whole data set (total hourly traffic from all interfaces).

Aggregations can be performed on each item or the whole data set

Time shift

The time shift feature is useful for visually comparing current values with values collected some time in the past. For example, we could compare the current CPU load on our application server with the CPU load for the same time period yesterday. This could allow us  to detect unexpected deviations just by glancing over the graph.

With the graph widget time shift feature, you can compare current values with values collected in the past

Missing data

Finally, the graph widget enables Zabbix users to choose how they wish to display missing values. Values for items could be missing for a variety of reasons – anything from data collection errors to various preprocessing workflows that could discard item values by design. Accordingly, it makes sense to design your graphs with the correct representation of missing data in mind.

Missing values in graphs can be displayed in the following formats:

  • Treat missing values as 0
  • Do not display missing values
  • Connect the last known value with the current value
  • Treat missing values as the last known value
Missing values are treated as 0
Missing values are selected to not be displayed

Defining widget value thresholds

Threshold values can be defined for multiple widgets to make the visualization of data more dynamic. This way, Zabbix dashboards can instantly highlight resources exceeding warning/critical thresholds, services in unexpected states, unreachable endpoints, and a variety of other issues. As of Zabbix 7.2, widget thresholds are available only for numeric item values.

Widgets with threshold support

Multiple widgets provide the ability to define value thresholds:

  • Item value
  • Gauge
  • Top hosts
  • Top items
  • Honeycomb

Thresholds can be defined in widget configuration. By defining one or multiple thresholds, we specify that whenever values for the selected item reach or exceed the threshold, they will be highlighted in the selected color.

Item value widget can be used to highlight problematic resources or services

Thresholds are useful for not only highlighting the problematic items in Item value or Gauge widgets, but can also be used to provide a broader view of overall resource utilization with Top hosts and Top items widgets. Since we aren’t limited to a single item, Top hosts and Top items widgets enable us to do a surface-level correlation by looking at the utilization of various resources and highlighting the resources nearing critical utilization thresholds.

Top hosts and Top items widgets can display a comprehensive overview of host resource usage

Another way to display and highlight our infrastructure state on a larger scale is by using the Honeycomb widget. The Honeycomb widget utilizes item patterns to display the matching item values. Here, thresholds can be combined with color interpolation to provide a more dynamic view of our environment. The Honeycomb widget is also capable of broadcasting the selected item and host, which enables us to quickly gain more information about the problematic host by clicking the corresponding cell in the widget.

Honeycomb widgets provide a dynamic overview of enterprise resource usage by supporting color interpolation features

Dashboards for MSPs

The previous sections have already highlighted a variety of features, useful widgets, and widget features for large organizations and MSPs. But let’s not forget that MSPs require granular access permission and control features. MSPs must also ensure that each client’s information (Hosts, items, dashboards) is fully isolated and secure from outside access.

Dashboard visibility

Each dashboard can be deployed either as a public or a private dashboard. Public dashboards are available to every user in read-only mode, while private dashboards require explicit read and write permissions for users who need access to them. MSPs can utilize private client organization dashboards to allow each client to view information about their environment in multiple views while completely hiding the dashboards assigned to other organizations.

Private dashboards require explicit read/write permissions

Host permissions

Dashboard visibility is only the first access control layer. Even when a Zabbix user has access to a dashboard, we must ensure that the user also belongs to a user group that has at least read permissions on the hosts displayed on a dashboard. Without at least read permissions, the hosts will not be displayed in dashboard widgets. This way, MSPs can utilize a single dashboard where each organization’s users can only see the information related to their environments, as opposed to having many duplicate dashboards, where each has a custom host filter that matches just the particular organization’s hosts.

User group-to-host group permissions have a direct impact on host visibility in dashboards

Restricting access to widgets

Access to each widget can also be restricted in Zabbix. This can be done globally by disabling widget modules under Administration—General—Modules or by disabling access to modules on an individual user role level. This can come in handy if the Zabbix environment in question enables users from various departments or organizations to create their own dashboards or edit existing ones. In addition, we may also have some custom community or in-house widgets which are utilized only by Zabbix administrators. which we may want to restrict access to.

If a Zabbix user opens a dashboard containing the restricted widget, the widget will be replaced with the message “No permissions to referenced object or it does not exist!” Ideally, it is recommended to avoid situations where users encounter such widgets, since such a message can be confusing to a user not familiar with various Zabbix permission and access error messages.

Access to modules can be restricted per each user role

Dashboard ownership

Dashboard ownership can also play a role in our user onboarding and offboarding process. Dashboard owners can edit permissions on the dashboards they own, but this can add an extra step in our user offboarding process since dashboards cannot remain without an owner! Therefore, before deleting a Zabbix user, we need to ensure that either their dashboards have also been removed or have their owners be changed. If we attempt to delete a user who is also a dashboard owner, Zabbix will display an error message.

Users who are owners of an existing dashboard cannot be deleted

This article touches upon only a few of the latest and lesser-known features useful to MSPs and large organizations. There are many more advanced ways of utilizing Zabbix widgets, permissions, tags, low-level discovery rules, and many other features that come in handy to organizations of various sizes, utilizing Zabbix for a variety of use cases. Follow our blog, watch the latest Zabbix videos on our YouTube channel, and check out our on-premise and online events to learn more about the flexibility of Zabbix data collection, alerting, and visualization features.

The post Interactive Dashboard Creation for Large Organizations and MSPs appeared first on Zabbix Blog.

Getting Started with Zabbix – Hosts, Items, and Triggers

Post Syndicated from Arturs Lontons original https://blog.zabbix.com/getting-started-with-zabbix-hosts-items-and-triggers/30190/

Hosts, items, and triggers are some of the most basic concepts in Zabbix. To successfully configure their monitoring workflows, Zabbix users need to have a clear understanding of how these entities are used. This article is aimed at Zabbix beginners and should help anyone better understand the basics of Zabbix while providing guidance on how to start monitoring your initial set of hosts.

Table of Contents

Hosts

Hosts are top-level entities in Zabbix and represent your monitored endpoints. Whenever we need to monitor a device, web application, service, or anything else – we start by creating a host.

The host acts as a container for our items (representing the metrics we wish to collect) and triggers (problem threshold definitions). These entities can be created directly on the host or inherited from predefined templates.

Every host has 2 mandatory parameters – its unique name and at least a single host group. Host groups are used for grouping, filtering, and assigning read/write permissions to hosts. Hosts are not limited when it comes to the number of host groups they are assigned to.

A simple Linux server host with an agent interface and a Linux template

An interface might also be required, depending on the type of items we will create on the host. Interfaces define host addresses and, in case of SNMP interfaces, some additional authentication and security parameters.

There are 4 types of interfaces in total, representing 4 different data collection methods:

  • Agent
  • SNMP
  • JMX
  • IPMI
An SNMP device host with SNMP interface

Zabbix supports other types of data collection methods, but for these 4 methods in particular an interface is required on the host. Other data collection methods define endpoint addresses directly in the item configuration or use push data collection (trapping) where Zabbix is not required to know the endpoint address.

Templates

Templates contain a set of predefined items and triggers and can be linked to hosts. This enables the standardization of monitoring workflows in your environment. Changes made on the template will be immediately applied on the hosts to which the template is linked. Zabbix comes prepackaged with over 300 templates for a variety of vendors and endpoint types.

Zabbix comes pre-packaged with over 300 official templates

Zabbix users aren’t limited to just the official templates – anyone can create their own templates with items and triggers tailored to the requirements of a particular environment. We also recommend adjusting the official templates – disable the unnecessary items and adjust the triggers so they don’t generate any unnecessary noise.

Items

Items are used to define the metrics that we wish to collect, and are configured on hosts or templates. Items can be of various types. The type of the item usually defines the protocol and the methods used to collect metrics via this item. Some examples of item types:

  • Zabbix agent
  • SNMP agent
  • SNMP trap
  • Simple check
  • HTTP agent
  • IPMI agent
  • JMX agent
  • SSH agent
  • …and many others.

The key of the item is used to specify what particular metric should be collected. There are some exceptions to this – for example, for SNMP agent items it’s the OID field, while the key can be written arbitrarily. The key should be unique per host.

Available memory Zabbix agent item

The key uses a <key>[<parameters>] format. For example, if we wish to collect available memory by utilizing Zabbix agent, we will use the vm.memory.size[available] item key. If we wish to collect available memory in percent, we would use the vm.memory.size[pavailable] item key. A quick item key reference is available by pressing select next to the Key field. You can find more about the available item keys and other configuration details in our documentation.

The update interval specifies how often metrics should be collected for this key, and the history/trend storage periods define for how long the collected data should be retained.

Triggers

Once we have configured our items, we should create triggers to react to item values reaching problem thresholds. First, let’s define a simple trigger name. The name should be simple enough for our Zabbix administrators to understand the goal of the trigger simply by glancing at it.

Trigger reaction to low available memory over the last 10 minutes

The event name field is used to define the name with which our problems will be displayed. Since the problem event name is often used not just in Zabbix but also in the alerts that your administrators will receive in their mailboxes or via messaging and ITSM systems, the event name should be more descriptive, giving general details about the problematic situation.

Operational data fields are used to display information about the current state of items analyzed by the trigger. By default, the field will display the current value of our item (available memory, for example). This allows users to compare the current item values with item values at the time of problem creation and decide if any additional interference is necessary to resolve the problem.

The expression field defines the logic behind detecting a problem. Here, we can either type in the expression manually or press the add button and build the expression by selecting the item that we wish to analyze – plus one of the various functions used for analysis. For example, the last function is used to analyze only the last received value and can generate a lot of noise when used for resource monitoring. Meanwhile, average, minimum, and maximum functions can be used to analyze values less sensitively over time. There are many more functions available for a variety of more advanced use cases – from string analysis functions to predictive functions and many others.

A large selection of functions can be used in trigger expressions to detect problems

Once the trigger is created, it will be recalculated every time any of the related items receive a new value.

This article covered only the basics of Host, item and trigger configuration. There are many more options for more advanced use cases. If you’re interested or need help with more advanced Zabbix features, please check out a variety of tutorials, how-tos and case studies in our blog and YouTube channel.

The post Getting Started with Zabbix – Hosts, Items, and Triggers appeared first on Zabbix Blog.

See what’s possible in Zabbix 7.2!

Post Syndicated from Arturs Lontons original https://blog.zabbix.com/see-whats-possible-in-zabbix-7-2/29373/

Zabbix 7.2 is out now and available for download! The latest Zabbix major release introduces a range of new visualization features and widgets while adding a variety of updated monitoring features to support new use cases and scenarios. Read more to find out about the latest Zabbix features and improvements.

Top items widget

The previously deprecated Data overview widget has been converted to the new Top items widget. The Top items widget enables item selection via item patterns. The selected items are then displayed for hosts based on host and host group filters. This means that users are not limited to explicitly selected items or hosts, which enables dynamically matching items in rapidly changing environments.


Items can be matched using pattern matching in the Top items widget

The widget supports Bar, Indicator, Sparkline, and As-is value visualization as well as defining value thresholds, enabling value highlighting for values exceeding the defined threshold.

Top items widget supports As-is, Bar, Indicator, and Sparkline value visualization

Host card widget

The Host card widget adds the ability to display host information on Zabbix dashboards. The widget configuration supports selecting and ordering fields containing a variety of information about the host.

The Host card widget allows for selecting and ordering host information fields

The widget also supports a multi-column layout. Host information can be displayed in 1-3 columns, depending on how the widget is placed on the dashboard.

The host card widget layout can be customized by resizing the widget

Sparkline chart

Sparkline charts have been introduced in Zabbix 7.2 as an additional visualization option for existing widgets. The goal of a sparkline chart is to provide additional over-time context when viewing collected values in widgets, such as the Item value widget. Sparkline charts are supported in Top items, Top hosts, and Item value widgets.

Sparkline charts can be displayed in Item value, Top Items, and Top hosts widgets

NVIDIA GPU monitoring template and Zabbix agent 2 plugin

Starting with Zabbix release 7.2.1, the newly released NVIDIA GPU monitoring template and Zabbix agent 2 plugin will allow agent 2 to automatically discover NVIDIA GPUs on Windows and Linux environments and start monitoring items such as GPU temperature, power usage, memory, frequency, and much more. The list of discovered and supported metrics may vary depending on the GPU model.

GPU metrics can be automatically discovered and displayed on Zabbix dashboards

NETCONF monitoring with SSH item subsystem support

SSH subsystems are a set of remote commands predefined on the monitored endpoint. A common use case of an SSH subsystem is the NETCONF subsystem, used to manage network device configuration.

Zabbix 7.2 introduces a new parameter for the SSH monitoring item  –  ssh.run[unique short description,<ip>,<port>,<encoding>,<ssh options>,<subsystem>]

The subsystem parameter is used to specify an SSH subsystem and can be used to execute commands via SSH subsystems such as NETCONF or SFTP.

New and updated macros

  • New {*.TIMESTAMP} macros can be used to populate alerts with the UNIXTIME value of problem detection, recovery, and update timestamps.
  • The {EVENT.UPDATE.ACTIONJSON} macro resolves to a JSON array containing details of the actions performed during a problem update. This JSON value can be later used in integrations or scripts.
  • The {SERVICE.ID} macro resolves to the numeric ID of the service that triggered the action.
  • The {HOST.PORT} macro can now be used in the same locations as the {HOST.CONN} macro.
  • The new {FUNCTION.VALUE<1-9>} and {FUNCTION.RECOVERY.VALUE<1-9>} macros can be used in expression macros to display a value of the Nth item-based function in the trigger expression. This can be used to display values in map labels or graph names.

VMware monitoring improvements

VMware monitoring has received multiple improvements and fixes in Zabbix 7.2:

  • In addition to the previously supported VMware hypervisor discovery workflow, the template  VMware Hypervisor can now be manually linked to a stand-alone hypervisor host.
  • There is now a new item used to monitor the VMware virtual machine hypervisor maintenance status: vmware.vm.hv.maintenance[url,uuid]
  • VMware event collection has been improved by adding the support of pagination. This reduces memory consumption resulting from a large number of collected VMware events.

New and updated templates

Zabbix 7.2 introduces multiple new templates:

  • A variety of templates for LAMP stack monitoring by Zabbix agent active
  • NVIDIA GPU
  • Juniper MX series
  • Huawei OceanStor V6 Dorado
  • Nutanix Prism Element
  • Website certificate by Zabbix agent 2 active

The following existing templates have also received fixes and updates:

  • Dell iDrac and PowerEdge updated to use SNMP walk items
  • Proxmox VE by HTTP – new disk space usage items/triggers
  • MSSQL by ODBC performance counter query fixes
  • Linux and Nextcloud – removed unnecessary discard unchanged preprocessing from LLD rules
  • Microsoft 365 reports by HTTP description fixes


Additional changes and improvements

Additional changes and improvements introduced in Zabbix 7.2:

  • Added support for CP_SPIN CPU state on OpenBSD
  • Implemented new column configuration options in the Top hosts widget and support for binary item display
  • Added support for LLD Macro {#UNIT.SERVICETYPE} in systemd.unit.discovery for Zabbix agent 2
  • Updated maximum supported TimescaleDB version to 2.17
  • Updated maximum supported PostgreSQL version to 17
  • Added PubkeyAcceptedKeyTypes SSH public key algorithm configuration option
  • Items now become unsupported when there are no pollers
  • Removed support for Oracle DB
  • Removed the dependent item count limit
  • Added support of logarithmic Y-axis scaling in graphs
  • Increased the max number of rows for some widgets, such as Top hosts
  • Enabled usage of the mediatype.get method for users with the User role with a limited field scope
  • Added the ability to assign override host (Widget, Dashboard) for graph widget data sets
  • Implemented automatic selection of the first element of a broadcast-capable widget
  • Implemented a new filter in media type list view to filter out media types by their usage in action

Download and install Zabbix 7.2

You can find instructions and download the new version on the download page .

In order to  upgrade to Zabbix 7.2  you need to upgrade your repository package and download and install the new Zabbix component packages (Zabbix server, proxy, frontend, and other Zabbix components). When you start the Zabbix server, an automatic database schema upgrade will be performed. Zabbix agents are backward compatible, so installing the new agent versions is not required. Agent upgrade can be performed at a later time.  

You can find detailed step-by-step upgrade instructions on our Upgrade procedure page.  

Learn about new features and changes introduced in Zabbix 7.2 by visiting  the “What’s new in Zabbix 7.2” page .

A detailed description of the new features can be found in the “What’s new” documentation section .

Take a look at the release notes  to see the full list of new features and improvements. 


The post See what’s possible in Zabbix 7.2! appeared first on Zabbix Blog.

Introducing Zabbix Cloud

Post Syndicated from Arturs Lontons original https://blog.zabbix.com/introducing-zabbix-cloud/24837/

With Zabbix Cloud you can near-instantly deploy a feature-complete Zabbix environment fine-tuned for best possible performance.

Have you ever wanted to deploy a Zabbix instance in just a few clicks without having to worry about creating orchestrations or writing scripts to achieve this task? What about always having the latest stable Zabbix version without having to go through the upgrade procedure yourself? And then there’s scalability – what if we told you that we can offer you a Zabbix instance that can be rescaled at a moment’s notice with the most optimal performance configuration for your monitoring workloads?

No, you’re not dreaming (try pinching yourself) – you’re simply looking at our latest offering – Zabbix Cloud.


Introducing – Zabbix Cloud

With Zabbix Cloud, anyone can deploy their own Zabbix instance with a push of a button. Forget about allocating dedicated hardware, installing packages or configuring docker containers. All you have to do is name your instance, select a compute offering and a region and you’re good to go!

With Zabbix Cloud you will get:

  • 7 Compute tiers
  • 5 Datacenter regions
  • Initial 10GB of storage free of charge
  • Full Zabbix feature set
  • A Zabbix instance optimized for best possible performance
  • Customizable history retention periods
  • Ability to define access filters and encrypt Zabbix connections
  • Automatic version updates and node backups

Zabbix Cloud does not limit your monitoring in any way – Zabbix Cloud nodes are fully capable of leveraging the same data collection, processing and analysis method as an on-prem Zabbix instance.

But how about instead of us talking about Zabbix Cloud, we give you a chance to deploy a trial Zabbix Cloud node – you know what they say – “Show, don’t tell”. Anyone can sign up for a free 5 day trial and check out Zabbix Cloud for themselves – no billing information required!

Note that Zabbix Cloud is currently in Early access. During the early access period sign-ups for Zabbix Cloud will processed and accepted in batches, which means it may take some time for us to process your Zabbix Cloud sign-up request.

Deploying a Zabbix Cloud node

Deploying a Zabbix Cloud node can be done with just a few clicks. Simply press the “Create new node” button, give your node a name and select your Region, Compute tier and Disk size. Once the node deployment is complete, you can access your Cloud Zabbix instance via its DNS name and the provided login credentials for the Admin account.

In case you forgot to copy or lost the initial password – the initial password can be copied to clipboard, cleared and reset by accessing the Overview tab of the Node configuration section.

Configure a new Zabbix Cloud node

Upgrading Zabbix Cloud node compute tier and storage space

There are only two limiting factors for Zabbix Cloud nodes – the available storage space and the number of maximum supported new values per second for a particular compute tier.

Once a maximum supported number of new values per second (NVPS) for the current compute tier is reached, the values exceeding the limit will be discarded at random. You can either reduce the number of collected metrics to match the compute tier NVPS limitations or upgrade your node to a higher compute tier to support the required number of NVPS. Upgrading to a higher compute tier can be done from the Upgrade tab of the Node Configuration section.

Disk utilization can also be increased from the Upgrade tab of the Node configuration section. Note that once you have increased your Zabbix Cloud node storage you will not be able to decrease it!

In addition, storage space usage can be adjusted by modifying the history retention periods. This can be done in the History tab of the Node configuration section. Here you can adjust storage periods for various types of history, trend and auditlog data. Reducing the storage periods will also reduce the total space usage on the current node.

Zabbix Cloud users can upgrade the Zabbix Cloud node Compute tier and Disk size

Automatic upgrades to the latest version

With Zabbix Cloud you don’t have to worry about manually upgrading your Zabbix Cloud nodes to the latest minor or major releases. Once the latest Zabbix release passes the internal testing and QA for Zabbix Cloud deployment, your Zabbix Cloud instance will be automatically upgraded to the latest version during the weekly maintenance periods chosen by you under the Node configuration section. 

The upgrade to the latest Zabbix major release can be postponed but it cannot be cancelled. Eventually, your Zabbix cloud node will be automatically upgraded to the latest major version.   

This ensures that your Zabbix Cloud nodes will always have all of the latest features, performance improvements and security fixes applied on them after passing a thorough internal QA process.

Backing up your Zabbix cloud node

Zabbix Cloud provides two options for performing Zabbix Cloud node backups:

  • Free automatic weekly backups
  • Manual backups with an attached monthly cost

Manual backups can be performed from the Backups tab of the Node configuration section. Here you can also see the next scheduled automatic backup and restore your Zabbix Cloud node from an existing backup. Currently Zabbix Cloud node backups cannot be exported from Zabbix Cloud and existing Zabbix instances cannot be migrated to Zabbix Cloud.

Zabbix Cloud nodes are automatically backed up on a weekly basis

Maintenance windows

Each of your Zabbix Cloud nodes is required to have at least 1 hour long weekly maintenance window defined in the Maintenance tab of the Node configuration section.

During the maintenance the following upgrades might be performed on your Zabbix Cloud node: 

  • Be upgraded to the latest Zabbix release 
  • Have the latest security fixes applied on the nodes 
  • Have the latest platform level upgrades applied on the nodes 
  • Be optimized for best possible performance 

Zabbix nodes may be taken offline during the maintenance period if the maintenance tasks require it. 

Zabbix Cloud nodes are required to have weekly maintenance window of at least 1 hour assigned to them

Conclusion

With Zabbix Cloud, deploying a fully optimized Zabbix instance is easier than ever. Automated upgrades and backups ensure that Zabbix Cloud will position itself as a streamlined, secure and up-to-date product with 24/7 availability and the latest Zabbix features available to everyone, no matter their technical proficiency in managing, tuning and upgrading Zabbix environments.

On top of that, Zabbix provides a large selection of professional services with the goal of helping our users to configure and troubleshoot their monitoring workflows, deliver custom templates, integrate Zabbix nodes with 3rd party solutions and more! Check out the full list of Zabbix professional services and see how we can further enhance your Zabbix experience.


The post Introducing Zabbix Cloud appeared first on Zabbix Blog.

Case Study: Monitoring Railway Infrastructure for Infrabel

Post Syndicated from Arturs Lontons original https://blog.zabbix.com/case-study-monitoring-railway-infrastructure-for-infrabel/28035/

Infrabel is a government-owned public limited company that builds, owns, maintains, and upgrades the Belgian railway network, makes its capacity available to railway operator companies, and handles train traffic control. Headquartered in Brussels, Infrabel employs over 9,000 people and manages 3,602 kilometers of rail lines.

The challenge

Infrabel needed a monitoring solution that was flexible enough to manage not only infrastructure, but also OS level metrics, data centers, service and application states, and the availability of railway infrastructure components.

The solution

To begin with, Zabbix agents are deployed on railway station screens and broadcasting systems. This is possible because under the hood these pieces of hardware they run Debian OS, which means they can be monitored on the OS level by Zabbix agents right out of the box with our official templates.

This can be very easily automated together with low level discovery, autoregistration, or network discovery. Devices can be pinged from Zabbix proxies or Zabbix servers to check if they are available. If they are unavailable, Zabbix sends a notification, after which an engineer either restores the network connectivity or replaces the hardware.

In addition, Infrabel also uses Zabbix to retrieve and monitor data collected from ActiveMQ. This is where a combination of custom bash scripts and Zabbix sender is used, so the required data (also related to the railway infrastructure and data centre, hardware, and software) is retrieved from ActiveMQ via Bash script, then forwarded to Zabbix sender via a wrapper script, sent to the Zabbix server or proxy, stored and analyzed in Zabbix, and acted upon if required.

The results

Infrabel found that they could get the most out of Zabbix by integrating it with a third-party ticketing system they were already using. The integration itself is simple – when Zabbix generates a problem, the Zabbix API is then used to retrieve the problems related to a particular set of triggers that need to be forwarded to this third-party system.

These alerts are then forwarded via API to whatever system Infrabel requires – Zabbix has a variety of integrations available right out-of-the-box using web hooks, including Slack, JIRA, Microsoft Teams, and many others. Messengers can also be used with Zabbix, but Infrabel has opted to use Zabbix API for their custom ticketing solution.

In conclusion

Infrabel is the perfect example of how the flexibility of Zabbix allows it to adapt to any industry or need. The possibility to use Zabbix API, web hooks, or a combination of both was a game-changer for Infrabel – just as it could be for any customer in any industry.

You can learn more about what we can do for customers across a variety of industries by visiting our website or requesting a demo.

The post Case Study: Monitoring Railway Infrastructure for Infrabel appeared first on Zabbix Blog.

Case Study: Zabbix at the European Space Agency

Post Syndicated from Arturs Lontons original https://blog.zabbix.com/case-study-zabbix-at-the-european-space-agency/28024/

The European Space Agency (ESA) is a 22-member intergovernmental body devoted to space exploration. Headquartered in Paris and with a global staff of around 2,200, the ESA was founded in 1975. Its annual budget was €7.08 billion in 2023.

The challenge

The Columbus laboratory is the European module of the International Space Station and the cornerstone of Europe’s participation. Positioned on the starboard side of the Station’s leading edge, it is designed to provide an environment for pursuing research and development in a wide variety of fields. Its characteristics include:

  • Payload complement flexibility, provided by a modular design and serviced by a regular logistics, maintenance, and upgrade capability
  • A permanent crew presence for servicing payload support systems and interacting with payloads
  • A continuously available ground infrastructure for monitoring and controlling onboard activities

Columbus provides internal payload accommodation for multidisciplinary research into material science, fluid physics, and life sciences, while the External Payload Facility (EPF) hosts space science and Earth observation payloads.

Academics on Earth perform their tests on Columbus remotely – programming them and getting the results. The infrastructure required for these tests and the payloads that get sent back and forth require a flexible and dependable monitoring solution, and that’s where Zabbix enters the picture.

The solution

Zabbix proxy was deployed in the Columbus module alongside other software required for research, operations, and connectivity. The Zabbix server and frontend are deployed in the ground data center, and this is what the proxy communicates with.

In addition to proxies, we have a Zabbix sender and Agent 2 that are used on this infrastructure, which is made of VMS and containers running different kinds of services. Data is collected in a very ordinary fashion – Zabbix Agent 2 performs native checks because there is still server hardware running with operating systems and OS level resources that need to be monitored by the Agent.

We mix these native checks with user parameters which execute custom checks based on scripts or commands for commercial off-the-shelf components. The agent is extended depending on the requirements of the components. It then collects those metrics and sends them to the proxy. Scripting is used for custom components, and because Zabbix is language agnostic, any type of programming or scripting language works. It gets wrapped together with Zabbix sender, which then sends data to the proxy, which then sends data to the server.

Because there are so many custom services and metrics that need to be monitored (the number of high priority files in the transfer queue for a particular payload, for example) and because metrics, services, and payloads can change over time, the ESA needed to automate a way of automatically discovering these, displaying them, and collecting data for them. We used low-level discovery together with some scripting to discover and automatically start monitoring new payloads.

The results

Thanks to Zabbix’s visualization capabilities, the ESA’s team has found it easy to observe their dashboards and react to alerts in real time.

The ESA has also found Zabbix proxy to be an ideal solution for their needs, because if a link between the ground data center and the Columbus module goes down, the proxy keeps collecting local metrics, stores them in its own database, and then sends them back to the ground once the connection is restored. No such situation has arisen yet, but Zabbix has performed flawlessly in all test scenarios.

Monitoring is a never-ending process and there’s always room for improvement, but it’s reasonable to expect that the ESA will continue working on Zabbix and finding new metrics and new ways of improving monitoring.

In conclusion

Part of the beauty of Zabbix has always been its adaptability – it can be as simple or as complex as any user needs it to be. The simplicity of the Zabbix setup in this scenario (as opposed to a more modular setup with 4 or 5 pieces of software) is what makes it ideal for deployment by the ESA on the International Space Station.

To learn more about what we do for customers across multiple industries, visit our website or request a demo.

The post Case Study: Zabbix at the European Space Agency appeared first on Zabbix Blog.

Improving SNMP monitoring performance with bulk SNMP data collection

Post Syndicated from Arturs Lontons original https://blog.zabbix.com/improving-snmp-monitoring-performance-with-bulk-snmp-data-collection/27231/

Zabbix 6.4 introduced major improvements to SNMP monitoring, especially when it comes to collecting large numbers of metrics from a single device. This is done by utilizing master-dependent item logic and combining it with low-level discovery and newly introduced preprocessing rules. This blog post will cover the drawbacks of the legacy SNMP monitoring approach, the benefits of the new approach, and the steps required to deploy bulk SNMP metric collection.

The legacy SNMP monitoring approach – potential pitfalls

Let’s take a look at the SNMP monitoring logic that all of us are used to. For our example here, we will look at network interface discovery on a network switch.

To start off, we create a low-level discovery rule. In the discovery rule, we specify which low-level discovery macros are collected from which OIDs. This way, we create multiple low-level discovery macro and OID pairs. Zabbix then goes through the list of indexes at the end of the specified OIDs and matches the collected values to low-level discovery macros. Zabbix also collects the list of discovered indexes for the specified OIDs and automatically matches them with the {#SNMPINDEX} low-level discovery macros.

An example of regular SNMP discovery key:

discovery[{#IFOPERSTATUS},1.3.6.1.2.1.2.2.1.8,{#IFADMINSTATUS},1.3.6.1.2.1.2.2.1.7,{#IFALIAS},1.3.6.1.2.1.31.1.1.1.18,{#IFNAME},1.3.6.1.2.1.31.1.1.1.1,{#IFDESCR},1.3.6.1.2.1.2.2.1.2,{#IFTYPE},1.3.6.1.2.1.2.2.1.3]
An example of regular SNMP low-level discovery rule

The collected low-level discovery data will look something like this:

[
{
"{#SNMPINDEX}":"3",
"{#IFOPERSTATUS}":"2",
"{#IFADMINSTATUS}":"1",
"{#IFALIAS}":"",
"{#IFNAME}":"3",
"{#IFDESCR}":"3",
"{#IFTYPE}":"6"
},
{
"{#SNMPINDEX}":"4",
"{#IFOPERSTATUS}":"2",
"{#IFADMINSTATUS}":"1",
"{#IFALIAS}":"",
"{#IFNAME}":"4",
"{#IFDESCR}":"4",
"{#IFTYPE}":"6"
},
{
"{#SNMPINDEX}":"5",
"{#IFOPERSTATUS}":"2",
"{#IFADMINSTATUS}":"1",
"{#IFALIAS}":"",
"{#IFNAME}":"5",
"{#IFDESCR}":"5",
"{#IFTYPE}":"6"
},
{
"{#SNMPINDEX}":"6",
"{#IFOPERSTATUS}":"2",
"{#IFADMINSTATUS}":"1",
"{#IFALIAS}":"",
"{#IFNAME}":"6",
"{#IFDESCR}":"6",
"{#IFTYPE}":"6"
},
{
"{#SNMPINDEX}":"7",
"{#IFOPERSTATUS}":"2",
"{#IFADMINSTATUS}":"1",
"{#IFALIAS}":"",
"{#IFNAME}":"7",
"{#IFDESCR}":"7",
"{#IFTYPE}":"6"
}
]

Once the low-level discovery rule is created, we move on to creating item prototypes.

Items created based on this item prototype will collect metrics from the OIDs specified in the SNMP OID field and will create an item per index ( {#SNMPINDEX} macro) collected by the low-level discovery rule. Note that the item type is SNMP agent – each discovered and created item will be a regular SNMP item, polling the device and collecting metrics based on the item OID.

Now, imagine we have hundreds of interfaces and we’re polling a variety of metrics at a rapid interval for each interface. If our device has older or slower hardware, this can cause an issue where the device simply cannot process that many requests. To resolve this, a better way to collect SNMP metrics is required.

Bulk data collection with master – dependent items

Before we move on to the improved SNMP metric collection approach, we need to first take a look at how master-dependent item bulk metric collection and low-level discovery logic are implemented in Zabbix.

  • First, we create a master item, which collects both the metrics and low-level discovery information in a single go.
  • Next, we create a low-level discovery rule of type dependent item and point at the master item created in the previous step. At this point, we need to either ensure that the data collected by the master item is formatted in JSON or convert the data to JSON by using preprocessing.
  • Once we have ensured that our data is JSON-formatted, we can use the LLD macros tab to populate our low-level discovery macro values via JSONPath. Note: Here the SNMP low-level discovery with bulk metric collection uses a DIFFERENT APPROACH, designed specifically for SNMP checks.
  • Finally, we create item prototypes of type dependent item and once again point them at the master item created in the first step (Remember – our master item contains not only low-level discovery information, but also all of the required metrics). Here we use JSONPath preprocessing together with low-level discovery macros to specify which values should be collected. Remember that low-level discovery macros will be resolved to their values for each of the items created from the item prototype.

Improving SNMP monitoring performance with bulk metric collection

The SNMP bulk metric collection and discovery logic is very similar to what is discussed in the previous section, but it is more tailored to SNMP nuances.

Here, to avoid excessive polling, a new walk[] item has been introduced. The item utilizes GetBulk requests with SNMPv2 and v3 interfaces and GetNext for SNMPv1 interfaces to collect SNMP data. GetBulk requests perform much better by design. A GetBulk request retrieves values of all instances at the end of the OID tree in a single go, instead of issuing individual Get requests per each instance.

To utilize this in Zabbix, first we have to create a walk[] master item, specifying the list of OIDs from which to collect values. The retrieved values will be used in both low-level discovery (e.g.: interface names) and items created from low-level discovery item prototypes (e.g.: incoming and outgoing traffic).

Two new preprocessing steps have been introduced to facilitate SNMP bulk data collection:

  • SNMP walk to JSON is used to specify the OIDs from which the low-level discovery macros will be populated with their values
  • SNMP walk value is used in the item prototypes to specify the OID from which the item value will be collected

The workflow for SNMP bulk data collection can be described in the following steps:

  • Create a master walk[] item containing the required OIDs
  • Create a low-level discovery rule of type dependent item which depends on the walk[] master item
  • Define low-level discovery macros by using the SNMP walk to JSON preprocessing step
  • Create item prototypes of type dependent item which depend on the walk[] master item, and use the SNMP walk value preprocessing step to specify which OID should be used for value collection

Monitoring interface traffic with bulk SNMP data collection

Let’s take a look at a simple example which you can use as a starting point for implementing bulk SNMP metric collection for your devices. In the following example we will create a master walk[] item, a dependent low-level discovery rule to discover network interfaces, and dependent item prototypes for incoming and outgoing traffic.

Creating the master item

We will start by creating the walk[] SNMP agent master item. The name and the key of the item can be specified arbitrarily. What’s important here is the OID field, where we will specify the list of comma separated OIDs from which their instance values will be collected.

walk[1.3.6.1.2.1.31.1.1.1.6,1.3.6.1.2.1.31.1.1.1.10,1.3.6.1.2.1.31.1.1.1.1,1.3.6.1.2.1.2.2.1.2,1.3.6.1.2.1.2.2.1.3]

The walk[] item will collect values from the following OIDs:

  • 1.3.6.1.2.1.31.1.1.1.6 – Incoming traffic
  • 1.3.6.1.2.1.31.1.1.1.10 – Outgoing traffic
  • 1.3.6.1.2.1.31.1.1.1.1 – Interface names
  • 1.3.6.1.2.1.2.2.1.2 – Interface descriptions
  • 1.3.6.1.2.1.2.2.1.3 – Interface types

SNMP bulk metric collection master walk[] item

Here we can see the resulting values collected by this item:

Note: For readability, the output has been truncated and some of the interfaces have been left out.

.1.3.6.1.2.1.2.2.1.2.102 = STRING: DEFAULT_VLAN
.1.3.6.1.2.1.2.2.1.2.104 = STRING: VLAN3
.1.3.6.1.2.1.2.2.1.2.105 = STRING: VLAN4
.1.3.6.1.2.1.2.2.1.2.106 = STRING: VLAN5
.1.3.6.1.2.1.2.2.1.2.4324 = STRING: Switch loopback interface
.1.3.6.1.2.1.2.2.1.3.102 = INTEGER: 53
.1.3.6.1.2.1.2.2.1.3.104 = INTEGER: 53
.1.3.6.1.2.1.2.2.1.3.105 = INTEGER: 53
.1.3.6.1.2.1.2.2.1.3.106 = INTEGER: 53
.1.3.6.1.2.1.2.2.1.3.4324 = INTEGER: 24
.1.3.6.1.2.1.31.1.1.1.1.102 = STRING: DEFAULT_VLAN
.1.3.6.1.2.1.31.1.1.1.1.104 = STRING: VLAN3
.1.3.6.1.2.1.31.1.1.1.1.105 = STRING: VLAN4
.1.3.6.1.2.1.31.1.1.1.1.106 = STRING: VLAN5
.1.3.6.1.2.1.31.1.1.1.1.4324 = STRING: lo0
.1.3.6.1.2.1.31.1.1.1.10.102 = Counter64: 0
.1.3.6.1.2.1.31.1.1.1.10.104 = Counter64: 0
.1.3.6.1.2.1.31.1.1.1.10.105 = Counter64: 0
.1.3.6.1.2.1.31.1.1.1.10.106 = Counter64: 0
.1.3.6.1.2.1.31.1.1.1.10.4324 = Counter64: 12073
.1.3.6.1.2.1.31.1.1.1.6.102 = Counter64: 0
.1.3.6.1.2.1.31.1.1.1.6.104 = Counter64: 0
.1.3.6.1.2.1.31.1.1.1.6.105 = Counter64: 0
.1.3.6.1.2.1.31.1.1.1.6.106 = Counter64: 0
.1.3.6.1.2.1.31.1.1.1.6.4324 = Counter64: 12457

By looking at these values we can confirm that the item collects values required for both the low-level discovery rule (interface name, type, and description) and the items created from item prototypes (incoming/outgoing traffic).

Creating the low-level discovery rule

As our next step, we will create a dependent low-level discovery rule which will discover interfaces based on the data from the master walk[] item.

Interface discovery dependent low-level discovery rule

The most important part of configuring the low-level discovery rule lies in defining the SNMP walk to JSON preprocessing step. Here we can assign low-level discovery macros to OIDs. For our example, we will assign the {#IFNAME} macro to the OID containig the values of interface names:

Field name: {#IFNAME}
OID prefix: 1.3.6.1.2.1.31.1.1.1.1
Dependent low-level discovery rule preprocessing steps

The name and the key of the dependent item can be specified arbitrarily.

Creating item prototypes

Finally, let’s create two dependent item prototypes to collect traffic data from our master item.

Here we will provide an arbitrary name and key containing low-level discovery macros. On items created from the item prototypes, the macros will resolve as our OID values, thus giving each item a unique name and key.

Note: The {#SNMPINDEX} macro is automatically collected by the low-level discovery rule and contains the indexes from the OIDs specified in the SNMP walk to JSON preprocessing step.

The final step in creating the item prototype is using the SNMP walk value preprocessing step to define which value will be collected by the item. We will also append the {#SNMPINDEX} macro at the end of the OID. This way, each item created from the prototype will collect data from a unique OID corresponding to the correct object instance.

Incoming traffic item prototype

Incoming traffic item prototype preprocessing step:

SNMP walk value: 1.3.6.1.2.1.31.1.1.1.6.{#SNMPINDEX}
Incoming traffic item preprocessing steps


Outgoing traffic item prototype

Outgoing traffic item prototype preprocessing step:

SNMP walk value: 1.3.6.1.2.1.31.1.1.1.10.{#SNMPINDEX}
Outgoing traffic item preprocessing steps

Note: Since the collected traffic values are counter values (always increasing), the Change per second preprocessing step is required to collect the traffic per second values.

Note: Since the values are collected in bytes, we will use the Custom multiplier preprocessing step to convert bytes to bits.

Final notes

And we’re done! Now all we have to do is wait until the master item update interval kicks in and we should see our items getting discovered by the low-level discovery rule.

Items created from the item prototypes

After we have confirmed that our interfaces are getting discovered and the items are collecting metrics from the master item, we should also implement the Discard unchanged with heartbeat preprocessing step on our low-level discovery rule. This way, the low-level discovery rule will not try and discover new entities in situations where we’re getting the same set of interfaces over and over again from our master item. This in turn improves the overall performance of internal low-level discovery processes.

Discard unchanged with heartbeat preprocessing on the low-level discovery rule

Note that we discovered other interface parameters than just the interface name – interface description and type are also collected in the master item. To use this data, we would have to add additional fields in the low-level discovery rule SNMP walk to JSON preprocessing step and assign low-level discovery macros to the corresponding OIDs containing this information. Once that is done, we can use the new macros in the item prototype to provide additional information in item name or key, or filter the discovered interfaces based on this information (e.g.: only discover interfaces of a particular type).

If you have any questions, comments, or suggestions regarding a topic you wish to see covered next in our blog, don’t hesitate to leave a comment below!

The post Improving SNMP monitoring performance with bulk SNMP data collection appeared first on Zabbix Blog.

Zabbix SNMP monitoring one-day training course

Post Syndicated from Arturs Lontons original https://blog.zabbix.com/zabbix-snmp-monitoring-one-day-training-course/25746/

SNMP – Simple network management protocol is a networking protocol that is extremely prevalent in network hardware such as switches and routers, as well as a variety of other devices such as printers, power supplies and even regular server hosts. Depending on the device, a wide array of metrics can be retrieved by using SNMP without the need to deploy any additional software on the target device. Our newly introduced Zabbix SNMP monitoring one-day extra course will teach you all you need to know about SNMP and how to use Zabbix to get the most out of your SNMP devices with the most optimal data collection approach.

Course contents

The goal of the course is to introduce the core concepts behind SNMP and provide the attendees with the skills necessary to extract the required metrics from SNMP endpoints. The course covers topics such as:

  • SNMP core concepts
  • SNMP command line utilities
  • Differences between SNMP versions
  • SNMP resource discovery with Zabbix Low-level discovery feature
  • Optimizing SNMP data collection with the SNMP walk[*] item introduced in Zabbix 6.4
  • Configuring and monitoring SNMP traps

The course will be hosted by a Zabbix Certified Trainer with thorough experience in SNMP monitoring and Zabbix configuration. The courses are designed with open Q&A sessions in mind, where attendees can discuss their current and potential use cases and how the course contents can be applied to their own real-life scenarios.

Zabbix Certified Specialist on-site training

SNMP monitoring in Zabbix 6.4 and newer versions

Zabbix 6.4 introduces a whole new approach to bulk SNMP monitoring – the walk[*] item. During the course, attendees will learn how the new bulk data collection approach greatly increases the metric collection speed and reduces the potential performance impact on the monitoring endpoint. The course covers the main differences between the old and new approaches and demonstrates how the new SNMP items can be configured in the correct manner. Trainers will also demonstrate and provide the opportunity to practice SNMP resource discovery with the new walk[*] item and Zabbix low-level discovery (LLD) features.

Practical tasks

Depending on the device and vendor, configuring SNMP monitoring can be both very simple or it may require understanding the underlying OID structure to find the data that you’re looking for. To guide our students through real-life scenarios in understanding how SNMP monitoring may differ across devices and vendors, the course includes practical tasks, during which the participants will get the opportunity to configure Zabbix SNMP monitoring for an array of network devices belonging to a selection of the most popular vendors, such as Cisco, HP and Mikrotik. By the end of the course, students will have both a theoretical and practical understanding of SNMP as a protocol and how it can be used by Zabbix for metric collection and problem detection.

At the end of the course, every attendee will receive the course attendance certificate.

Sign up for the SNMP monitoring Zabbix training course and check our other one-day extra courses by visiting the Zabbix Training Extra Courses page.

The post Zabbix SNMP monitoring one-day training course appeared first on Zabbix Blog.

Integrate Zabbix with your data pipelines by configuring real-time metric and event streaming

Post Syndicated from Arturs Lontons original https://blog.zabbix.com/integrate-zabbix-with-your-data-pipelines-by-configuring-real-time-metric-and-event-streaming/25728/

Modern IT infrastructures tend to utilize multiple data sources to evaluate and react to the current state of the infrastructure. A set of internal solutions and dedicated software tools are used to correlate the collected information and react in a proper way to changes in the environment – be it a gradual increase or decrease in resource usage, unexpected load spikes or run-of-the-mill outages.

With the release of Zabbix 6.4, metrics collected by Zabbix and events generated based on trigger expressions can be integrated into such a data pipeline by using the new real-time metric and event streaming feature.

Zabbix real-time metric and event streaming

Before Zabbix 6.4 Zabbix supported real-time export of history, trends and events to files. The export was performed by exporting the data in newline-delimited JSON format. Additional scripting was mandatory if a user wanted to integrate this data within their data pipeline since Zabbix only exported the data to files without any further transformations or streaming.

On the other hand – real-time metric streaming can be a lot more flexible when it comes to integrating Zabbix with data pipelines, filtering the required data and securing the connection to the third party endpoint.

In addition to specifiying the streaming endpoint URL, Zabbix users can choose between streaming Item values and Events. On top of that, Tag filtering can be used to further narrow down the data that will be streamed to the endpoint.

Connectors

Real-time item value and event streaming can be configured by accessing the Administration – General – Connectors section. Here Zabbix administrators will have to create connectors and specify what kind of data the connector will be streaming. A single connector can only stream either Item values or events – if you wish to stream both, you will have to define at least two connectors, one for values and the other for events.

Configuring a new connector

Marking the Advanced configuration checkbox enables Zabbix administrators to further configure each individual connector – from specifying the number of concurrent sessions, limiting the number of attempts and specifying the connection Timeout to configuring HTTP proxies and enabling SSL connections.

An HTTP authentication method can also be specified for each connector. It is possible to use one of the following methods:

None – no authentication used;

Basic – basic authentication is used;

NTLM – NTLM (Windows NT LAN Manager) authentication is used;

Kerberos – Kerberos authentication is used;

Digest – Digest authentication is used;

Bearer – Bearer authentication is used.

In addition, the number of pre-forked connector worker instances must be specified in the Zabbix server configuration file in the StartConnectors parameter.

Setting StartConnectors parameter in Zabbix server configuration file

Protocol

Under the hood, the data is sent over HTTP using newline-delimited JSON export protocol.

The following example shows a trigger event for Zabbix agent being unreachable:

{"clock":1519304285,"ns":123456789,"value":1,"name":"Either Zabbix agent is unreachable on Host B or pollers are too busy on Zabbix Server","severity":3,"eventid":42, "hosts":[{"host":"Host B", "name":"Host B visible"},{"host":"Zabbix Server","name":"Zabbix Server visible"}],"groups":["Group X","Group Y","Group Z","Zabbix servers"],"tags":[{"tag":"availability","value":""},{"tag":"data center","value":"Riga"}]}

Do not get confused by the value field, the value if which will always be 1 for problem events, while for items, it will contain the item value:

{"host":{"host":"Host B","name":"Host B visible"},"groups":["Group X","Group Y","Group Z"],"item_tags":[{"tag":"foo","value":"test"}],"itemid":4,"name":"CPU Load","clock":1519304285,"ns":123456789,"value":0.1,"type":0}

Use cases

Finally, what particular use cases can we use the real-time metric streaming feature for? As I mentioned in the introduction, Zabbix item values and events could serve as an additional source of near real-time information about the current system behavior.

For example, we could stream item values and events to message brokers such as Kafka, RabbitMQ or Amazon Kinesis. Combine this with additional automation solutions and your services could dynamically scale (think K8s/Docker containers) depending on the current (or expected) load. Zabbix Kubernetes and Docker container monitoring templates very much complement such an approach.

The streamed data could also be used to gain new insights about the system behavior by streaming it to an AI engine or data lakes/data warehouses for long-term storage and analysis.

Zabbix 6.4 is out now!

Post Syndicated from Arturs Lontons original https://blog.zabbix.com/zabbix-6-4-is-out-now/25444/

Zabbix team is pleased to announce the release of the latest Zabbix major version – Zabbix 6.4. The release delivers many long-awaited improvements, such as Just-in-time LDAP and SAML user provisioning; support of older Zabbix proxy versions for simplified proxy management and zerodowntime Zabbix upgrades; near-instant configuration sync across Zabbix agents and proxies, and much more! 

New features and improvements

Just-in-time (JIT) user provisioning 

Zabbix 6.4 adds support of JIT user provisioning for LDAP and SAML authentication.

JIT user provisioning can be enabled in LDAP/SAML authentication settings

Zabbix administrators can now configure user provisioning by selecting the LDAP group pattern for matching and automatically assign User groups and User roles to the discovered users. Media types can also be mapped based on LDAP/SAML attributes.

A media can be assigned to the provisioned users based on their LDAP/SAML attributes
A group and role is assigned to the provisioned users

Cause and symptom events 

Zabbix 6.4 adds the ability to mark events as Cause or Symptom events. This allows us to filter events in a way, where we can see only root cause problems instead of being overwhelmed by symptom events. It is also possible to pause action operations for symptom events as to avoid unnecessary noise.

Multiple symptom events can be linked to a single cause event
Any event can be marked as a symptom or converted to a cause event
Action operations can be paused for symptom problems

Instant propagation of configuration changes 

Continuing to build on changes introduced in Zabbix 6.2 (Collecting only configuration change deltas), Zabbix 6.4 introduces instant configuration synchronization across passive and active agents and proxies.

  • Instead of receiving the full configuration copy every 2 minutes (old behavior), in Zabbix 6.4 active agent receives the configuration copy only when changes have been performed
  • RefreshActiveChecks parameter now supports a range 1-86400 (old range: 60-3600)
  • The ProxyConfigFrequency parameter is now used in both Zabbix server (for passive mode) and Zabbix proxy (for active mode) configuration files
  • ConfigFrequency parameter in Zabbix proxy configuration is now deprecated
  • Default ProxyConfigFrequency parameter is 10 seconds (down from 1 hour)

This also improves the performance of Zabbix servers and proxies, since only configuration deltas are synced. As for active agents – the active agent receives a full configuration copy only when any changes are detected in the configuration instead of receiving it every RefreshActiveChecks interval (old behavior)

New SNMP walk item for bulk collection and discovery of SNMP metrics 

A new SNMP agent walk item has been introduced. The item looks at a specified OID or OIDs and polls their indexes by suing the SNMP GetBulk requests. An SNMP GetBulk request can provide better performance and more rapid metric collection and discovery from enterprise-tier SNMP devices.

For example:

walk[1.3.6.1.1,1.3.6.2]

Result:

1.3.6.1.2.1.1 = STRING: "<value1>"
1.3.6.1.2.1.2 = STRING: "<value2>"
1.3.6.1.2.1.3 = STRING: "<value3>"
1.3.6.2.1 = INTEGER: 10
1.3.6.2.2 = INTEGER: 20

Textual values can then be transformed to JSON, which can serve as a master item for low-level discovery rules:

SNMP walk to JSON transforms the obtained data to JSON

Resulting values:

[
{"{#SNMPINDEX}":"7","{#IFALIAS}":"Uplink PT","{#IFTYPE}":"6"},
{"{#SNMPINDEX}": "8","{#IFALIAS}": "Uplink FB","{#IFTYPE}":"6"},
{"{#SNMPINDEX}": "473","{#IFALIAS}":"lag","{#IFTYPE}":"161"}
]

Once the data is converted to JSON, we can use SNMP walk value preprocessing step together with LLD macros, to create dependent item prototypes:

SNMP walk value preprocessing step can be used to specify value for extraction in item prototypes

Support of data collection for outdated proxies

To improve the Zabbix component upgrade workflows (especially for large environments), outdated proxies can still perform data collection with a newer Zabbix server version:

  • Proxy is fully supported if it has the same major version as the Zabbix server
  • Proxy is marked as outdated if its major version is older than the Zabbix server but not older than the previous LTS release
  • Outdated proxies still support data collection and remote command execution
  • In other scenarios, the proxy becomes not supported
Deployed proxy compatibility can be seen in Zabbix frontend
Server version Current proxy version Outdated proxy version Unsupported proxy version
6.4 6.4 6.0, 6.2 Older than 6.0; newer than 6.4
7.0 7.0 6.0, 6.2, 6.4 Older than 6.0; newer than 7.0
7.2 7.2 7.0 Older than 7.0; newer than 7.2

New menu layout 

Zabbix menu layout has been redesigned. The goal of the new menu layout is to provide logical and consistent access to main Zabbix features.

The new menu provides a more consistent and logical layout to Zabbix features

Real-time streaming of metrics and events over HTTP

In addition to streaming collected metrics and events to files, Zabbix 6.4 adds the option to stream metrics and events over HTTP. Zabbix administrators have the option to filter the data for streaming by using tag filters. A new Connectors section has been introduced under Administration – General. Here Zabbix administrators can define an external system where item values and events should be pushed to.

Define a new connector to stream metrics and events over HTTP

Zabbix 6.4 can be used as a source of information for other applications, analytics reports, and AI engines by streaming metrics and events over HTTP in real time. Metrics and events can be streamed to message brokers like Kafka, RabbitMQ, or Amazon Kinesis to adapt the behavior of external systems in real time. 

Template versioning 

Template versioning has been introduced to improve template management and ease of use. Templates are now marked with vendor ar version fields, which are visible in Zabbix frontend; these fields can also be added when writing a custom template.

Template version and vendor fields are visible in the frontend

Development framework for Zabbix widget creation 

Zabbix has a large developer community creating their own custom frontend modules, widgets and Go plugins. In Zabbix 6.4, our goal was to streamline this process by creating a development framework for widget creation. To achieve this, the following changes have been introduced:

  • Widgets have been converted to modules
  • Modules are now fully self-contained and modular
  • Built-in widgets reside in ui/widgets
  • Custom widgets reside in ui/modules/<widget>
  • Adding new widgets is as simple as adding new files without changing the existing files

In addition to these changes, we have also added a new Developer Center section to our documentation. The section contains guides, tutorials and code examples to guide our community in developing Frontend modules and widgets, as well as help with Zabbix agent 2 custom Go plugin development.

The Developer Center section contains guides, tutorials, and code examples for extending Zabbix

Other features and improvements 

The release includes many other changes:

  • Simple check, External check, SSH agent, Telnet agent item types now do not require an interface to be present on the host 
  • Pre-configured email media type settings for Gmail and O365 email providers 
  • Dynamic item value widget thresholds
  • Option to define custom labeled links for hosts and events
  • Ability to label trigger URLs
  • Improved preprocessing performance and thread-based preprocessing workers
  • Ability to label aggregated datasets in Graph widget
  • SQLite3 Zabbix proxies now automatically recreate the SQLite3 database file during an upgrade
  • A host status filter (enabled/disabled) has been added under Data collection – Hosts
  • Additional filtering options have been added to the Action log
  • Action log now supports import to CSV
  • Multiple context menu improvements to Host, Item and Event context menus
  • Old password verification is now required when changing your internal Zabbix user password
  • Value cache performance improvements when working with metrics that get updated less frequently than once per day
  • Added commands to enable profiling of rwlocks/mutexes (for debugging)

The full list of changes, bug fixes, and new features can be found in the Zabbix 6.4 release notes

New templates and integrations

Zabbix 6.4 comes pre-packaged with many new templates and integrations for the most popular vendors and cloud providers. Multiple existing templates have also received improvements:

  • Microsoft Azure MySQL servers 
  • Microsoft Azure PostgreSQL servers 
  • Microsoft Azure virtual machines 
  • Low-level discovery improvements in AWS by HTTP template 
  • Veeam Backup Enterprise Manager 
  • Veeam Backup and Replication 
  • Cisco Nexus 9000 Series 
  • BMC Control-M 
  • Cisco Meraki dashboard 
  • OS processes by Zabbix agent 
  • Improvements to filesystem discovery in official Zabbix OS templates 

Zabbix 6.4 introduces a webhook integration for the Line messaging app, allowing Zabbix events to be forwarded to the Line messenger. 

Zabbix 6.4 adds a variety of new templates and integrations

Zabbix 6.4 packages and images

Official Zabbix packages and images are available for: 

  • Linux distributions for different hardware platforms on RHEL, CentOS, Oracle Linux, Debian, SUSE, Ubuntu, Raspbian 
  • Virtualization platforms based on VMWare, VirtualBox, Hyper-V, XEN 
  • Docker 
  • Packages and pre-compiled agents for the most popular platforms, including macOS and MSI packages for Microsoft Windows 

You can find the download instructions and download the new version on the Download page.

One-click deployments for the following cloud platforms are coming soon: 

  • AWS, Azure, Google Cloud Platform, Digital Ocean 

Upgrading to Zabbix 6.4

In order to upgrade to Zabbix 6.4 you need to upgrade your repository package and download and install the new Zabbix component packages (Zabbix server, proxy, frontend, and other Zabbix components). When you start the Zabbix server, an automatic database schema upgrade will be performed. Zabbix agents are backward compatible; therefore, it is not required to install the new agent versions. You can perform the agent upgrade at a later time. 

If you’re using the official Docker container images – simply deploy a new set of containers for your Zabbix components. Once the Zabbix server container connects to the backend database, the database upgrade will be performed automatically.

You can find detailed step-by-step upgrade instructions on our Upgrade procedure page. 

Join the webinar

If you wish to learn more about the Zabbix 6.4 features and improvements, we invite you to join our What’s new in Zabbix 6.4 public webinar.

During the webinar, you will get the opportunity to:

  • Learn about Zabbix 6.4 features and improvements
  • See the latest Zabbix templates and integrations
  • Participate in a Q&A session with Zabbix founder and CEO Alexei Vladishev
  • Discuss the latest Zabbix version with Zabbix community and Zabbix team members

This is a public webinar – anyone can sign up, attend and have their questions answered by the Zabbix team!

Handy Tips #40: Simplify metric pattern matching by creating global regular expressions

Post Syndicated from Arturs Lontons original https://blog.zabbix.com/simplify-metric-pattern-matching-by-creating-global-regular-expressions/24225/

Streamline your data collection, problem detection and low-level discovery by defining global regular expressions. 

Pattern matching within unstructured data is mostly done by using regular expressions. Defining a regular expression can be a lengthy task, that can be simplified by predefining a set of regular expressions which can be quickly referenced down the line.  

Simplify pattern matching by defining global regular expressions:

  • Reference global regular expressions in log monitoring and snmp trap items
  • Simplify pattern matching in trigger functions and calculated items
  • Global regular expressions can be referenced in low-level discovery filters
  •  Combine multiple subexpressions into a single global regular expression
Check out the video to learn how to define and use global regular expressions.
Define and use global regular expressions: 
  1. Navigate to Administration General Regular expressions
  2. Type in your global regular expression name
  3. Select the regular expression type and provide subexpressions
  4. Press Add and provide multiple subexpressions
  5. Navigate to the Test tab and enter the test string
  6. Click on Test expressions and observe the result
  7. Press Add to save and add the global regular expression
  8. Navigate to Configuration Hosts
  9. Find the host on which you will test the global regular expression
  10. Click on either the Items, Triggers or Discovery button to open the corresponding section
  11. Find your item, trigger or LLD rule and open it
  12. Insert the global regular expression
  13. Use the @ symbol to reference a global regular expression by its name
  14. Update the element to save the changes
Tips and best practices
  • Each subexpressions and the total combined result can be tested in Zabbix frontend 
  • Zabbix uses AND logic if several subexpressions are defined 
  • Global regular expressions can be referenced by referring to their name, prefixed with the @ symbol 
  • Zabbix documentation contains the list of locations supporting the usage of global regular expression. 

Sign up for the official Zabbix Certified Specialist course and learn how to optimize your data collection, enrich your alerts with useful information, and minimize the amount of noise and false alarms. During the course, you will perform a variety of practical tasks under the guidance of a Zabbix certified trainer, where you will get the chance to discuss how the current use cases apply to your own unique infrastructure. 

The post Handy Tips #40: Simplify metric pattern matching by creating global regular expressions appeared first on Zabbix Blog.

Handy Tips #39: Extracting metrics from structured data with Zabbix preprocessing

Post Syndicated from Arturs Lontons original https://blog.zabbix.com/handy-tips-39-extracting-metrics-from-structured-data/24163/

Collect structured data in bulk and use Zabbix preprocessing to extract and transform the necessary metrics. 

Collecting data from custom monitoring endpoints such as web applications or custom in-house software can result in the collected data requiring further extraction or transformation to fit our requirements. 

Use Zabbix preprocessing to extract metrics from structured data: 

  • Extract data with JSONPath and XPath expressions
  • Transform XML and CSV data to JSON structures

  • Check for error messages in JSON and XML structures
  • Extract and transform metrics from Prometheus exporter endpoints

Check out the video to learn how to use Zabbix preprocessing to extract metrics from structured data.

Extract metrics from structured data with Zabbix preprocessing: 

  1. Navigate to Configuration → Hosts
  2. Find the host where structured data is collected
  3. Click on the Items button next to the host
  4. Create or open an item collecting structured data
  5. For this example, we will transform CSV to JSON
  6. Open the Preprocessing tab
  7. Select a structured data preprocessing rule
  8. If required, provide the necessary parameters
  9. Optionally, select a validation preprocessing step
  10. For this example, we will check for errors in JSON
  11. Extract a value by using JSONPath or XML XPath preprocessing steps
  12. Press Test to open the test window
  13. Press Get value and test to test the item
  14. Close the test window and press Add or Update to add or update the item
  15. Optionally, create dependent items to extract values from this item

Tips and best practices
  • You check the Handy Tips #37 to learn how to collect structured data from HTTP end-points 

  • For CSV to JSON preprocessing the first parameter allows you specify a CSV delimiter, while the second parameter specifies the quotation symbol 

  • For CSV to JSON preprocessing If the With header row checkbox is marked, the header line values will be interpreted as column names 

  • For details on XML to JSON preprocessing, refer to our serialization rules for more details. 

Learn how to leverage the many types of data collection provided by Zabbix and empower your data collection and processing. Sign up for our Zabbix Certified Specialist course, where under the guidance of a Zabbix certified trainer you will learn more about different types and technologies of monitoring and learn how to get the most out of your Zabbix instance. 

The post Handy Tips #39: Extracting metrics from structured data with Zabbix preprocessing appeared first on Zabbix Blog.

Handy Tips #38: Automating SNMP item creation with low-level discovery

Post Syndicated from Arturs Lontons original https://blog.zabbix.com/handy-tips-38-automating-snmp-item-creation-with-low-level-discovery/23521/

Let Zabbix automatically discover and start monitoring your SNMP data points.

Creating items manually for each network interface, fan, temperature sensor, and other SNMP data points can be a very time-consuming task. To save time, Zabbix administrators need to automate item, trigger, and graph creation as much as possible.

Automate item, trigger and graph creation with SNMP low-level discovery rules:

  • An entity will be created for each of the discovered indexes
  • Specify multiple OIDs to discover additional information about an entity

  • Filter entities based on any of the discovered OID values
  • Low-level discovery can be used with SNMP v1, v2c and v3

Check out the video to learn how to use Zabbix low-level discovery to discover SNMP entities.

How to use Zabbix low-level discovery to discover SNMP entities:

  1. Navigate to ConfigurationHosts and find your SNMP host
  2. Open the Discovery section and create a discovery rule
  3. Provide a name, a key, and select the Type – SNMP agent
  4. Populate the SNMP OID field with the following LLD syntax
  5. discovery[{#LLD.MACRO1},<OID1>,{#LLD.MACRO2},<OID2>]
  6. Navigate to the Filters section and provide the LLD filters
  7. Press Add to create the LLD rule
  8. Open the Item prototypes section and create an item prototype
  9. Provide the Item prototype name and key
  10. Populate the OID field ending it with the {#SNMPINDEX} LLD macro
  11. Configure the required tags and preprocessing rules
  12. Press Add to create the item prototype
  13. Wait for the LLD rule to execute and observe the discovered items

Tips and best practices
  • snmpwalk tool can be used to list the OIDs provided by the monitored device
  • If a particular entity does not have the specified OID, the corresponding macro will be omitted for it
  • OIDs can be added to your LLD rule for usage in filters and tags
  • The {#SNMPINDEX} LLD macro is discovered automatically based on the indexes listed for each OID in the LLD rule

Learn how Zabbix low-level discovery rules can be used to automate the creation of your Zabbix entities by attending our Zabbix Certified Professional course. During the course, you will learn the many use cases of low-level discovery by performing a variety of practical tasks under the guidance of a Zabbix certified trainer.

The post Handy Tips #38: Automating SNMP item creation with low-level discovery appeared first on Zabbix Blog.

Handy Tips #37: Collecting metrics from HTTP endpoints with HTTP agent items

Post Syndicated from Arturs Lontons original https://blog.zabbix.com/handy-tips-37-collecting-metrics-from-http-endpoints-with-http-agent-items/23160/

Collect metrics from HTTP endpoints such as web application APIs by defining HTTP agent items.

Collecting metrics from web services and applications is a complex affair usually done by scripting around CLIs and APIs. Organizations require an efficient way to monitor such and endpoints and react to collected data.

Collect and react to data from web services and applications with Zabbix HTTP agent items:

  • Collect metrics agentlessly using HTTP/HTTPS protocols
  • Collect metrics in bulk to reduce the number of outgoing requests

  • Zabbix preprocessing can be utilized to extract the required metrics from the response
  • Select from multiple HTTP authentication types

Check out the video to learn how to define HTTP items and collect metrics from HTTP endpoints.

Define HTTP items and collect metrics from HTTP endpoints:

  1. Navigate to ConfigurationHosts and find your host
  2. Open the Items section and press the Create item button
  3. Select TypeHTTP agent
  4. Provide the item key, name and URL
  5. For now, set the Type of information to Text
  6. Optionally, provide the request body and required status codes
  7. Press the Test button and then press Get value and test
  8. Save the resulting value to help you define the preprocessing steps
  9. Navigate to the Preprocessing tab
  10. Define a JSONPath preprocessing step to extract a value from the previous test result
  11. Navigate to the Item section
  12. Change the Type of information to Numeric (float)
  13. Perform the item test one more time
  14. Press Add to add the item

Tips and best practices
  • HTTP item check is executed by Zabbix server or Zabbix proxy
  • Zabbix will follow redirects if the Follow redirects option is checked
  • HTTP items have their own Timeout parameter defined in the item configuration
  • Receiving a status code not listed in the Required status codes field will result in the item becoming unsupported

Learn how to automate your Zabbix configuration workflows and integrate Zabbix with external systems by signing up for the Automation and Integration with Zabbix API course. During the course, students will learn how to use the Zabbix API by implementing different use cases under the guidance of a Zabbix certified trainer.

The post Handy Tips #37: Collecting metrics from HTTP endpoints with HTTP agent items appeared first on Zabbix Blog.

Handy Tips #36: Collecting custom metrics with Zabbix agent user parameters

Post Syndicated from Arturs Lontons original https://blog.zabbix.com/handy-tips-36-collecting-custom-metrics-with-zabbix-agent-user-parameters/22850/

Define custom agent keys to collect custom metrics by executing scripts or commands with Zabbix user parameters.

Having a simple way to extend the metric collection functionality of a monitoring tool can be vital if we wish to monitor custom in-house software or simply collect metrics not available out of the box.

Collect custom metrics with Zabbix agent by defining user parameters:

  • Define an unlimited number of user parameters for your Zabbix agents
  • Parameters such as usernames and passwords can be passed to flexible user parameters

  • User parameters support Zabbix agent data collection in active and passive modes
  • User parameters can collect bulk data for further processing by dependent items

Check out the video to learn how to define user parameters for Zabbix agents.

Define user parameters for Zabbix agents:

  1. Test your custom command on the host on which you will create the user parameter
  2. Open the Zabbix agent configuration file in a text editor
  3. A simple user parameter can be defined by adding the line: UserParameter=key,command
  4. A flexible user parameter can be defined by adding the line: UserParameter=key[*],command
  5. For flexible user parameters, use $1…$9 positional references to reference your custom key parameters
  6. Save the changes
  7. Reload user parameters by using the command zabbix_agentd -R userparameter_reload
  8. Open the Zabbix frontend and navigate to ConfigurationHosts
  9. Find your host and click on the Items button next to the host
  10. Press the Create item button
  11. Give your item a name and select the item type – Zabbix agent or Zabbix agent (active)
  12. Provide the key that you defined as your user parameter key
  13. For flexible user parameters, provide the key parameters
  14. Press the Test button and then press Get value and test to test your user parameter
  15. Press the Add button to add the item

Tips and best practices
  • User parameter commands need to be executed within the Zabbix agent Timeout parameter value
  • User parameters can be reloaded by executing the zabbix_agentd -R userparameter_reload command
  • User parameters can be defined in the Zabbix agent configuration file, or the files specified by the Include parameter
  • By default, certain symbols are not permitted to be used in user parameters
  • The usage of restricted characters can be permitted by setting the value of UnsafeUserParameters parameter to 1

Learn how to leverage the many types of data collection provided by Zabbix and empower your data collection and processing. Sign up for our Zabbix Certified Specialist course, where under the guidance of a Zabbix certified trainer you will learn more about different types and technologies of monitoring and learn how to get the most out of your Zabbix instance.

The post Handy Tips #36: Collecting custom metrics with Zabbix agent user parameters appeared first on Zabbix Blog.

Handy Tips #35: Monitoring log file entries with Zabbix agent

Post Syndicated from Arturs Lontons original https://blog.zabbix.com/handy-tips-35-monitoring-log-file-entries-with-zabbix-agent/22607/

Collect and react on entries in your Windows or Linux logs with Zabbix log monitoring.

Log file entries can contain OS or application-level information that can help you react proactively to potential issues or track the root cause of a problem after it has occurred.  For this reason, keeping a constant lookout for issues in mission-critical log files is vital.

Collect log file entries with Zabbix agent and react on them:

  • Zabbix agent can monitor log files on Windows and Unix-like operating systems
  • Decide between collecting every log entry or only entries matching your criteria

  • Monitor Windows event logs and collect entries matching specific severity, source or eventid
  • Choose between returning the whole log line or simply count the number of matched lines

Check out the video to learn how to collect and match log file entries.

How to match and collect log file entries:

  1. Navigate to ConfigurationHosts
  2. Find your Host
  3. Click on the Items button next to the host
  4. Click the Create item button
  5. Select the item type – Zabbix agent (active)
  6. Make sure that the Type of information is selected as Log
  7. Provide the item name and key
  8. Select the log item key
  9. Use the log file as the first parameter of the key
  10. The second parameter should contain a regular expression used to match the log lines
  11. Optionally, provide the log time format to collect the local log timestamp
  12. Set the Update interval to 1s
  13. Press the Add button
  14. Generate new log line entries
  15. Navigate to MonitoringLatest data
  16. Confirm that the matching log entries are being collected

Tips and best practices
  • Log monitoring is supported only by active Zabbix agent
  • If restarted, Zabbix agent will continue monitoring the log file from where it left off
  • The mode log item parameter can be used to specify should the monitoring begin from the start of the file or its latest entry
  • The logrt item can be used to monitor log files that are being rotated
  • The output parameter can be used to output specific regexp capture groups

Learn how to configure and optimize your log monitoring by attending our Zabbix Certified Specialist course, where under the guidance of a Zabbix certified trainer you will obtain hands-on experience with different log file monitoring items and learn how to create trigger expressions to detect problems based on the collected log lines.

The post Handy Tips #35: Monitoring log file entries with Zabbix agent appeared first on Zabbix Blog.

Handy Tips #34: Creating context-sensitive problem thresholds with Zabbix user macros

Post Syndicated from Arturs Lontons original https://blog.zabbix.com/handy-tips-34-creating-context-sensitive-problem-thresholds-with-zabbix-user-macros/22281/

Provide context and define custom problem thresholds by using Zabbix user macros.

Problem thresholds can vary for the same metric on different monitoring endpoints. We can have a server where having 10% of free space is perfectly fine, and a server where anything below 20% is a cause for concern.

Define Zabbix user macros with context:

  • Override the default macro value with a context-specific value
  • Add flexibility by using context macros as problem thresholds

  • Define a default value that will be used if a matching context is not found
  • Any low-level discovery macro value can be used as the context

Check out the video to learn how to define and use user macros with context:

How to define macros with context:

  1. Navigate to ConfigurationHosts
  2. Click on the Discovery button next to your host
  3. Press the Create discovery rule button
  4. We will use the net.if.discovery key to discover network interfaces
  5. Add the discovery rule
  6. Press the Item prototypes button
  7. Press the Create item prototype button
  8. We will use the net.if.in[“{#IFNAME}”] item key
  9. Add the Change per second and Custom multiplier:8 preprocessing steps
  10. Add the item prototype
  11. Press the trigger prototypes button
  12. Press the Create trigger prototype button
  13. Create a trigger prototype: avg(/Linux server/net.if.in[“{#IFNAME}”],1m)>{$IF.BAND.MAX:”{#IFNAME}”}
  14. Add the trigger prototype
  15. Click on the host and navigate to the Macros section
  16. Create macros with context
  17. Provide context for interface names: {$IF.BAND.MAX:”enp0s3″}
  18. Press the Update button
  19. Simulate a problem and check if context is taken into account

Tips and best practices
  • Macro context can be matched with static text or a regular expression
  • Only low-level discovery macros are supported in the context
  • Simple context macros are matched before matching context macros that contain regular expressions
  • Macro context must be quoted with ” if the context contains a } character or starts with a ” character

Learn how to get the most out of your low-level discovery rules to create smart and flexible items, triggers, and hosts by registering for the Zabbix Certified Professional course. During the course, you will learn how to enhance your low-level discovery workflows by using overrides, filters, macro context, and receive hands-on practical experience in creating fully custom low-level discovery rules from scratch.

The post Handy Tips #34: Creating context-sensitive problem thresholds with Zabbix user macros appeared first on Zabbix Blog.

Zabbix Summit: A celebration of all things monitoring and open-source

Post Syndicated from Arturs Lontons original https://blog.zabbix.com/zabbix-summit-a-celebration-of-all-things-monitoring-and-open-source/21738/

Many of us have visited a number of different conferences over the years. The setting and the goal of the conferences can vary by a large degree – from product presentations to technology stack overviews and community get-togethers. Zabbix Summit is somewhat special in that, as it aims to combine all of the aforementioned goals and present them in a friendly, inclusive, and approachable manner.

As an open-source product with a team consisting of open-source enthusiasts, it is essential for us to ensure that the core tenets of what we stand for are also represented in the events that we host, especially so for Zabbix Summit. Our goal is for our attendees to feel right at home and welcome during the Summit – no matter if you’re a hardened IT and monitoring professional or just a beginner looking to chat and learn from the leading industry experts.

Connecting with the Zabbix community

Networking plays a large part in achieving the goals that we have set up for the event. From friendly banter during coffee breaks and speeches (you never know when a question will turn into a full-fledged discussion) to the evening fun-part events – all of this helps us build our community and encourages people to help each other and mutually contribute to each other’s projects.

Of course, the past two years have challenged our preconceptions of how such an event can be hosted in a way where we achieve our usual goals. While hosting a conference online can make things a bit more simple (everyone is already in the comfort of their home or office and organizers don’t have to spend time and other resources renting a venue, for example) the novelty of “online events” can wear of quite quickly. The conversations don’t flow as naturally as they do in person. Perusing through a list of attendees in Zoom isn’t quite the same as noticing a friend or recognizing an acquaintance while standing in line at the snack bar. As for the event speakers – steering your presentation in the correct direction can be quite complex without observing the emotional feedback of your audience. Are they bored? Are they excited? Is everyone half asleep 5 minutes in? Who knows.

With travel and on-premise events slowly becoming a part of our lives again, we’re excited to get back to our usual way of hosting Zabbix Summit. In 2022, it will be held on-premises in Riga, Latvia on October 7-8, and we can’t wait to interact with our community members, clients, and partners face-to-face again!

Making the best Zabbix Summit yet

As with every Zabbix Summit, this year’s event will build on the knowledge and feedback we have gained in previous years to make this year’s Summit the best it has ever been. This year will be special for us – we will be celebrating the 10th anniversary of the Zabbix Summit hosted on-premises! In addition to conducting the event on-site, we will also be live-streaming the event online, so if you can’t meet us in person – tune in and say hello to the Zabbix team virtually!

Zabbix Summit 2019 conference venue

Over the years we have managed to define a set of criteria for the Zabbix Summit speeches with the goal to provide content that can deliver unique value to our attendees. As a Zabbix certified trainer, a Zabbix fan, and a long-time Zabbix user, I know that there are certain types of speeches that immediately attract my attention:

  • In-depth Zabbix functionality overviews from Zabbix experts or Zabbix team members
  • Unique business monitoring use cases
  • Custom Zabbix integrations, applications, and extensions
  • How Zabbix is used in the context of the latest IT trends (e.g.: Kubernetes, cloud environments, configuration management tools such as Ansible and Chef)
  • Designing and scaling Zabbix deployments for different types of large and distributed environments

This is something that we try to put extra focus on for the Zabbix Summit. Speeches like these are bound to encourage questions from the audience and serve as a great demonstration of using Zabbix outside the proverbial box that is simple infrastructure monitoring.

Looking back at Zabbix Summit 2021, we had an abundance of truly unique speeches that can serve as guidelines for complex monitoring use cases. Some of the speeches that come to mind are Wolfgang Alper’s Zabbix meets television – Clever use of Zabbix features, where Wolfgang talked about how Zabbix is used in the broadcasting industry to collect Graylog entries and even monitor TV production trucks!

Not to mention the custom solution used for host identification and creation in Zabbix called Omnissiah, presented during the last year’s Zabbix Summit by Jacob Robinson.

As Zabbix has greatly expanded its set of features since the previous year’s summit, this year we expect the speeches to cover an even larger scope of topics related to many different industries and technology stacks.

Workshops – what to expect

Workshops are a whole other type of ordeal. In an environment where we can have participants coming from different IT backgrounds with very different skill sets, it’s important to make the workshop interesting, while at the same time making it accessible to everyone.

Zabbix workshop session at the Zabbix Summit 2019

There are a few ways we go about this to ensure the best possible workshop experience for our Zabbix Summit attendees:

  • Use native Zabbix features to configure and deploy unique use cases
  • Focus on a thorough analysis of a particular feature, uncovering functionality that many users may not be aware of
  • Demonstrate the latest or even upcoming Zabbix features
  • Interact with the audience and be open to questions and discussions

In the vast majority of cases, this allows keeping a smooth pace during the workshop while also having fun and discussing the potential use cases and the functionality of the features on display.

Becoming Zabbix certified during Zabbix Summit 2022

But why stop at workshops? During the Zabbix Summit conferences, we always give our attendees a chance to test their knowledge by attempting to pass the Zabbix certified user, specialist, or professional certification exams. The exams not only test your proficiency in Zabbix but can also reveal some missing pieces in your Zabbix knowledge that you can discuss with the Zabbix community right on the spot. Receiving a brand new Zabbix certificate is also a great way to start your day, won’t you agree?

A moment of jubilation for our freshly certified Zabbix specialists and professionals

This year the Summit attendees will also get the chance to participate in Zabbix one-day courses focused on problem detection, Zabbix security, Zabbix API, and data pre-processing. Our trainers will walk you through each of these topics from A-Z and they’re worth checking out both for Zabbix beginners as well as seasoned Zabbix veterans. I can attest that by the end of the course you will have a list of features that you will want to try out in your own infrastructure – and I’m saying that as a Zabbix-certified expert.

As for those who already have Zabbix 5.0 certifications – we’ve got a nice surprise in store for you too. We will be holding Zabbix certified specialist and professional upgrade courses, which will get you up to speed with the latest Zabbix 6.0 features and upgrade your certification level to Zabbix 6.0 certified specialist and professional.

Scaling up the Zabbix Summit

But we haven’t slumbered for the last two years of working and hosting events remotely. We have continued growing as a team and expanding our partner and customer network. Who knows what surprises October will bring, but currently our plan is for Zabbix Summit 2022 to reflect our growth.

Zabbix team at the Zabbix Summit 2019

Currently, we stand to host approximately 500 attendees on-site and expect the online viewership to reach approximately 7000 unique viewers from over 80 countries all across the globe.

With over 20 speakers from industries such as banking and finance, healthcare and medical, IT & Telecommunications, and an audience consisting of system administrators, engineers, developers, technical leads, and system architects, Zabbix Summit is the monitoring event for knowledge sharing and networking across different industries and roles.

The fun part

Spending the major part of the day networking and partaking in knowledge sharing can be an amazing experience, but when all is said and done, most of us will want to unwind after an eventful day at the conference. The Zabbix Summit conference fun part events are where you will get to strengthen your bonds with other fellow Zabbix community members and simply relax in an informal atmosphere.

Zabbix Summit 2019 Sunset afterparty

The Zabbix Summit fun part consists of three parties.

  • Kick off Zabbix Summit 2022 by joining the Zabbix team and your fellow conference attendees for an evening of social networking and fun over cocktails and games at the Meet & Greet party.
  • Join the main networking event to mark the 10th anniversary of the Zabbix Summit. Apart from good vibes, cool music, and like-minded people, expect the award ceremony honoring the most loyal Zabbix Summit attendees, fun games to play, and other entertaining activities.
  • Celebrate the end of the Zabbix Summit 2022 by attending the closing party where you can network with conference peers and discuss the latest IT trends with like-minded people in a relaxed atmosphere.
Zabbix Summit 2019 Main party

Invite a travel companion

Zabbix Summit is also a great chance to take a friend or a loved one to the conference. The conference premises are located in the very heart of Riga – perfect for taking strolls across and exploring Riga Old Town.

If you’re interested in a more guided experience for your companion, we invite you to register for the Travel companion upgrade. Your travel companion will get to enjoy the Riga city tour followed by a lunch with the rest of the guests accompanying the Zabbix conference participants. Last time, we nurtured our travel companions with a delightful tour across the Riga Central market, accompanied by the Latvian-famous chef Martins Sirmais, and full of local food tasting. Our team is preparing something special also for this year. The tour will take place on October 7 during the conference time.

Visit the Zabbix offices

Are you a fan of the product and what we stand for? Why not pay us a visit and attend the Zabbix open doors day on October 6 from 13:00 till 15:00. Take a tour of the office and sit down with us for an informal chat and a cup of coffee or tea. There won’t be any speeches, workshops, or presentations, just friendly conversations with Zabbix team, our partners, and the community to warm up before the Summit. Although, there might be friendly foosball and office badminton tournaments if any volunteers will appear.

Welcoming our community members at the Zabbix Summit 2019 Open Doors day

All things said and done – Zabbix Summit is not only about deep technical knowledge and opinion sharing on monitoring. It is and has always been primarily a celebration of the Zabbix community. It is the community feedback that largely shapes the Zabbix summit and helps us build upcoming events on the foundations laid in the previous year. Throughout the years Zabbix summit has grown into much more than a simple conference – it’s an opportunity to travel, visit us, connect with like-minded people and spend a couple of days in a relaxed atmosphere in the heart of a beautiful Northern European city.

The post Zabbix Summit: A celebration of all things monitoring and open-source appeared first on Zabbix Blog.

Handy Tips #33: Pause unwanted alarms by suppressing your problems

Post Syndicated from Arturs Lontons original https://blog.zabbix.com/handy-tips-33-pause-unwanted-alarms-by-suppressing-your-problems/21981/

Suppress problems indefinitely or until a specific point in time with the problem suppression feature.

There are plenty of use cases when detected infrastructure or business problems need to be temporarily suppressed, and the alerting workflows have to be paused. This applies to scenarios such as emergency maintenance, unexpected load on your systems, migrations to new environments, and many others.

Use Zabbix problem suppression feature to suppress unwanted problems and pause your alerts:

  • Suppress problems indefinitely or until a specific point in time
  • Suppress a single problem or together with all of the related problems

  • Pause your actions until the problem suppression is over
  • Use relative or absolute time syntax to suppress problems until a specific point in time

Check out the video to learn how to use the problem suppression feature:

How to suppress unwanted problems:

  1. Open the MonitoringProblems page or a Problems widget
  2. Find the problem that you wish to suppress
  3. Press the No button under the Ack column
  4. Select the suppression scope
  5. Mark the Suppress checkbox
  6. Select the suppression method
  7. If you have selected Until provide the date or suppression interval
  8. Optionally, provide a message that will be visible to others
  9. Press the Update button
  10. Once the window has been refreshed, the problem will be hidden
  11. Open the Problems widget or the Problems page configuration
  12. Mark the Show suppressed problems checkbox
  13. Inspect the suppressed problem

Tips and best practices
  • Once suppressed the problem is marked by a blinking suppression icon in the Info column, before being hidden
  • A suppressed problem may be hidden or shown, depending on the problem filter/widget settings
  • Suppression details are displayed in a popup when positioning the mouse on the suppression icon in the Actions column
  • The event.acknowledge API method can be used to suppress/unsuppress a problem via Zabbix API

Do you wish to learn how to automatically detect and resolve complex problems in your infrastructure by creating smart problem thresholds?
Check out the Advanced Problem and Anomaly Detection with Zabbix training course, where under the guidance of a Zabbix certified trainer you will learn how to get the most out of Zabbix problem detection.

The post Handy Tips #33: Pause unwanted alarms by suppressing your problems appeared first on Zabbix Blog.