Post Syndicated from Robert Cepa original https://blog.cloudflare.com/building-product-intelligence-platform-with-cloudflare-workers/

“You can only improve what you can measure.”
We try to make Cloudflare’s onboarding experience as accessible as possible. For this reason, many customers are able to set up Cloudflare, configure their accounts and products, and discover additional products entirely on their own in our dashboard. Our Customer Onboarding team builds the dashboard experiences that make this possible.
The Onboarding team is data-driven, so we use data to validate our ideas. Rather than shipping the implementation of some idea right away, we run A/B tests with a small percentage of our customers. The results of these tests tell us what we should do with our idea next – either ship it to everyone, try to improve it (and run the test again), or discard it. This practice helps us with hedging our efforts so we don’t waste time on an idea that isn’t fruitful, and it provides us a method to reliably gather more information about needs of our customers. We use a third-party analytics tool to produce data for these A/B tests. This tool helps us to collect and analyse data about how our customers interact with the experiences that we build.
The onboarding experience in the dashboard is just one of many places where our customers interact with Cloudflare. Other Product teams, Customer Success team, and Marketing team build their own experiences in the dashboard and beyond, and they use their own analytics tools that best suit their needs. Each of those teams has different goals, but we all have one thing in common – we want to understand our customers.
For example, knowing how our customers interact with campaigns and emails that Marketing teams build can help us on the Onboarding team to build a better, more personalized onboarding experience. Similarly, understanding how our customers interact with the onboarding experience in the dashboard can help our Marketing team to create more personalized emails and campaigns.
Using multiple third-party analytics tools across multiple teams created many challenges related to data integrity, security, privacy and performance. In this blogpost, we are going to talk about how we used Cloudflare Workers to build our product intelligence platform to overcome these challenges, serving hundreds of millions of requests per month from over 200 cities over the world, close to our customers, all without having to configure and maintain infrastructure.
Motivation: Data integrity, security, privacy, and performance
In the past, teams at Cloudflare used third-party scripts provided by analytics platforms like Google Analytics and Heap to measure user behavior. These scripts presented multiple challenges:
Data Integrity
In the product analytics world, an “event” is any user interaction with the product. Because we were using third-party scripts to send event data to varied analytics destinations, it was hard to make sure that these event data are consistent across all these destinations. In our case, our analytics tools categorized event data in different ways, creating confusion for our teams. For example, if a Cloudflare customer purchased our Workers product, Heap would send an event named “Purchase Workers”, while Google Analytics called it “Product Purchase Success” with a data attribute label: “workers”. Nobody trusted this data, so they sought out more reliable sources, such as billing databases.
Security and privacy
Third-party analytics vendors use third-party scripts to track end-user behavior. We take security and data privacy very seriously, and these scripts pose risks to us and our customers. They are hard to audit, and make it hard to ensure they don’t send data we don’t want them to send. They also change over time, and can be buggy, inefficient, and hard to test.
Performance
We want to give Cloudflare dashboard users a highly performant experience, but third-party scripts can cause slowdowns. For example, they can have a significant size because they try to do a lot of things automatically. Having to load and parse too much JavaScript can extend page load and render times, delay user interaction, and drain more battery. They can also fire too many network requests to multiple servers.
Vendor lock-in
Cloudflare’s dashboard codebase is massive, and hardcoded tracking calls tied to a specific analytics vendor makes that vendor difficult to replace. Moreover, adding a new vendor would require significant effort to add that vendor’s tracking calls everywhere, and would have a negative impact on performance on the frontend.
We wanted to solve these problems by creating a system that would decouple what we measure from how we measure it. The requirements were:
- Unified API: a single API that all clients adhere to regardless of the vendor they primarily use. Engineers don’t need to understand how analytics vendors work and what data they require.
- Secure and compliant: we fully own and control the code, protecting our customers from vulnerabilities in third-party code. We fully control how our data is measured, distributed, and stored.
- Performant: lightweight, fast, and non-blocking on the frontend. Move as much logic as we can to the backend.
- Flexible: ability to add/replace/remove vendors with relatively small effort on the backend, and no effort on the frontend.
We chose to use Cloudflare Workers, which deploys serverless code on the edge across the globe, as our backend infrastructure. Workers offers the following advantages:
- Nimbleness through serverless development: Our team is small, and analytics wasn’t our primary focus at the time, so we wanted to create something quickly without having to worry about setting up and maintaining the infrastructure. With Workers, we never have to look at things like system health status, or load balancing and scaling, or how fast it is across the world. Everything is included in the package, and works really well.
- JavaScript support: Since we work on user experiences, we are mostly UI-engineering focused and use React+TypeScript every day. Our team can write frontend and backend code in the same language, which reduces cognitive load.
- Dogfooding opportunities: We help to test Workers at scale, which makes the product stronger.
Iteration #1: Sparrow and Trace Worker
Our analytics platform has gone through multiple iterations. The first version had two components – a JavaScript SDK called Sparrow, and a corresponding worker we call Trace.
Sparrow
The Sparrow SDK turns various data about product events into a consistent format, so internal users don’t need to understand API requirements further down the data pipeline.
Sparrow has 2 main features:
// tracks page visits
sparrow.pageview(pathname: string);

// tracks user interaction
sparrow.track(event: string, properties: Record<string, any>);
The pageview function can be run whenever a page loads in an application, which allows us to track where users navigate.
The track function is more generic. We can send any event name with any metadata. For example, the event name can be “purchase product” with properties: { product: “workers” }.
Both functions create a JSON object with the following interface and send it to the Trace Worker, which forwards it along to various analytics platforms:
{
  event: string,
  deviceId: string,
  userId?: string,
  properties: Record<string, any>
}
Trace Worker
The Trace Worker receives event data from Sparrow, checks payload correctness to make sure the request came from valid sources, and fans out the data to all connected analytics providers. The following diagram shows the pipeline.
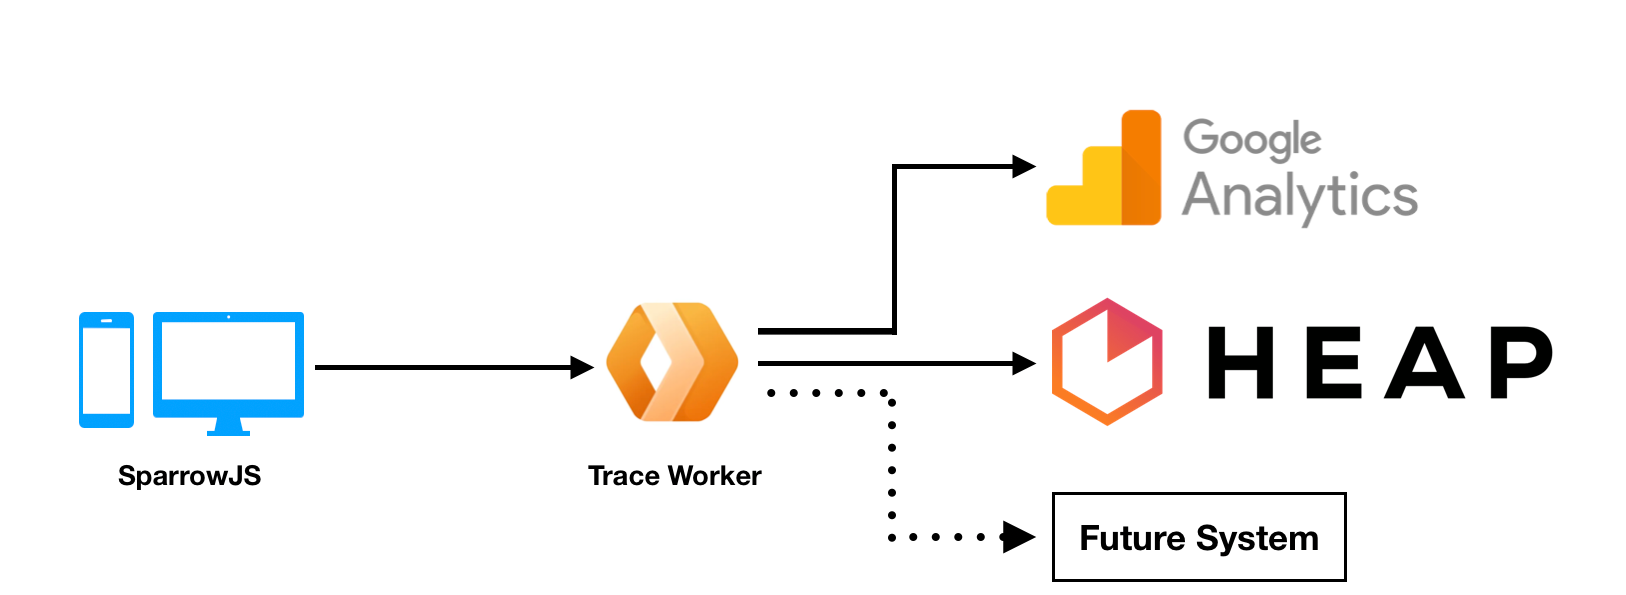
Any third-party vendor can be added to Trace Worker, as long as that vendor provides a REST API. How the data are parsed, transformed, and sent to those APIs is implemented by us in our custom functions we call trackers. Trackers aim to replicate the behavior of third-party scripts provided by these vendors. Why are we doing this when we can just use third-party scripts? The main reasons are security and data privacy.
- We use allowlists to explicitly define event names and event properties that can be sent further upstream. This helps us to prevent sending potentially sensitive information from cookies, URL query parameters, or data payloads. Every event and data property that is not in the allowlist is ignored.
- On top of that, all allowed properties are sanitized by our internal data scrubber.
- Always HTTPS: Some third-party scripts still use non-secure HTTP protocol. Trace Worker runs on HTTPS, and we make sure that outgoing requests are also using HTTPS.
- We fully control the code, which means there are no surprises – the code cannot update without us knowing it.
- Because the logic lives in the worker, our customers are not exposed to unnecessary client-side risks from using eval or document.write.
Another benefit is performance – because most of our analytics framework’s logic lives in the worker, there’s less JavaScript we need to send to the client, which means faster load times! SparrowJS on its own is super lightweight.
Here’s the simplified implementation of Trace Worker:
import trackers from ‘./trackers;
import { generateContext } from ‘./utils’;
Import { sanitize } from ‘./sanitizer’;

addEventListener(‘fetch’, event => {
  event.respondWith(handle(event));
}

async function handle(event: FetchEvent) {
  try {
    const payload = sanitize(await event.request.json());

    const context = await generateContext(event);


    // fan out
    event.waitUntil(Promise.allSettled(trackers.map(tracker => tracker[payload.event === “pageview” ? “pageview” : “event”](payload, context))));

    // return new Response(“OK”, { status:”OK”, statusCode: 200  })
  } catch (err) {
    // logging
    return new Response(“Something went wrong”, {
      status:”Internal Server Error”,
      statusCode: 500
    })
  }
}
trackers is an array of tracking functions for each third-party vendor. Under the hood, they transform the incoming requests from Sparrow and send them to each vendor’s REST APIs. For example, this is a simplified implementation of Google Analytics tracker that transforms Sparrow payloads to adhere to Measurement Protocol:
const URL = ‘https://www.google-analytics.com/collect’;

export async function event(event: TrackingEvent, context: Context) {
  return fetch(URL, {
    method: ‘POST’,
    body: new URLSearchParams({
      ...createCommonParams(context),
      t: ‘event’,
      ea: context.data.event,
      ec: context.data.properties.category || ‘Uncategorized Event’,
      el: context.data.properties.label,
    }).toString()
  });
}

export async function pageview(event: TrackingEvent, context: Context) {
  return fetch(URL, {
    method: ‘POST’,
    body: new URLSearchParams({
      ...createCommonParams(context),
      t: ‘pageview’,
      dp: context.data.event
    }).toString()
  });
}

function createCommonParams(context: Context) {
  return {
    tid: context.gaId,
    v: ‘1’,
    cid: context.data.deviceId,
    uid: context.data.userId,
    ...context.data.properties
  }
}
Similarly, Heap tracker implements its own transformation for https://heapanalytics.com/api/track.
As you may have noticed, Trace Worker is not your typical service worker. There is no origin service – Trace Worker is the service, except it runs everywhere in the network.
Problem: Nobody (still) trusts the data
Iteration #1 of our data analytics’ platform worked well for a while, but as more product teams used Sparrow to run their own analyses, we started getting reports of data not looking right. The reports were along the lines of:
- “Google Analytics underreports Heap by x percent…”
- “Product purchases are not consistent with DB…”
- “Signup conversion dropped by x percent, but we don’t think that’s actually happening…”
At the same time, we added another vendor – Amplitude, which made these problems even more complicated, because we now had three systems out of sync.
Due to the distributed nature of our analytics platform, we had a lot of potential breaking points. To find a solution, we needed to answer questions like:
Dashboard/Sparrow problems
- Are product teams using Sparrow correctly?
- Do we have any hard redirects that cause request cancellation? Should we try Beacon API and see what changes?
- How does Trace Worker respond?
Trace Worker problems
- Are we not catching some exceptions?
- Are we exceeding runtime limits?
- Are we hitting firewall/DDoS protection?
Third-party vendors problems
- Are they silently rejecting or not storing some payloads sent from Trace Worker? Google Analytics always responds with 200 OK to any request. How are other vendors handling requests?
- Are they having internal issues? How can we know, since these systems are blackboxes?
- Can we recover any lost data?
If we release Trace Worker and our event volume takes a nosedive, it’s a pretty strong clue that it’s caused by us and we should roll back.
But what if nothing unusual happens for a while, and then page views drop by 20%? 10%? 5%? Is it us, or third-party vendors, or just a nice sunny day in Europe and so people are not sitting behind their desks? As we had no source of truth to compare these data against, this was impossible to answer.
Regardless, we knew we had to get serious about observability before we even begin asking these questions. At the time, there was no wrangler tail or Workers analytics (there are now!). Also, even though we used Sentry, an app monitoring platform, our logger was a very basic wrapper around Sentry’s REST API, because there was no full-blown Sentry SDK for Workers runtime – the current SDKs use globals, causing race-conditions in Workers.
The goals were:
1. Get better at diagnosing our own problems – catch every exception in Trace Worker and every non-200 HTTP response from third-party vendors, and log it to some visible source, with some helpful stack-traces and other metadata like request headers and body.
2. Be able to isolate problems that may be happening outside of our codebase – have a single source of truth for all incoming/outgoing requests which we can query and compare against data in our third-party tools. This would help us discover dropped requests that weren’t represented with an error state.
Iteration #2: New Sentry SDK for Workers
To meet these goals, we implemented and open-sourced a new Sentry SDK for Workers called toucan-js. Toucan adheres to the Sentry unified API guidelines, so the interface is familiar from other SDKs (node/browser). It currently supports capturing errors and messages with stack-traces that can be enhanced with source maps, breadcrumbs, request data/headers/cookies, tags, and extra metadata.
Since we replaced our simple Sentry logger with toucan-js, every single log started having:
- Full request payload and some allowed headers
- Stack-trace with source maps
- Response status code and body (if applicable)
If anything goes wrong, we have all the information we need to reproduce and fix it – request body, headers, stack-trace, and all necessary context.
At the same time, we started sending cloned requests to the /debug/collect endpoint in Google Analytics Tracker that, combined with Sentry alerts, helped us find many dropped requests due to schema adherence problems such as “The value provided for parameter ‘cid’ is invalid.”
Iteration #3: The single source of truth
Better Sentry logs helped us with major drifts, but the data were still slightly off. While we observed some intermittent HTTP errors in Sentry, when we compared the number of these alerts with differences between different analytics platforms the numbers didn’t add up.
Due to this uncertainty, we decided to own the data layer, and create our own database – the single source of truth of all incoming payloads sent from Sparrow to Trace Worker before any transformation.
In order for us to trust the data in this ‘single source of truth’ database, the database needed to receive Sparrow payloads from outside of Trace Worker, preferably from a system that sits right in front of it, with minimal logic, that changes rarely, and that is highly available. Ideally, this system was to do three things – grab the incoming request payload, log it, and forward it to Trace Worker. These payloads should be logged raw, untouched, corresponding to whatever is sent from clients (SparrowJS).
The nice thing about this solution is that even if Trace Worker gets a bad release, we will not lose any data. Another strong case for us owning the data is that incidents in third-party vendors will not affect us anymore, because the solution will open the door for backfilling of dropped requests.
We considered Workers KV — Cloudflare’s low latency key-value store hosted at the network edge — for our storage needs, but being able to query the data was really important for us, because we wanted to diagnose complex problems quickly and select the data based on some property. For this reason, we went in a different direction.
Google BigQuery was our storage solution
We decided to use Google BigQuery for our ‘single source of truth’ database because:
- It was designed for big data
- It lets us use SQL to query what we need
- We can use REST API in our new system to send the logs
Of course, Google BigQuery is a columnar database. How would we use it to store JSON data?
The first option was to write some kind of transformer that would map every object property to a column, but that was against our requirement of a system with minimal logic. The set of allowed characters we could use to name a column was also limited, so we wouldn’t be able to map column names back to original properties.
Due to these limitations we decided to store raw json strings, and use JSON functions to build views on top of these data.
First, we created a partitioned-by-day table called raw with the following schema:
| Field name | Type |
|---|---|
| eventId | STRING |
| timestamp | TIMESTAMP |
| data | STRING |
Sparrow’s payloads are stored in the data field as stringified JSON.
We don’t run queries against this table directly. Instead, we built a view called raw_normalized that looks something like this:
select
  json_extract_scalar(data, '$.event') as event,
  json_extract_scalar(data, '$.deviceId') as deviceId,
  json_extract_scalar(data, '$.userId') as userId,
  json_extract_scalar(data, '$.properties.category') as category,
  json_extract_scalar(data, '$.properties.productName) as productName
from raw;
With this setup, we can write complex SQL queries while retaining the original JSON values. To demonstrate on a simple example, when we insert a row with data being:
{
  event: “purchase product”,
  deviceId: “desktop1”,
  userId: “michelle1”,
  properties: { category: “billing”, productName: “workers” }
}
and then run:
select * from data_normalized where event = ‘purchase product’;
we get:
| event | deviceId | userId | category | productName |
|---|---|---|---|---|
| purchase product | desktop1 | michelle1 | billing | workers |
We had our data layer prepared. But how to actually push the data into BigQuery?
Dispatcher Worker
We created another worker, the Dispatcher, that sits in front of Trace Worker! As we said earlier, the sole purpose of Dispatcher Worker is to:
- Read the incoming request body
- Send it to BigQuery
- Forward the incoming request to Trace Worker
The architecture changed to:

Here’s a simplified implementation:
import Toucan from 'toucan-js';
import { BigQueryClient } from “./bigquery”;

const bigQuery = new BigQueryClient({
  serviceAccountEmail: SERVICE_ACCOUNT_EMAIL,
  serviceAccountSecret: SERVICE_ACCOUNT_SECRET,
  projectId: PROJECT_ID,
  datasetId: DATASET_ID
});

addEventListener('fetch', event => {
  const toucan = new Toucan({dsn: DSN, event});

  // do the work without blocking the response
  event.waitUntil(dispatch(event, biqQuery, toucan));

  event.respondWith(return new Response('OK', {
      status: 200,
      statusText: 'OK'
  });
});

async function dispatch(event: FetchEvent, bigQuery: BigQueryClient, toucan: Toucan) {
  try {
     // Original request to be sent to Trace Worker
    const requestOriginal = event.request;

    // We clone the request here to allow multiple uses of Body
    const requestClone = requestOriginal.clone();

    // read the request payload
    const payload = await requestClone.text();

    // create a timestamp
    const timestamp = Date.now();

    // send to BQ
    const bigQueryResponse = await bigQuery.insertRow({timestamp, json: payload});

    // log failed logs
    if (!bigQueryResponse.ok) {
       sentry.captureException(await HttpError.fromResponse(bigQueryResponse));
    }

    // send to trace worker
    const traceResponse = await fetch(TRACE_WORKER_URL, requestOriginal)

    // log failed logs
    if (!traceResponse.ok) {
       toucan.captureException(await HttpError.fromResponse(traceResponse));
    }
  } catch (err) {
   toucan.captureException(err);
  }
}
BigQueryClient is a lightweight SDK we implemented to be able to send data to BigQuery. Internally, it builds a request and sends it to Google Cloud Platform using their Stream API. We won’t go into details, but we want to briefly cover how we handle authentication.
Google Cloud APIs use the OAuth 2.0 protocol for authenticating both user accounts and service accounts. In short, the protocol involves building a signed JWT (JSON Web Token), sending it to Google Authorization Server to obtain access token, and sending that access token with all requests to GCP API.
We tried a few libraries to help us build that JWK (such as jsonwebtoken), but they were too slow due to their RSA implementation, and we were hitting runtime limits. So we implemented our own JWT builder using SubtleCrypto, which is a web standard that is also implemented in Cloudflare Workers!
JSON Web Tokens consist of 3 parts:
- Header
- Body
- Signature
First, we build the header:
const tokenHeader = base64UrlEncode(JSON.stringify({
  alg: ‘RS256’,
  typ: ‘JWT’
}));
Then we build the token body, and concatenate with the header to build the token base:
const nowSeconds = Date.now() / 1000;
const tokenTtl = 3600;
const expire = nowSeconds + tokenTtl;

const tokenBody = base64UrlEncode(JSON.stringify({
  iss: SERVICE_ACCOUNT_EMAIL,
  scope : ‘https://www.googleapis.com/auth/bigquery.insertdata’
  aud: ‘https://www.googleapis.com/oauth2/v4/token’,
  exp: expire,
  iat: nowSeconds
}));

const tokenBase = `${tokenHeader}.${tokenBody}`;
All that’s left is signing the token base:
const signature = base64UrlEncode(
  arrayBufferToString(
    await crypto.subtle.sign(
      {
        name: ‘RSASSA-PKCS1-v1_5’,
        hash: { name: ‘SHA-256’ }
      },
     SERVICE_ACCOUNT_JWK,
     new TextEncoder.encode(tokenBase)
    )
  )
);

const jwt = `${tokenBase}.${signature}`;
Once we have the JWT, our SDK sends a request to the Authorization Server to retrieve the access token:
const token = await (await fetch (‘https://www.googleapis.com/oauth2/v4/token’, {
  method: ‘POST’,
  body: 'grant_type=urn%3Aietf%3Aparams%3Aoauth%3Agrant-type%3Ajwt-bearer&assertion=' + jwt,
  headers: { ‘content-type’: ‘application/x-www-form-urlencoded’ }
})).json();
The access token doesn’t need to be requested with every FetchEvent – it can be reused until it expires. Caching the token helps with performance, because RSA encryption is costly.
BigQueryClient stores the access token in a global variable, so all isolates that share the environment can use it. In fact, that’s the reason we initialize BigQueryClient outside of addEventListener. The SDK manages the token internally and handles the OAuth2 ceremony for the clients – the first call of insertAll generates a JWT to retrieve and store an access token, but subsequent calls of insertAll use the access token from the memory.
With all the pieces put together, this is the state of our analytics pipeline today.
Future work: Risk management
Logging all data gives us great visibility and makes debugging easier. We now have a clear picture of where in the pipeline the problems are, and we have all possible information to fix them. We can react to problems pretty well, but we would like to get better at preventing problems in production before they happen.
We currently have two environments: staging and production. Our staging environment is behind Cloudflare Access, only accessible to Cloudflare employees. When we merge our changes, the CI pipeline automatically deploys them to the staging environment where we can test these changes before they get to production.
While our staging environment helps us with catching catastrophic errors early, it’s not too great for finding errors that may cause partial data drops, because the staging traffic is generally very low, which makes it harder to spot changes in data patterns. From this perspective, our releases are very risky.
To reduce these risks, we need to test our changes with production traffic. We can achieve that with a variant of blue-green deployment approach, ensuring we have two production environments, as identical as possible. We could use another Worker, sitting in front of Blue and Green Dispatcher Workers, receiving live traffic and duplicating all requests to blue/green variants. One of these variants, green for example, would be using live code and live data sources, and the other one, blue, would be in the final stage of testing, with our new code, logging to the staging data sources. Once we validate the data in staging data sources, we can easily cut-over by switching data sources between green and blue.
Future work: Durability
Outages of third-party vendors don’t affect us anymore, since we essentially own the data layer and can backfill dropped events once a vendor is fixed and back online.
This presents us with a question: How can we automate this with Workers?
How can we make sure that everything in our source of truth will eventually get stuffed to the analytics tools?
Can we implement a true distributed and durable streaming platform like Kafka at the edge?
We think we can! More about this next time.