Post Syndicated from Ying Wang original https://aws.amazon.com/blogs/big-data/building-an-administrative-console-in-amazon-quicksight-to-analyze-usage-metrics/
Given the scalability of Amazon QuickSight to hundreds and thousands of users, a common use case is to monitor QuickSight group and user activities, analyze the utilization of dashboards, and identify usage patterns of an individual user and dashboard. With timely access to interactive usage metrics, business intelligence (BI) administrators and data team leads can efficiently plan for stakeholder engagement and dashboard improvements. For example, you can remove inactive authors to reduce license cost, as well as analyze dashboard popularity to understand user acceptance and stickiness.
This post demonstrates how to build an administrative console dashboard and serverless data pipeline. We combine QuickSight APIs with AWS CloudTrail logs to create the datasets to collect comprehensive information of user behavior and QuickSight asset usage patterns.
This post provides a detailed workflow that covers the data pipeline, sample Python code, and a sample dashboard of this administrative console. With the guidance of this post, you can configure this administrative console in your own environment.
Let’s look at Forwood Safety, an innovative, values-driven company with a laser focus on fatality prevention. An early adopter of QuickSight, they have collaborated with AWS to deploy this solution to collect BI application usage insights.
“Our engineers love this admin console solution,” says Faye Crompton, Leader of Analytics and Benchmarking at Forwood. “It helps us to understand how users analyze critical control learnings by helping us to quickly identify the most frequently visited dashboards in Forwood’s self-service analytics and reporting tool, FAST.”
Solution overview
The following diagram illustrates the workflow of the solution.
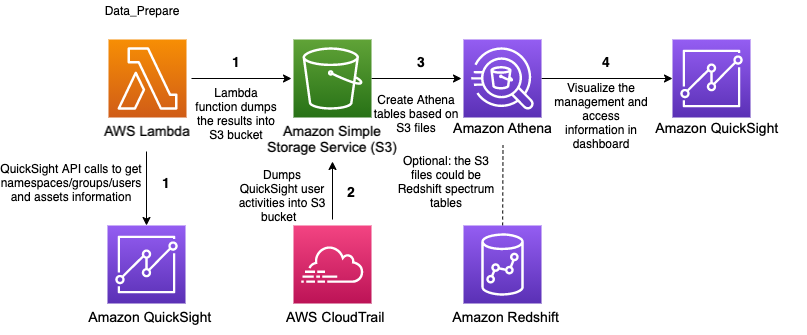
The workflow involves the following steps:
- The AWS Lambda function
Data_Prepareis scheduled to run hourly. This function calls QuickSight APIs to get QuickSight namespace, group, user, and assets access permissions information and saves the results to an Amazon Simple Storage Service (Amazon S3) bucket. - CloudTrail logs are stored in S3 bucket.
- Based on the file in Amazon S3 that contains user-group information, the QuickSight assets access permissions information, as well as view dashboard and user login events in CloudTrail logs. Three Amazon Athena tables and several views are created. Optionally, the BI engineer can combine these two tables with employee information tables to display human resource information of the users.
- Two QuickSight datasets fetch the data in the Athena tables created in Step 3 through SPICE mode. Then, based on these datasets, a QuickSight dashboard is created.
Prerequisites
For this walkthrough, you should have the following prerequisites:
- An AWS account
- Access to the following AWS services:
- Amazon QuickSight
- Amazon Athena
- AWS Lambda
- Amazon S3
- Basic knowledge of Python
- Optionally, Security Assertion Markup Language 2.0 (SAML 2.0) or OpenID Connect (OIDC) single sign-on (SSO) configured for QuickSight access
Creating resources
Create your resources by launching the following AWS CloudFormation stack:
![]()
After the stack creation is successful, you have one Amazon CloudWatch Events rule, one Lambda function, one S3 bucket, and the corresponding AWS Identity and Access Management (IAM) policies.
To create the resources in a Region other than us-east-1, download the Lambda function.
Creating Athena tables
The Data_Prepare Lambda function is scheduled to run hourly with the CloudWatch Events rule admin-console-every-hour. This function calls the QuickSight APIs list_namespaces, list_users, list_user_groups, list_dashboards, list_datasets, list_datasources, list_analyses, list_themes, describe_data_set_permissions, describe_dashboard_permissions, describe_data_source_permissions, describe_analysis_permissions, and describe_theme_permissions to get QuickSight users and assets access permissions information. Finally, this function creates two files, group_membership.csv and object_access.csv, and saves these files to an S3 bucket.
Run the following SQL query to create two Athena tables (group_membership and object_access):
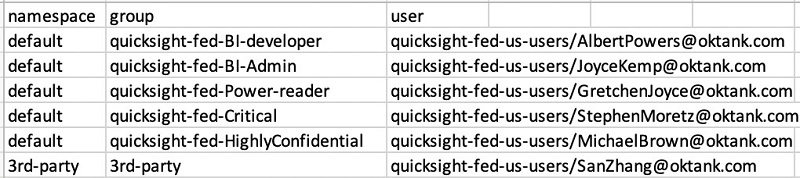
The following screenshot is sample data of the group_membership table.
The following screenshot is sample data of the object_access table.

For instructions on building an Athena table with CloudTrail events, see Amazon QuickSight Now Supports Audit Logging with AWS CloudTrail. For this post, we create the table cloudtrail_logs in the default database.
Creating views in Athena
Now we have the tables ready in Athena and can run SQL queries against them to generate some views to analyze the usage metrics of dashboards and users.
Create a view of a user’s role status with the following code:
Create a view of GetDashboard events that happened in the last 3 months with the following code:
In the preceding query, the conditions defined in the where clause only fetch the records of GetDashboard events of QuickSight.
How can we design queries to fetch records of other events? We can review the CloudTrail logs to look for the information. For example, let’s look at the sample GetDashboard CloudTrail event:
With eventSource=“quicksight.amazonaws.com” and eventName=“GetDashboard”, we can get all the view QuickSight dashboard events.
Similarly, we can define the condition as eventname = ‘AssumeRoleWithSAML‘ to fetch the user login events. (This solution assumes that the users log in to their QuickSight account with identity federation through SAML.) For more information about querying CloudTrail logs to monitor other interesting user behaviors, see Using administrative dashboards for a centralized view of Amazon QuickSight objects.
Furthermore, we can join with employee information tables to get a QuickSight user’s human resources information.
Finally, we can generate a view called admin_console with QuickSight group and user information, assets information, CloudTrail logs, and, optionally, employee information. The following screenshot shows an example preview.

Creating datasets
With the Athena views ready, we can build some QuickSight datasets. We can load the view called admin_console to build a SPICE dataset called admin_console and schedule this dataset to be refreshed hourly. Optionally, you can create a similar dataset called admin_console_login_events with the Athena table based on eventname = ‘AssumeRoleWithSAML‘ to analyze QuickSight users log in events. According to the usage metrics requirement in your organization, you can create other datasets to serve the different requests.
Building dashboards
Now we can build a QuickSight dashboard as the administrative console to analyze usage metrics. The following steps are based on the dataset admin_console. The schema of the optional dataset admin_console_login_events is the same as admin_console. You can apply the same logic to create the calculated fields to analyze user login activities.
- Create parameters.
For example, we can create a parameter called InActivityMonths, as in the following screenshot. Similarly, we can create other parameters such as
 InActivityDays, Start Date, and End Date.
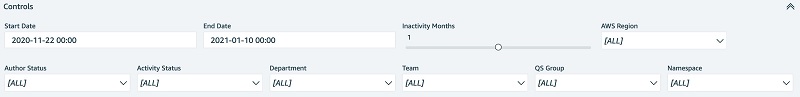
- Create controls based on the parameters.
- Create calculated fields.
For instance, we can create a calculated field to detect the active or inactive status of QuickSight authors. If the time span between the latest view dashboard activity and now is larger or equal to the number defined in the Inactivity Months control, the author status is Inactive. The following screenshot shows the relevant code.
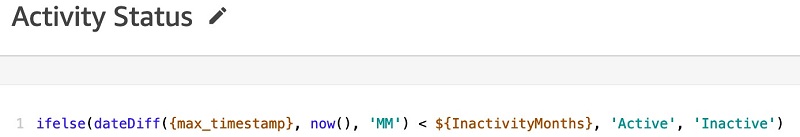
According to end user’s requirement, we can define several calculated fields to perform the analysis.
- Create visuals.
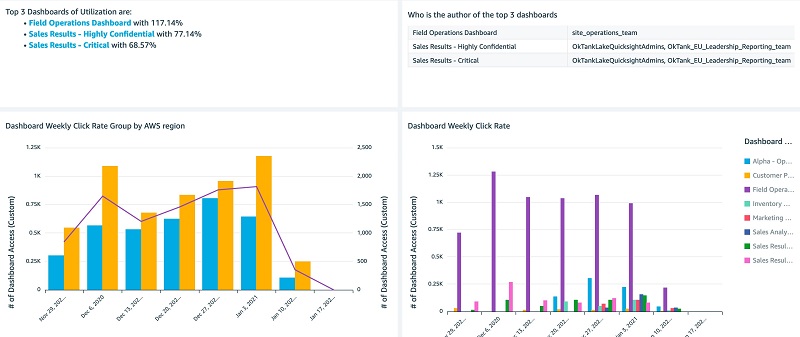
For example, we create an insight to display the top three dashboards view by readers and a visual to display the authors of these dashboards.

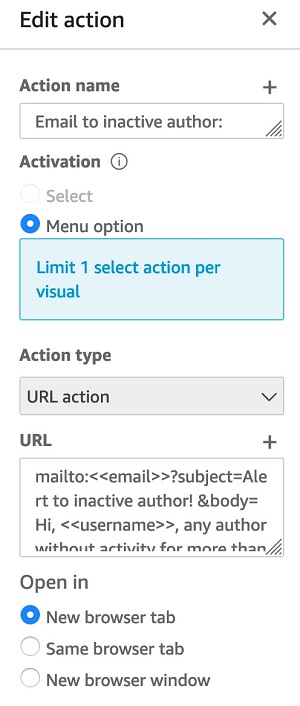
- We can add URL action to define some extra features to email inactive authors or check details of users.
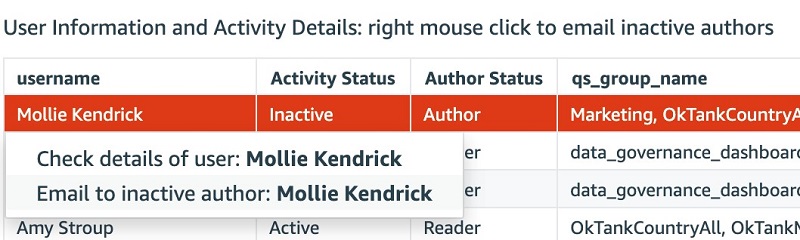
The following sample code defines the action to email inactive authors:
The following screenshots show an example dashboard that you can make using our data.
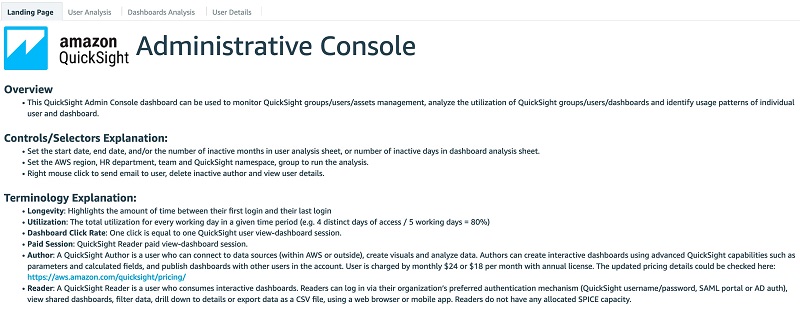
The following is the administrative console landing page. We provide the overview, terminology explanation and thumbnails of the other two tabs in this page.
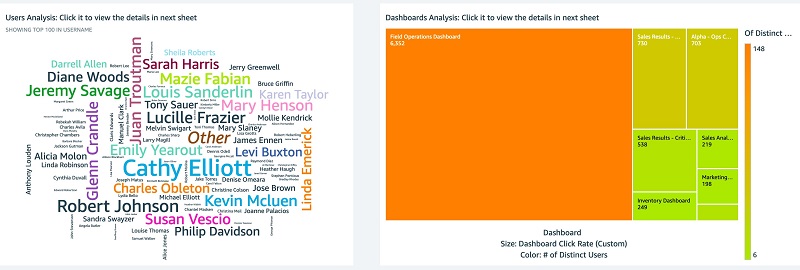
The following screenshots show the User Analysis tab.

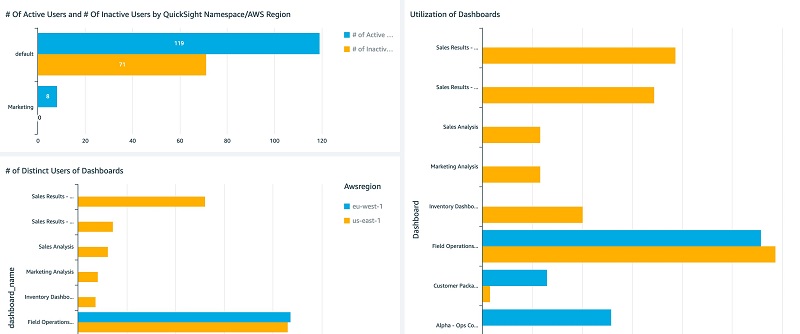
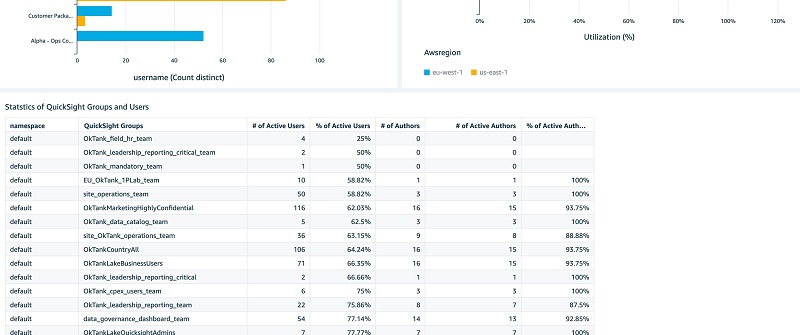
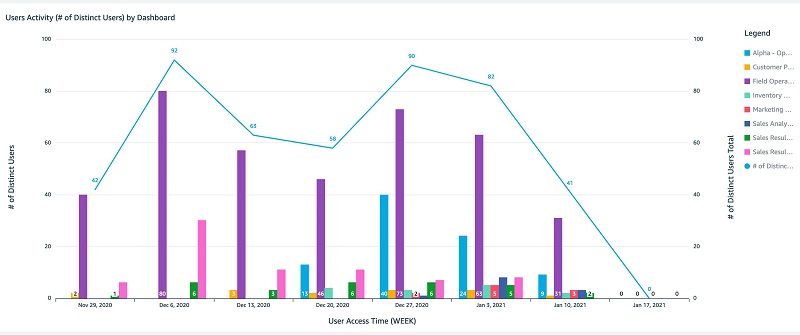
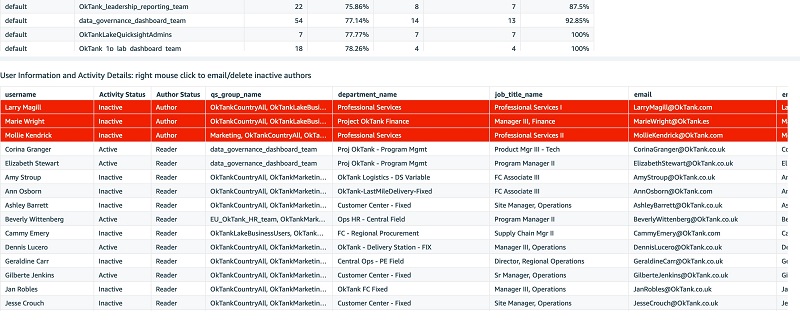 The following screenshots show the Dashboards Analysis tab.

 You can interactively play with the sample dashboard in the following Interactive Dashboard Demo.
You can reference to public template of the preceding dashboard in create-template, create-analysis, and create-dashboard API calls to create this dashboard and analysis in your account. The public template of this dashboard with the template ARN is 'TemplateArn': 'arn:aws:quicksight:us-east-1:889399602426:template/admin-console'.
Additional usage metrics
Additionally, we can perform some complicated analysis to collect advanced usage metrics. For example, Forwood Safety raised a unique request to analyze the readers who log in but don’t do any viewing of dashboard actions (see the following code). This helps their clients identify and prevent any wasting of reader sessions fees. Leadership teams value the ability to minimize uneconomical user activity.
Cleaning up
To avoid incurring future charges, delete the resources you created with the CloudFormation template.
Conclusion
This post discussed how BI administrators can use QuickSight, CloudTrail, and other AWS services to create a centralized view to analyze QuickSight usage metrics. We also presented a serverless data pipeline to support the administrative console dashboard.
You can request a demo of this administrative console to try for yourself.
About the Authors
 Ying Wang is a Data Visualization Engineer with the Data & Analytics Global Specialty Practice in AWS Professional Services.
 Jill Florant manages Customer Success for the Amazon QuickSight Service team