Post Syndicated from Anand Sakhare original https://aws.amazon.com/blogs/big-data/implement-row-level-security-using-a-complete-ldap-hierarchical-organization-structure-in-amazon-quicksight/
In a world where data security is a crucial concern, it’s very important to secure data even within an organization. Amazon QuickSight provides a sophisticated way of implementing data security by applying row-level security so you can restrict data access for visualizations.
An entire organization may need access to the same dashboard, but may also want to restrict access to the data within the dashboard per the organization’s hierarchical structure. For instance, vice presidents need visibility into all data within their organization, team managers need to see the data related to all their direct reports, and an individual contributor just needs to see the their own data. Creating and maintaining these data security rules can be laborious if managed manually.
In this post, we go into the details of how to extract the organizational hierarchical structure from Lightweight Directory Access Protocol (LDAP) data, flatten it, and create a row-level security permissions file to mimic the same level of hierarchical access controls to a QuickSight dataset. We show this with mock datasets of the LDAP data and ticketing data, and use that data to implement user-level access on QuickSight visualizations and datasets.
Overview of solution
In this post, we demonstrate processing LDAP data and implementing row-level security to control user-level access according to organizational hierarchies. We demonstrate with a sample dataset how to dynamically change the data behind visualizations. We also talk about automatically creating the permissions file required for implementing security on QuickSight visualizations using the LDAP data. Additionally, we create a sample dashboard and apply the generated permissions file to manage data access for the users.
LDAP hierarchical data (employee dataset)
We use sample LDAP data, which is a mock organizational hierarchical structure. Sample code to generate the hierarchical data is available on the GitHub repo.
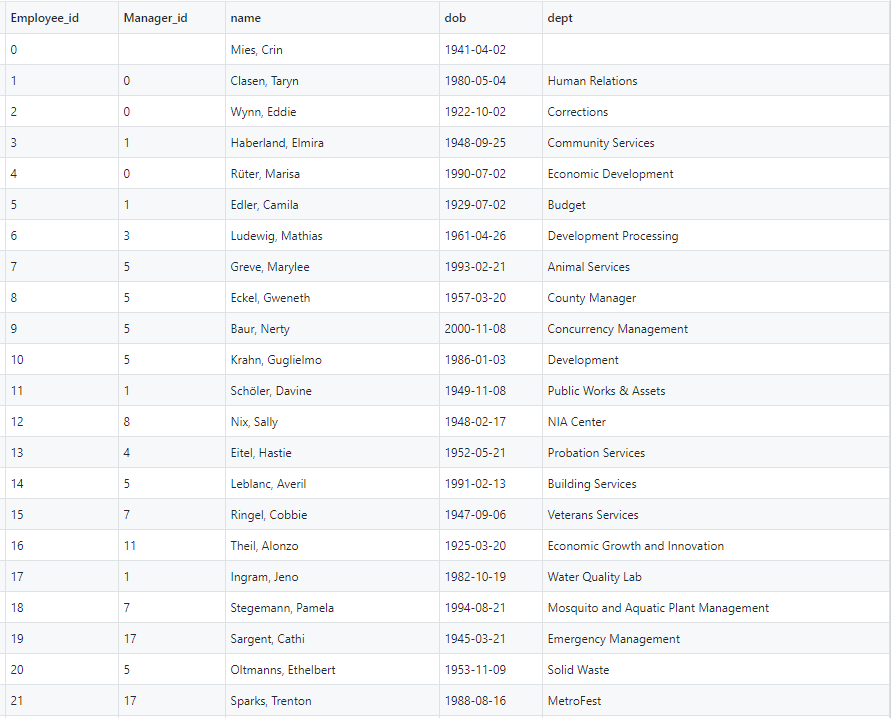
The basic idea is we have a hierarchical dataset where an employee-manager or employee-supervisor relationship exists. In our sample dataset, we have employee_id and manager_id columns, which represent the employee-manager relationship. The following screenshot is the hierarchical representation of the first few employees in the dataset and the first few rows in the table. The data shows “Mies, Crin” (employee_id 0) is the root user. In our mock data, employee IDs range from 0–249, with 10 levels of hierarchies.
The following screenshot shows the hierarchical structure of the sample data.

Ticketing dataset
Our randomly generated sample ticketing dataset has about 250 tickets (see the following screenshot). Each of these tickets is assigned to an employee. The column assigned_to_emp_id represents the employee that the ticket is assigned to. The code to generate a random sample of the data is available on the GitHub repo.
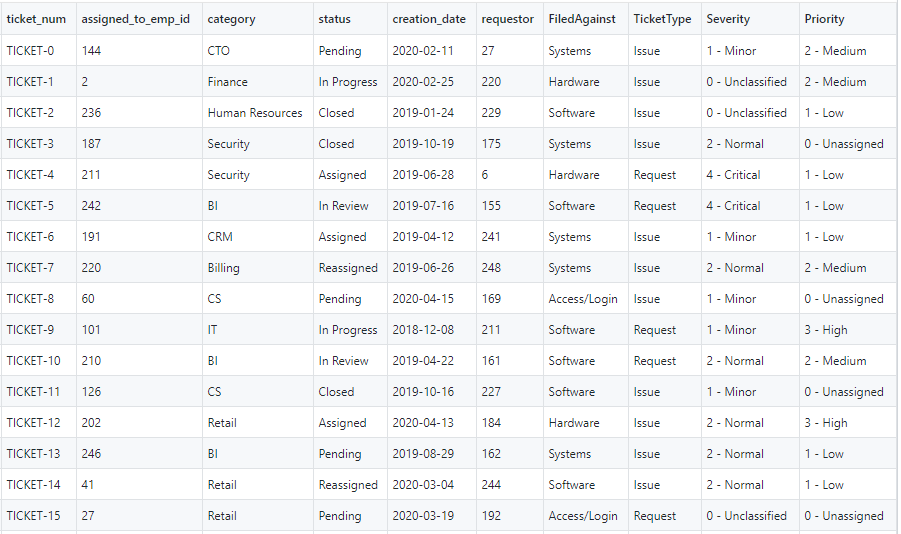
We can replace emp_id with any unique identifier such as UID, RACF ID, email ID, and so on.
Sample organizational structure
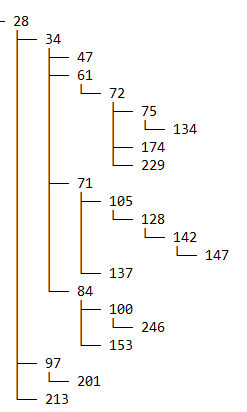
The row-level security that we talk about in the next sections ties back to these two datasets. For example, tickets assigned to any employee ID present in the column assigned_to_emp_id should only be visible to the employees that are higher in that employee’s hierarchy. Tickets assigned to employee ID 18 can only be viewed by employee IDs 18, 7, 5, 1, and 0, because employee ID 18 directly or indirectly reports to them. The following screenshot shows an example of the hierarchy.

Preprocess ticketing data by flattening hierarchical relationships
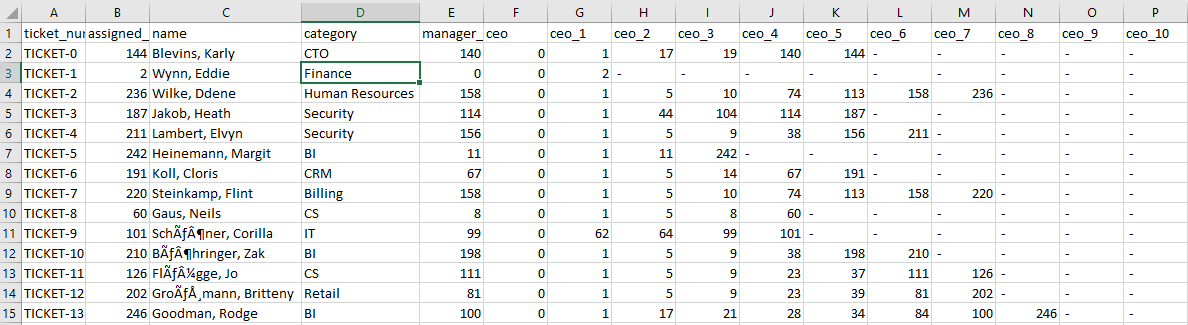
We first need to flatten the LDAP data to get the employee IDs in the hierarchy in a row. This flattened data needs to be refreshed to account for any organizational changes, such as new employees onboarding. In this example, we use the SYS_CONNECT_BY_PATH function on an Amazon Relational Database Service (Amazon RDS) database to achieve that. We can achieve the same result programmatically or by using common table expressions (CTEs) in Amazon Redshift. The goal is to create 10 columns containing the complete path from that employee to the highest-level manager. Not every employee has a value in every column, assuming the employee isn’t at the lowest level of the hierarchy. A given employee ID appears on their own row, as well as rows for employees they’re a direct or indirect manager of. We query the data with the following code:
The following screenshot shows the query output.

The following screenshot shows an example of the hierarchy for employee ID 147.
For employee ID 147, we can see the employees in the hierarchy are organized in columns with their levels. Employee ID 147 reports to 142, 142 reports to 128, and so on. Similarly, for employee ID 142, we can see that the employees above 142 are present in their respective columns.
Join the ticketing data with the flattened LDAP data
To get to the final dataset that we need for visualizations, we need to join the ticketing data with the LDAP data with flattened hierarchies. For our demo, we created two tables, Tickets and Employees, and copied the data we showed earlier to these tables using an Amazon Redshift copy command from Amazon Simple Storage Service (Amazon S3). The following is a sample output of the join query between these tables. This dataset is what we import into SPICE in QuickSight. SPICE is QuickSight’s Super-fast, Parallel, In-memory Calculation Engine, and it’s engineered to rapidly perform advanced calculations and serve data.
The following screenshot shows our flattened data.
Create the permissions file
You can use the following code snippet to create the permissions file needed to apply row-level security on your dataset in QuickSight:
The input to this function is a list of your employee IDs. These employee IDs appear as owners in the ticketing data as well. There are multiple ways to get the data. If the ticketing data ownership is related to any other user-specific information such as email ID or any unique identifier, then a list of that information is the input to this function. The second input is the number of levels your organization has (integer value). The goal is to create a CSV file to use as a permissions file for your dataset in QuickSight.
Assume there are 10 hierarchical levels in your organization. The output permissions file looks something like the following screenshot.

Create QuickSight analyses
We now apply the permission file to the QuickSight dataset. For instructions, see Using Row-Level Security (RLS) to Restrict Access to a Dataset.
Now we create a sample visualization to show the specific tickets owned by an employee or their reportees.
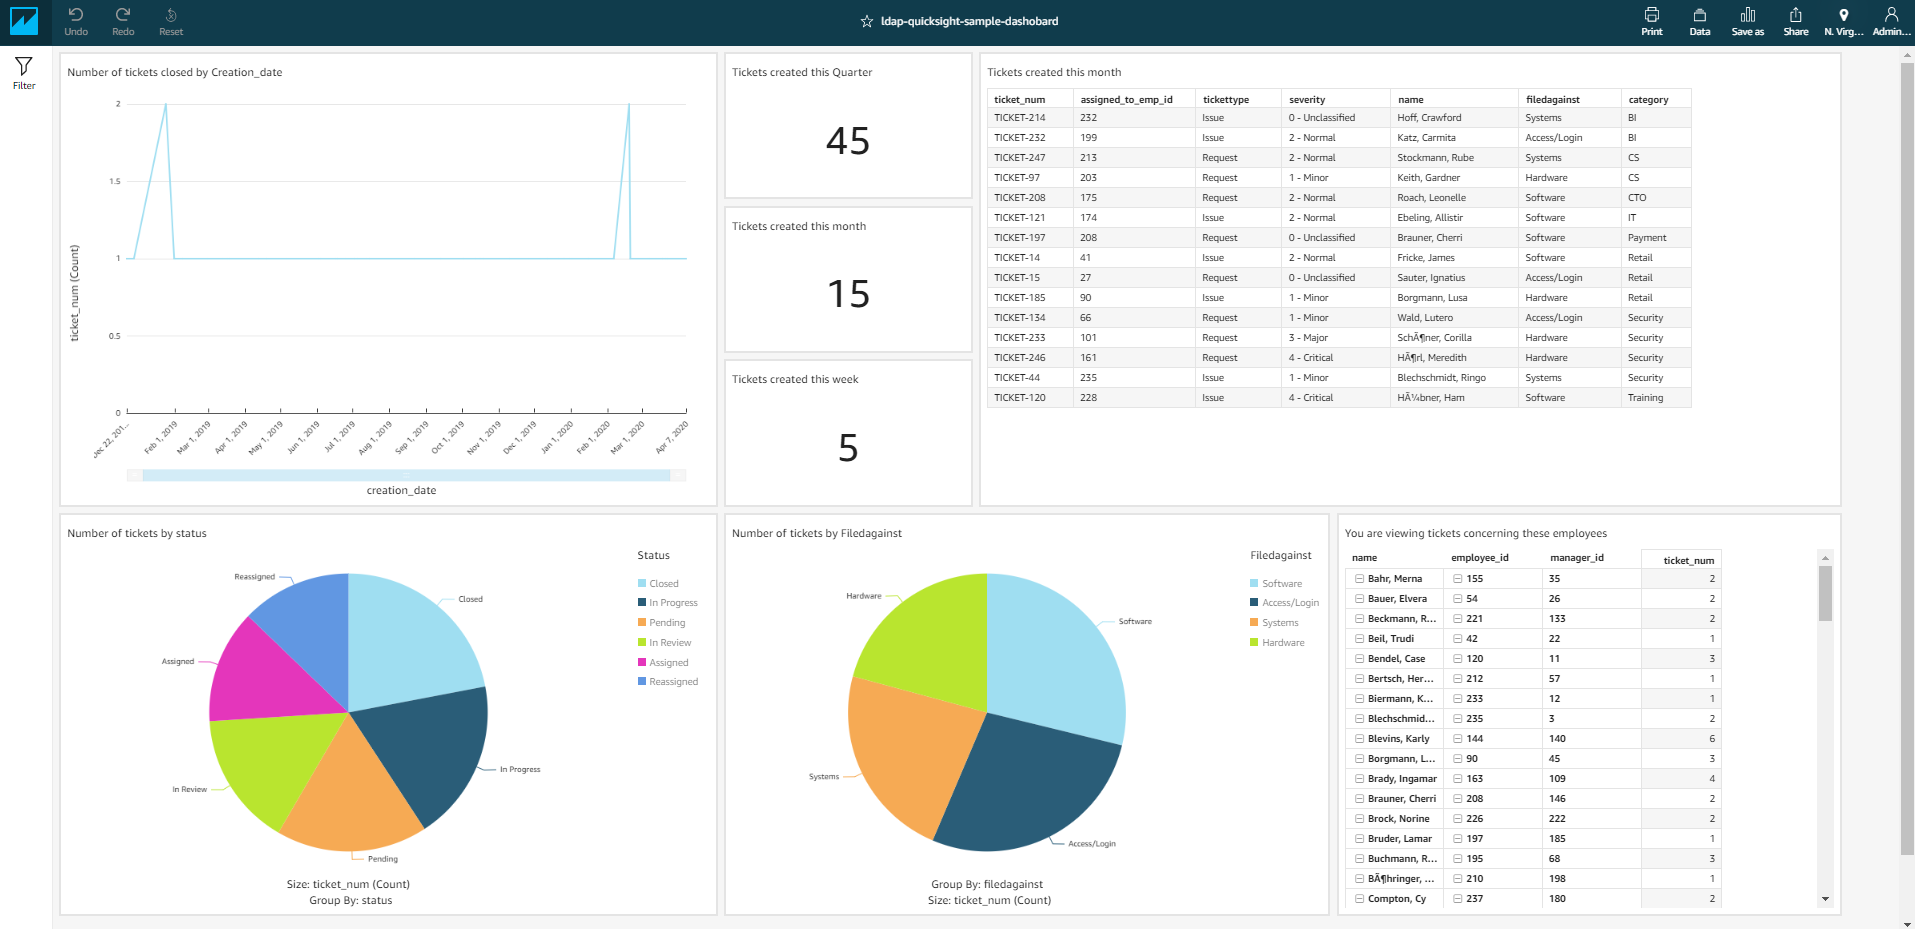
After we import the permissions file and apply it to the final dataset (created by joining the ticketing data with the flattened LDAP data) in SPICE, we’ve created the following visualization. The goal is to verify that when different users log in and see the visualization, they see the same visualization with different data, in this case the only tickets that concern them.
The following screenshot shows the visualization without any row-level security.
For our hierarchy, we’ve created QuickSight users with usernames that are the same as their employee IDs (the employee with ID 142 has the QuickSight username 142; this can easily be replaced by any unique identifiers your organization uses). We log in with employee IDs 232, 147, 61, 84, and 28, and verify that they only see the tickets that concern them. In the visualization “You are viewing tickets concerning these employees,” we can see whose tickets the logged-in user is authorized to see. Because the mocked data only consists of around 250 tickets randomly assigned to 250 employees, some visualizations may show no data.
The following screenshot shows the example hierarchy. Employee ID 232 is a leaf node (nobody reports to them).
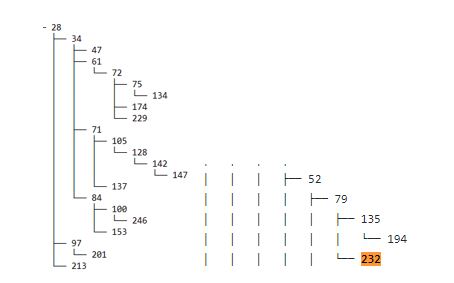
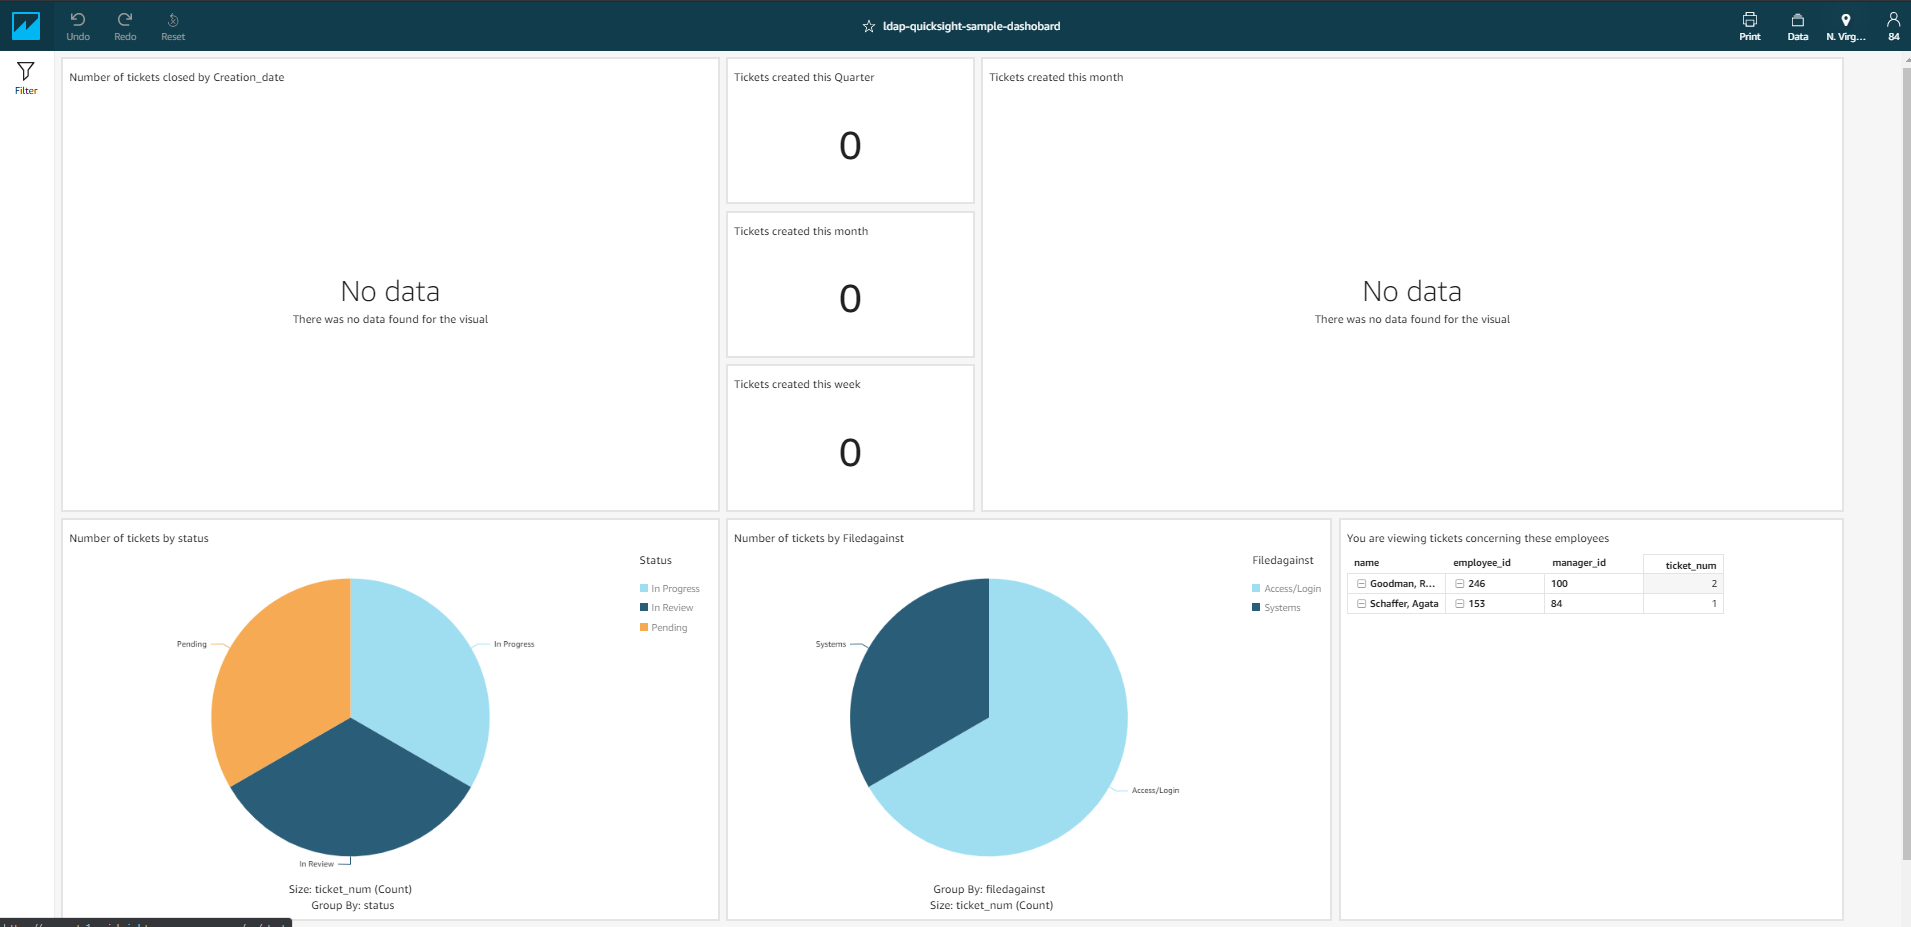
Employee 232 is only authorized to view their own tickets, as shown in the following visualization.

Similarly, because employee ID 147 is also a leaf node, they can only view their assigned tickets.

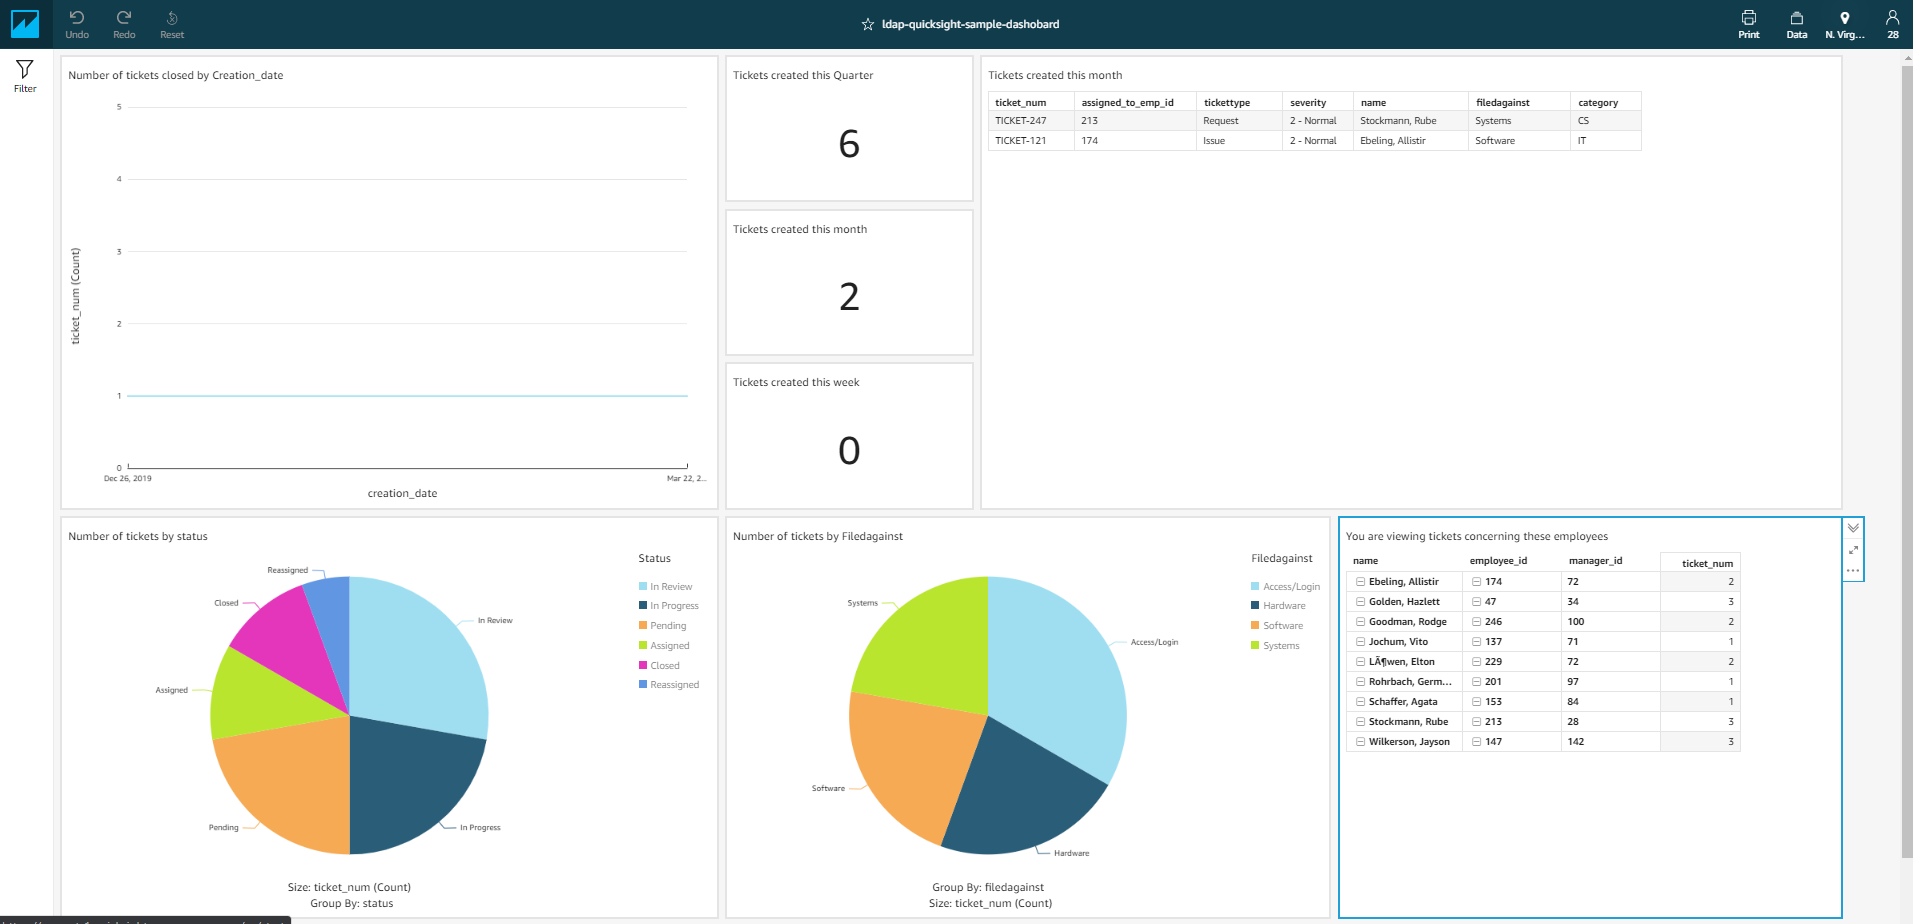
In our example hierarchy, employee IDs 72, 75, 174, 229, and 134 report to employee 61. In our dataset, only four tickets are assigned to those employees. The following screenshot shows the tickets of concern to employee ID 61.

The following screenshot shows the visualizations visible to employee ID 61.

Similarly, when we log in with employee IDs 84 and 28, we can verify that they only see the tickets concerning them.
Publish the dashboard
You can use the share function to publish the analysis to a dashboard and share the data with stakeholders.
Clean up
To avoid incurring future charges, make sure to remove resources you created when you’re done using them.
Conclusion
Data security is an important concern for many organizations. This solution is an easy way to use organizational LDAP data to implement data security with row-level security in QuickSight. With organizational restructuring, hierarchies are bound to change with time. Therefore, the LDAP data can be dumped on a periodic basis and be updated in the respective Amazon Redshift table. This enables users to have better visibility in the data within their organizational hierarchy.
About the Author
 Anand Sakhare is a Big Data Architect with AWS. He helps customers build big data, analytics, and machine learning capabilities using a mix of technologies. He is passionate about innovation and solving complex problems.
 Rohan Jamadagni is a Sr. Data Architect, working with AWS for the past 5 years. He works closely with customers to implement data and analytics solutions on AWS. He enjoys understanding the meaning behind data and helping customers visualize their data to provide meaningful insights.
 Umair Nawaz is a DevOps Engineer at Amazon Web Services in New York City. He works on building secure architectures and advises enterprises on agile software delivery. He is motivated to solve problems strategically by utilizing modern technologies.