Post Syndicated from Anand Sakhare original https://aws.amazon.com/blogs/big-data/automate-amazon-quicksight-user-and-group-management-using-ldap-data-for-row-level-security/
In any business intelligence system, securing and restricting access to the data is important. For example, you might want a particular dashboard to only be viewed by the users with whom the dashboard has been shared, yet customize the data displayed on that dashboard per user by implementing row-level security. With row-level security, you can grant and restrict access to only specific rows, all rows, or no rows of any dataset.
Organizations typically want to display different data to users within different business units. To do this, we need to traverse the organizational hierarchy to find the ultimate business owner for each employee. This post goes into the details of how we can use Lightweight Directory Access Protocol (LDAP) data to find what business unit each employee belongs to, and how we can apply data restriction using row-level security at an Amazon QuickSight group level rather than at an individual user level.
Additionally, this post explains how to automate user and group management within QuickSight to add or remove a QuickSight group or a user to a group.
Architectural overview
The following diagram illustrates the solution architecture.
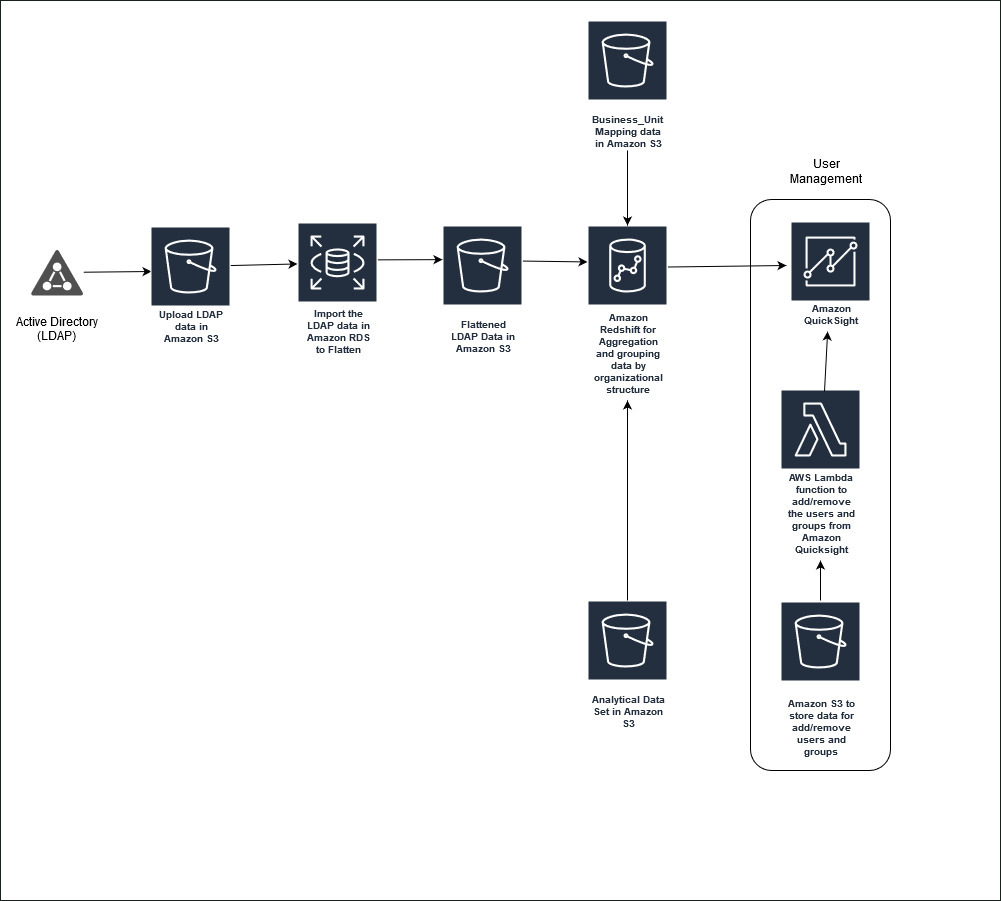
The solution has two parts:
- We first move data from an LDAP data store to Amazon Redshift or any other QuickSight supported data source, flatten it and integrate it with existing analytical data, and create a joined result set matching the organizational hierarchy
- Then we automate the user and group management, which we apply to the permission file in QuickSight to dictate access to a particular dataset
We demonstrate this with a fictitious IT support ticketing system. This system tracks who is creating a particular support ticket and who is working on that ticket. We use QuickSight to visualize trends like number of tickets worked on by a particular assignment group, number of open vs. closed tickets, and so on for a particular business unit. We use row-level security to demonstrate different levels of access and how the same dataset changes for a super user like a president of a company overseeing multiple business units vs. a manager of a particular business or a direct report working on the actual tickets.
Solution overview
We extract and dump the LDAP dataset into Amazon Simple Storage Service (Amazon S3). This dataset can be a direct database dump. The LDAP dataset is usually not flattened and can’t be directly queried to find the reporting hierarchy of a particular employee. To flatten the directory structure, we load the data in an Amazon Relational Database Service (Amazon RDS) instance that supports recursive SQLs. Optionally, we can also flatten the LDAP data using AWS Glue with Apache Spark. The flattened LDAP data is written back into Amazon S3 and then loaded into Amazon Redshift or a QuickSight supported data store. This portion of loading to Amazon S3 and then to Amazon Redshift is optional if the QuickSight data source you’re using supports running recursive SQLs.
The flattened LDAP structure table should now consist of a user column, their manager, and who they report to, up to a vice president in the organization hierarchy. This is then joined with the ticketing system dataset and assignment group or business unit ownership table, which tells which manager or vice president is responsible for a particular business unit. The final joined and aggregated table provides ticketing metadata, ownership, and the business unit hierarchy for each of the tickets. This can be directly loaded into SPICE either as a query or a dataset. You can apply a permission file to this new dataset that dictates which group has access to which datasets.
The second component of the solution goes into the details of how to automate user management, which is done by uploading separate CSV files to Amazon S3 for adding new groups, adding new users, and removing users. When a particular object is uploaded, an event triggers an AWS Lambda function, which makes API calls for the QuickSight client to add or remove the users or add a group.
When you combine these two components, you get an automated way of incorporating your LDAP structure in QuickSight and managing the users in a similar fashion to how you manage users in your corporate active directory.
Prerequisites
To follow along with this post, clone the GitHub repo, deploy the infrastructure, and download the scripts.
Prepare the data
To get started, create a new S3 bucket or use an existing bucket to upload the provided scripts. On the Amazon S3 console, the prefix structure of the bucket should look like the following screenshot.
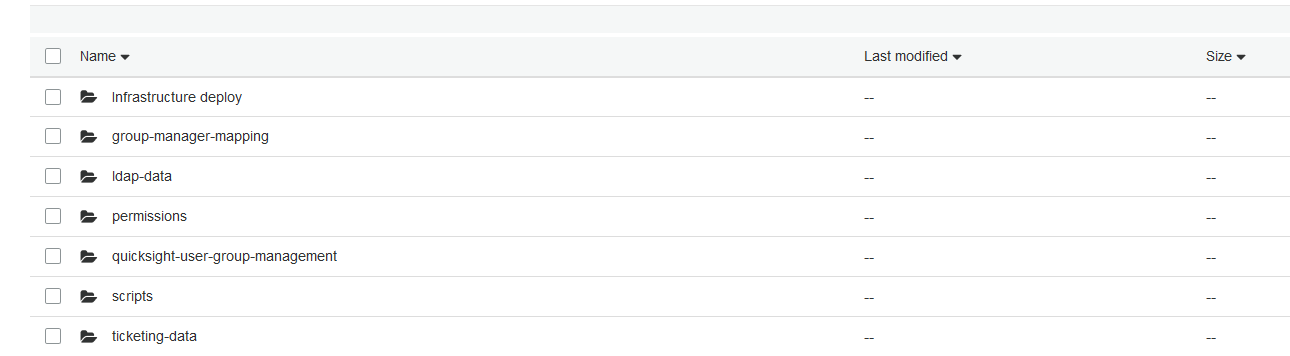
Use the redshift-cluster.yml AWS CloudFormation template file under the folder infrastructure deploy to deploy the Amazon Redshift cluster and an AWS Identity and Access Management (IAM) role that is attached to Amazon Redshift to access Amazon S3.
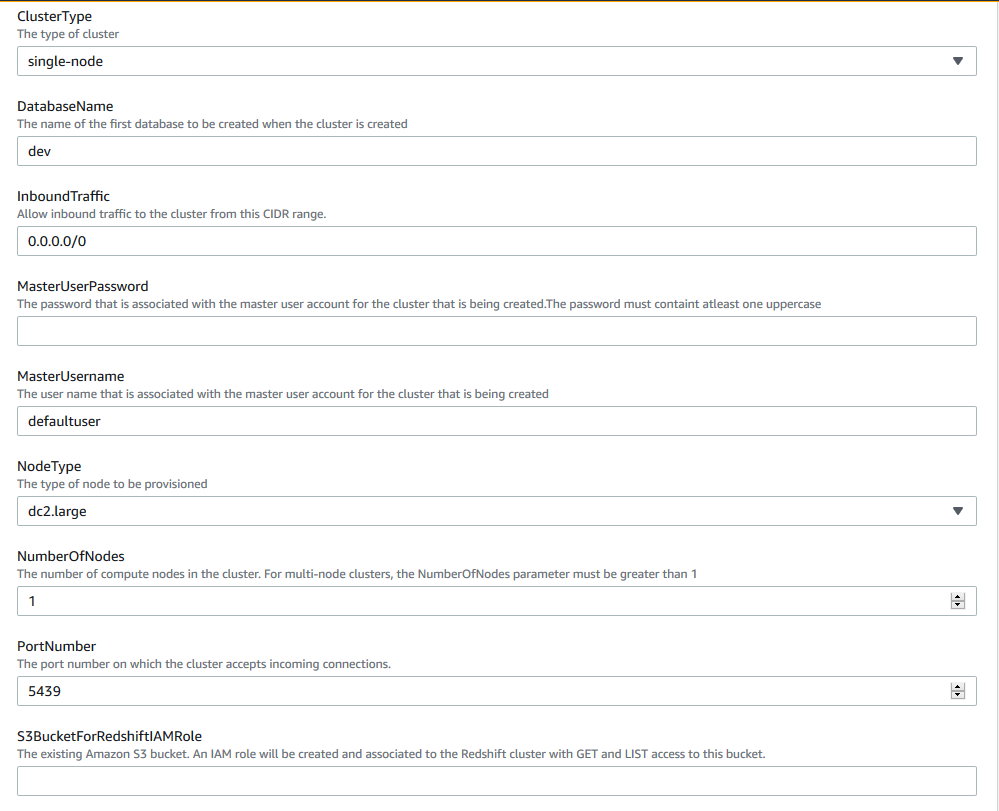
The CloudFormation template requires several parameters, including the following:
- InboundTraffic – We recommend restricting access to IP addresses within your network or to the IP address of the client. Entering
0.0.0.0/0allows incoming traffic from all IP addresses. - S3BucketForRedshiftIAMRole – The name of the S3 bucket where the scripts are uploaded. This is used to create an IAM role that is assumed by the cluster.
Alternatively, you can create the cluster via the Amazon Redshift console and attach the IAM role to access the S3 bucket to the cluster.
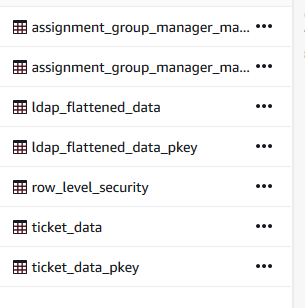
To perform the next steps, you can use the Amazon Redshift query editor. The scripts that need to be run are under the scripts folder. In the provided queries, replace bucket-name with the bucket where the scripts and data are uploaded, replace the iam_role ARN (arn:aws:iam::111122223333:role/quicksight-row-level-demo-redshift-role) with your actual account number, and replace the Region us-east-1 with the Region where the S3 bucket is created. When the queries are complete, several tables are now in the cluster (see the following screenshot).
Ticketing data
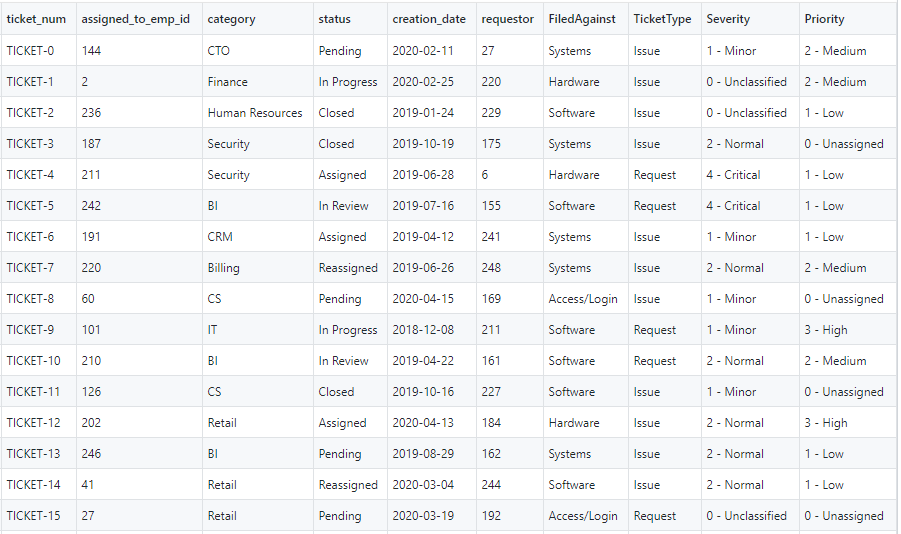
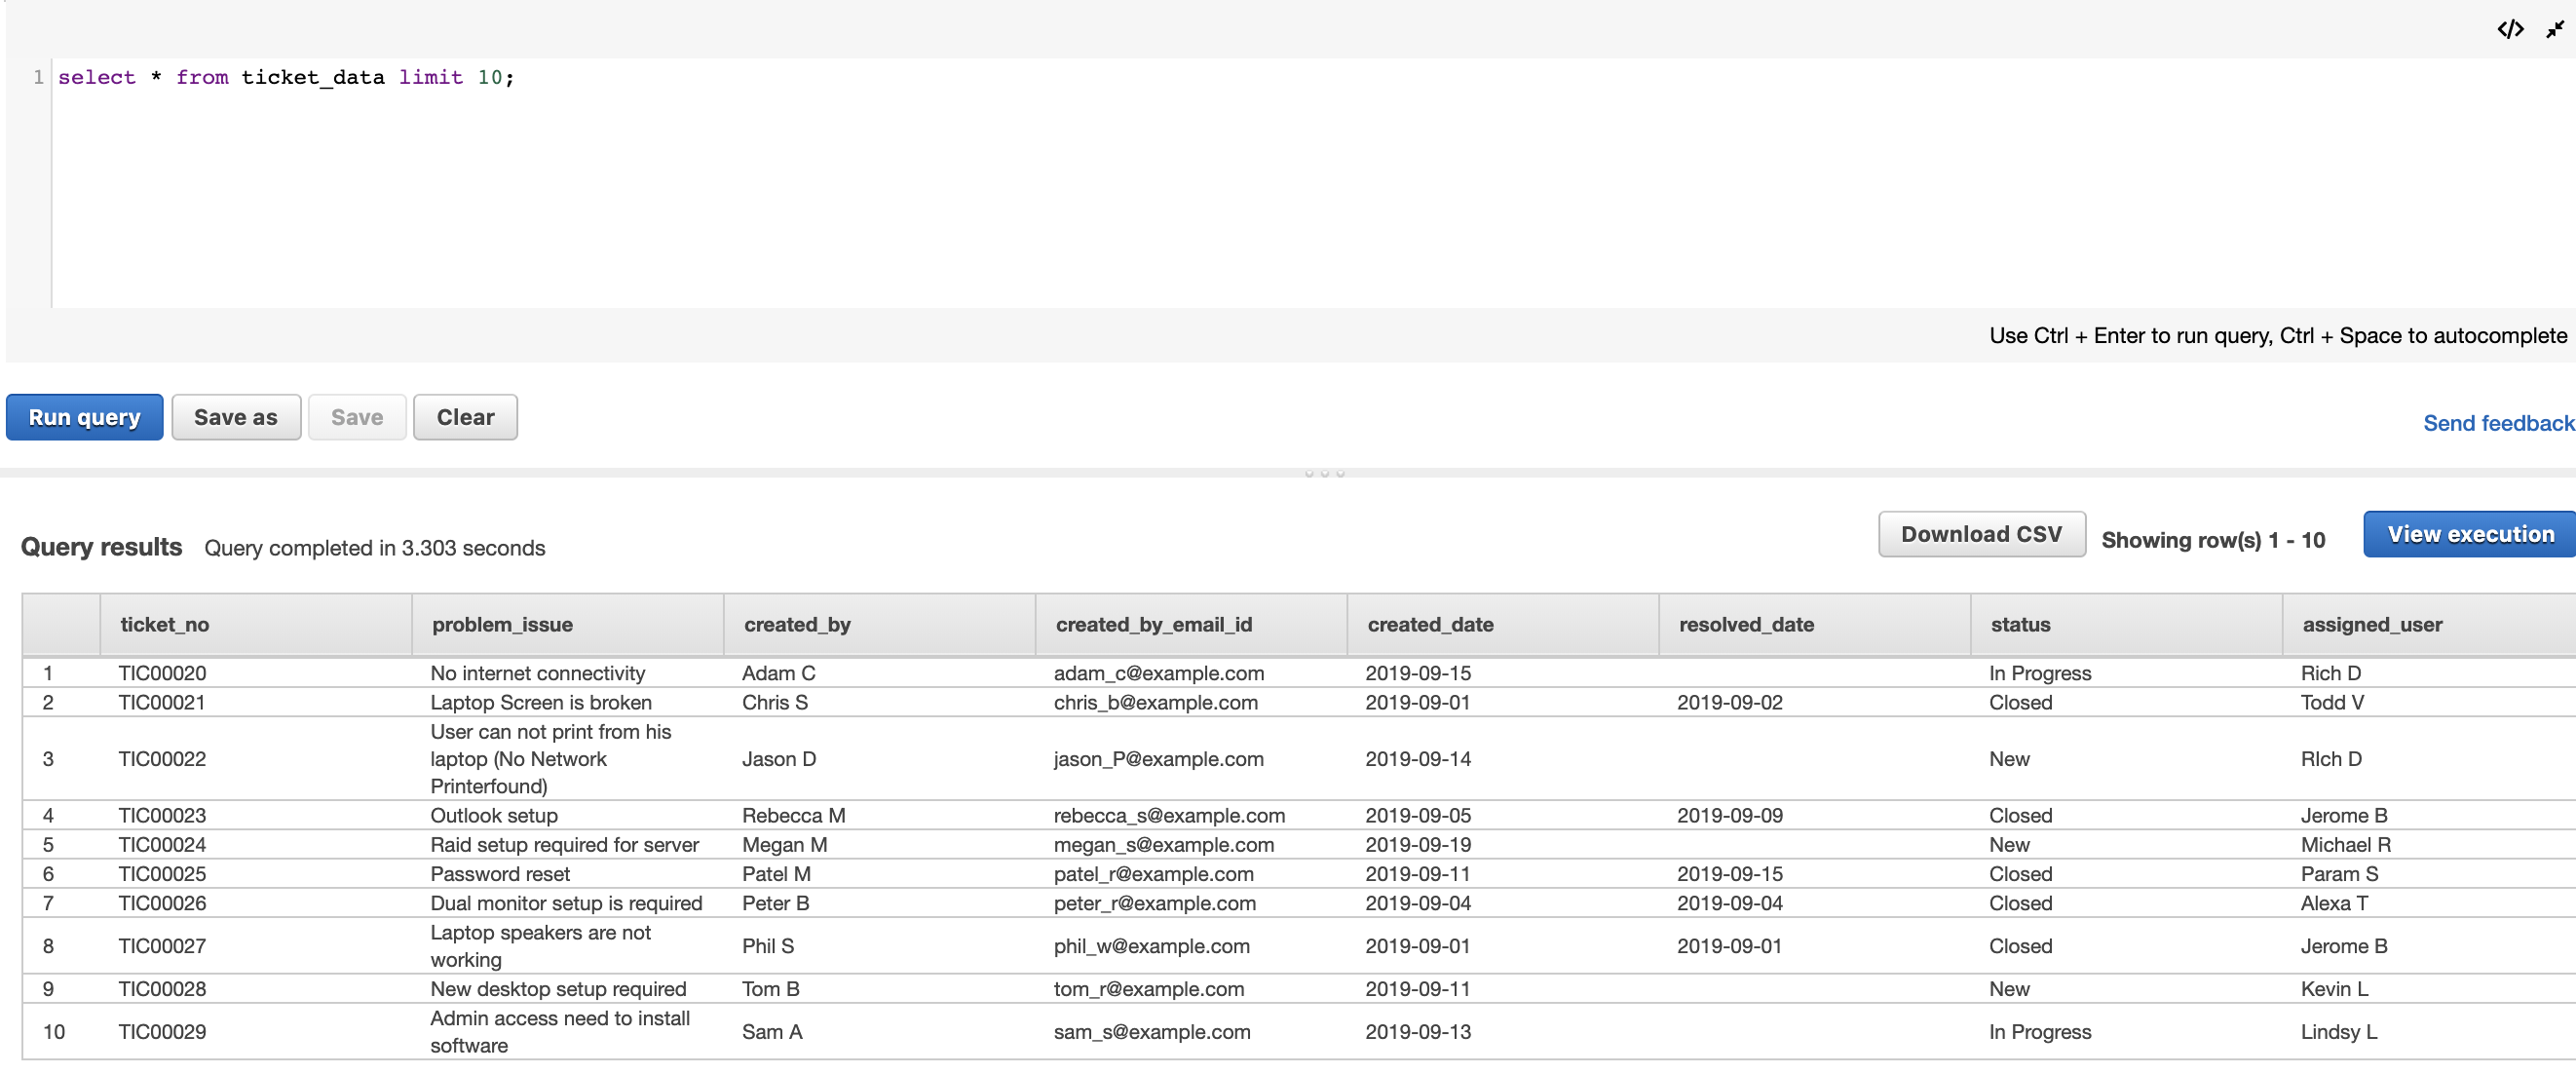
For this post, we assume that the IT support ticketing data is already loaded into Amazon Redshift. The important columns of interest in this dataset are ticket_no, which can be a primary key for this table, and assigned_user_email_id, which we use as a foreign key to join with the flattened LDAP dataset. We refer to this table as ticket_data. You can query this table in your Amazon Redshift cluster, as shown in the following screenshot.
In this post, we take the organizational structure where different business units are managed by different vice presidents.
We want the ability to categorize our ticketing data based on user assignment into business units. Our ticket data has assigned users for each ticket. We use assigned_user_email_id to identify owners for each of these tickets. Based on the LDAP dataset, we identify the vice president in the hierarchy for each assigned user. We also have an assignment group and assignment_group_manager_email mapping in a separate table, which gives us relationships between business units (or assignment group) and the respective vice presidents.
LDAP data
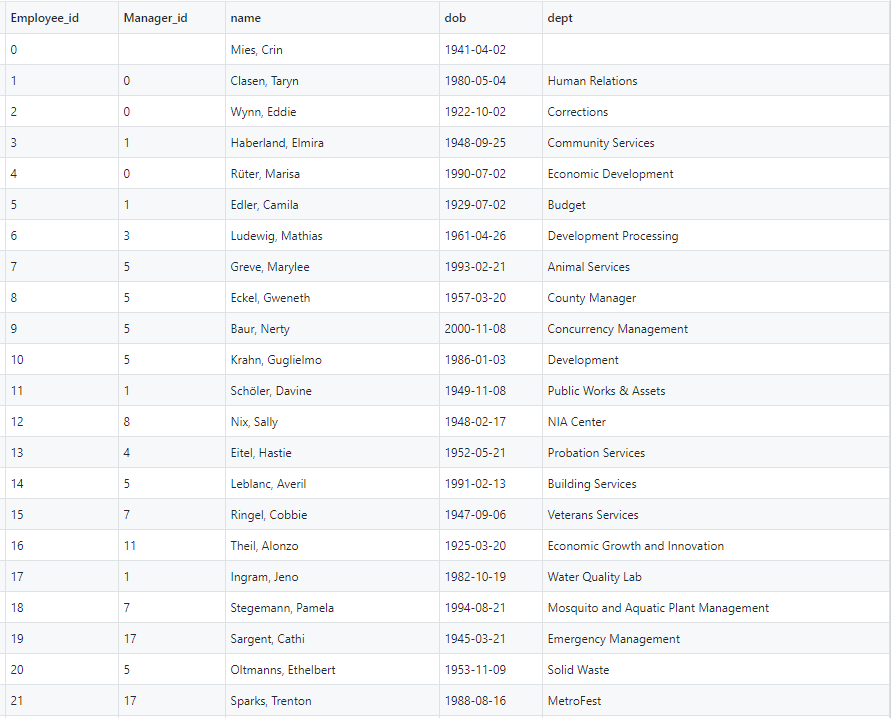
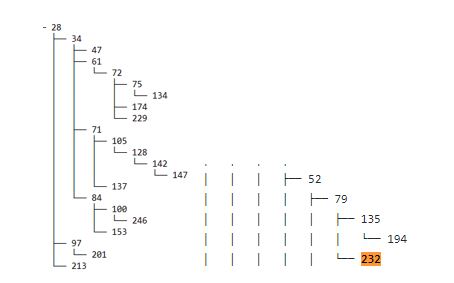
Our primary key for this data in this example dataset is user_email_id, and reports_to is the foreign key that refers to user_email_id in the same dataset. The following screenshot shows the employees table in an RDS instance. This table can also exist in any database that supports recursive queries.
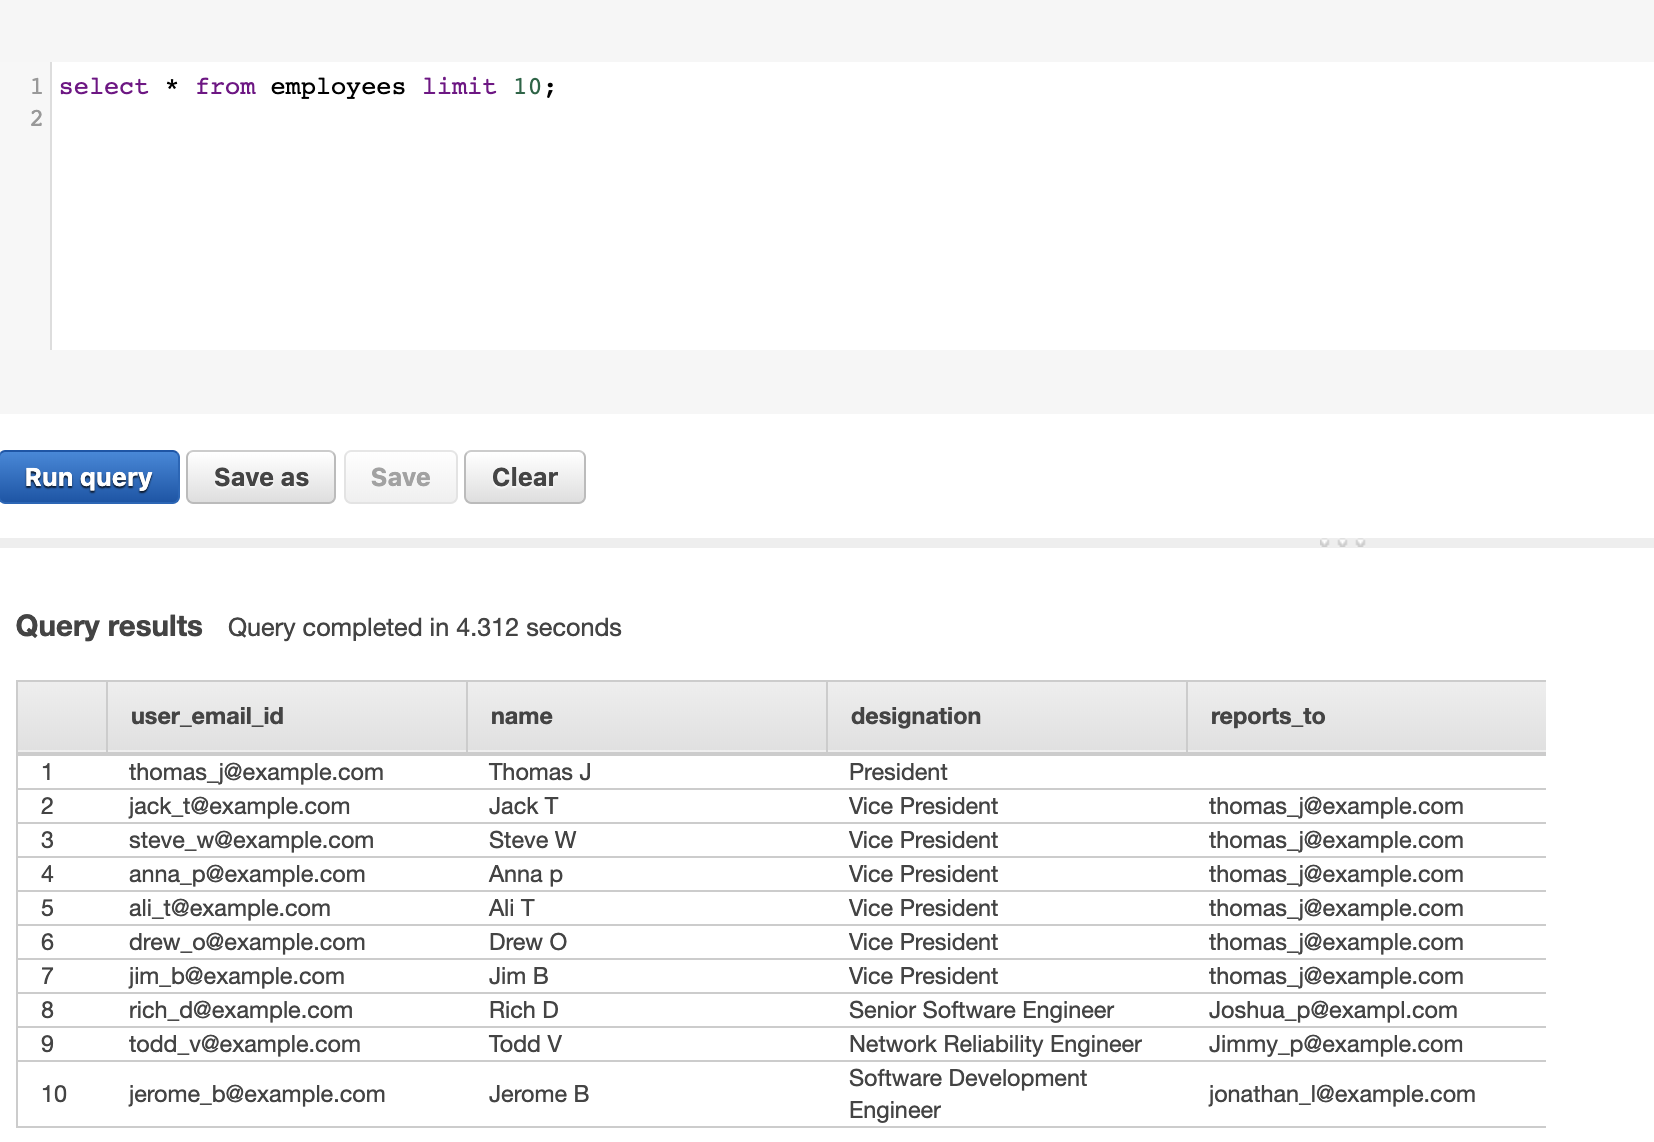
We’re interested in taking a particular user, finding their manager, and moving up the hierarchy until we find the vice president of a particular business unit. For example, in the preceding LDAP table, Todd V reports to Jimmy P, Jimmy P reports to Steve W, and Steve W reports to President Thomas J. This hierarchy is difficult to query in the current table structure because Amazon Redshift doesn’t support recursive queries. As an alternative, we decided to load the data in an RDS instance that supports recursive queries first and then load it into Amazon Redshift.
After we load the data into the RDS instance, we can use a SQL query like the following to find the hierarchy order we discussed:
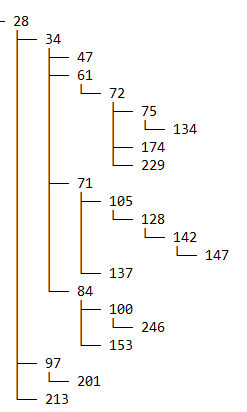
The following screenshot shows the flattened sample LDAP dataset for the preceding example. Let’s call this LDAP_flattened_data. You can query this table in your Amazon Redshift cluster.
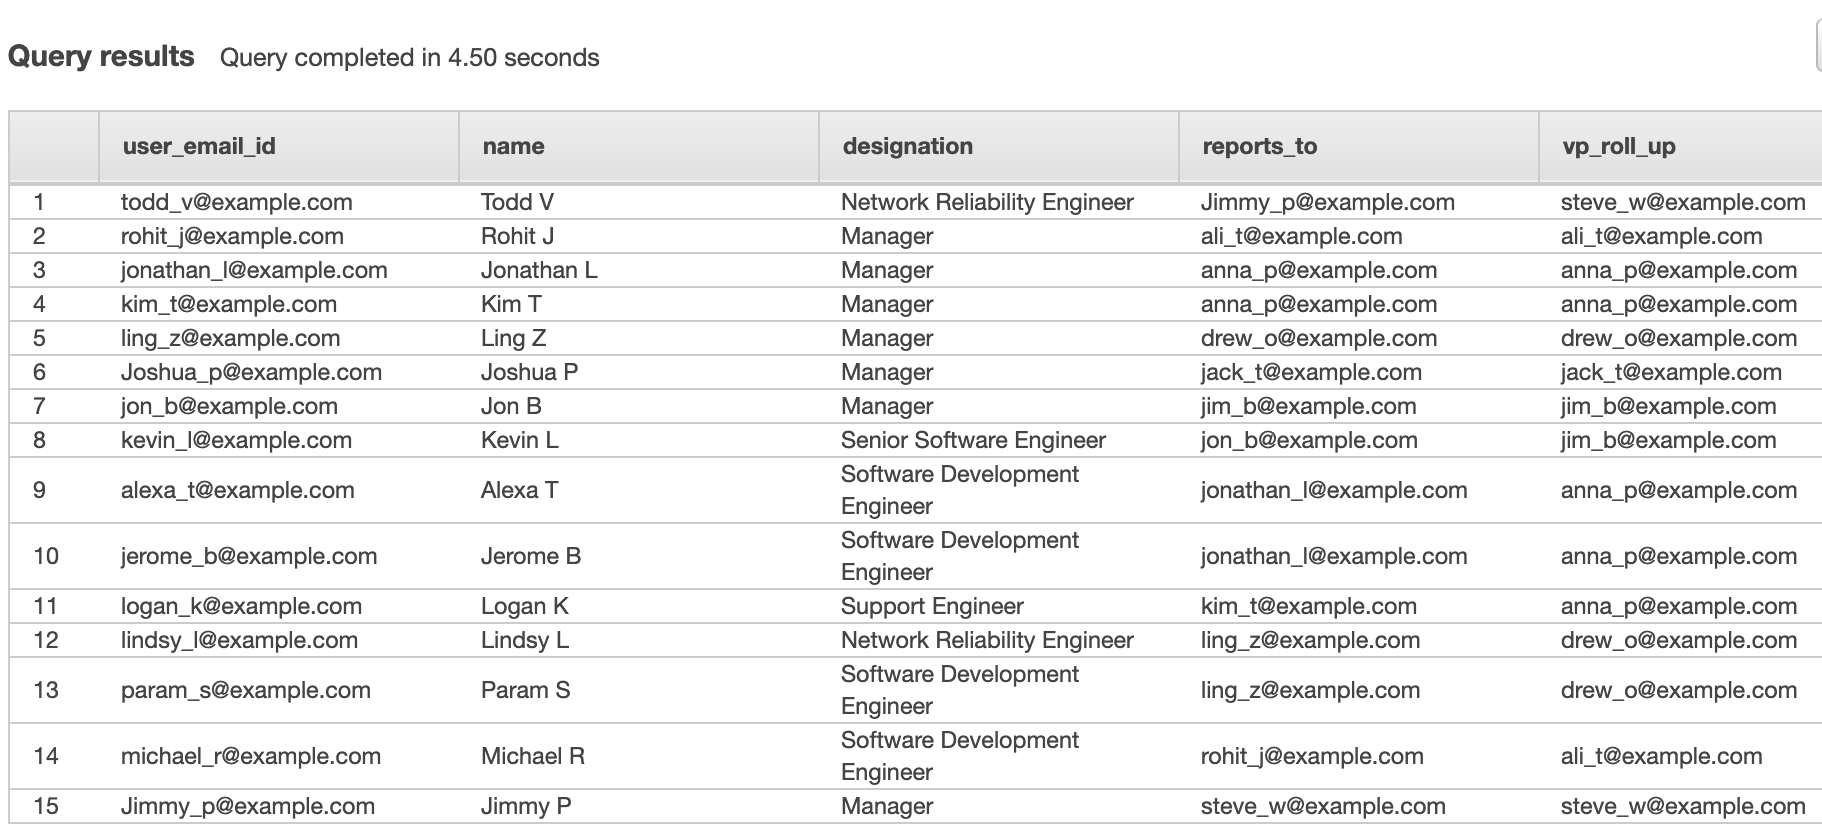
Note that for this post, the dataset is already flattened.
Assignment groups and manager mapping
The next step is to identify the business unit or assignment group each vice president belongs to.
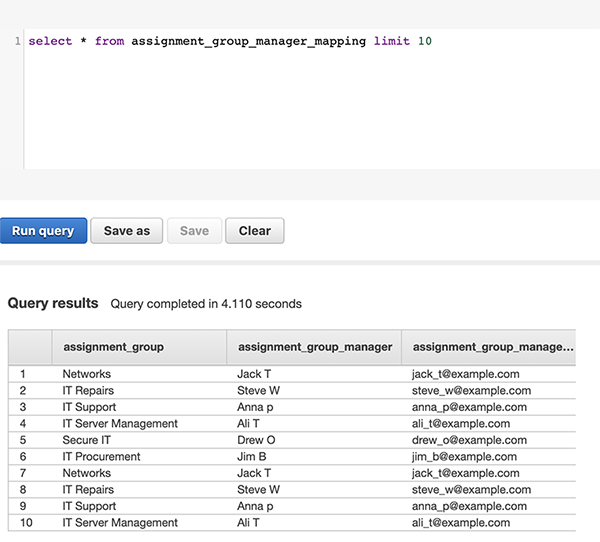
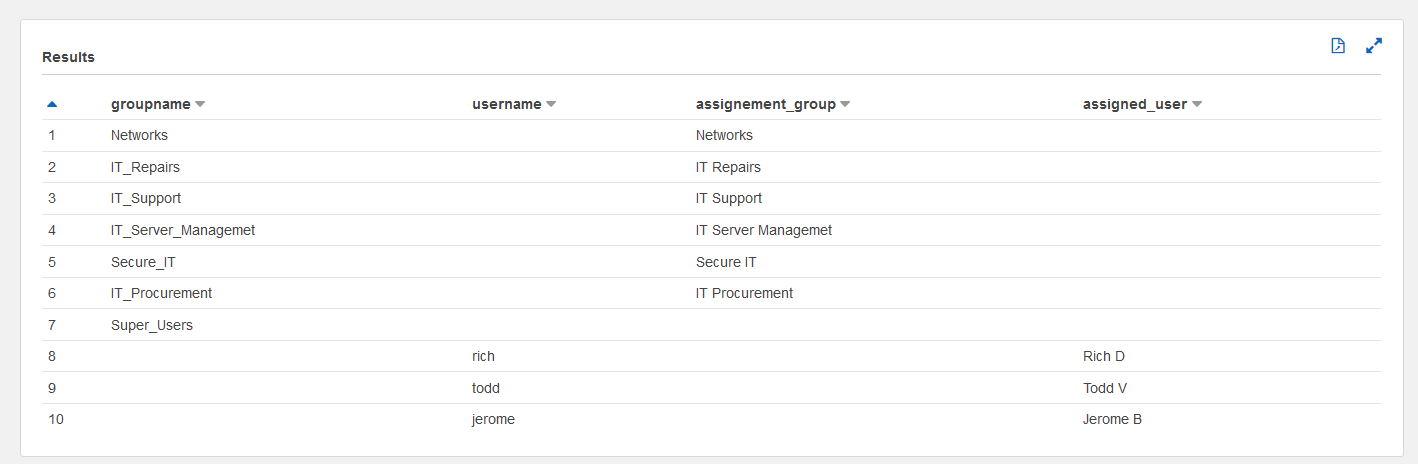
For simplicity, we assume the following mapping between assignment groups (business units) and their respective vice presidents (or assignment group manager). This can be simply stored in a table. Let’s call the table assignment_group_manager_mapping. After we join LDAP_flattened_data with the assignment_group_manager_mapping table, we can identify which assignment group each user belongs to. Carrying forward the previous example, Todd V rolls up to vice president Steve W and therefore belongs to the IT Repairs assignment group. You can query this table in your Amazon Redshift cluster.
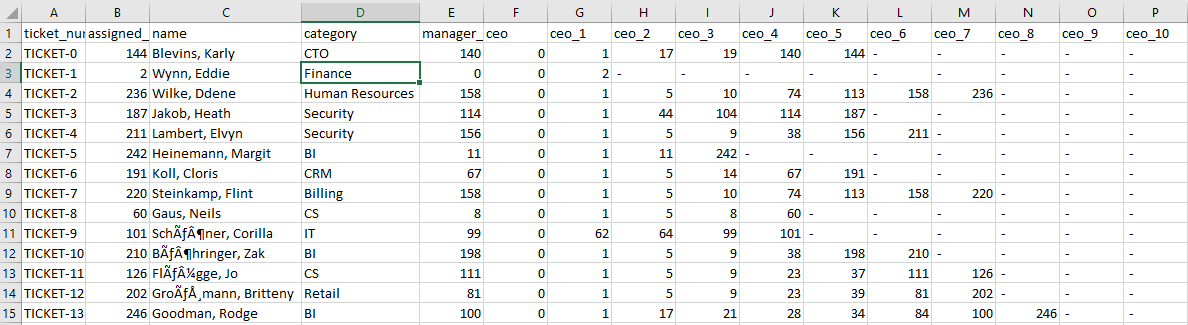
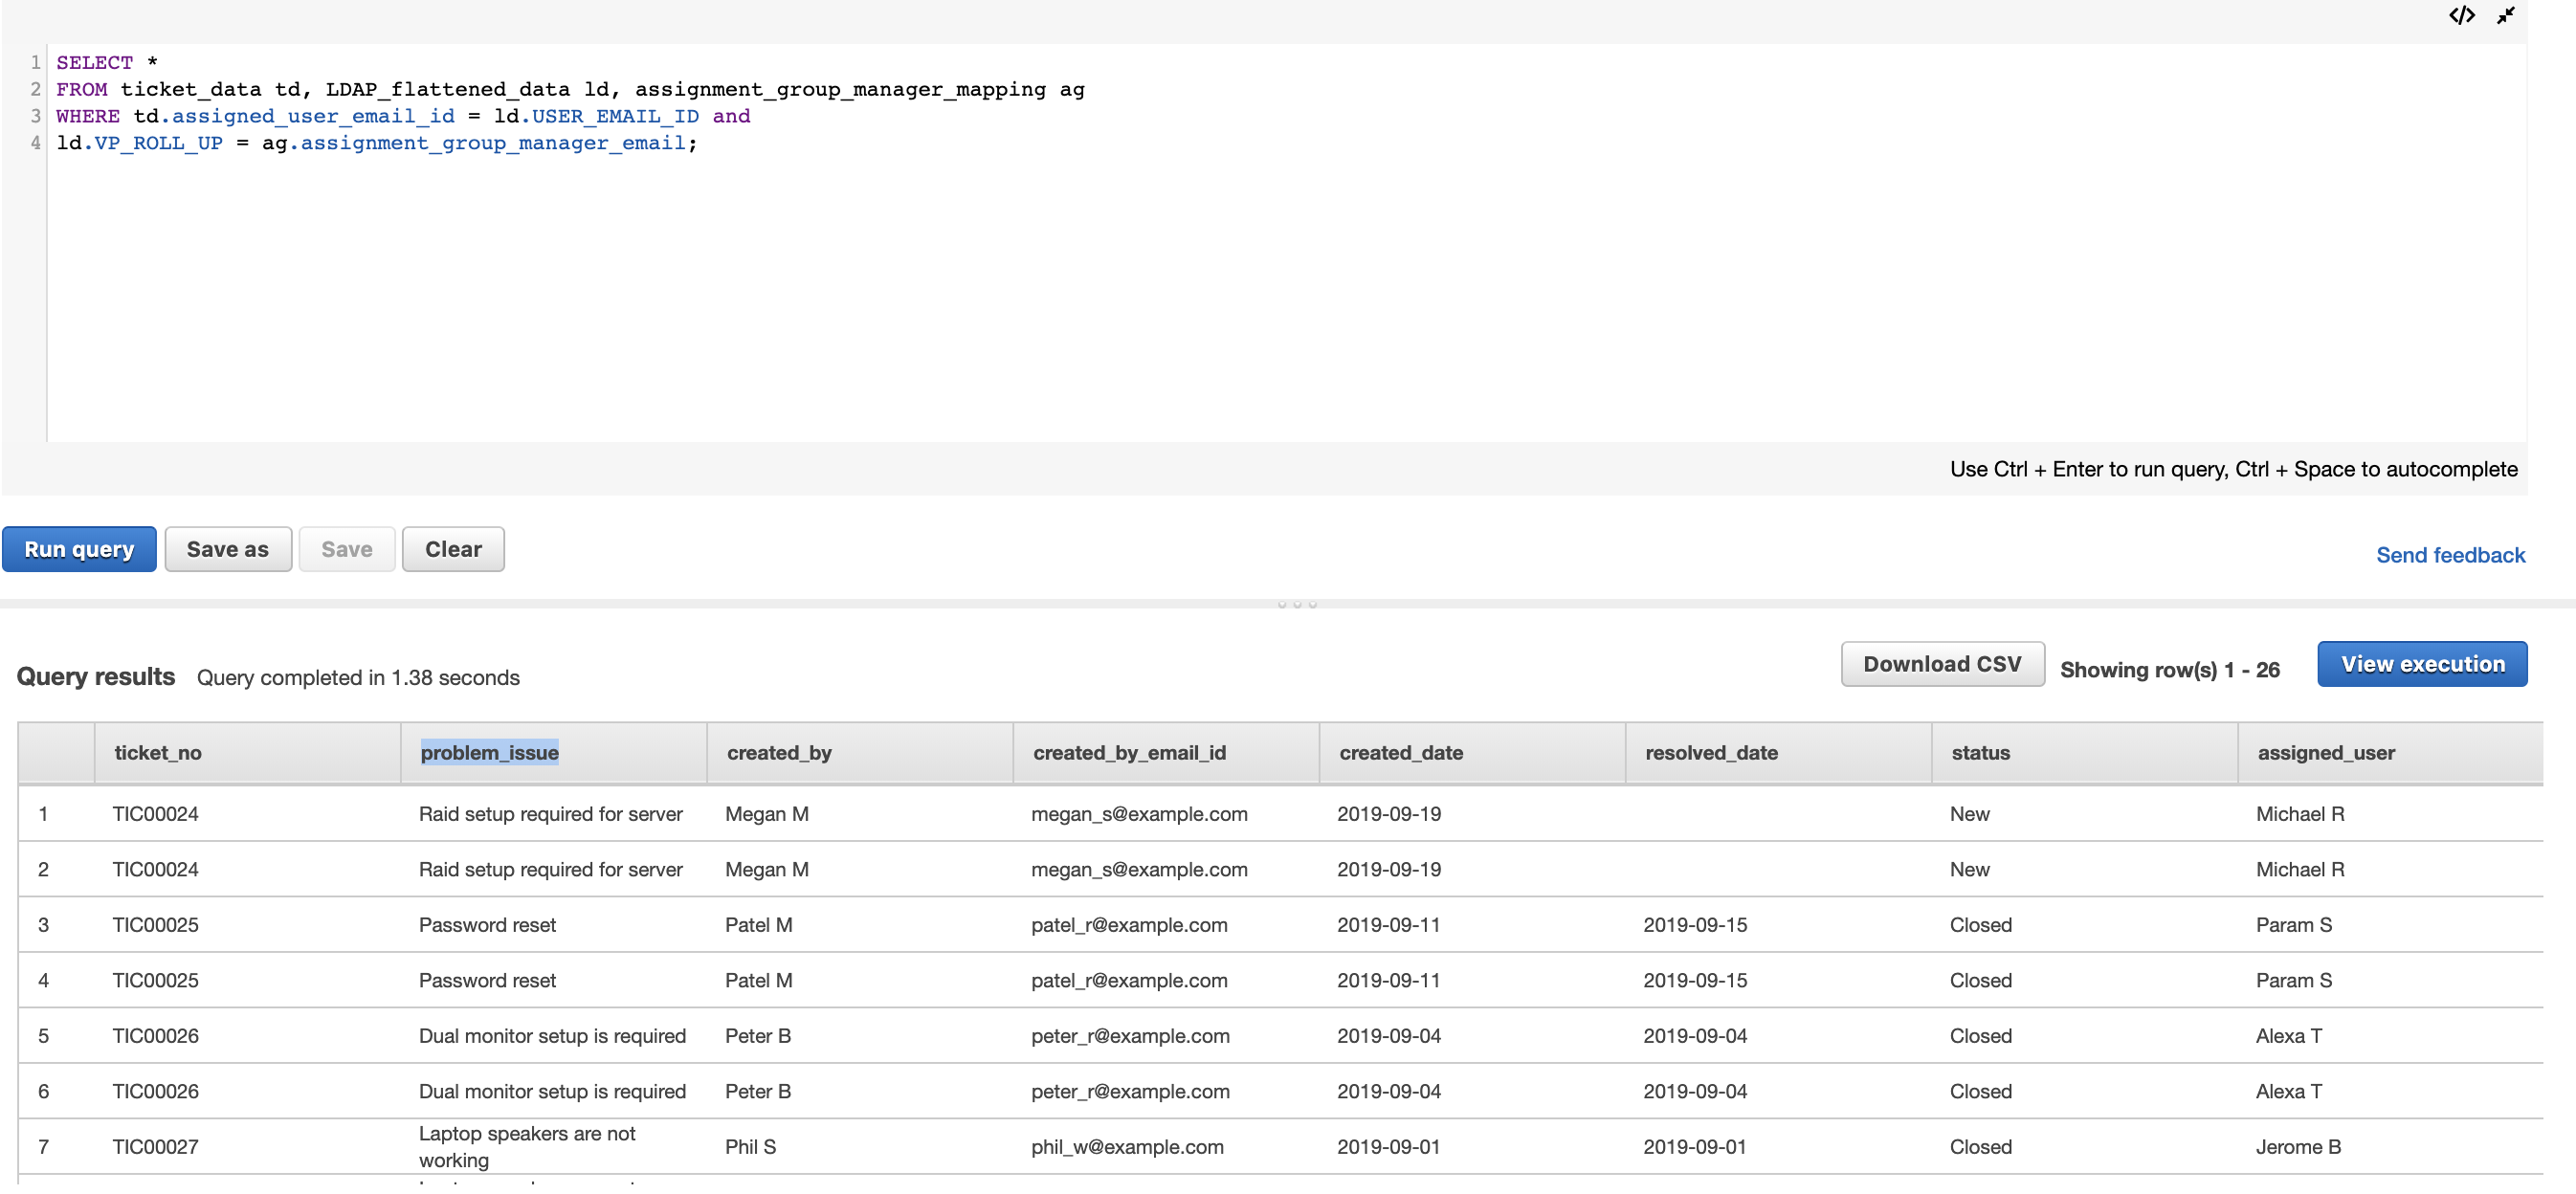
Now that we have the three base tables ready, all we need to do is join them to form a flattened table that is suitable for visualizations in QuickSight. We store this data into SPICE, which is an in-memory optimized calculation engine designed specifically to support low-latency, ad hoc data visualization. You can create this table by performing a join between ticket_data and LDAP_flattened_data on assigned_user_email_id and USER_EMAIL_ID, which gives us VP_ROLL_UP, which we can then use to join with the assignment_group_manager_mapping table on assignment_group_manager_email. The final dataset created from the sample data is shown in the following table.
For this post, we use the following sample SQL statement, but you can achieve this in multiple ways.
You can directly load this table and query into SPICE from Amazon S3, Amazon Athena, Amazon Redshift, or any other supported data sources. For more information, see Working with Datasets.
Add row-level security
To add row-level security, we follow the same steps as in the documentation Using Row-Level Security (RLS) to Restrict Access to a Dataset. We create a dataset in QuickSight by querying the table in Amazon Redshift. Alternatively, you can upload the permissions file from the GitHub repository. You can query this table in your Amazon Redshift cluster with select * from row_level_security. The following screenshot shows our results.
With the preceding examples, the users that are added to a particular assignment group get the same permissions as the group, and the users that belong to the superuser group have elevated access. In QuickSight, we perform the following steps.
- Create a new dataset with the
row_level_securitytable.


Both datasets are visible in QuickSight.

- In the details for the
ticketing-data-finaldataset, and choose Row-level security.

- Select the
row_level_securitydataset that we created.

- Select Apply dataset and confirm.


When the row-level security has been successfully applied, the lock icon is visible next to the ticketing dataset.
![]()
Automate user management
To tie it all together, we automate user and group management. When a particular user is added to a group, they get access as defined by the preceding permissions file. For this setup, we use the following Amazon S3 prefix structure, essentially a separate path for adding groups, adding users, and removing users.

We upload CSV files under each of these Amazon S3 paths.
To add or remove users from a group, refer to the user.csv file under the quicksight-user-group-management folder and copy it to the add-user-to-group folder.

To add groups, refer to the groups.csv file under the quicksight-user-group-management folder and copy it to the add-group folder.
When a file is added in any of these S3 folder paths, a Lambda function is triggered, which makes a Boto3 call to add groups or add or remove users. You can use the quicksight-row-level-lambda.yml CloudFormation template under the Infrastructure deploy folder of the GitHub repo to create the Lambda function and execution role.
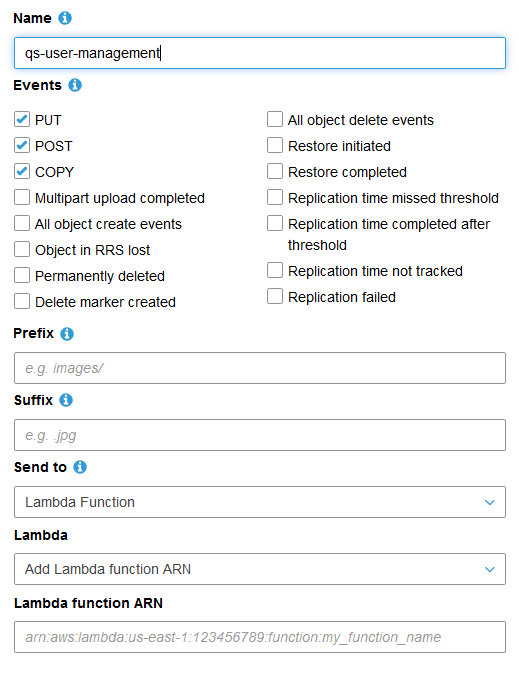
Now we create an Amazon S3 event trigger for this bucket to trigger the Lambda function. On the Properties tab of the bucket, choose Events.
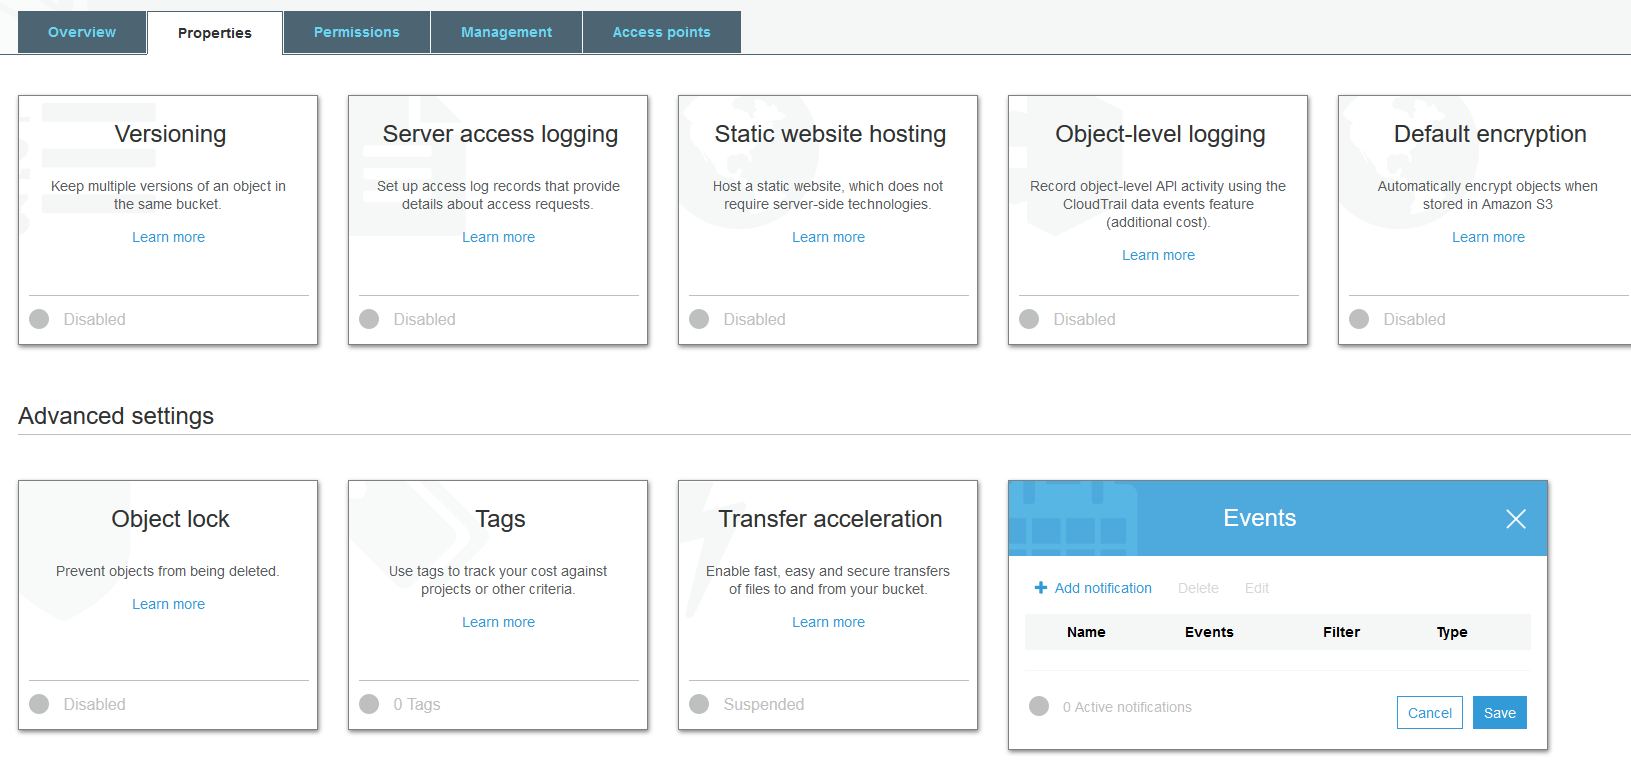
Add a notification and provide the ARN of the Lambda function that you created.
Visualize the data
To demonstrate the solution, we show how Steve W. can view all the tickets under IT Repairs, and Todd V can view only the tickets assigned to him.
We create a sample analysis using the dataset created earlier. Then we can publish it as a dashboard and share it with the target user group.
For this post, we set up the following visualizations:
- Tickets assigned this month – The count of the tickets opened in the current month
- Visual type – KPI
- Value –
ticket_no - Filters –
created_dateshould be current month
- Ticket Details – The details of the tickets, such as status and assigned owner
- Visual type – Table
- Groupby columns –
ticket_no,created_by,problem_issue,assigned_user - Filters –
created_dateshould be current month
- Tickets by Status – The status of all the tickets by assignment group
- Visual type – Pie chart
- Group/Color – Status
- Value –
ticket_no - Filters –
created_dateshould be current month
- Tickets Assignment by Groups – The status of all the tickets by assignment group
- Visual type – Bar chart
- X-axis –
assignment_group - Y-axis – count of
ticket_no - Filters –
created_dateshould be current month
- Tickets Resolved by day – The number of tickets closed each day
- Visual type – Line chart
- X-axis –
resolved_date - Y-axis – count of
ticket_no - Filters –
created_dateshould be current month and status is closed
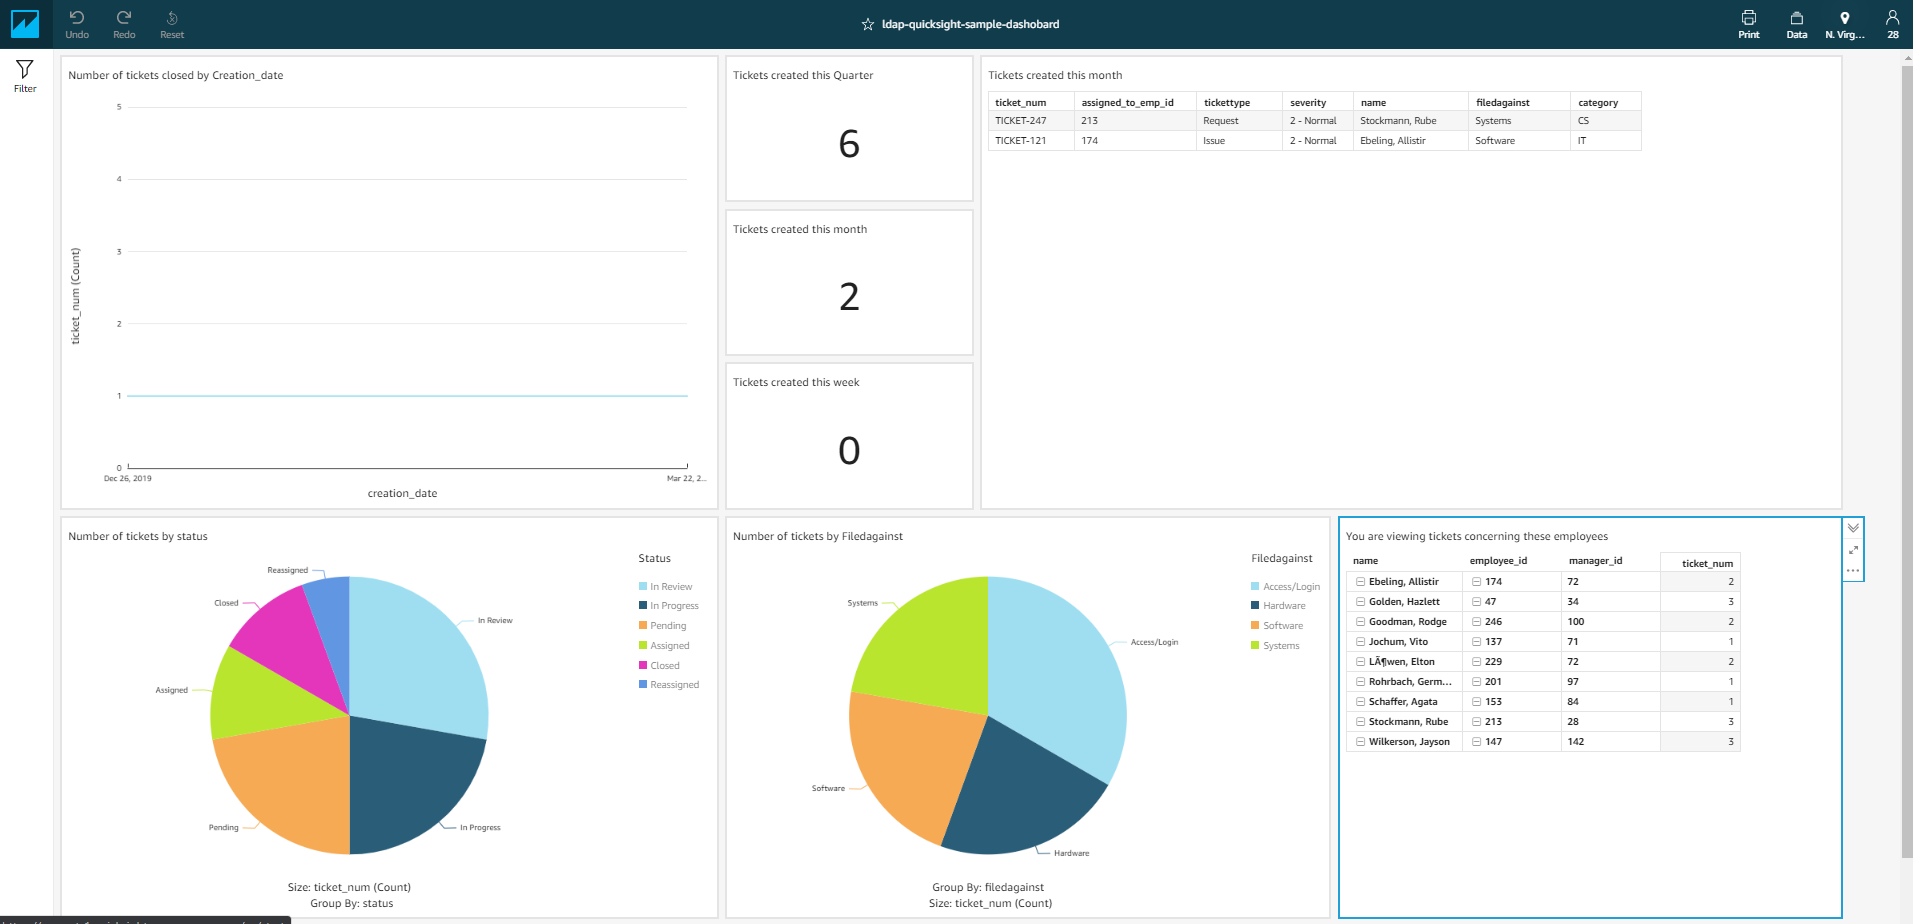
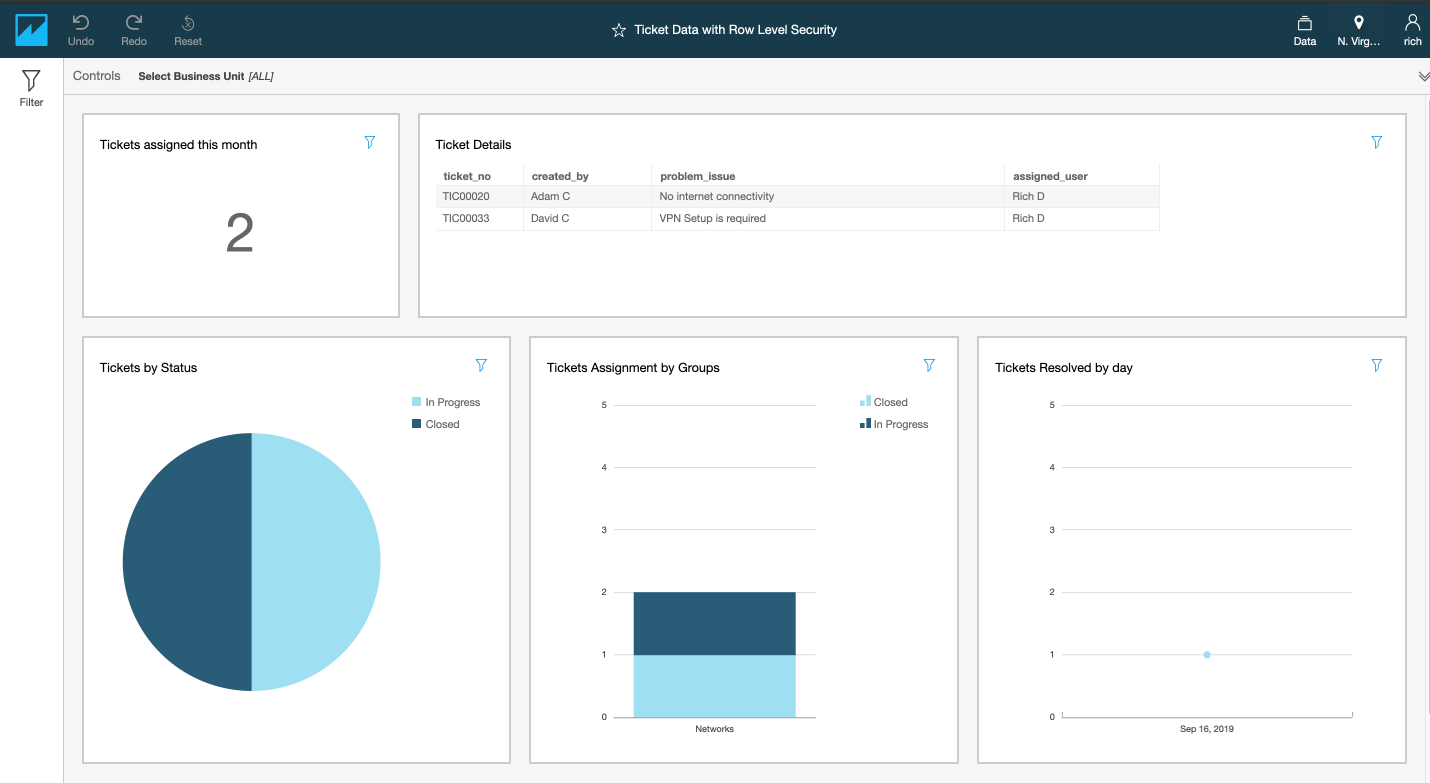
When user Todd V (the QuickSight user name is the same as the users email ID) logs in, he sees a dashboard like the following screenshot.
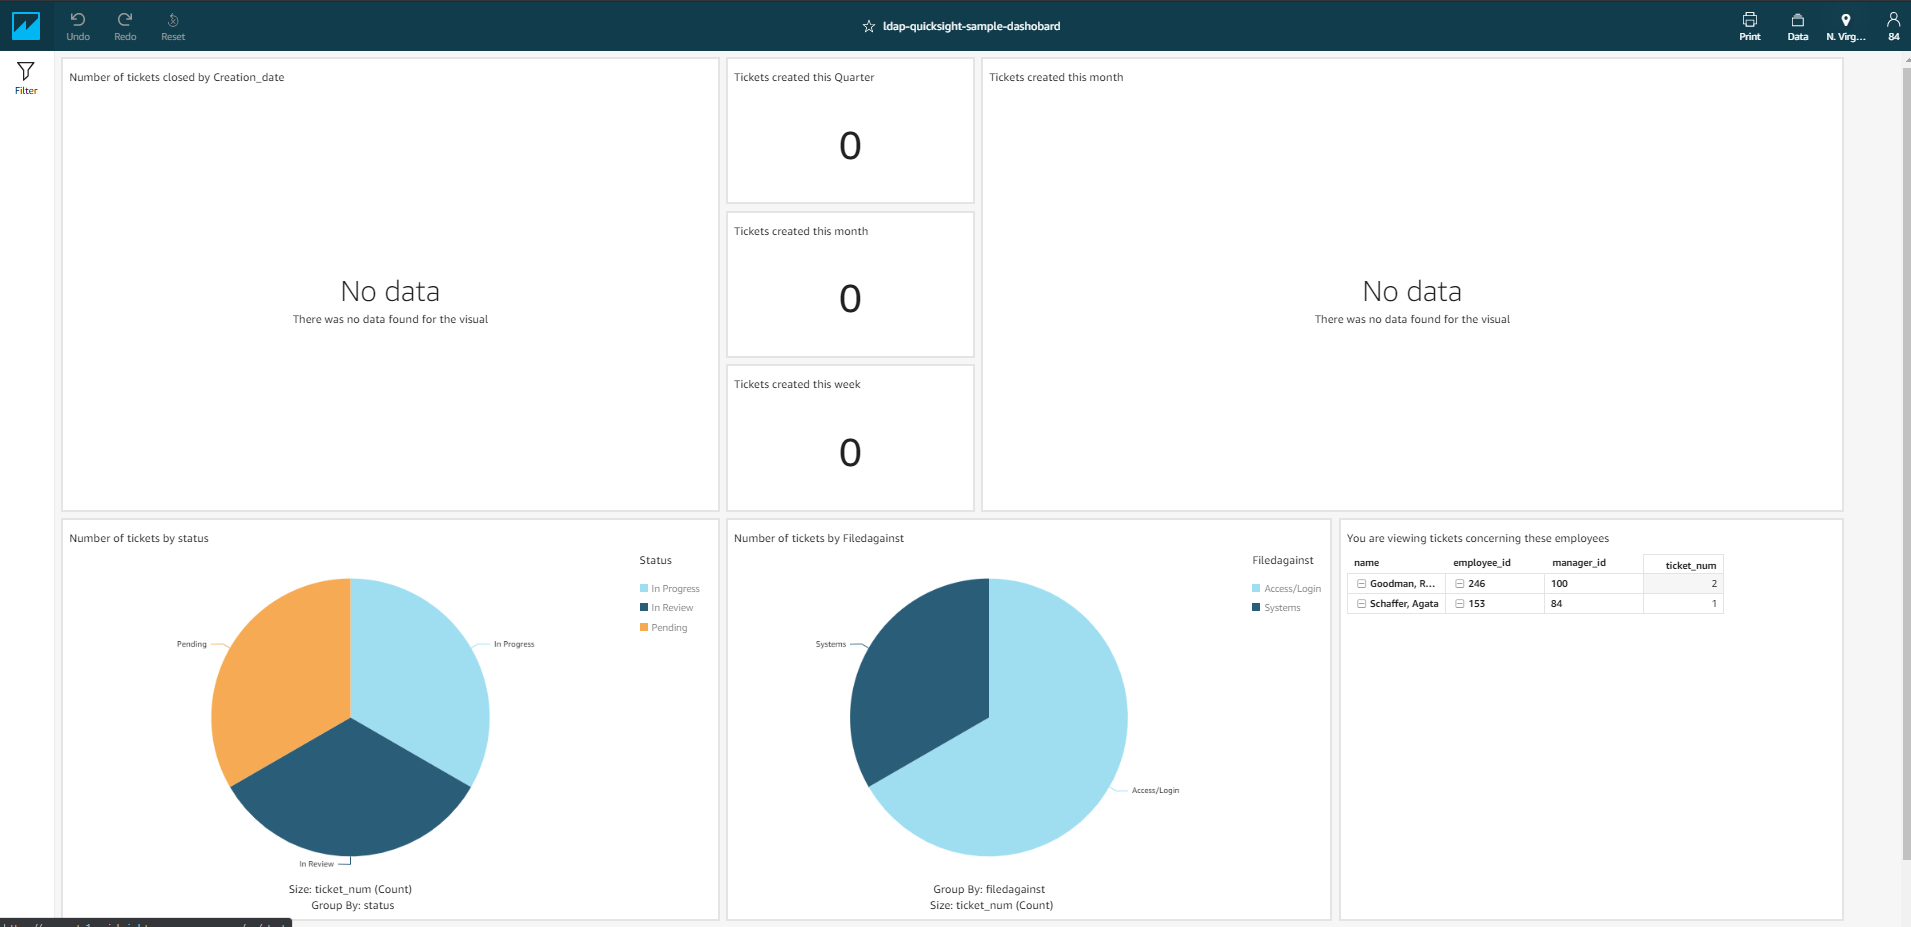
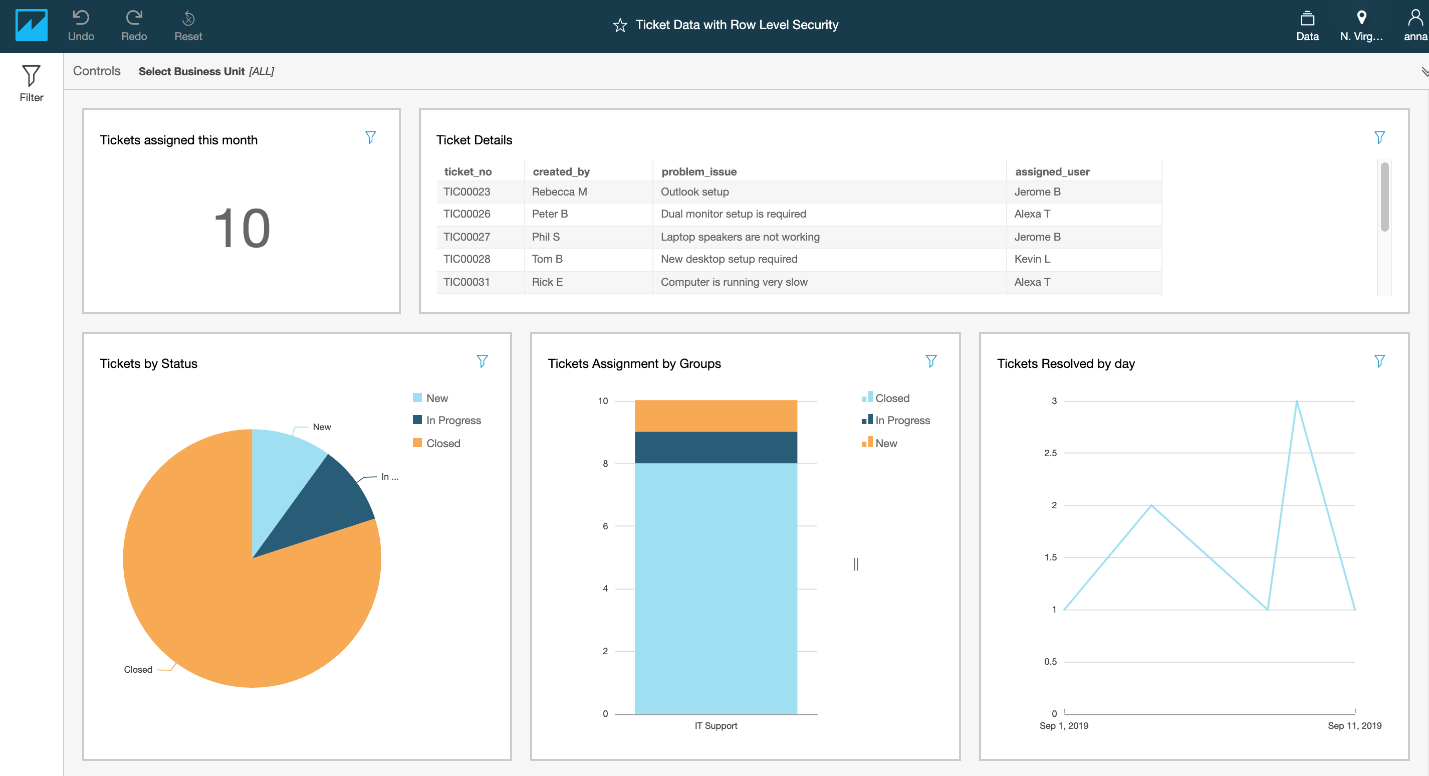
When Steve W logs in, his dashboard shows more information.
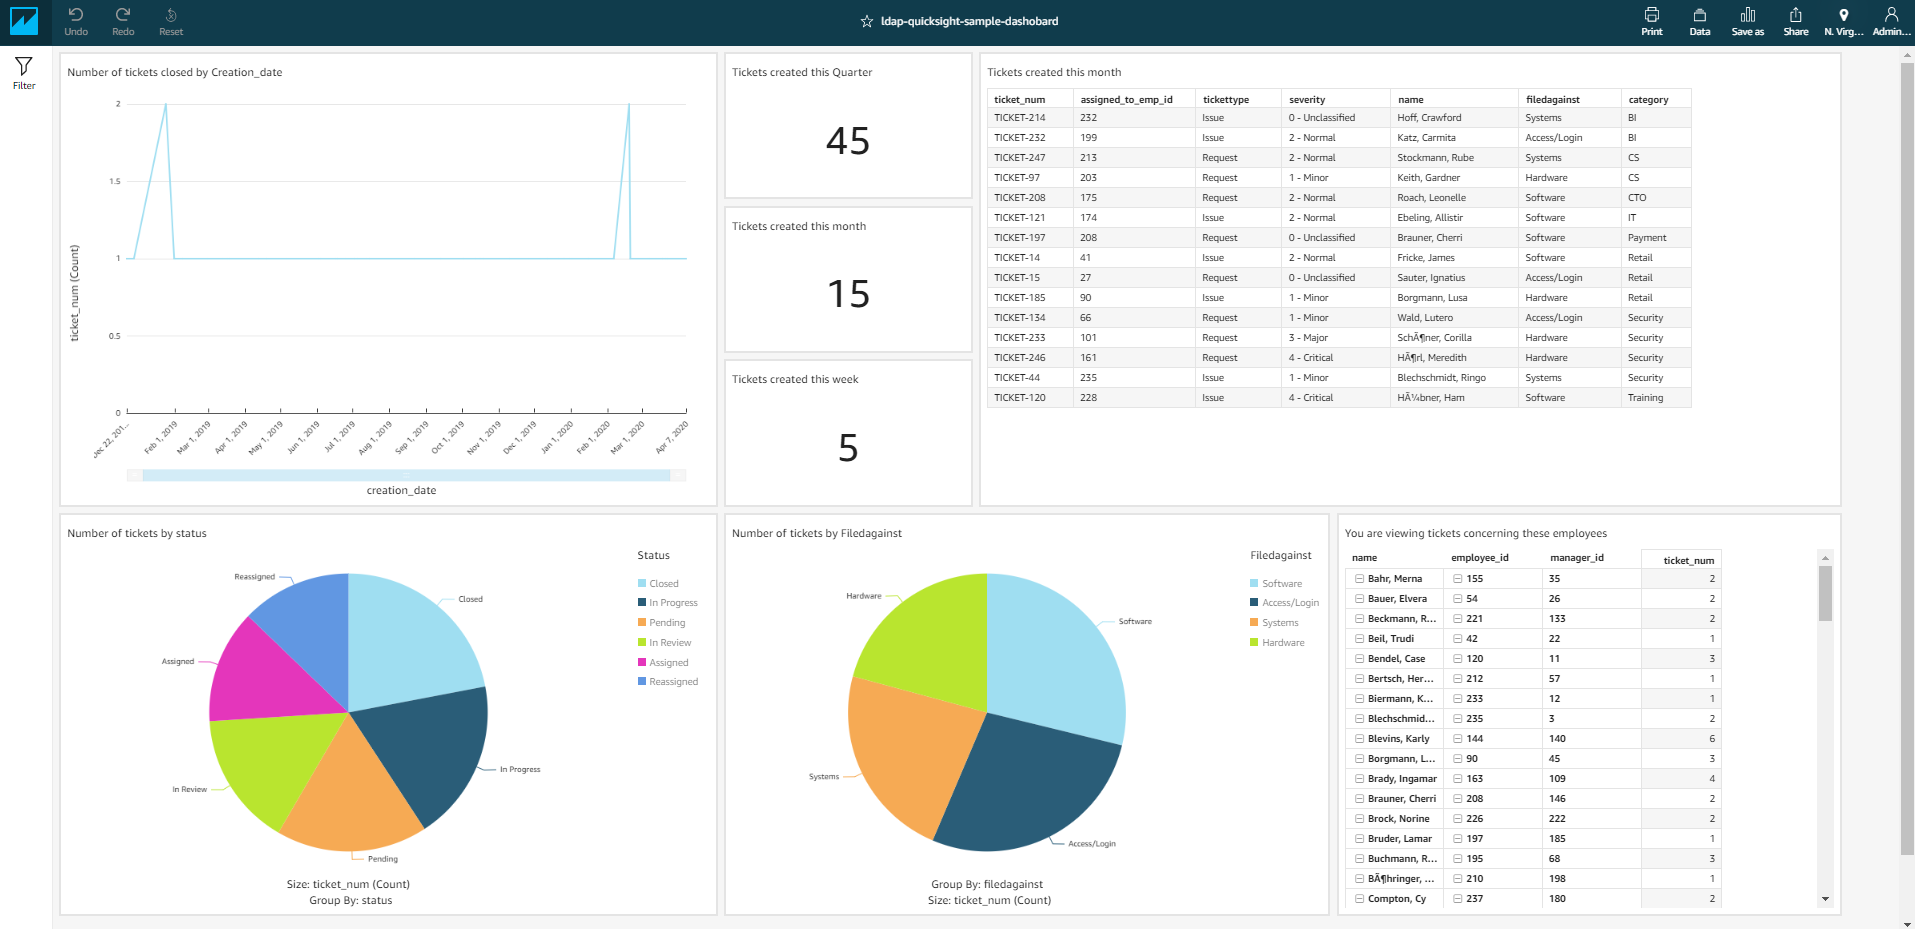
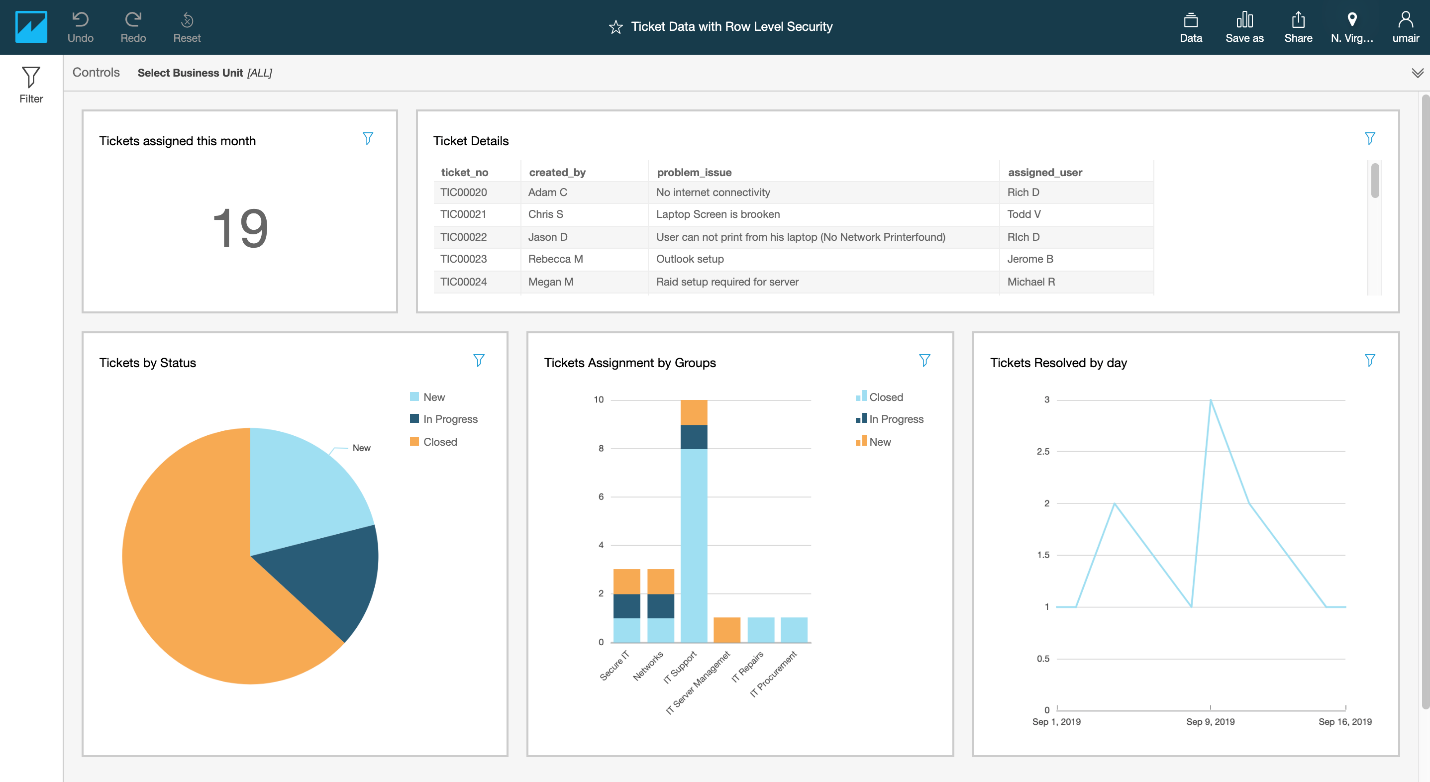
When a superuser logs in, they see the following dashboard.
Conclusion
We demonstrated one of the many ways we can use LDAP data for organizational hierarchy-based visualizations in QuickSight. In this post, we talked about how we can find organizational ownership for ticket data. You can further generalize this solution to fit any data within an organization that needs business unit-based grouping. Another use case for this can be for visualizing security threats or sales data across different business units.
This post covers only one level of organizational hierarchy, but in many enterprises, the organizational structure can be much more complicated. You can use a similar approach to deal with these nested organizational hierarchies, where we can report on different levels of business units. If you are interested in implementing row-level security using organizational LDAP hierarchical structure refer to Implement row-level security using a complete LDAP hierarchical organization structure in Amazon QuickSight.
About the Author
 Anand Sakhare is a Big Data Architect with AWS. He helps customers build big data, analytics, and machine learning capabilities using a mix of technologies. He is passionate about innovation and solving complex problems.
 Rohan Jamadagni is a Sr. Data Architect, working with AWS for the past 5 years. He works closely with customers to implement data and analytics solutions on AWS. He enjoys understanding the meaning behind data and helping customers visualize their data to provide meaningful insights.
 Umair Nawaz is a DevOps Engineer at Amazon Web Services in New York City. He works on building secure architectures and advises enterprises on agile software delivery. He is motivated to solve problems strategically by utilizing modern technologies.