Post Syndicated from Mariia Berezina original https://aws.amazon.com/blogs/big-data/analyze-daily-trading-activity-using-transaction-data-from-amazon-redshift-in-amazon-finspace/
Financial services organizations use data from various sources to discover new insights and improve trading decisions. Finding the right dataset and getting access to the data can frequently be a time-consuming process. For example, to analyze daily trading activity, analysts need to find a list of available databases and tables, identify its owner’s contact information, get access, understand the table schema, and load the data. They repeat this process for every additional dataset needed for the analysis.
Amazon FinSpace makes it easy for analysts and quants to discover, analyze, and share data, reducing the time it takes to find and access financial data from months to minutes. To get started, FinSpace admins create a category and an attribute set to capture relevant external reference information such as database type and table name. After connecting to data source or uploading it directly through the FinSpace user interface (UI), you can create datasets in FinSpace that include schema and other relevant information. Analysts can then search the catalog for necessary datasets and connect to them using the FinSpace web interface or through the FinSpace JupyterLab notebook.
Amazon Redshift is a popular choice for storing and querying exabytes of structured and semi-structured data such as trade transactions. In this post, we explore how to connect to an Amazon Redshift data warehouse from FinSpace through a Spark SQL JDBC connection and populate the FinSpace catalog with metadata such as schema details, dataset owner, and description. We then show how simple it is to use the FinSpace catalog to discover available data and to connect to an Amazon Redshift cluster from a Jupyter notebook in FinSpace to read daily trades for Amazon (AMZN) stock. Finally, we will evaluate how well-executed were our stock purchases. We will do it by comparing our transactions stored in Amazon Redshift to trading history for the stock stored in FinSpace.
Solution overview
The blog post covers the following steps:
- Configure your FinSpace catalog to describe your Amazon Redshift tables.
- Use FinSpace notebooks to connect to Amazon Redshift.
- Populate the FinSpace catalog with tables from Amazon Redshift. Add description, owner, and attributes to each dataset to help with data discovery and access control.
- Search the FinSpace catalog for data.
- Use FinSpace notebooks to analyze data from both FinSpace and Amazon Redshift to evaluate trade performance based on the daily price for AMZN stock.
The diagram below provides the complete solution overview.
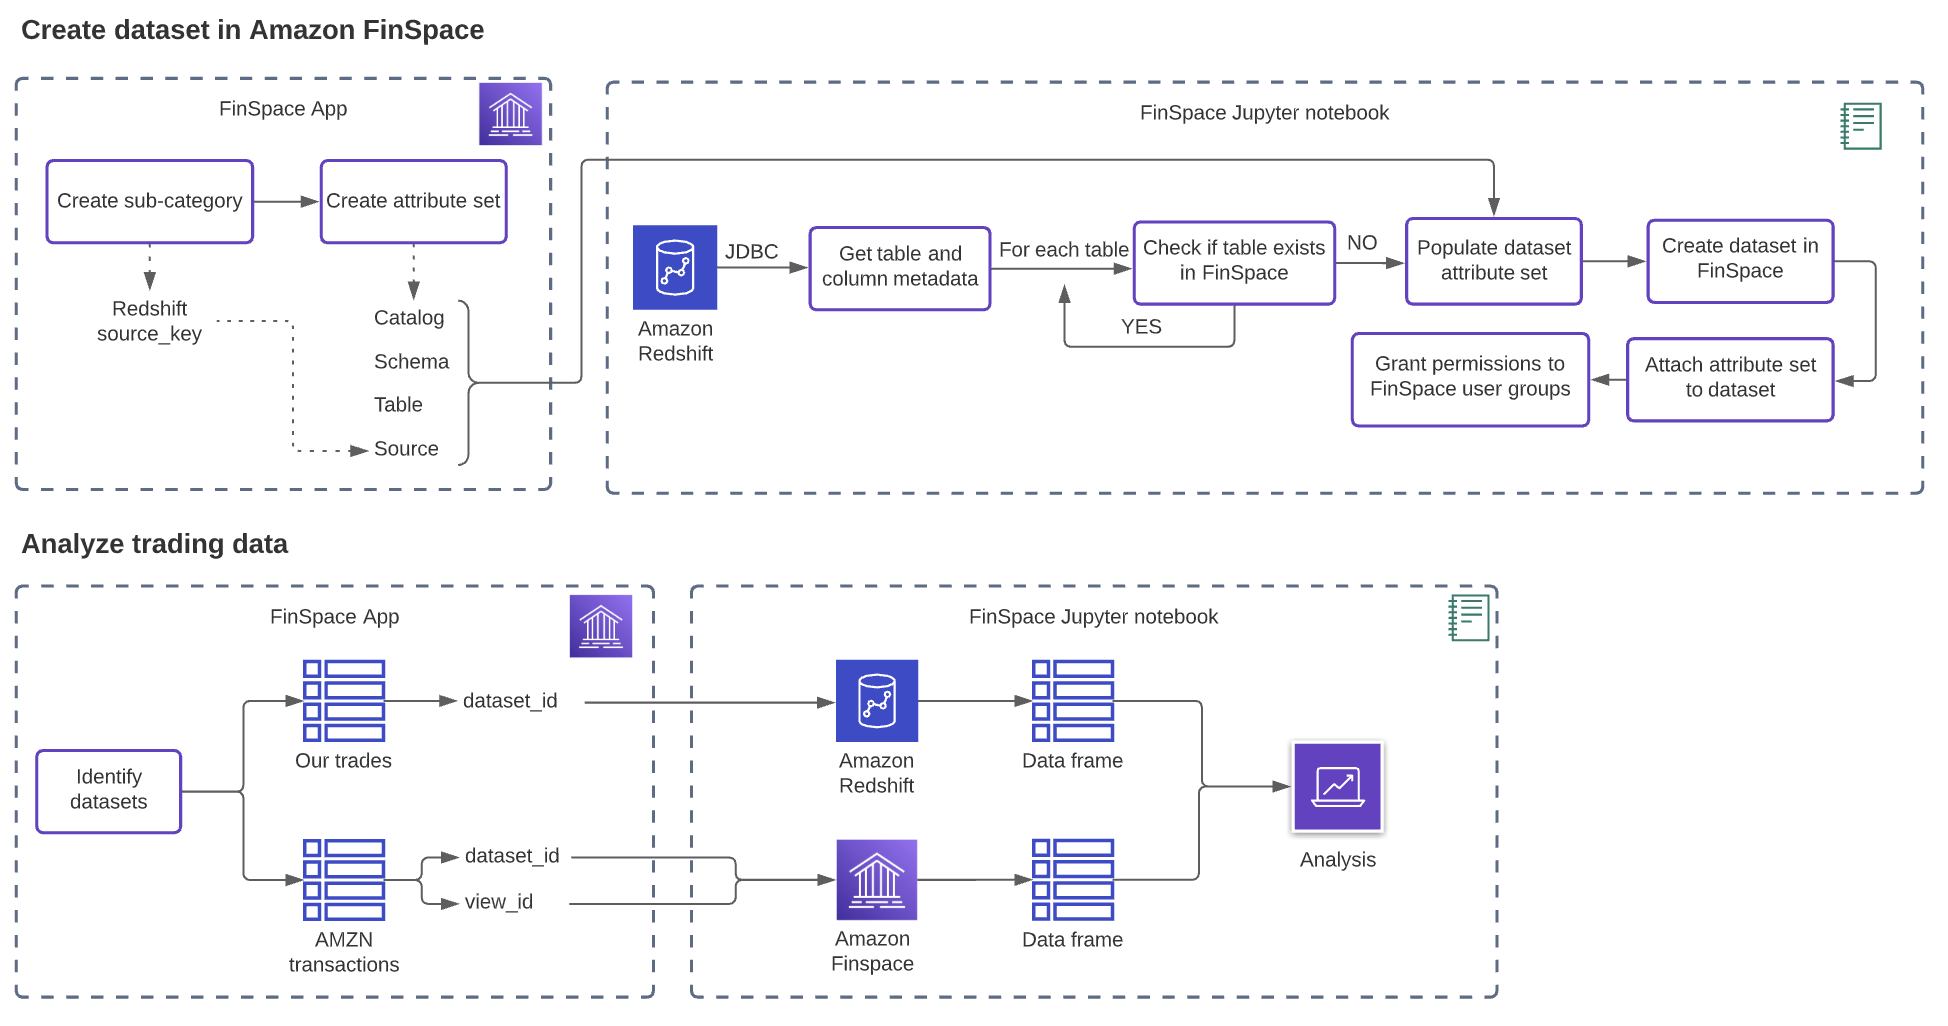
Prerequisites
Before you get started, make sure you have the following prerequisites:
- Download Jupyter notebooks covering Amazon Redshift dataset import and analysis. Import them into FinSpace by cloning the GitHub repo or by dropping them into FinSpace. The code provided in this blog post should be run from the FinSpace notebooks.
- Setup a FinSpace environment. For instructions on creating a new environment, see Create an Amazon FinSpace Environment.
- Install Capital Markets sample data bundle, as explained in the “Sample Data Bundle” guide.
- Ensure you have permissions to manage categories and controlled vocabularies and manage attribute sets in FinSpace.
- Create an Amazon Redshift cluster in the same AWS account as the FinSpace environment. For instructions, see Create a cluster. Additionally, create a superuser and ensure that the cluster is publicly accessible.
- Create a table in Amazon Redshift and insert trading transaction data using these SQL queries.
Configure your FinSpace catalog to describe your Amazon Redshift tables
FinSpace users can discover relevant datasets by using search or by navigating across categories under the Browse Data menu. Categories allow for cataloging of datasets by commonly used business terms (such as source, data class, type, industry, and so on). An attribute set holds additional metadata for each dataset, including categories and table details to enable you to connect to the data source directly from a FinSpace notebook. Analysts can browse and search attributes to find datasets based on the values assigned to them.
Complete the following steps to create a new subcategory called Redshift under the Source category, and create an attribute set called Redshift Table Attributes. In the following section, we use the subcategory and attribute set to tag datasets from Amazon Redshift. FinSpace users can then browse for the data from the Amazon Redshift source from the Browse Data menu and filter datasets in FinSpace for the tables that are located in the company’s Amazon Redshift data warehouse.
- On the FinSpace console, choose Settings (gear icon).
- Choose Categories.
- Hover over the Source category and choose Edit this Category.

- On the Edit Category page, hover over the Source category again and choose Add Sub-Category.
- Add
Redshiftas a source subcategory andFinancial data from company's Amazon Redshift data warehouseas the description.


Next, create an attribute set called Redshift Table Attributes to capture additional business context for each dataset.
- On the FinSpace console, choose Settings (gear icon).
- Choose Attribute Sets.
- Choose CREATE ATTRIBUTE SET.
- Create a new attribute set called
Redshift Table Attributes.

- Add the following fields:
- Catalog – Data String type
- Schema – Data String type
- Table – Data String type
- Source – Categorization Source type


Use FinSpace notebooks to connect to Amazon Redshift
| The notebooks downloaded as part of the prerequisite provide the integration between FinSpace and Amazon Redshift. The steps below explain the code so you can run and extend as needed. |
- Connect to the Spark cluster by running the following code:
After the connection is established, you see a connected to cluster message. It may take 5–8 minutes for the cluster connection to establish.
- Add the JDBC driver to Spark jars by running the following code:
In this example, we use the latest driver version available (2.0). To download the latest JDBC driver, see Download the Amazon Redshift JDBC driver, version 2.0.
- Run cells 1.3–1.4 in the notebook (collapsed to improved readability) to add FinSpace helper classes found in public GitHub examples and to add utility functions.
Python helper classes help with schema and table creation, cluster management, and more. The utility functions help translate Amazon Redshift data to a FinSpace schema.

Next, you update the user group ID that should get access to the datasets, and update the Amazon Redshift connection parameters.
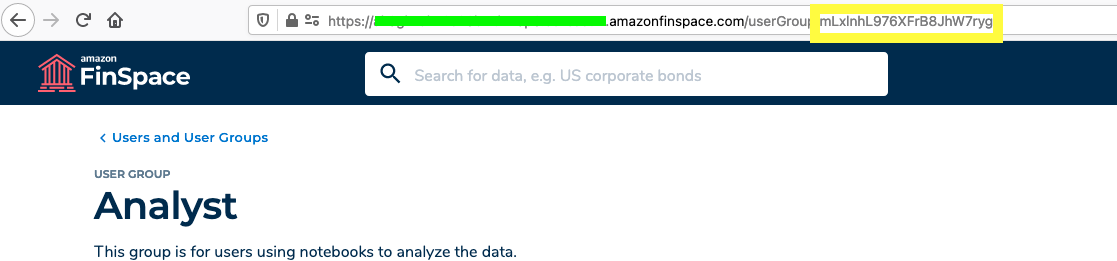
- On the FinSpace console, choose Settings (gear icon).
- Chose Users and User Groups.
- Select a group and copy the group ID from the URL.

- On the Amazon Redshift console, open your cluster.
- Note the cluster endpoint information from the General information section.
- Note your database name, port, and admin user name in the Database configurations section.
If you don’t know your user name or password, contact your Amazon Redshift administrator.

Populate the FinSpace catalog with tables from Amazon Redshift
Now we’re ready to import table metadata from Amazon Redshift into FinSpace. For each table, we create a FinSpace dataset, populate the attribute set we created with the metadata about the table (catalog, schema, table names, and Redshift subcategory for the Source category), and associate the populated attribute set to the created dataset.
- Use
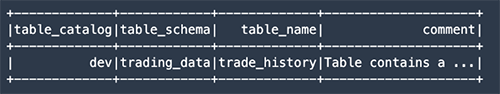
spark.readto retrieve a list of tables and columns as a Spark DataFrame:
As a result, you get two DataFrames, tablesDF and schemaDF, containing a list of tables and associated metadata (database, schema, table names, and comments) as shown in the following screenshot.
- Get the attribute set
Redshift Table Attributesthat we created earlier by runningfinspace.attribute_set(att_name). We use its identifiers for populating the metadata for each dataset we create in FinSpace.
- Get an ID for the
Redshiftsubcategory to populate the attribute set and identify the datasets with the Amazon Redshift source:
As an output, you get the source_key ID for the Redshift subcategory.
![]()
- Use
list_dataset_metadata_by_taxonomy_node(taxonomyId, source_key)to get the list of existing datasets in FinSpace to avoid duplicating the data if an Amazon Redshift table already exists in FinSpace:
If you already have tables tagged with Redshift as a source, your output looks similar to the following screenshot.

- Set permissions and owner details by updating the following code with your desired values:
- Create a DataFrame with a list of tables in Amazon Redshift to iterate over:
- Run the following code to:
- Check if a table already exists in FinSpace;
- If it doesn’t exist, get table’s schema and create an attribute set;
- Add the description and the attribute set to the dataset (Catalog, Schema, Table names, and Source).
Search the FinSpace catalog for data
Analysts can search for datasets available to them in FinSpace and refine the results using category filters. To analyze our trading activity in the next section, we need to find two datasets: all trades of AMZN stock, and the buy and sell orders from the Amazon Redshift database.
- Search for “AMZN” or “US Equity TAQ Sample” to find the “US Equity TAQ Sample – 14 Symbols 6 Months – Sample” dataset provided as part of the Capital Markets Sample Data Bundle.
You can explore the dataset schema and review the attribute set.

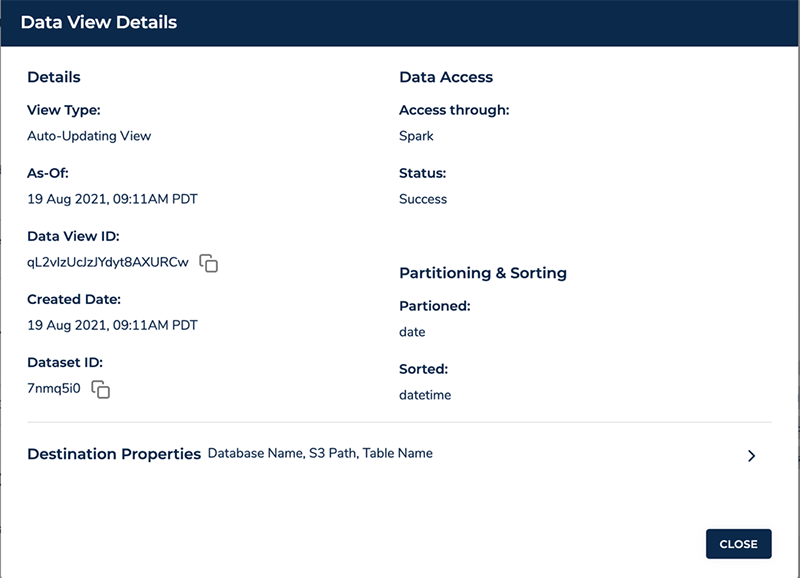
- Copy the dataset ID and data view ID on the Data View Details page.
We use these IDs in the next section to connect to the data view in FinSpace and analyze our trading activity.
Next, we find the trade_history dataset that we created from the Amazon Redshift table and copy its dataset ID.
- On the FinSpace console, choose Source under BROWSE DATA and choose Redshift.
- Open the
trade_historytable. - Copy the dataset ID located in the URL.

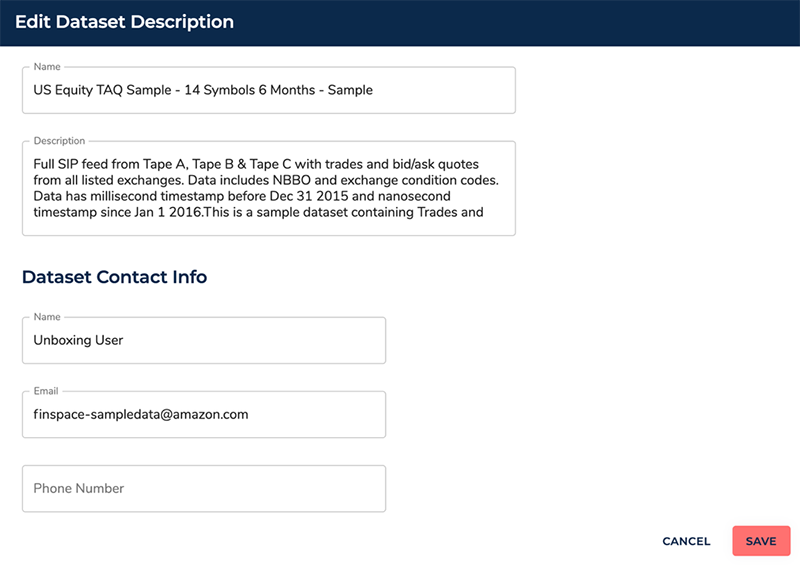
Users with permissions to create datasets can also update the dataset with additional information, including a description and owner contact information if those details have changed since the dataset was created in FinSpace.
Use FinSpace notebooks to analyze data from both FinSpace and Amazon Redshift
We’re now ready to analyze the data.
- Import the analysis notebook to JupyterLab in FinSpace.
- Follow the steps covered in the previous section, Connect to Amazon Redshift from a FinSpace Jupyter notebook using JDBC, to connect to the FinSpace cluster and add a JDBC driver to Spark jars. Add helper and utility functions.
- Set up your database connection and date parameters. In this scenario, we analyze trading activity for January 2, 2021.
- Connect to Amazon Redshift and query the table directly. Import the data as a Spark DataFrame.
As a result, you get the data stored in the Amazon Redshift database as a Spark DataFrame.
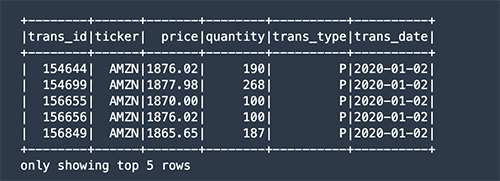
- Filter for stock purchase transactions (labeled as P) and calculate an average price paid:
- Get trading data from the FinSpace Capital Markets dataset:
- Apply date, ticker, and trade type filters:
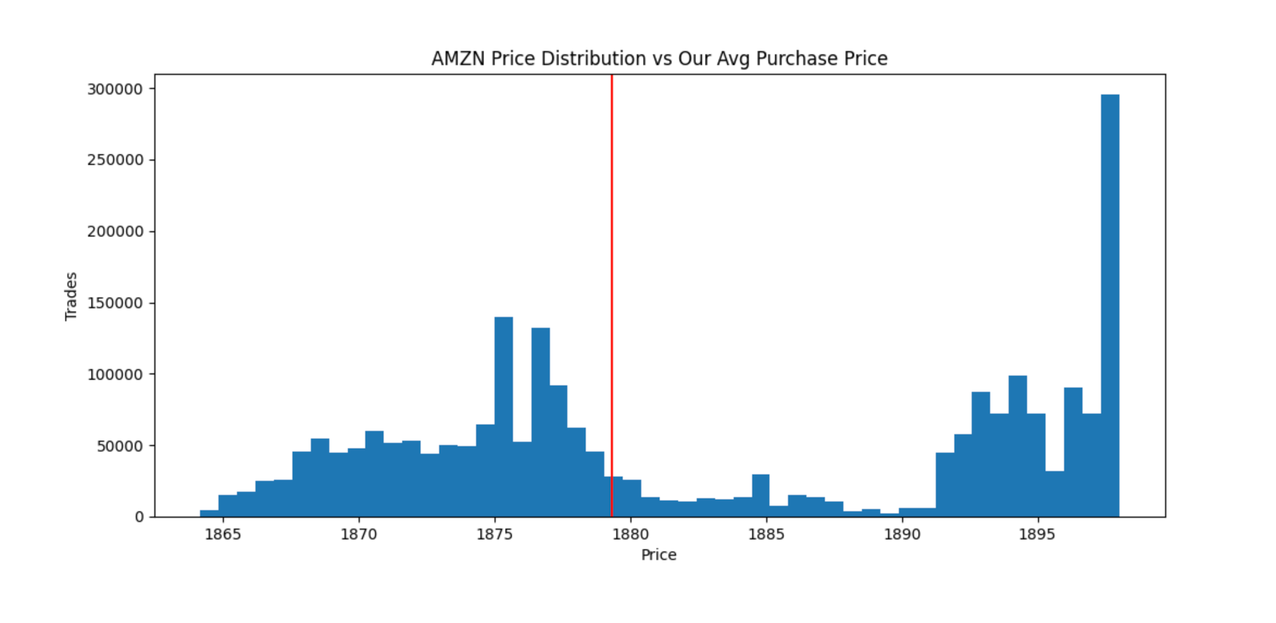
- Compare the average purchase price to the daily trading price and plot them to compare how close we got to the lowest price.
As a result, you get a distribution of AMZN stock prices traded on January 2, 2021, which we got from a dataset in FinSpace. The red line in the following graph is the average price we paid for the stock calculated from the transaction data stored in Amazon Redshift. Although we didn’t pay the highest price traded that day, we performed average, paying $1,877 per share versus the lowest price of $1,865.
Clean up
If your work with FinSpace or Amazon Redshift is complete, delete the Amazon Redshift cluster or the FinSpace environment to avoid incurring additional fees.
Conclusion
In this post, we reviewed how to connect the Amazon Redshift database and FinSpace in order to create new datasets in FinSpace using the table metadata from Amazon Redshift. We then explored how to look for available data in the FinSpace web app to find two datasets that can help us evaluate how close we got to the best daily price. Finally, we used FinSpace dataset details to import the data into two DataFrames and plot price distribution versus the average price we paid. As a result, we reduced the time it takes to discover and connect to datasets needed for analyzing trading transactions.
Download the import and analysis Jupyter notebooks discussed in this blog post on GitHub.
Visit the FinSpace user guide to learn more about the service, or contact us to discuss FinSpace or Amazon Redshift in more detail.
About the Authors
 Mariia Berezina is a Sr. Launch Manager at AWS. She is passionate about building new products to help customers get the most out of data. When not working, she enjoys mentoring women in technology, diving, and traveling the world.
 Vincent Saulys is a Principal Solutions Architect at AWS working on FinSpace. Vincent has over 25 years of experience solving some of the world’s most difficult technical problems in the financial services industry. He is a launcher and leader of many mission-critical breakthroughs in data science and technology on behalf of Goldman Sachs, FINRA, and AWS.