Post Syndicated from original https://www.backblaze.com/blog/drive-failure-over-time-the-bathtub-curve-is-leaking/
From time to time, we will reference the “bathtub curve” when talking about hard drive and SSD failure rates. This normally includes a reference or link back to a post we did in 2013 which discusses the topic. It’s time for an update. Not because the bathtub curve itself has changed, but because we have nearly seven times the number of drives and eight more years of data than we did in 2013.
In today’s post, we’ll take an updated look at how well hard drive failure rates fit the bathtub curve, and in a few weeks we’ll delve into the specifics for different drive models and even do a little drive life expectancy analysis.
Once Upon a Time, There Was a Bathtub Curve
Here is the classic version of the bathtub curve.
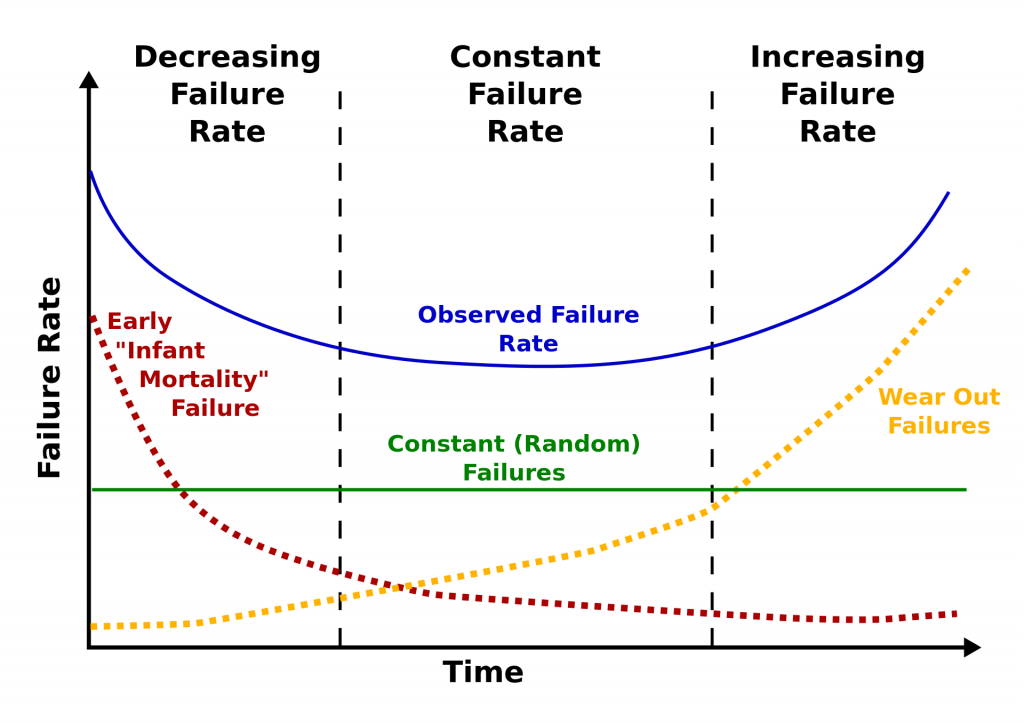
The curve is divided into three sections: decreasing failure rate, constant failure rate, and increasing failure rate. Using our 2013 drive stats data, we computed a failure rate and a timeframe for each of the three sections as follows:
2013 Drive Failure Rates
| Curve Section | Failure Rate | Length |
|---|---|---|
| Decreasing | 5.1% | 0 to 18 Months |
| Constant | 1.4% | 18 Months to 3 Years |
| Increasing | 11.8% | 3 to 4 Years |
Furthermore, we computed that at four years, the life expectancy of a hard drive in our system was about 80%, and forecasting that out, at six years, the life expectancy was 50%. In other words, we would expect a hard drive we installed to have a 50% chance of being alive after six years.
Drive Failure and the Bathtub Curve Today
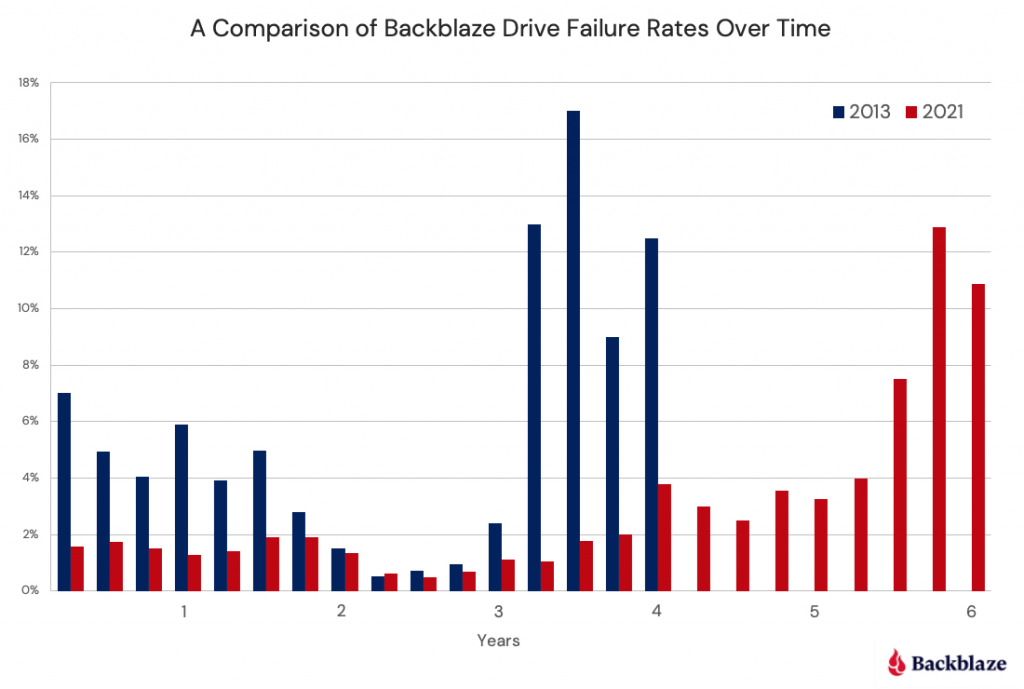
Let’s begin by comparing the drive failure rates over time based on the data available to us in 2013 and the data available to us today in 2021.
Observations and Thoughts
- Let’s start with an easy one: We have six years worth of data for 2021 versus four years for 2013. We have a wider bathtub. In reality, it is even wider, as we have more than six years of data available to us, but after six years the number of data points (drive failures) is small, less than 10 failures per quarter.
- The left side of the bathtub, the area of “decreasing failure rate,” is dramatically lower in 2021 than in 2013. In fact, for our 2021 curve, there is almost no left side of the bathtub, making it hard to take a bath, to say the least. We have reported how Seagate breaks in and tests their newly manufactured hard drives before shipping in an effort to lower the failure rates of their drives. Assuming all manufacturers do the same, that may explain some or all of this observation.
- The right side of the bathtub, the area of “increasing failure rate,” moves right in 2021. Obviously, drives installed after 2013 are not failing as often in years three and four, or most of year five for that matter. We think this may have something to do with the aftermath of the Thailand drive crisis back in 2011. Drives got expensive, and quality (in the form of reduced warranty periods) went down. In addition, there was a fair amount of manufacturer consolidation as well.
- It is interesting that for year two, the two curves, 2013 and 2021, line up very well. We think this is so because there really is a period in the middle in which the drives just work. It was just shorter in 2013 due to the factors noted above.
The Life Expectancy of Drives Today
As noted earlier, back in 2013, the 80% of the drives installed would be expected to survive four years. That fell to 50% after six years. In 2021, the life expectancy of a hard drive being alive at six years is 88%. That’s a substantial increase, but it basically comes down to the fact that hard drives are failing less in our system. We think it is a combination of better drives, better storage servers, and better practices by our data center teams.
What’s Next
For 2021, our bathtub curve looks more like a hockey stick, although saying, “When you review our hockey stick curve…” doesn’t sound quite right. We’ll try to figure out something by our next post on the topic. One thing we also want to do in that next post is to break down the drive failure data by model and see if the different drive models follow the bathtub curve, the hockey stick curve, or some other unnamed curve. We’ll also chart out the life expectancy curves for all the drives as a whole and by drive model as well.
Well, time to get back to the data, our next Drive Stats report is coming up soon.
The post Drive Failure Over Time: The Bathtub Curve Is Leaking appeared first on Backblaze Blog | Cloud Storage & Cloud Backup.