Post Syndicated from Kareem Syed-Mohammed original https://aws.amazon.com/blogs/big-data/embed-interactive-dashboards-in-your-apps-and-portals-in-minutes-with-amazon-quicksights-new-1-click-embedding-feature/
Amazon QuickSight is a fully-managed, cloud-native business intelligence (BI) service that makes it easy to connect to your data, create interactive dashboards, and share these with tens of thousands of users, either directly within a QuickSight application, or embedded in web apps and portals.
QuickSight Enterprise Edition now supports 1-click embedding, a feature that allows you to embed rich, interactive dashboards in apps, wikis, and portals without needing to call embedding APIs. Authorized end-users can start accessing these dashboards instantly, without any server deployments or infrastructure licensing needed! 1-click embedding allows you to enable your users with insights in minutes.
In this post, we discuss the steps to implement this solution, the end-user experience, and a sample use case.
Solution overview
To implement the solution, we will walk through the following steps:
- Enable permissions on the dashboard (through the UI or API).
- Allow list the domain where you want to embed the dashboard in QuickSight.
- Embed the dashboard.
Step 1: Enable permissions on the dashboard
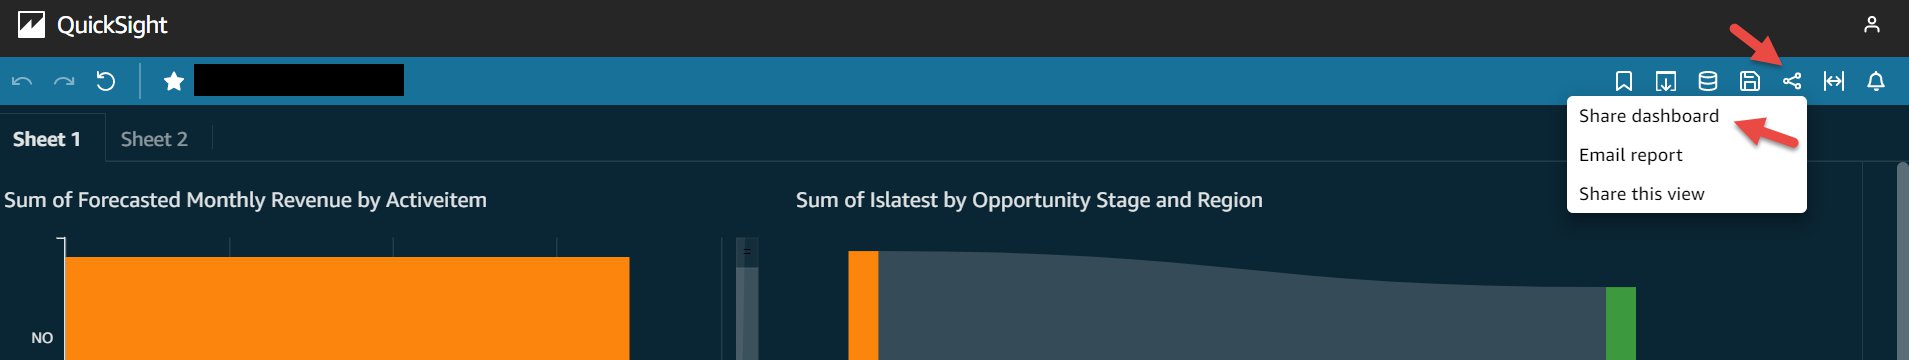
After you create a QuickSight dashboard, to enable access, open the dashboard and on the top right choose the share icon and choose Share dashboard.
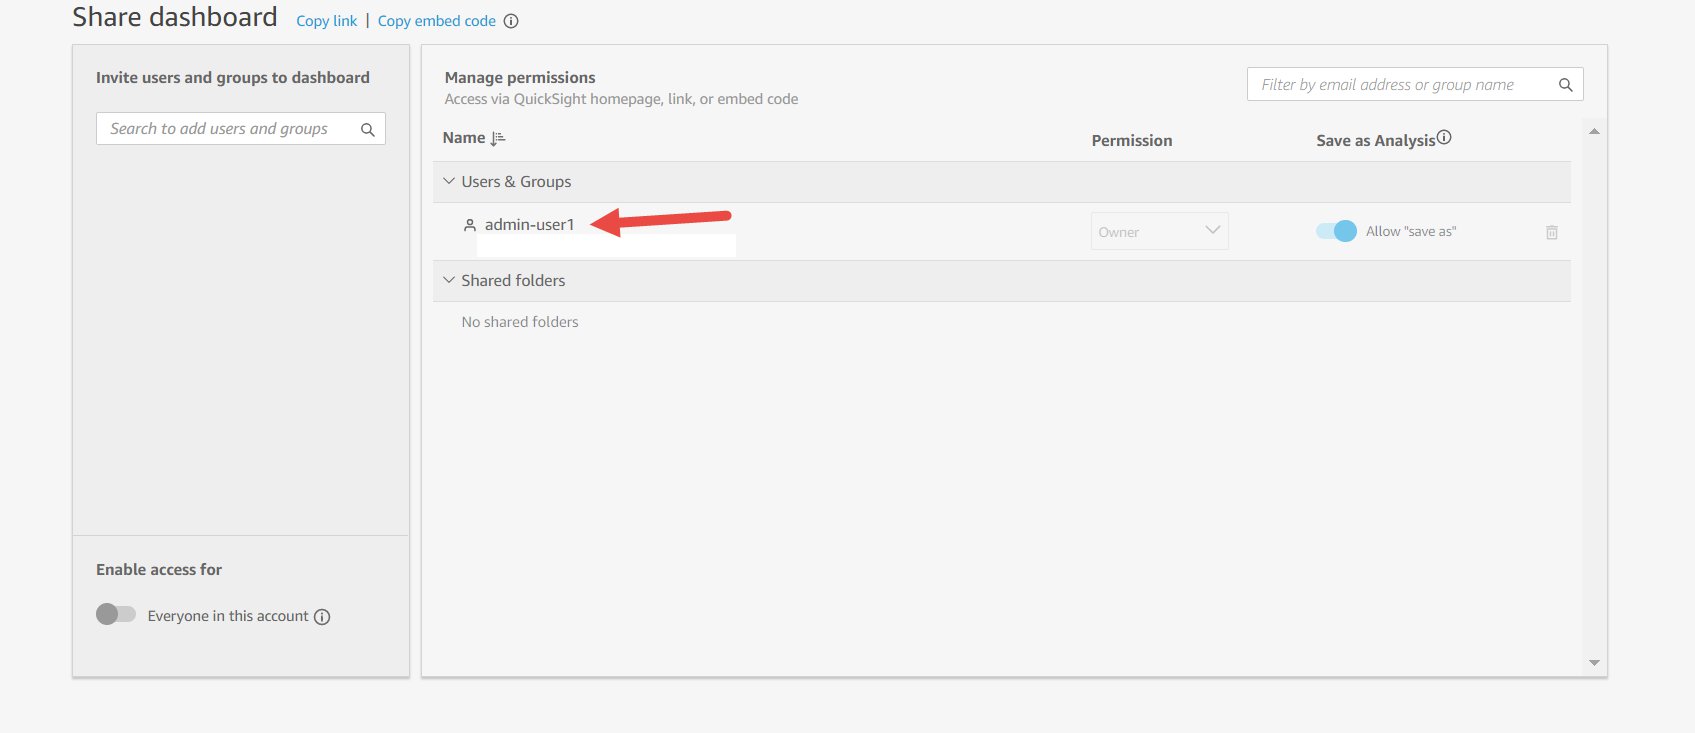
This opens the share screen. By default, a dashboard in QuickSight isn’t shared with anyone and is only accessible to the owner. In the following screenshot, the dashboard is shared with (and therefore accessible by) admin-user1 (the owner of the dashboard).
You can search for individual users or groups in your account that you want to share this dashboard with. For example, see the following screenshot.
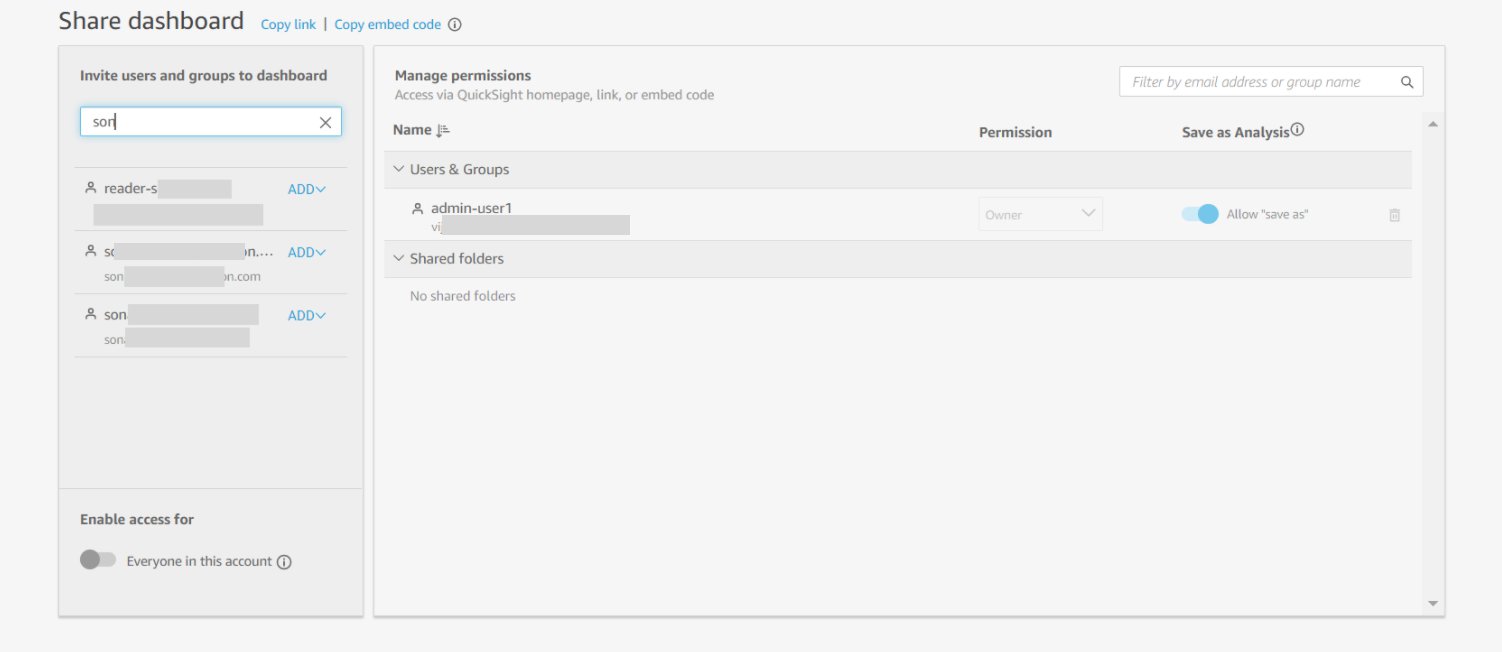
In this example, the owner of the dashboard searches for a user whose email starts with son, which returns three options. The listed users can be authors or readers in the account. When you choose ADD next to every search result, based on the role (author or reader), you can select the permission level (viewer or co-owner) and add the user to access the dashboard. Authors can be added to this dashboard as viewers or co-owners. Viewers can view, export, and print a dashboard. Co-owners can do all actions that viewers can do and can also edit, delete, or share the dashboard, or build new dashboards from this dashboard. Readers can be added only as viewers. Dashboard owners can similarly search for and add groups to access the dashboard.
The following screenshot shows all the added users with whom we want to share this dashboard.
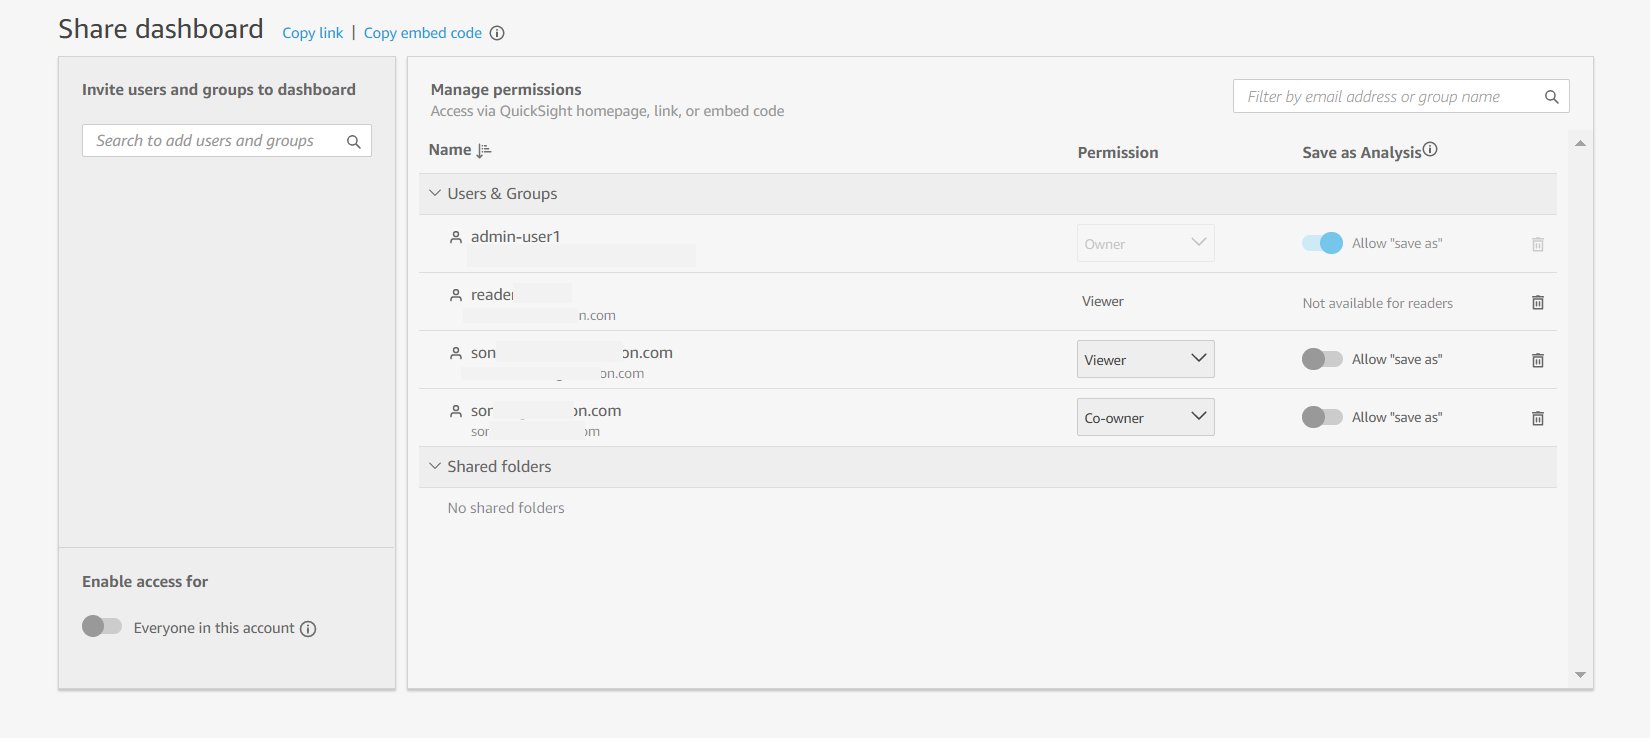
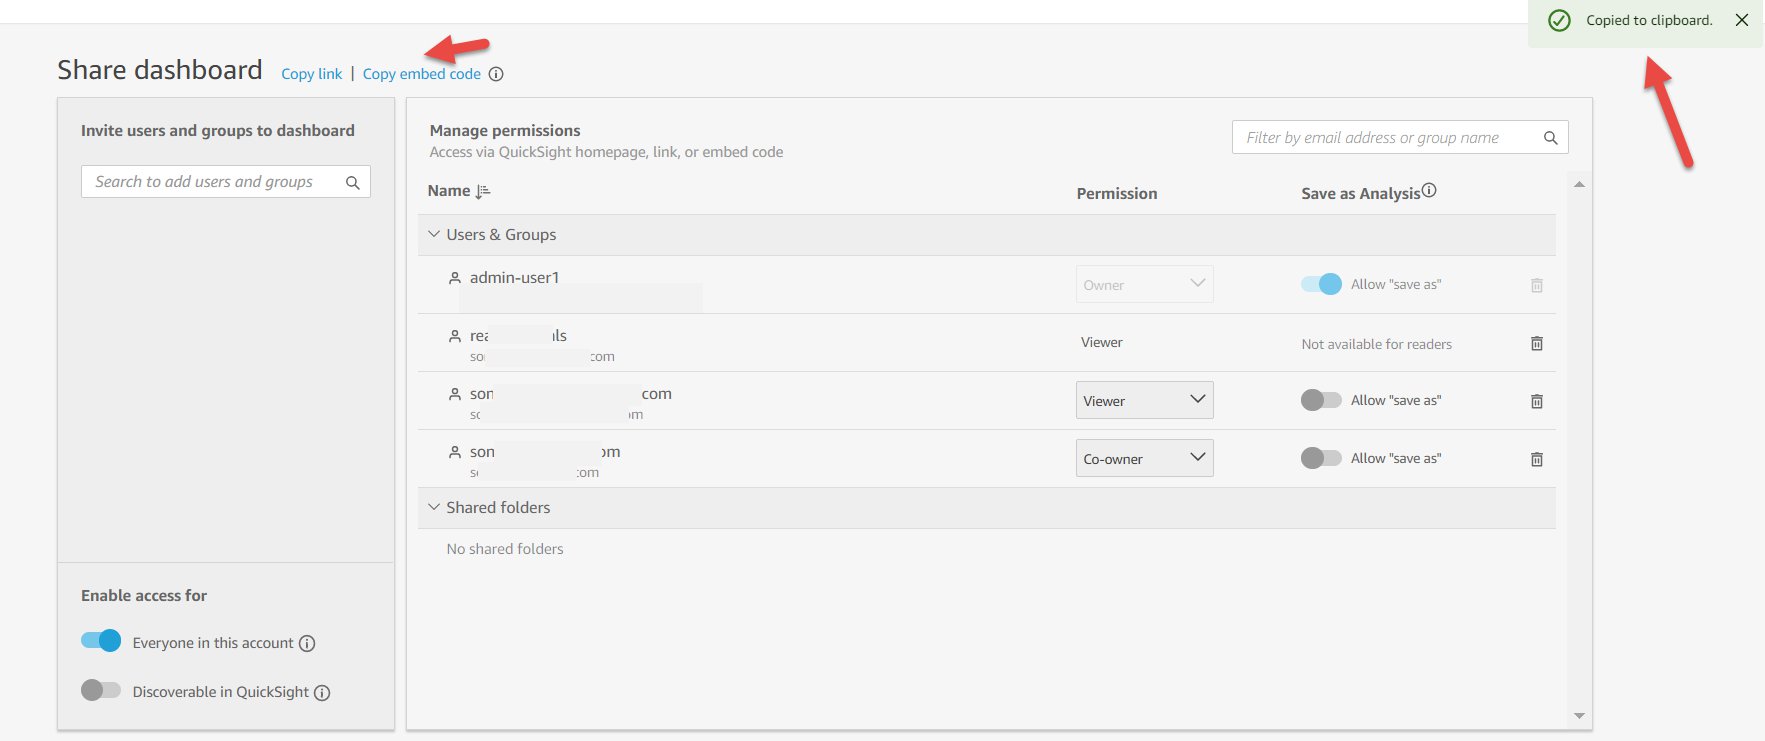
You can also enable all users on your QuickSight account to access the dashboard by enabling access to Everyone in this account, as shown in the following screenshot.
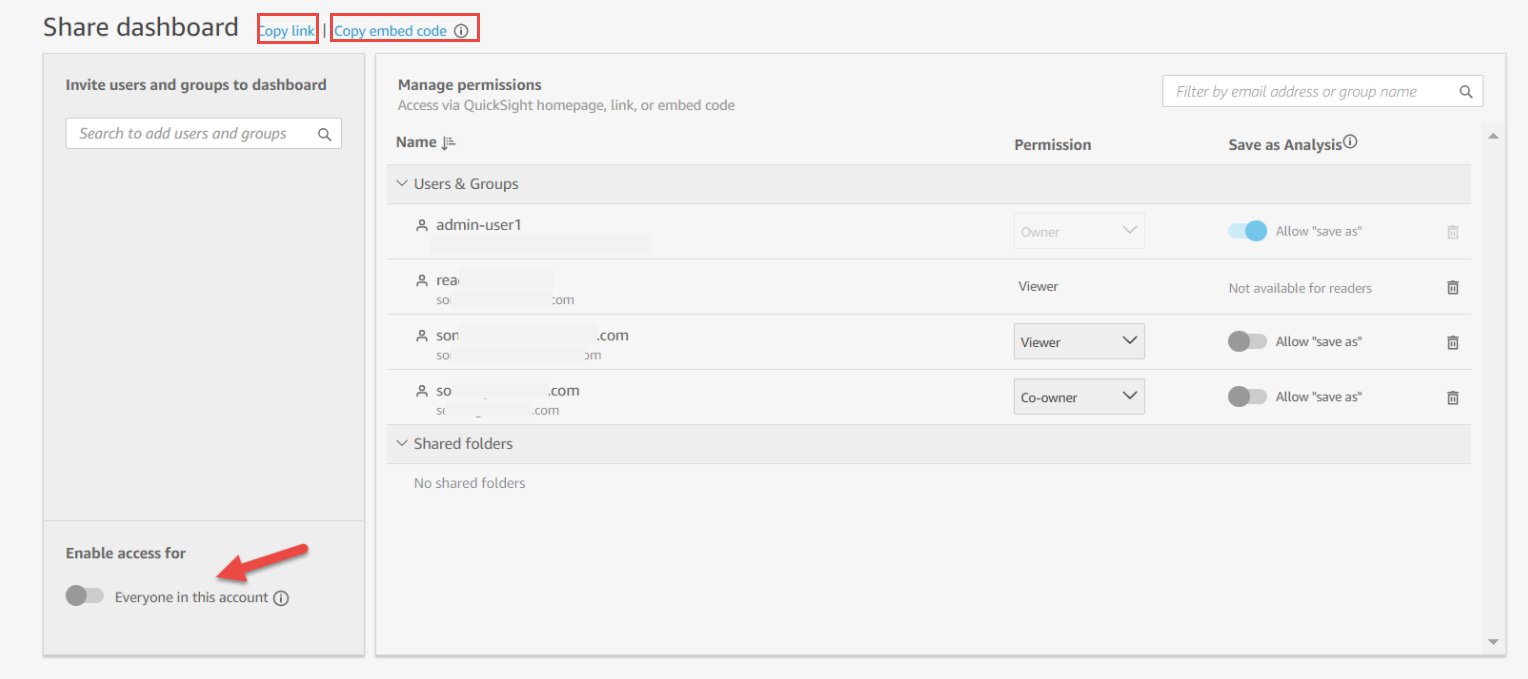
When this option is enabled, users who haven’t been added explicitly to access the dashboard can now access the dashboard via the link available via the Copy option (available on the top of the Share dashboard page) or when embedded. To revoke this account-wide dashboard access to everyone on your account, you disable the same toggle.
Also, when this option is enabled, owners have the option to enable the dashboard to show this dashboard in all users’ QuickSight accounts, as shown in the following screenshot. Enabling this option ensures that the dashboard is visible in the Dashboards list for every user in the account. If this is disabled, they can still access the dashboard if they have the link, or if it’s embedded, but they can’t see it in their list of dashboards on the home screen.

Step 2: Allow list the embedding domain
The domain where the dashboard is to be embedded must be allow listed in QuickSight. For instructions, see Adding Domains for Embedded Users.
Step 3: Embed the dashboard
After you set your desired access to the dashboard, you can choose Copy embed code, which copies the embed code for that dashboard. This code embeds the dashboard when added to the internal application.
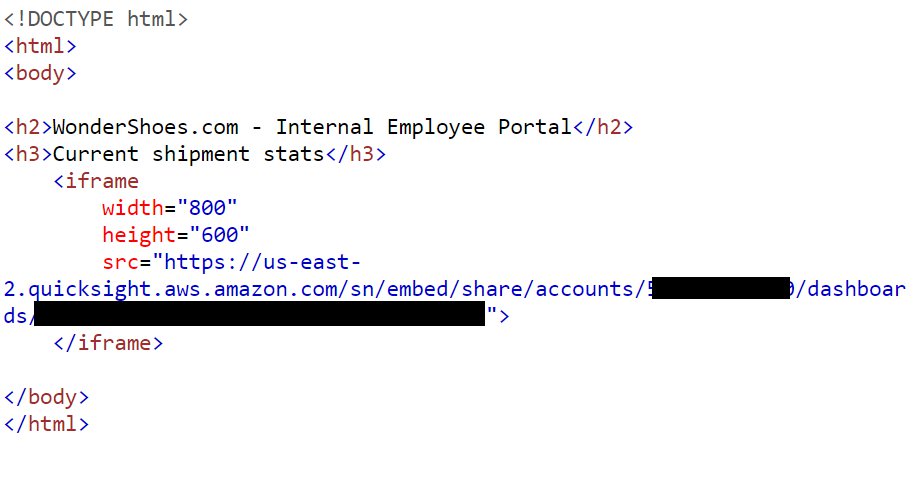
The copied embed code is similar to the following code (the QuickSight domain is the URL you use to access your QuickSight account):
Embed a dashboard in an HTML page
To embed the dashboard in an HTML page, open the HTML of the page where you want to embed the dashboard and enter the copied embed code into the HTML code.
Now, let’s look at some common embedding scenarios in an organization.
Embed a dashboard in a Google site
If you have your internal applications built on Google sites, to embed your dashboard, open the page on Google site, and choose Insert and Embed. A pop-up window appears with a prompt to enter a URL or embed code. Choose Embed code and enter the copied embed code in the text box.

Make sure to allow list the following domains in QuickSight when embedding in Google sites https://googleusercontent.com (enable subdomains), https://www.gstatic.com and https://sites.google.com.
Embed a dashboard in a SharePoint site
You can embed a dashboard when you’re creating a SharePoint site (template type Publishing). Choose New to create a new page.
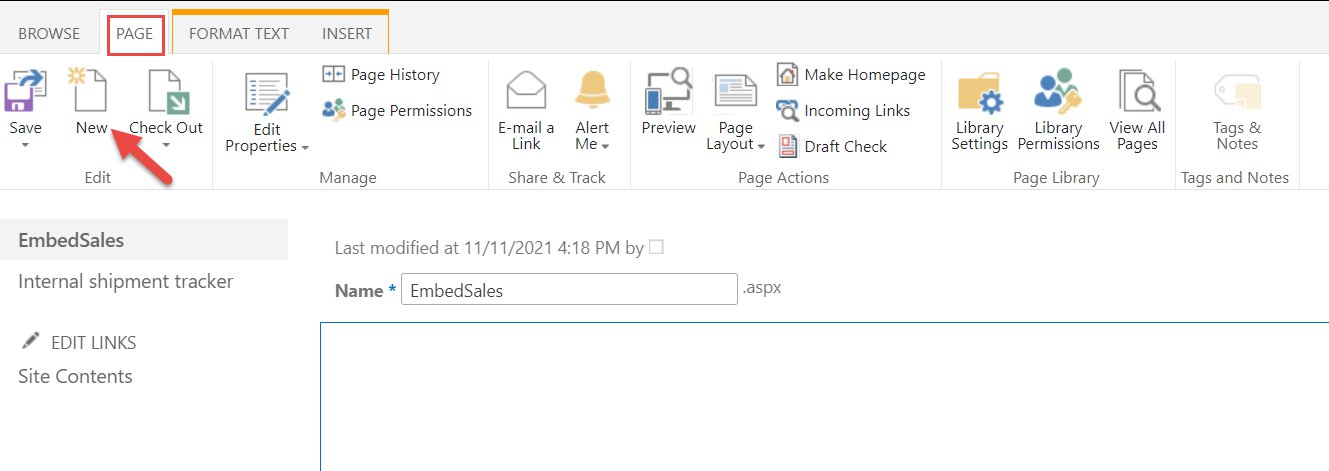
On the Insert ribbon, choose Embed Code.
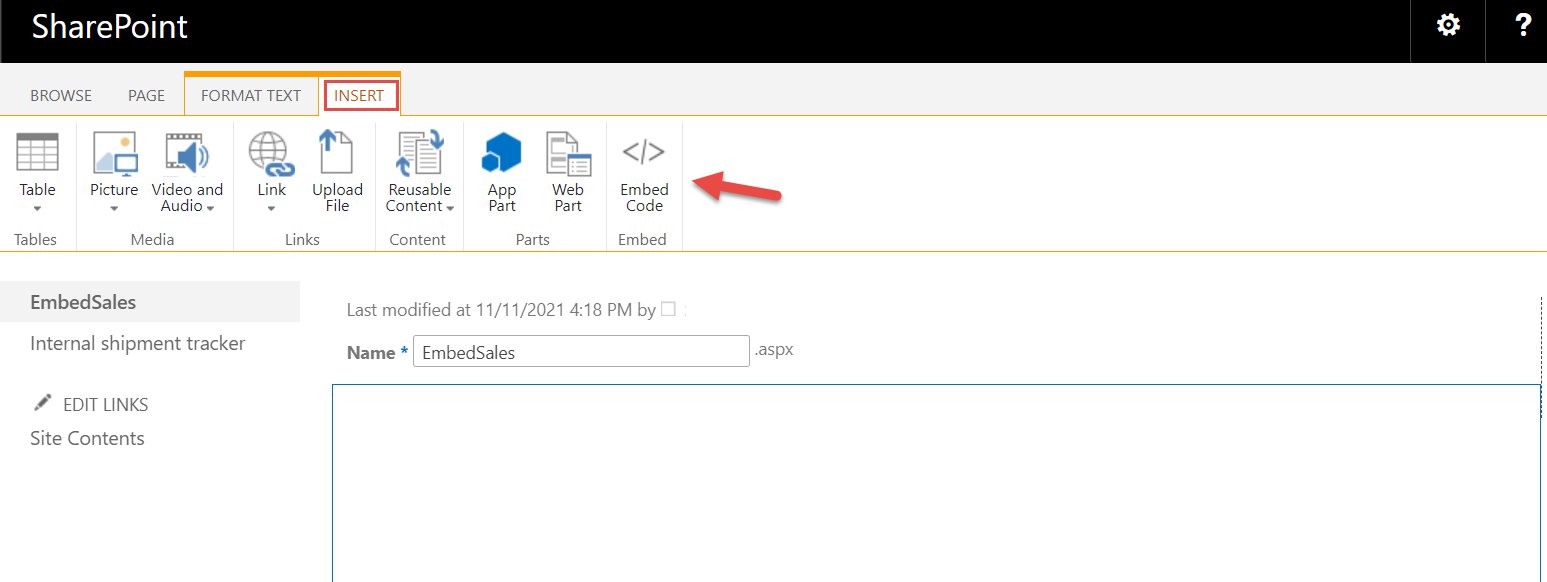
In the pop-up that opens, insert the embed code that you copied.

If you’re embedding dashboards in software as a service (SaaS) apps or portals that have their own authentication schemes, you can continue using these and seamlessly serve dashboard to the users. For more information, see Embed multi-tenant dashboards in SaaS apps using Amazon QuickSight without provisioning or managing users.
End-user experience
After you embed the dashboard in your application, users that you enabled earlier can access it. In this section, we walk through the user experience with and without single sign-on (SSO) integration with QuickSight.
Experience when QuickSight has SSO integration enabled
When SSO is enabled, when users access the application, they are single signed-on to QuickSight and aren’t presented with the authentication pop-up. If users have access to the dashboard, they see the data on the dashboard and can interact with it. If they don’t have access to the dashboard, they see a message that they’re not authorized to view the dashboard.
In the following screenshot, the user is authenticated with SSO and sees the dashboard.
You can set up SP-initiated SSO if you’re using an existing identity provider (IdP) such as Ping, Okta, or Azure AD. To learn more about enabling SSO on QuickSight, see Using Identity Federation and Single Sign-on (SSO) with Amazon QuickSight and Federate Amazon QuickSight access with Okta.
Experience when QuickSight doesn’t have SSO integration enabled
Without SSO integration, when end-users access the application, they see the embedded dashboard (requiring authentication) along with a pop-up to authenticate into QuickSight. After users enter their QuickSight credentials, the pop-up closes and the dashboard is loaded on the application. If the user has access to the dashboard, they see the data on the dashboard and can interact with it.
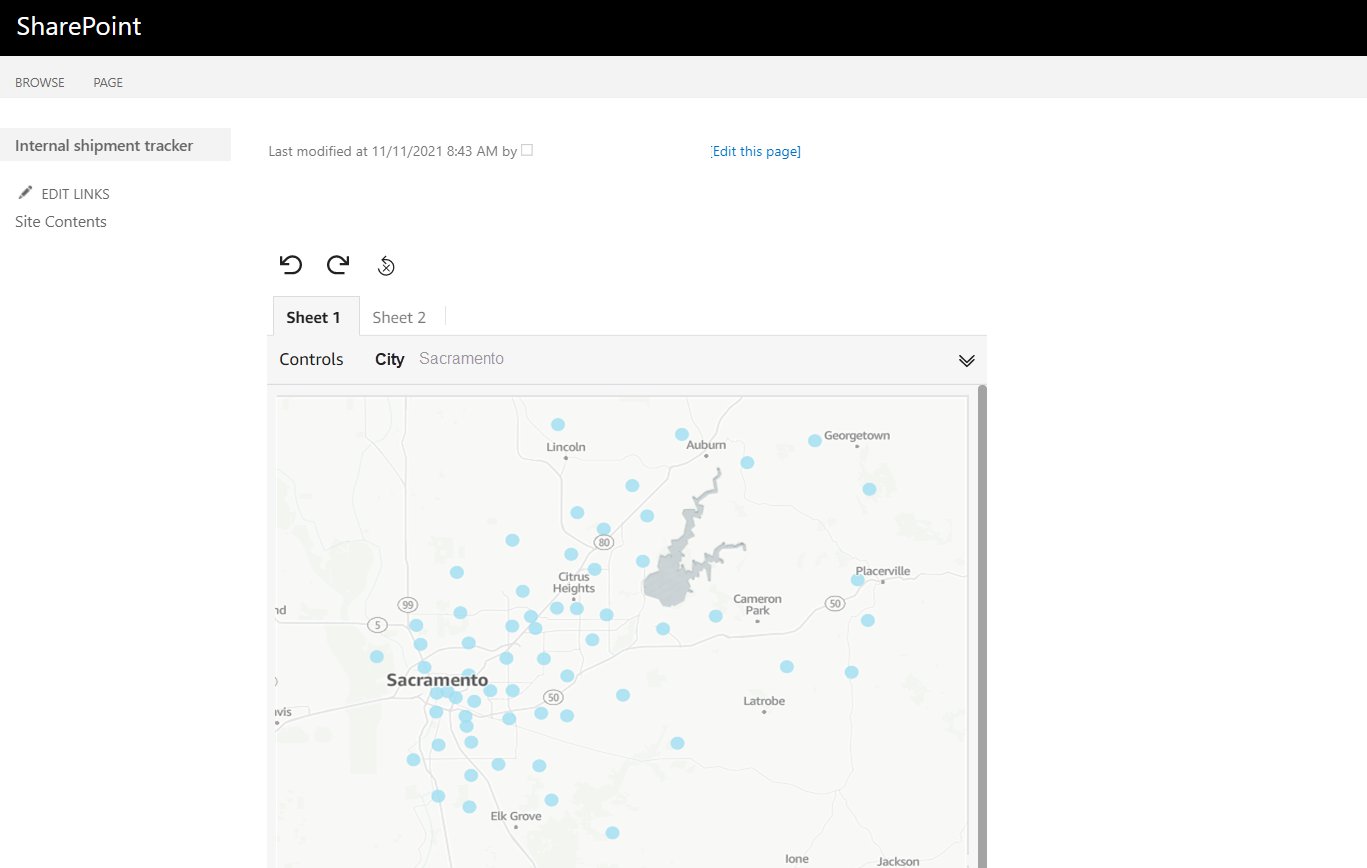
The following screenshot shows a dashboard that is embedded in an internal SharePoint site that tracks weekly shipped orders, and users are asked to authenticate.
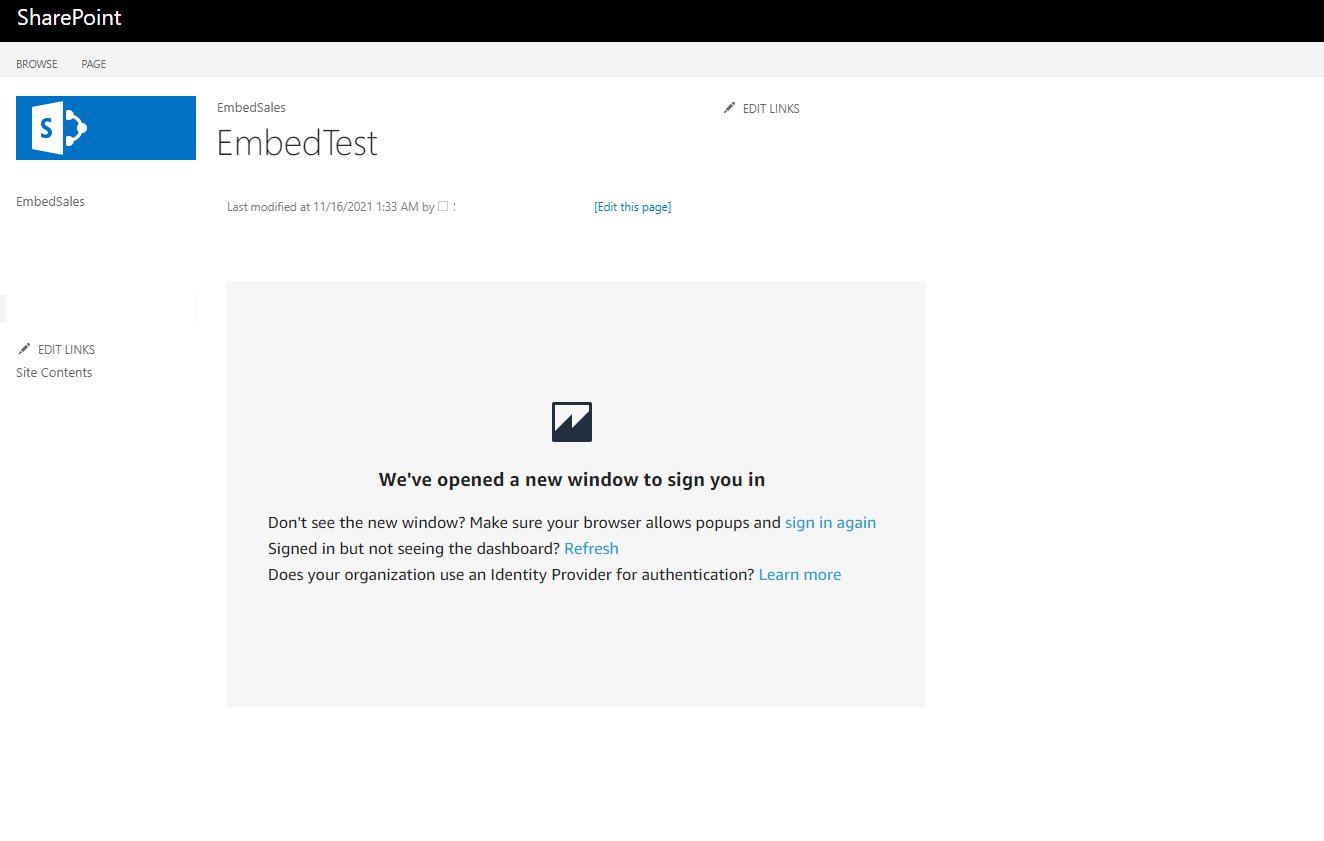
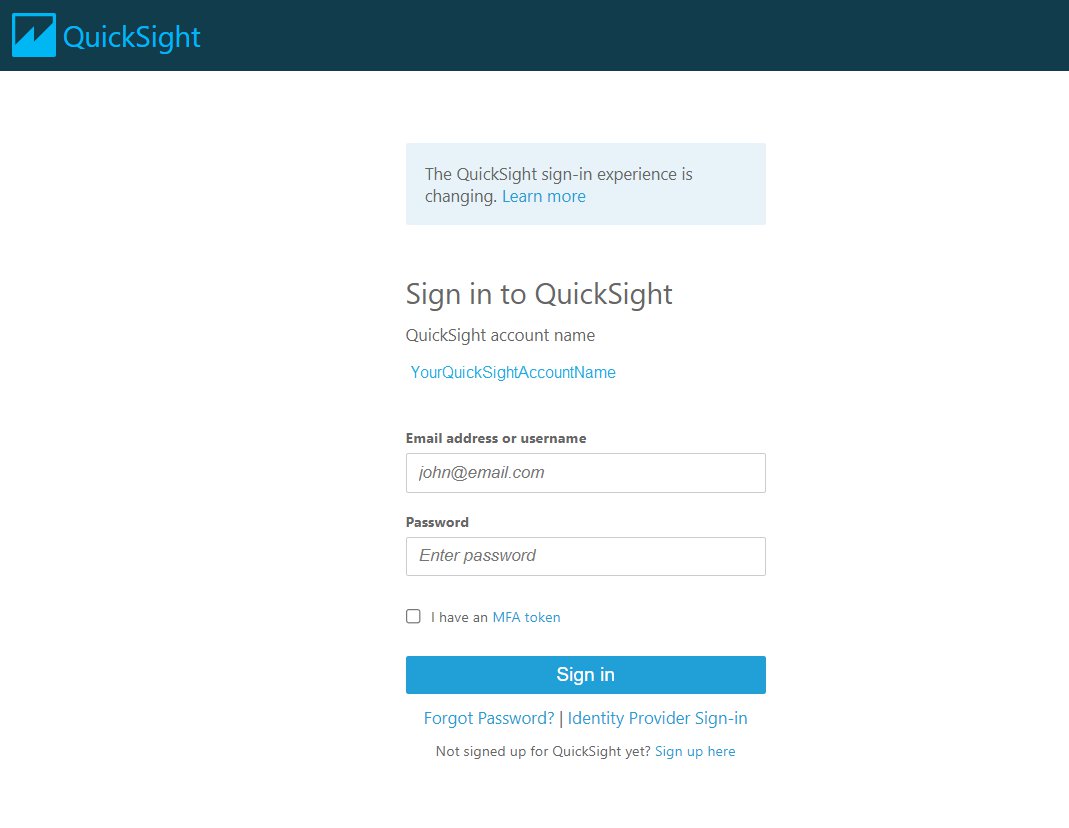
The following is the pop-up to authenticate.
Use case
In this section, we explore an example use case of a small enterprise, a shoe retailer named WonderShoes. They have recently ventured into telecommerce (selling via phone channel) and have set up call centers in their company to take customer calls from those who are interested in buying shoes.
They’re embedding a dashboard in their internal site that tracks the call volume, other call-related metrics, and sales metrics that they measure on daily business. They have built out a dashboard and enabled all their internal users to be able to access this dashboard. With the 1-click embed feature, they have embedded the following embed code in their internal application’s page:
The following screenshot shows their internal application with the embedded dashboard and authentication prompt.

Users are authenticated and then can see the dashboard. If they come back to the site with valid authentication cookies, they can see the dashboard without needing to authenticate again.
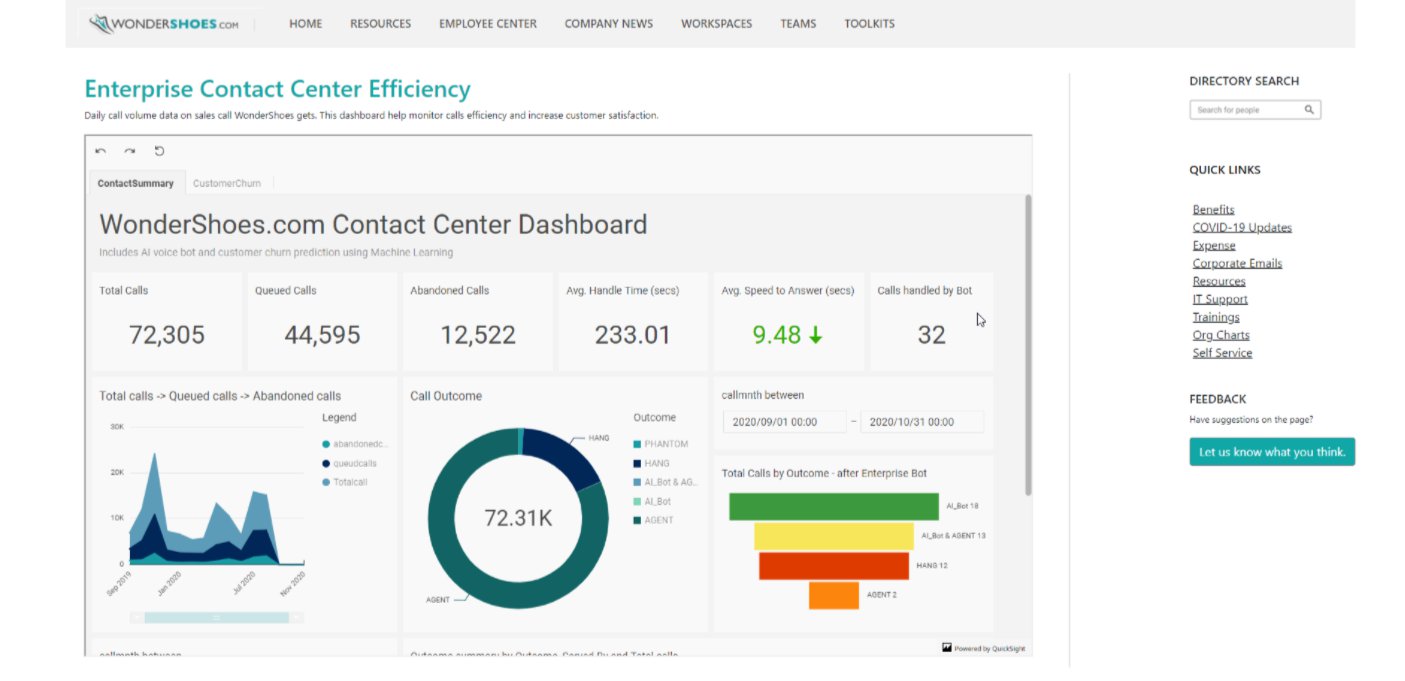
This feature enabled WonderShoes to embed their dashboard quickly and have all their internal employees access the embedded dashboard. They can now gather rich insights and make quick data-driven business decisions to grow their new telecommerce business division.
Conclusion
With 1-click enterprise embedding, enterprises can now embed rich and interactive QuickSight dashboards quickly and easily. This enables you to share important metrics and data insights with all users in your account with a click of a button – all without any infrastructure setup or management while scaling to millions of users. QuickSight also supports embedding in SaaS apps without any user management needed. To learn more about this, read this blogpost.
For more updates about QuickSight embedded analytics, see What’s New in the Amazon QuickSight User Guide.
About the Authors
 Kareem Syed-Mohammed is a Product Manager at Amazon QuickSight. He focuses on embedded analytics, APIs, and developer experience. Prior to QuickSight he has been with AWS Marketplace and Amazon retail as a PM. Kareem started his career as a developer and then PM for call center technologies, Local Expert and Ads for Expedia. He worked as a consultant with McKinsey and Company for a short while.
 Kenz Shane is a UI Designer for Amazon QuickSight. As part of the product’s Business Intelligence User Experience (BIUX) team, she specializes in creating customer-focused visual interfaces. Previously, she worked with the Experience Innovation Group at Dell, serving as a subject matter expert in enterprise-grade user interface (UI) design, accessible data visualization, and design systems. Kenz has provided art direction and design for clients across multiple industries, including Nordstrom, Columbia Hospitality, AIGA, and Warner Bros.
 Raji Sivasubramaniam is a Specialist Solutions Architect at AWS, focusing on Analytics. Raji has 20 years of experience in architecting end-to-end Enterprise Data Management, Business Intelligence and Analytics solutions for Fortune 500 and Fortune 100 companies across the globe. She has in-depth experience in integrated healthcare data and analytics with wide variety of healthcare datasets including managed market, physician targeting and patient analytics. In her spare time, Raji enjoys hiking, yoga and gardening.
 Srikanth Baheti is a Specialized World Wide Sr. Solution Architect for Amazon QuickSight. He started his career as a consultant and worked for multiple private and government organizations. Later he worked for PerkinElmer Health and Sciences & eResearch Technology Inc, where he was responsible for designing and developing high traffic web applications, highly scalable and maintainable data pipelines for reporting platforms using AWS services and Serverless computing.-