Post Syndicated from Kareem Syed-Mohammed original https://aws.amazon.com/blogs/big-data/amazon-quicksight-1-click-public-embedding-available-in-preview/
Amazon QuickSight is a fully managed, cloud-native business intelligence (BI) service that makes it easy to connect to your data, create interactive dashboards, and share these with tens of thousands of users, either directly within a QuickSight application, or embedded in web apps and portals.
QuickSight Enterprise Edition now supports 1-click public embedding, a feature that allows you to embed your dashboards into public applications, wikis, and portals without any coding or development needed. Anyone on the internet can start accessing these embedded dashboards with up-to-date information instantly, without any server deployments or infrastructure licensing needed! 1-click public embedding allows you to empower your end-users with access to insights.
In this post, we walk you through the steps to use this feature, demonstrate the end-user experience, and share sample use cases.
Solution overview
1-click public embedding requires an administrator of the QuickSight account to enable this feature and use session-based pricing. After you complete the prerequisites (see the following section), the 1-click embedding process involves three simple steps:
- Enable public access on the dashboard
- Allow list the domain where you want to embed the dashboard in QuickSight
- Embed the dashboard
Prerequisites
- The account needs to have session capacity pricing enabled
- As a prerequisite, make sure your QuickSight account is enabled for dashboards to be shared by the public. Because this feature allows dashboards to be enabled for any user, the usability of this feature must be enabled by an administrator of your QuickSight account with the following AWS Identity and Administration (IAM) permissions:
After you enable this policy, you can activate the account-level settings.
- Sign in to your QuickSight account.
- On the user name drop-down menu, choose Manage QuickSight.

- Choose Security & permissions in the navigation pane.
- Under Public access to dashboards, choose Manage.

- Enable the setting Everyone on the internet to allow public access.

- Confirm this setting and choose Accept.


Enabling this setting doesn’t automatically enable all the dashboards to be accessed by anyone on the internet. It gives the ability for authors of the dashboards to individually enable the dashboard to be accessed by anyone on the internet via the share link or when embedded.
Enable public access permissions on the dashboard
After you create a QuickSight dashboard, to enable public access, complete the following steps:
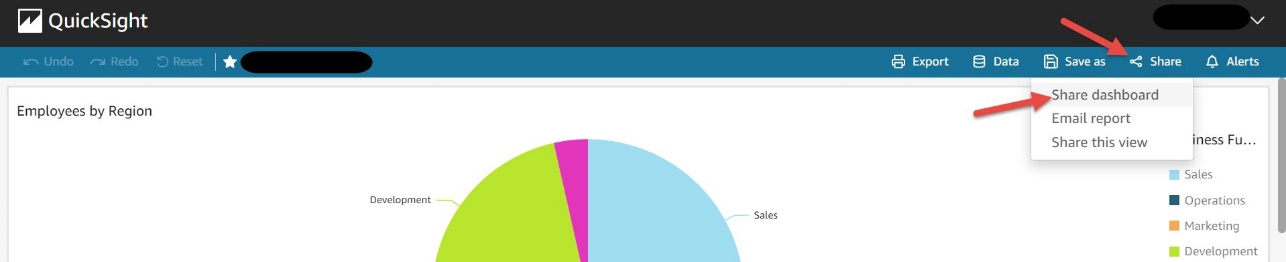
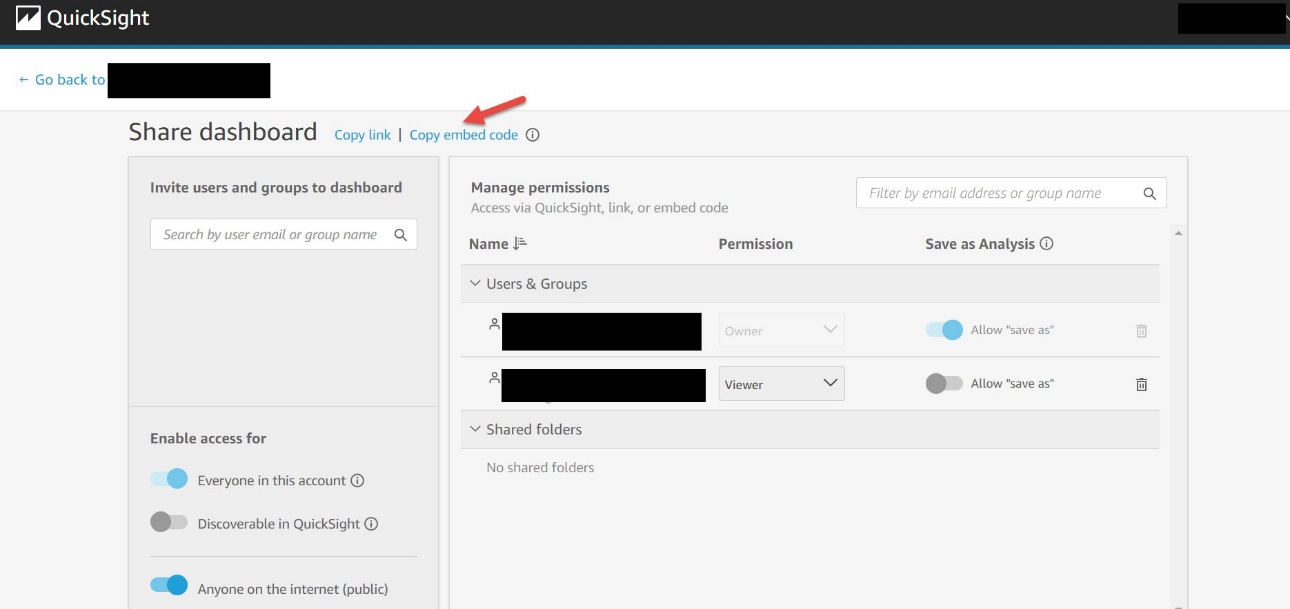
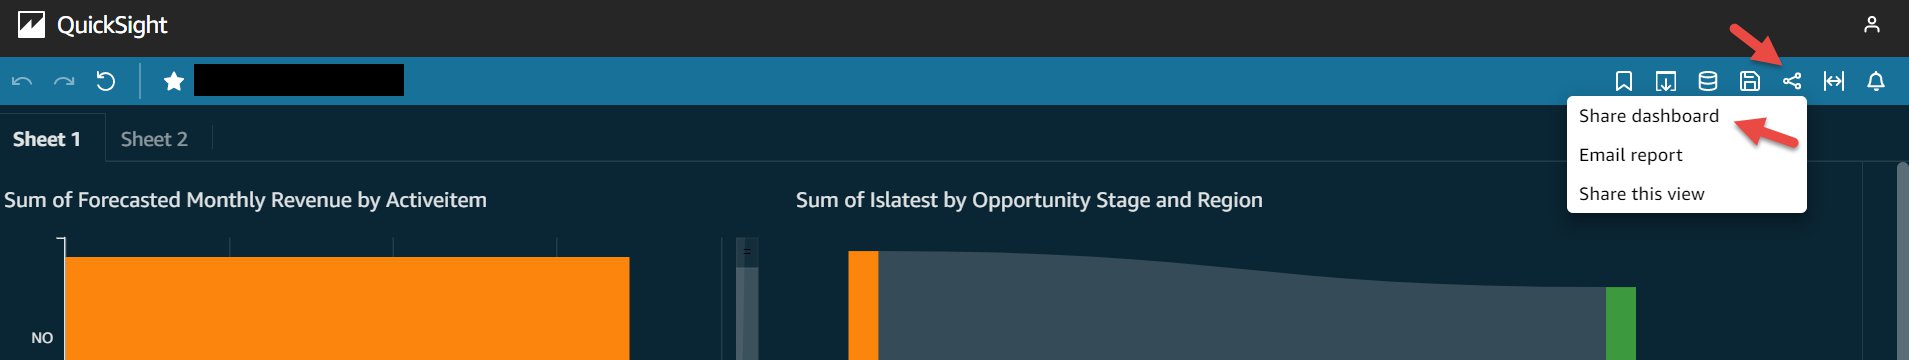
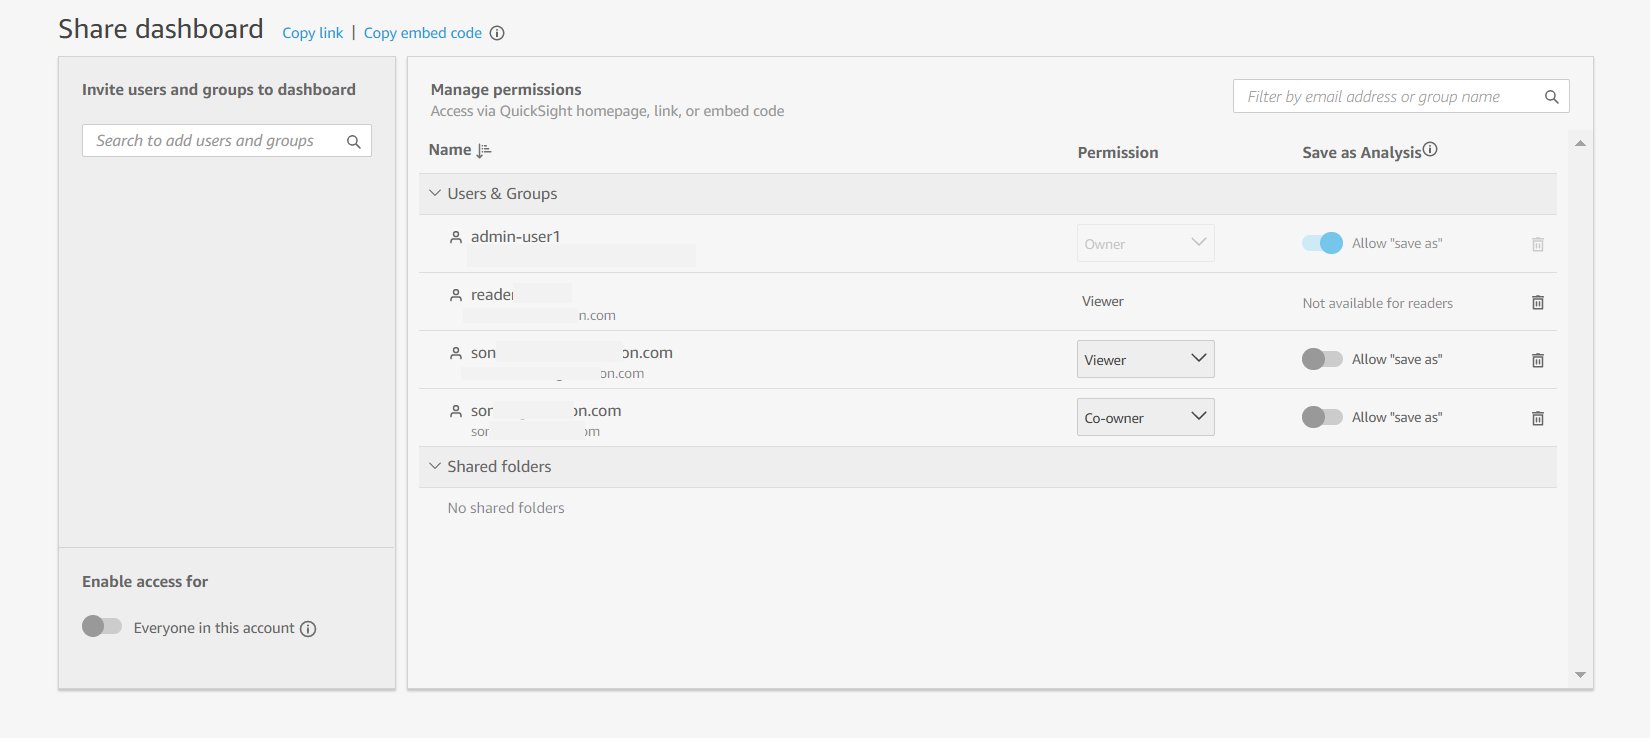
- On the QuickSight dashboard, on the Share menu, choose Share dashboard.
Only owners and co-owners of the dashboard can perform this action.
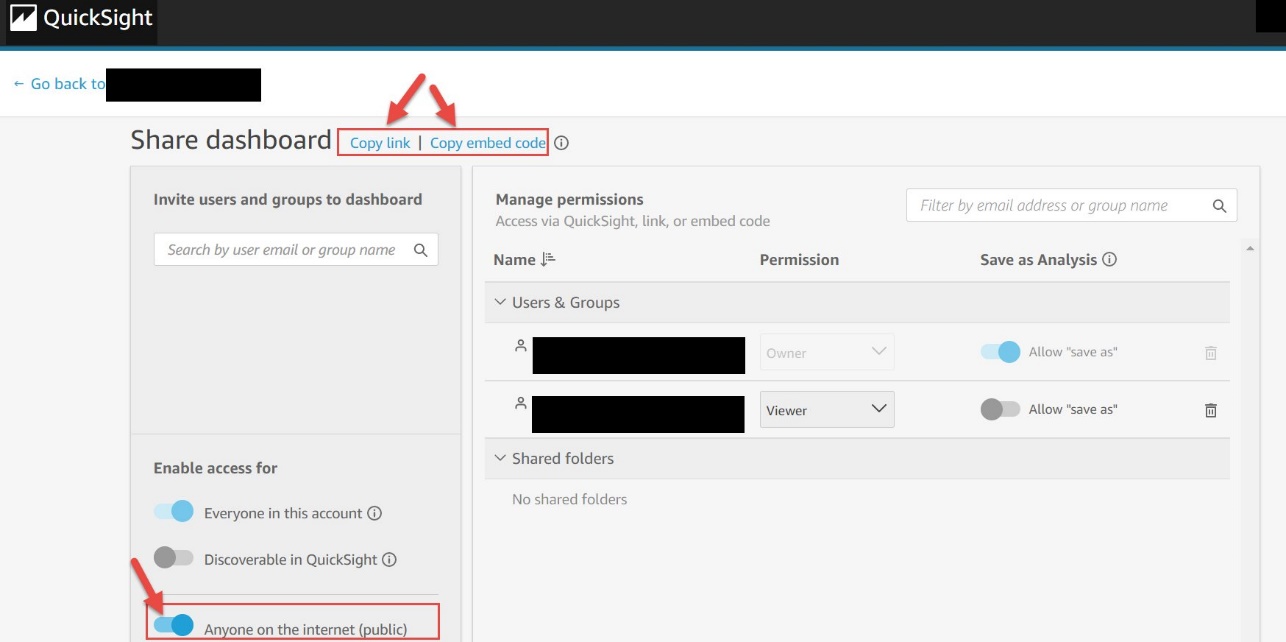
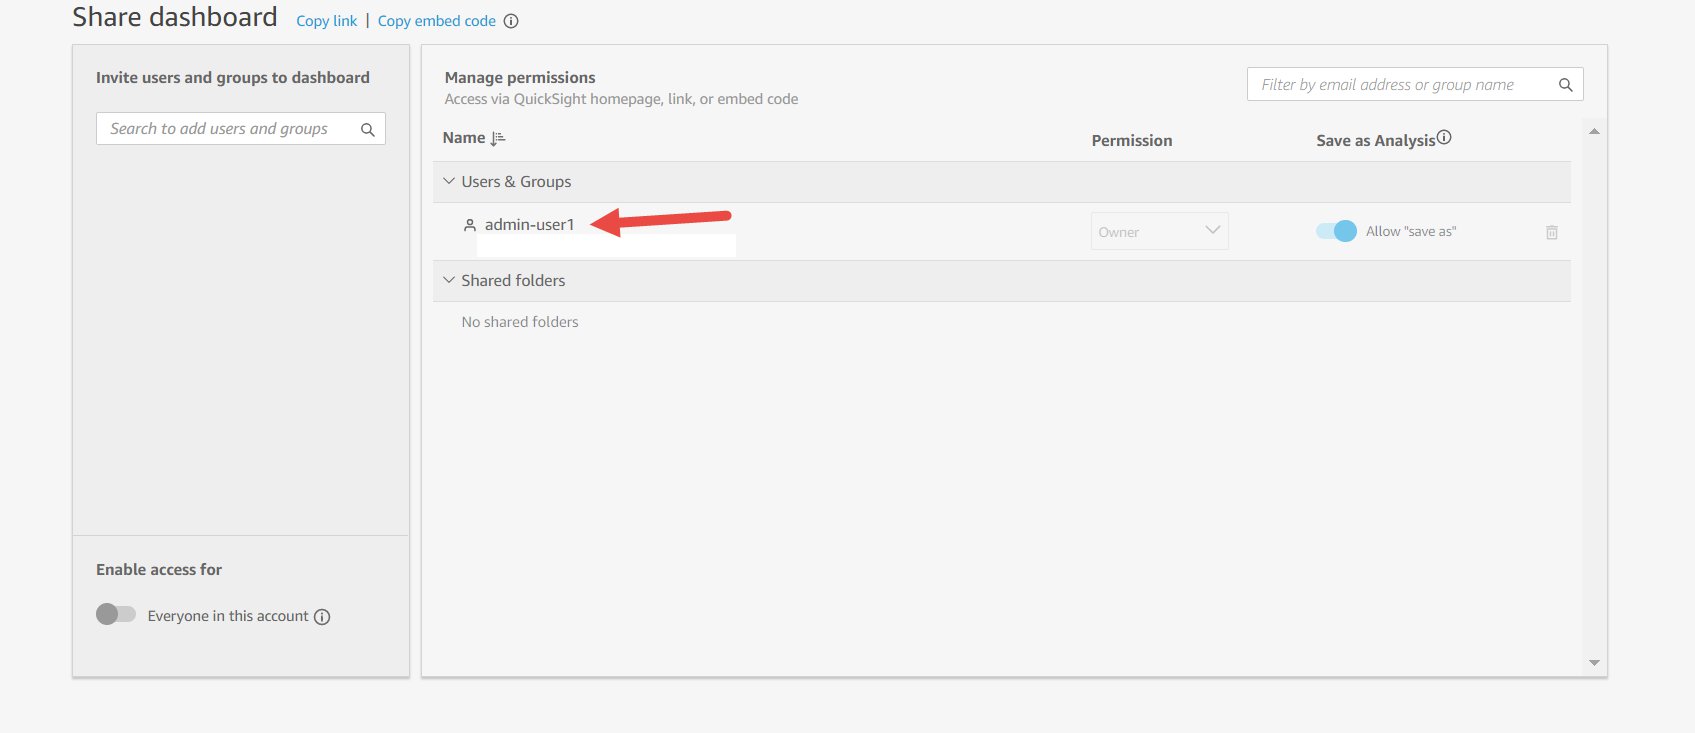
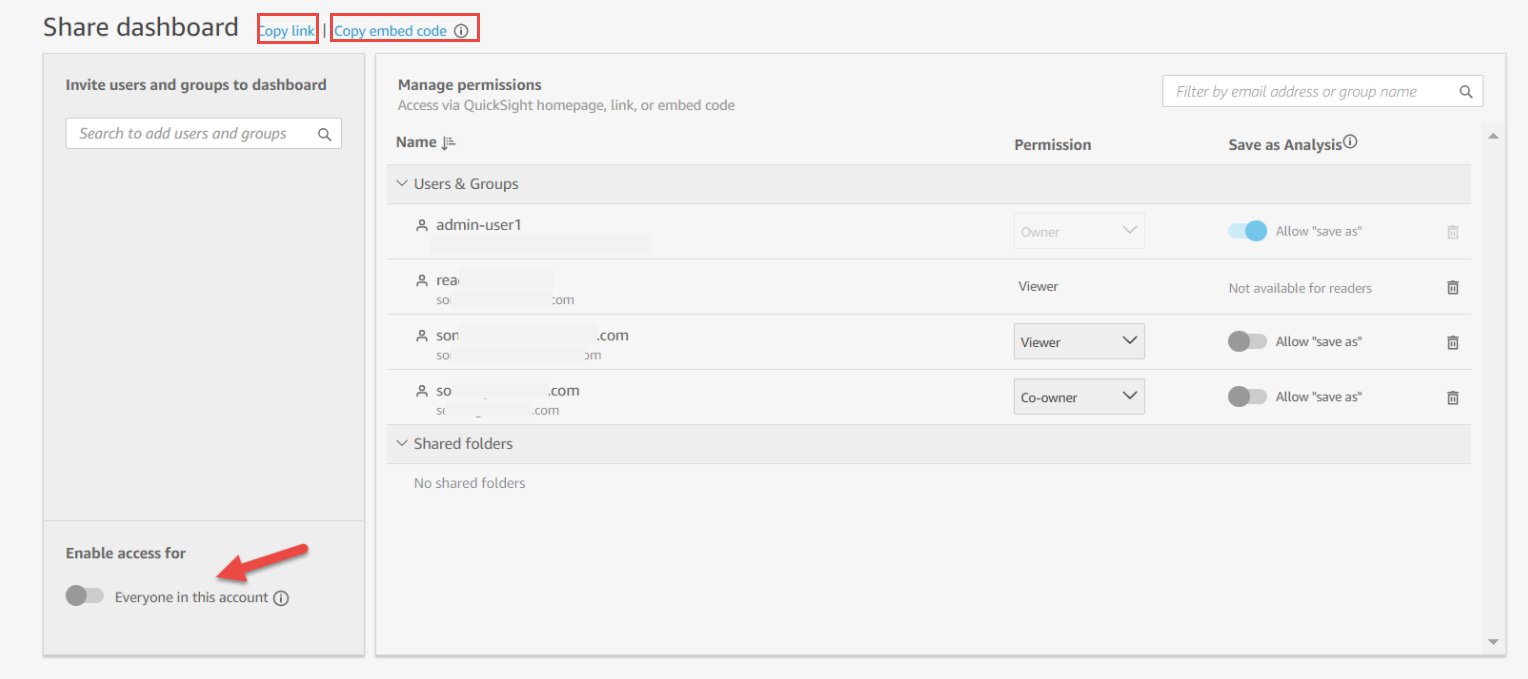
- Under Enable access for, turn on Anyone on the internet (public).


This setting allows you to share this dashboard with anyone on the internet via the share link or when embedded.
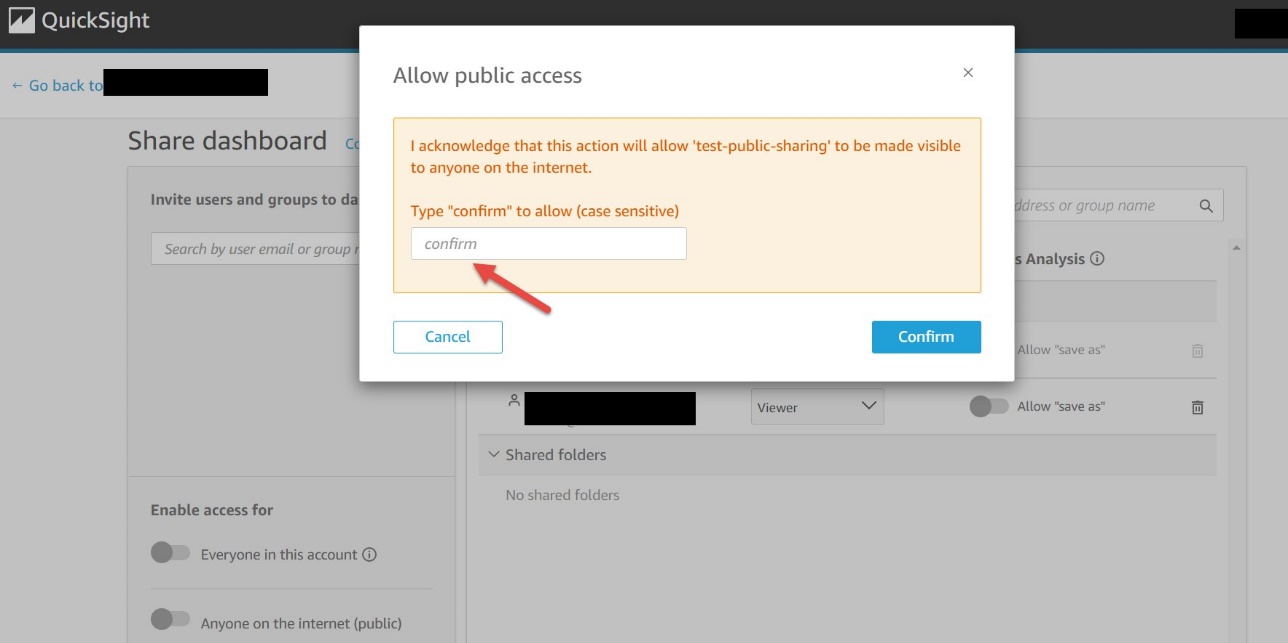
- Accept this setting and choose Confirm.

You now have the option to copy the link or the embed code to share the dashboard. Note that when this setting is enabled, the dashboard can only be accessed using the link or when embedded using the embed code.
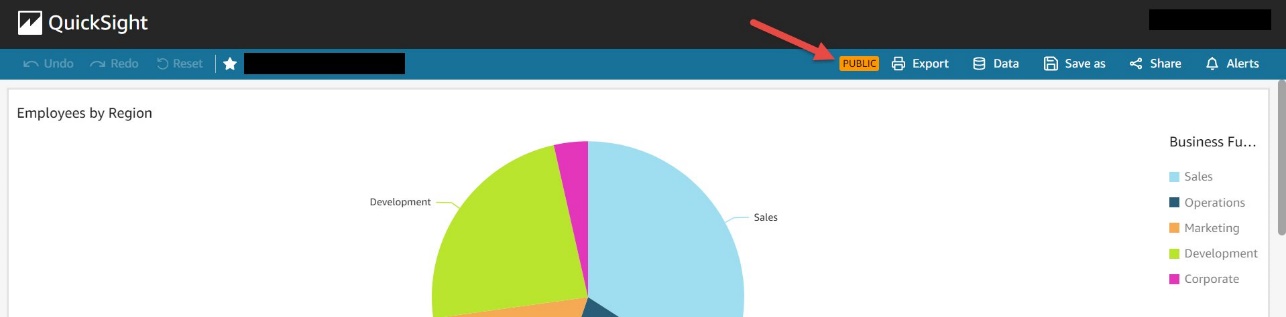
After you enable the dashboard for public access, you can see badges on the dashboard as follows.
The dashboard toolbar has a PUBLIC badge.
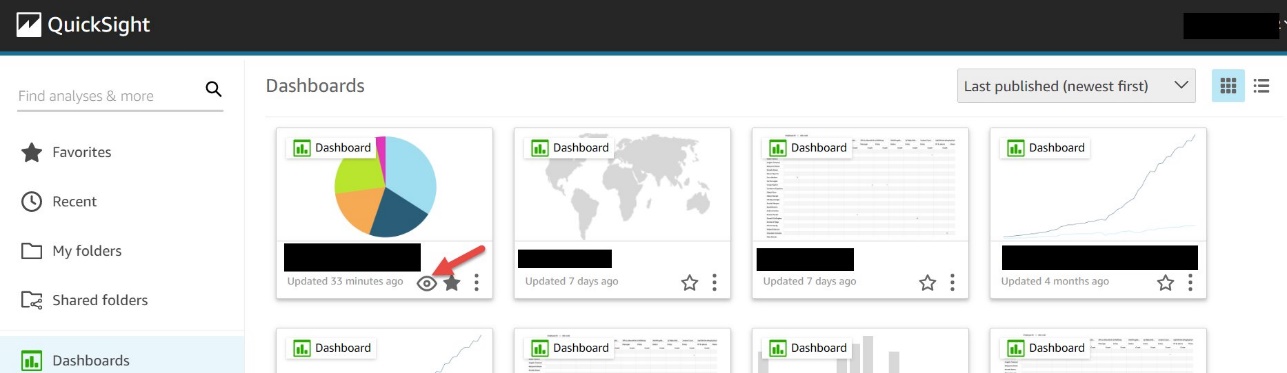
The dashboards grid view has an eye icon for each dashboard.
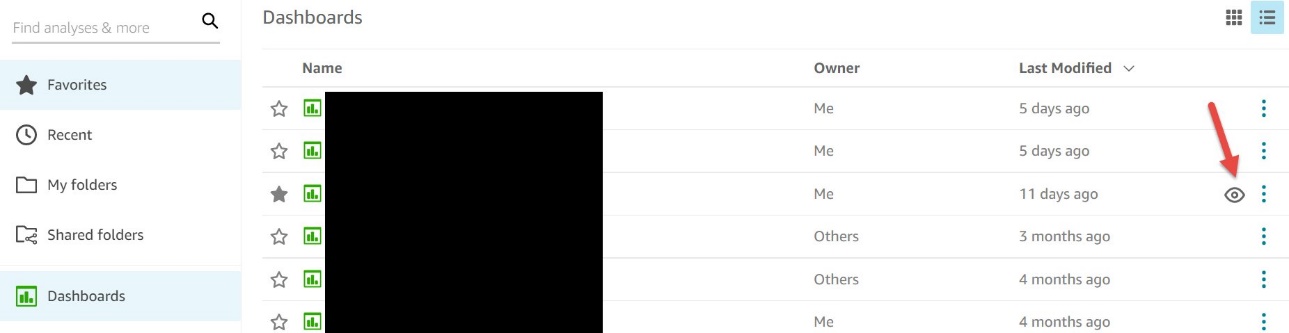
The dashboards list view has an eye icon for each dashboard.
Disable the public access
You can disable the public access of your dashboards in two ways:
- Disable the Anyone on the internet setting for the dashboard (to be done by the owners and co-owners of the dashboard).
- Disable the Public access to dashboard setting at the account level (to be done by the IAM admin). You can disable the account-level settings even if the dashboard-level setting is enabled. This still prevents the dashboards from being accessed publicly.
Allow list the domain where you want to embed the dashboard in QuickSight
The domain where the dashboard is to be embedded must be allow listed in QuickSight. For instructions, see Adding domains for embedded users.
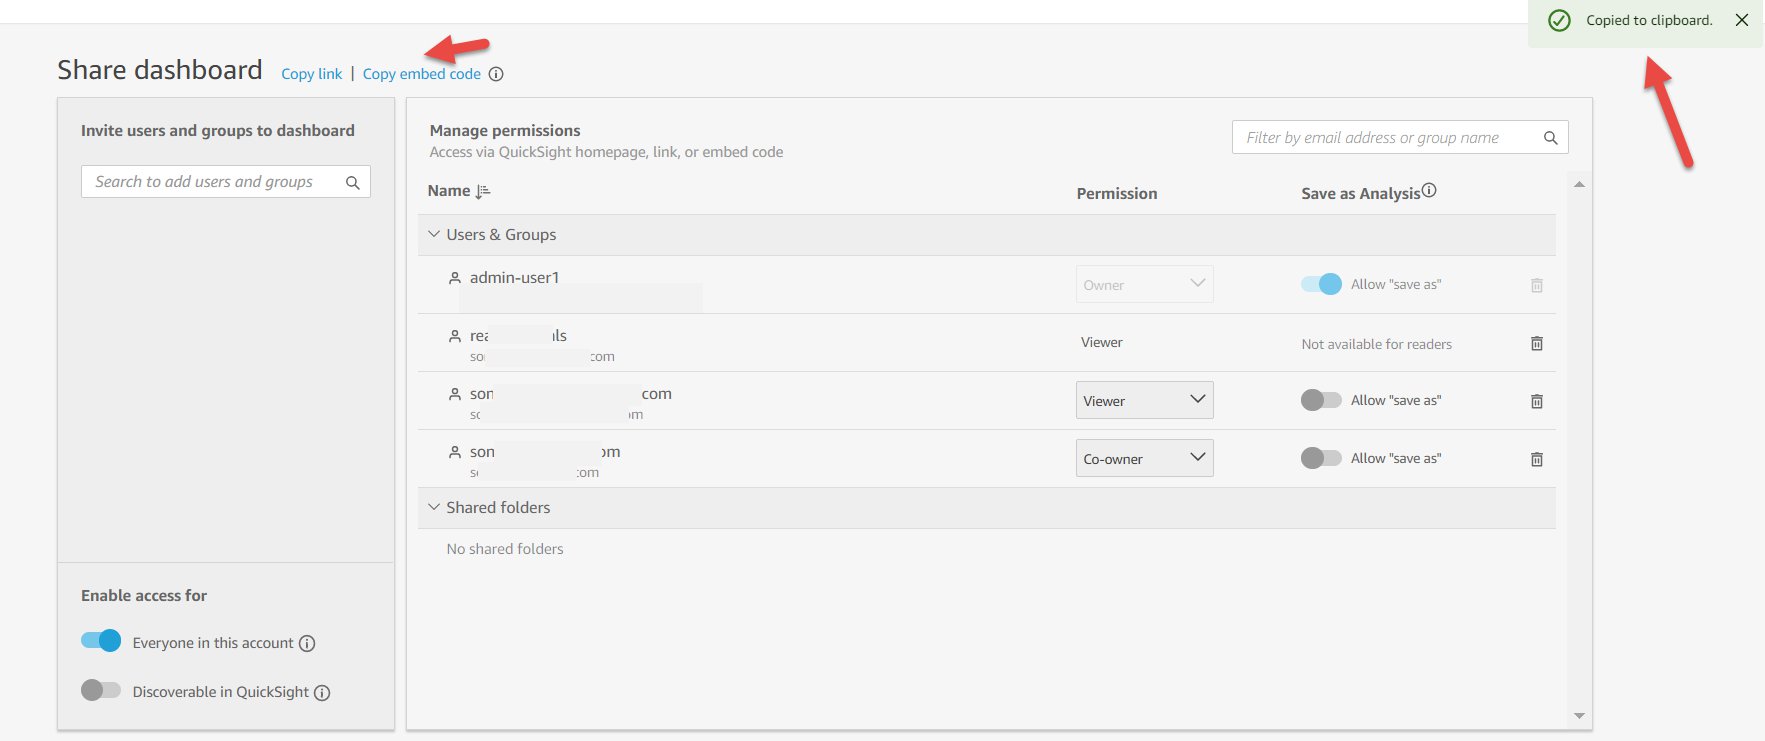
Embed the dashboard
After you set your desired access to the dashboard, you can choose Copy embed code, which copies the embed code for that dashboard. This code embeds the dashboard when added to an internal application.
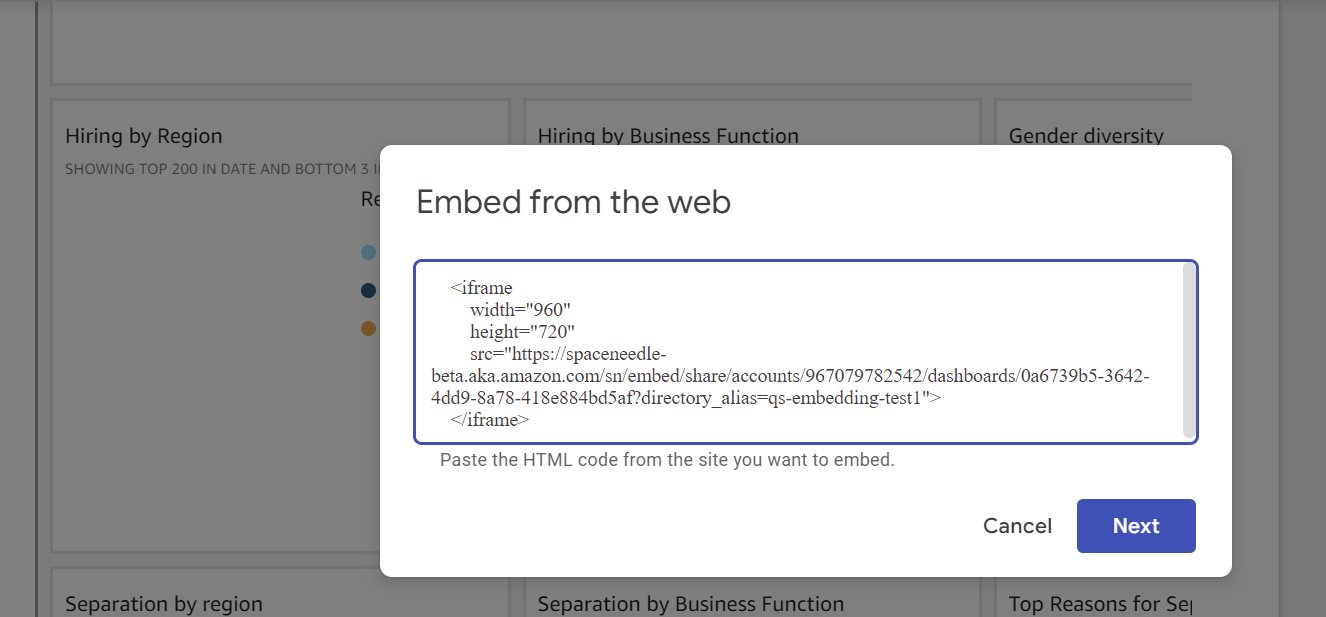
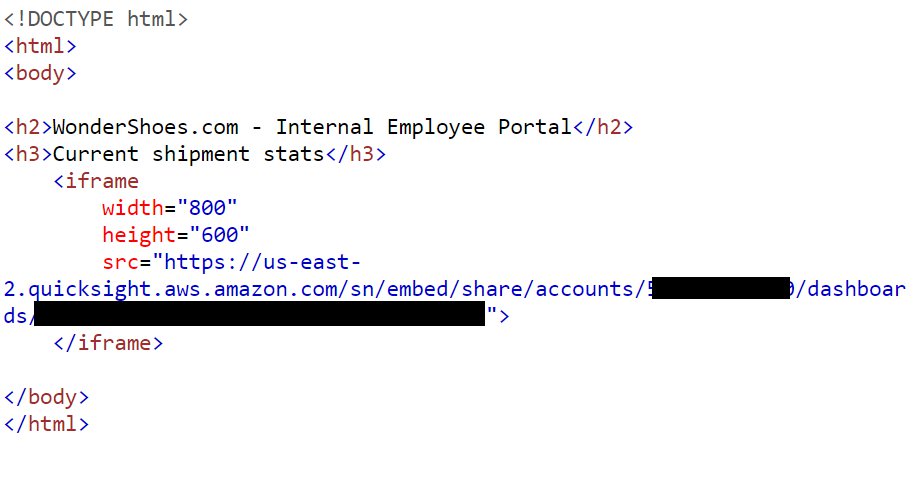
The copied embed code is similar to the following code:
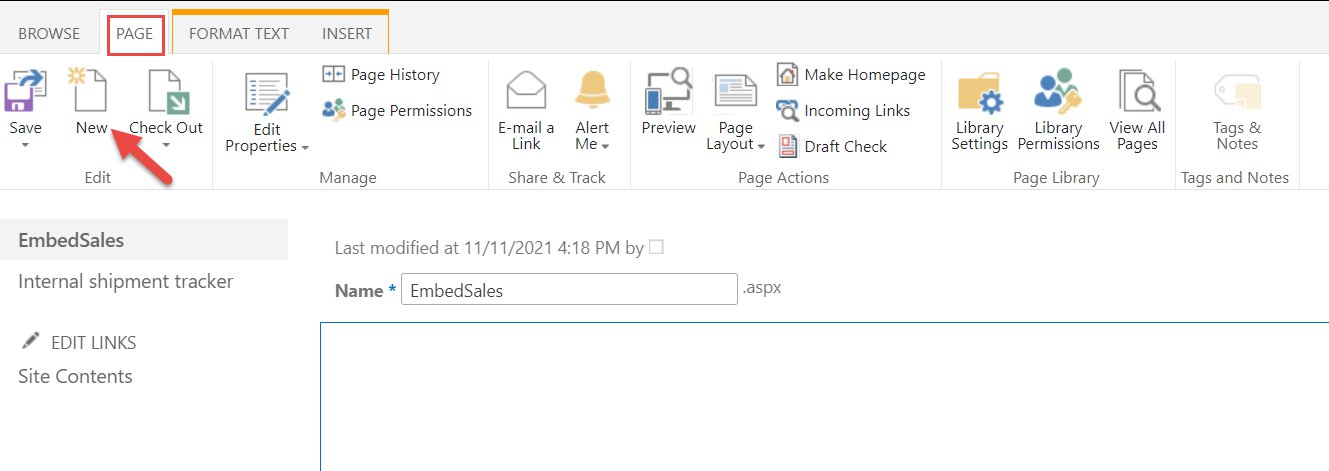
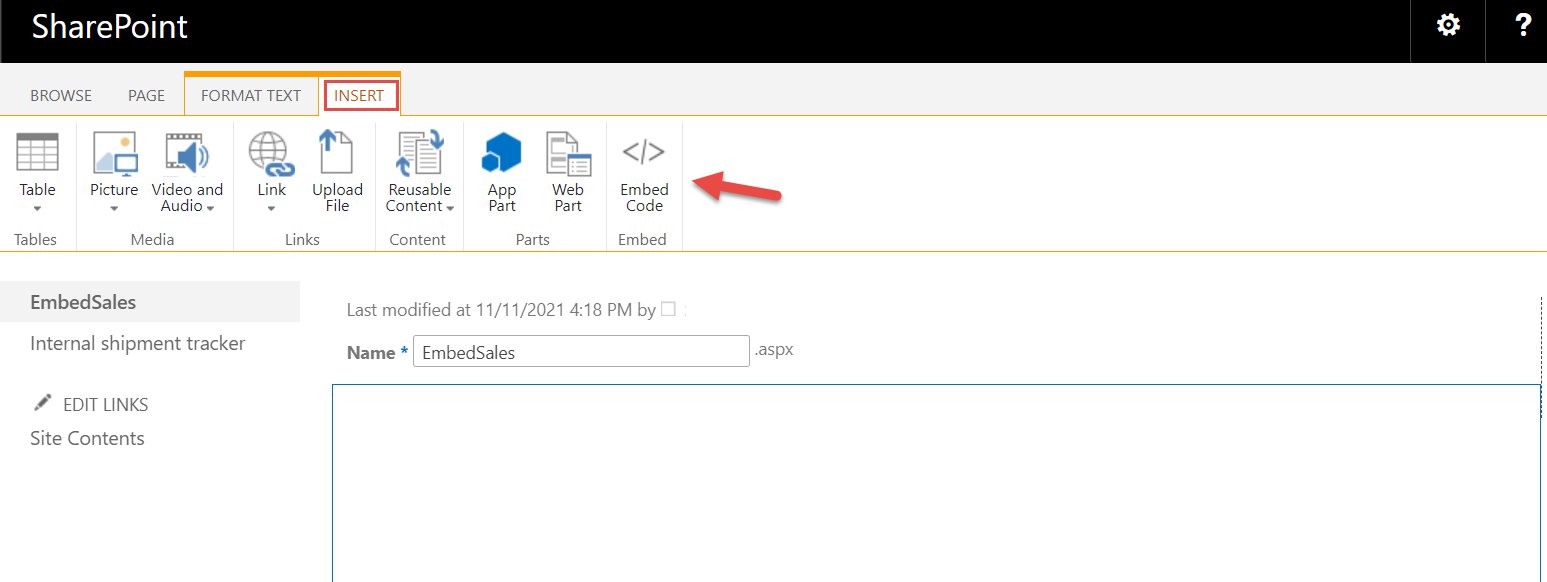
To embed the dashboard in an HTML page, open the HTML of the page where you want to embed the dashboard and enter the copied embed code into the HTML code.
If your public-facing applications are built on Google Sites, to embed your dashboard, open the page on Google Sites, then choose Insert and Embed. A pop-up window appears with a prompt to enter a URL or embed code. Choose Embed code and enter the copied embed code in the text box.
Make sure to allow list the following domains in QuickSight when embedding in Google Sites: https://googleusercontent.com (enable subdomains), https://www.gstatic.com, and https://sites.google.com.
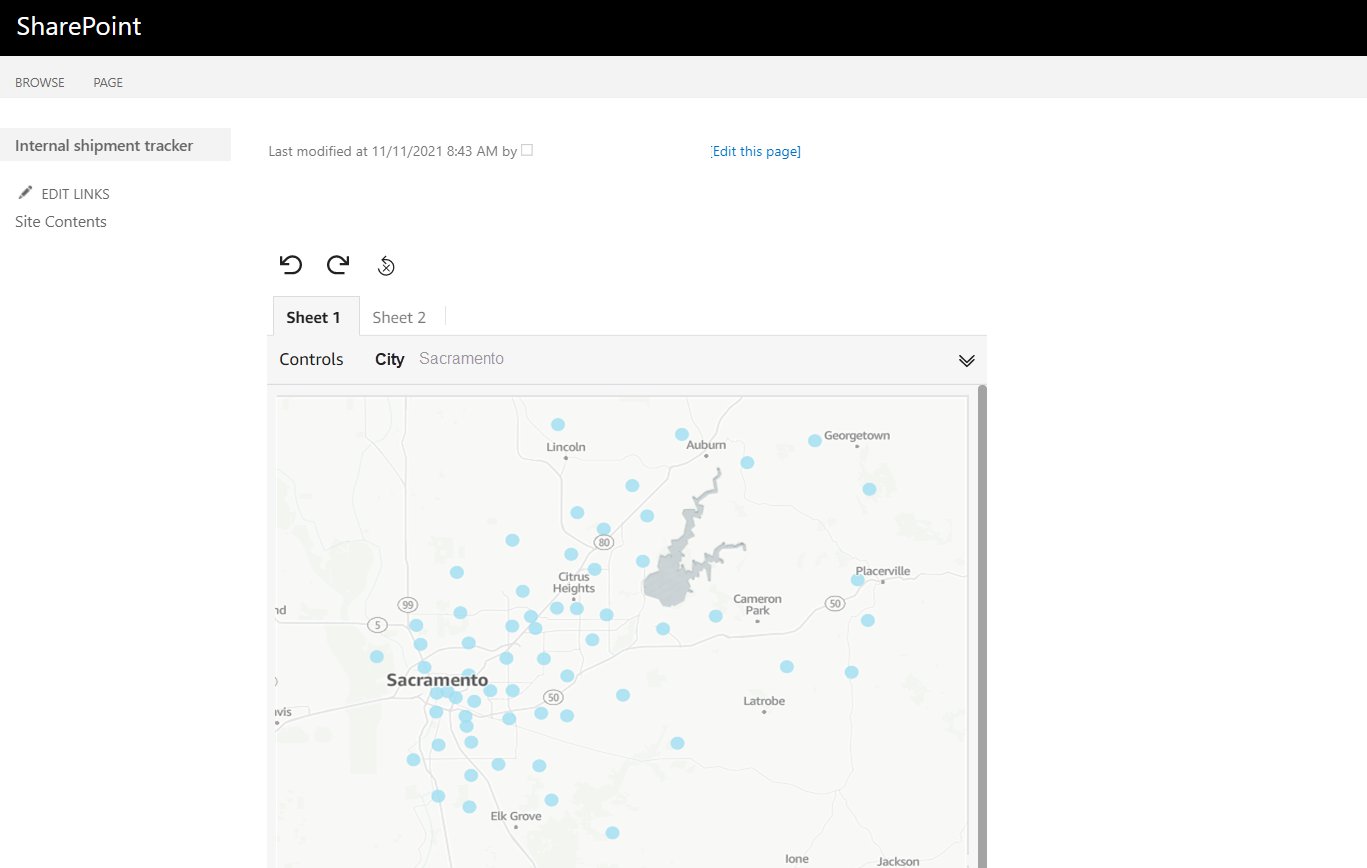
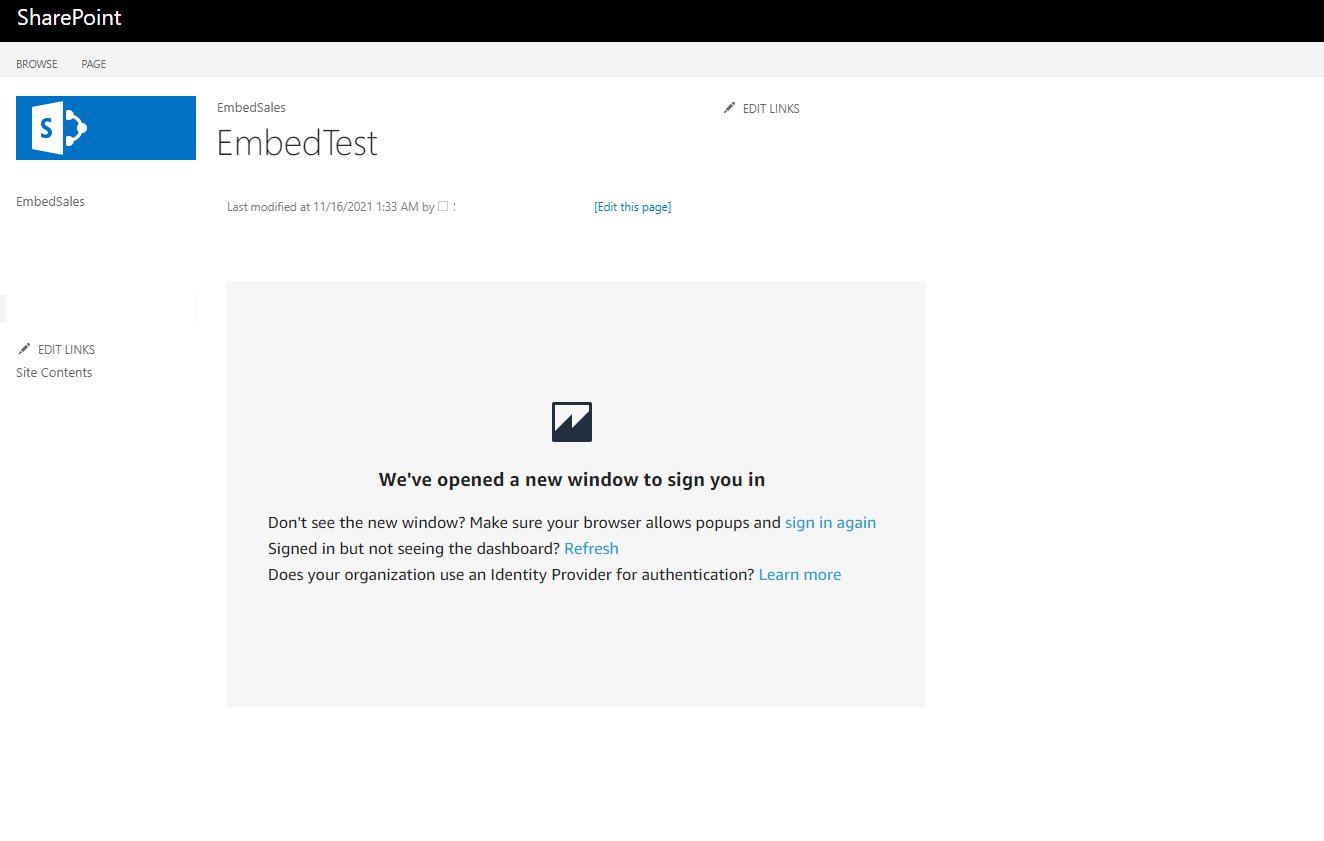
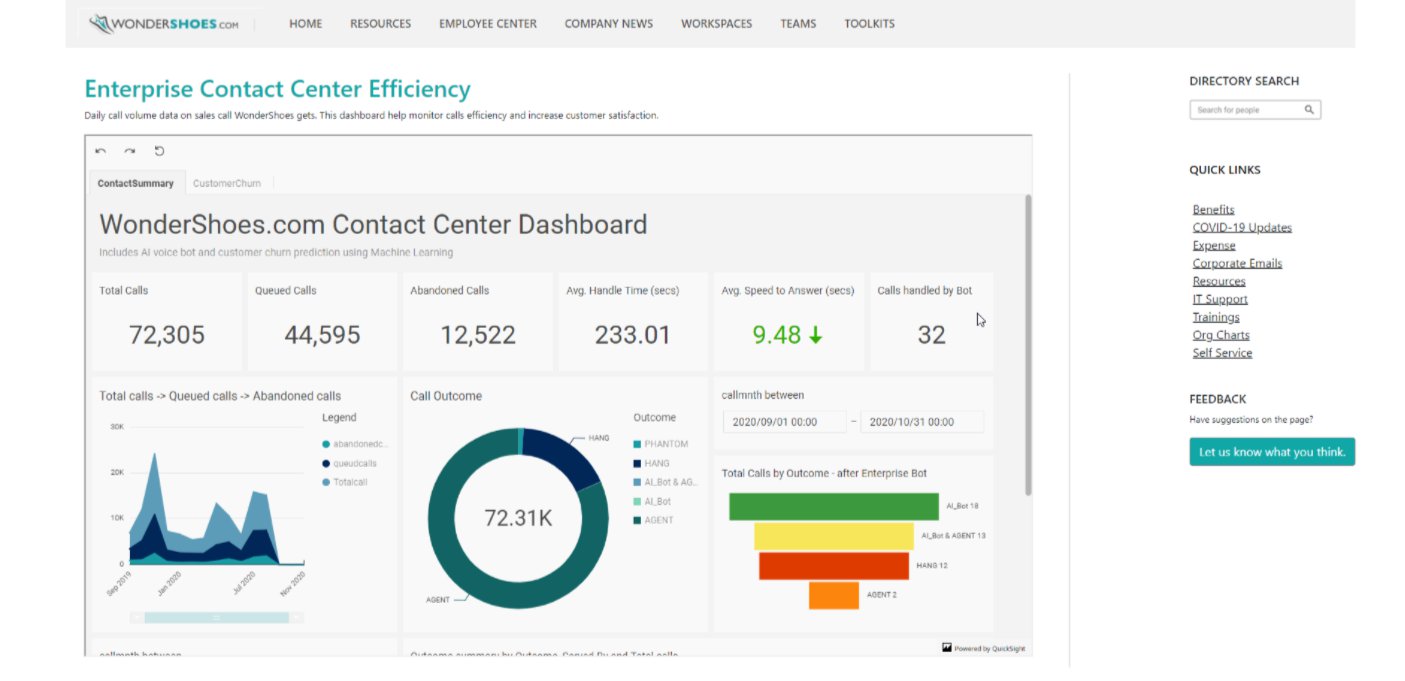
After you embed the dashboard in your application, anyone who can access your application can now access the embedded dashboard.

Sample use cases
1-click public embedding enables you to embed your dashboards into public applications, wikis, and portals without any coding or development needed. In this section, we present two sample use cases.
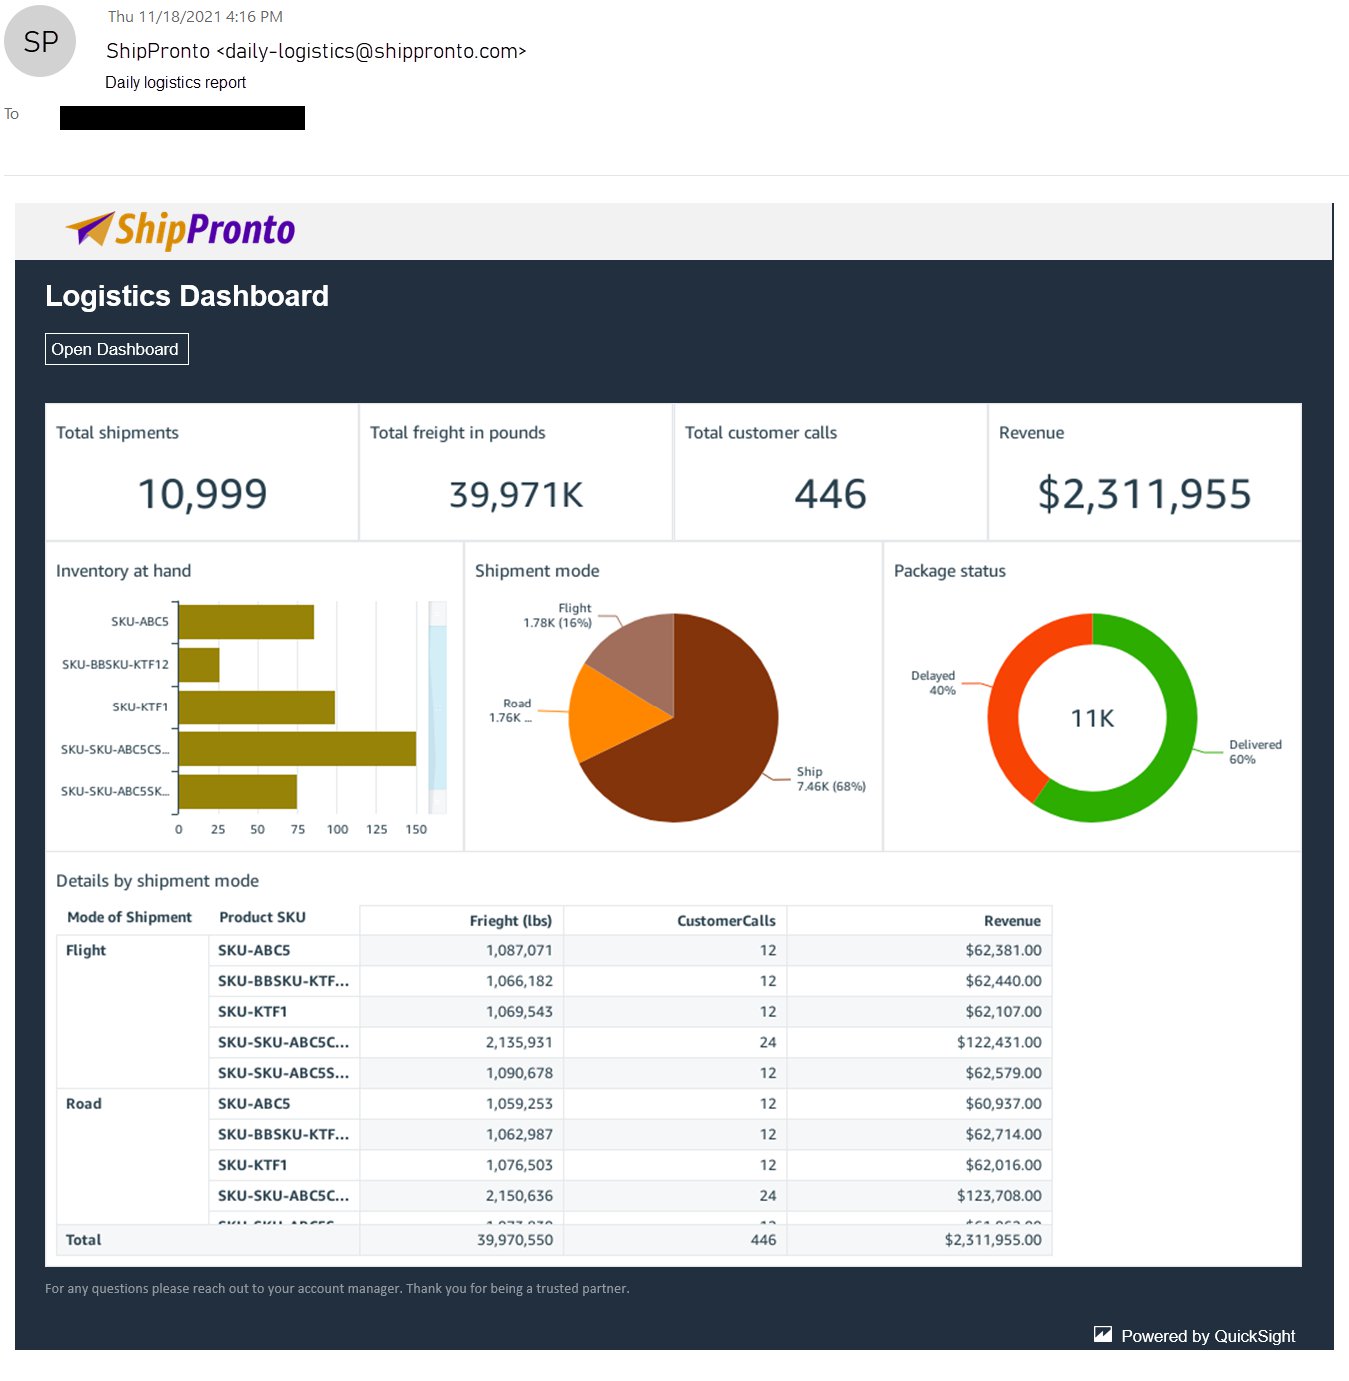
For our first use case, a fictitious school district uses 1-click public embedding to report on the teachers’ enrollment in the district. They built a dashboard and used this feature to embed it on their public-facing site.

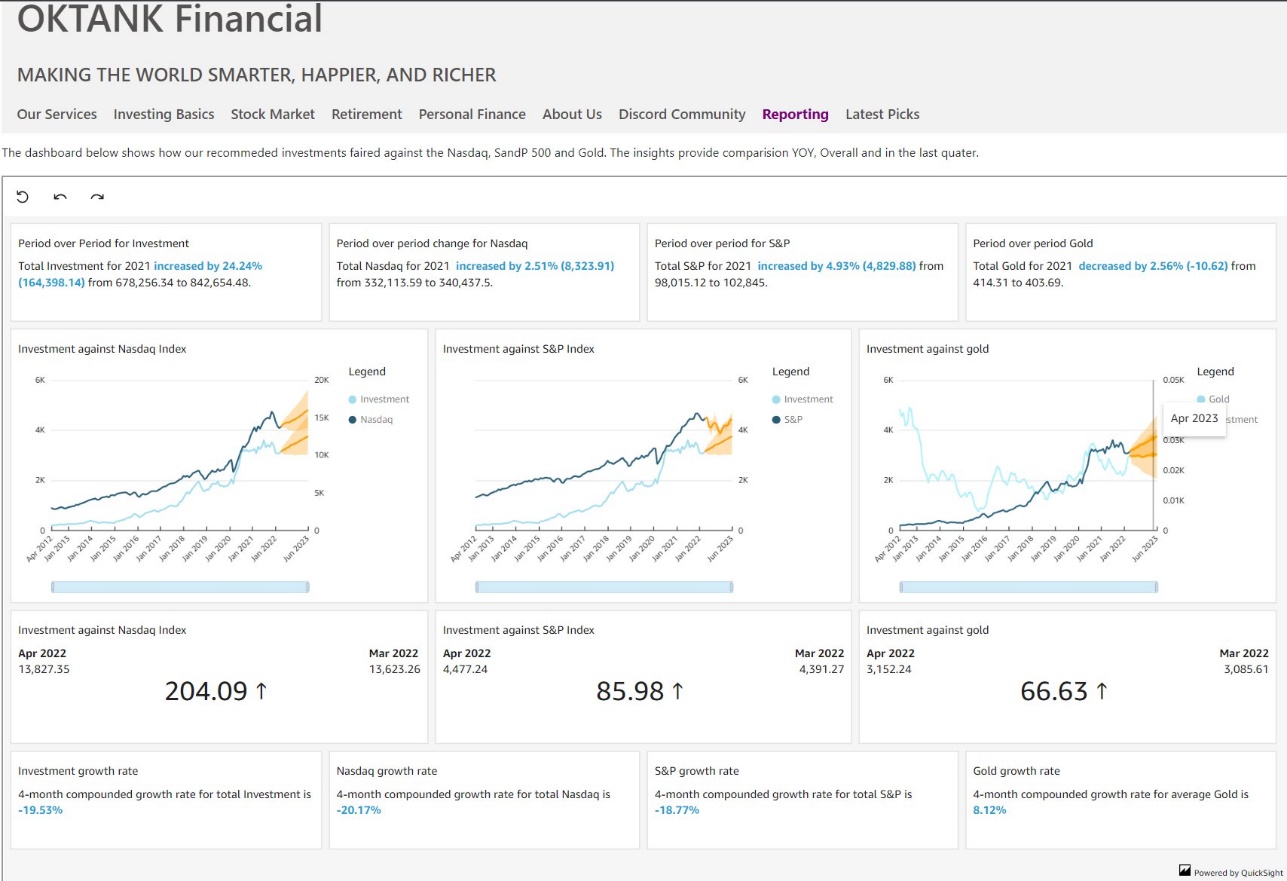
For our second use case, a fictitious fintech that provides investment solutions is using 1-click public embedding to show how their investment compares against other well-known indexes and commodities. They used this feature to add this comparison dashboard on their public-facing marketing pages.
Try out 1-click public embedding
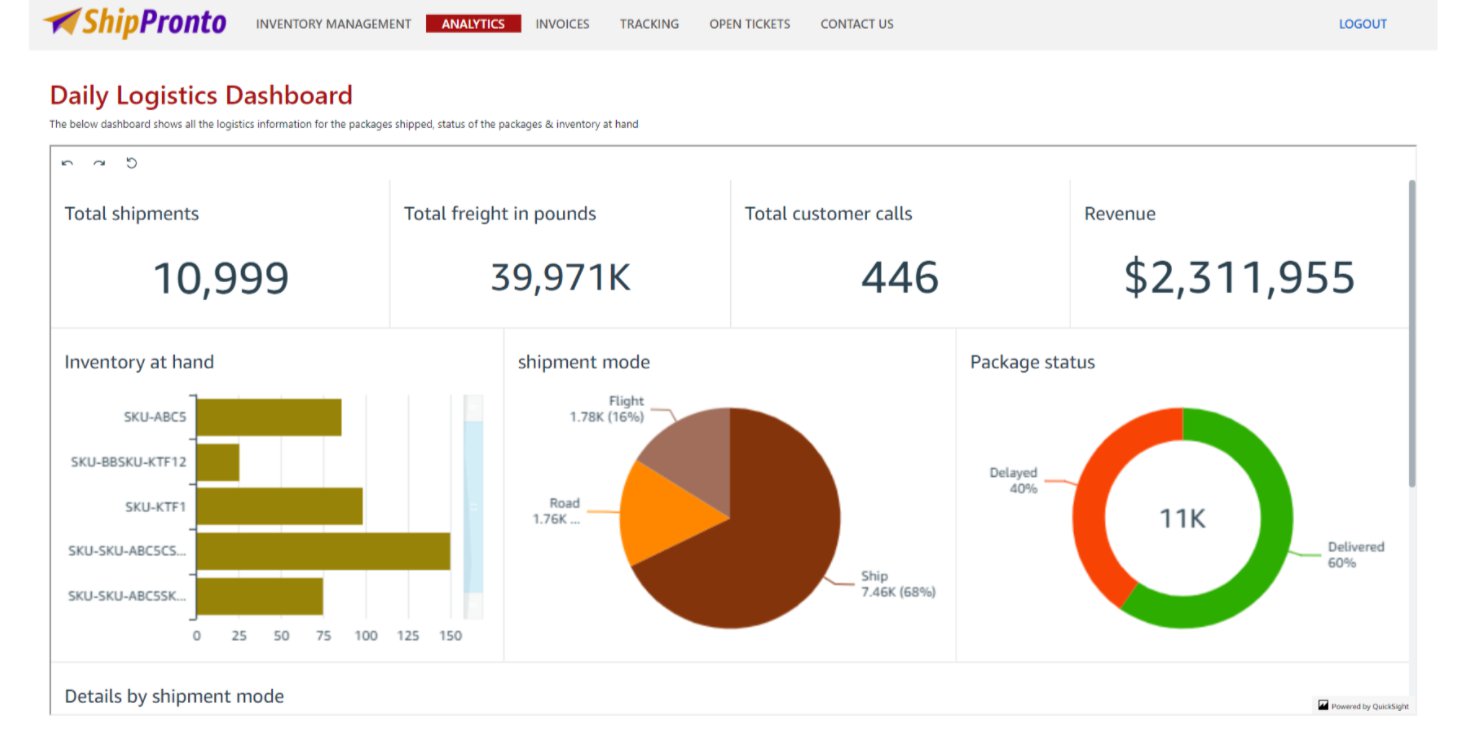
To try out this feature, see Embed Amazon QuickSight dashboard in seconds. In this demo, you can change the dashboard between a logistics or sales dashboard by choosing Change Dashboard and entering the embed code for the dashboard you want to render on the site.
Conclusion
With 1-click public embedding, you can now embed rich and interactive QuickSight dashboards quickly and easily. Enable your end-users to dive deeper into their data through embedded dashboard with the click of a button—and with no infrastructure setup or management, scale to millions of users. 1-click public embedding is now in preview; to access this feature, please contact [email protected].
QuickSight also supports embedding in SaaS apps without any user management needed. For more information, refer to Embed multi-tenant dashboards in SaaS apps using Amazon QuickSight without provisioning or managing users.
To stay up to date on QuickSight embedded analytics, check out what’s new with the QuickSight User Guide.
About the Authors
 Kareem Syed-Mohammed is a Product Manager at Amazon QuickSight. He focuses on embedded analytics, APIs, and developer experience. Prior to QuickSight he has been with AWS Marketplace and Amazon retail as a PM. Kareem started his career as a developer and then PM for call center technologies, Local Expert and Ads for Expedia. He worked as a consultant with McKinsey and Company for a short while.
 Srikanth Baheti is a Specialized World Wide Sr. Solution Architect for Amazon QuickSight. He started his career as a consultant and worked for multiple private and government organizations. Later he worked for PerkinElmer Health and Sciences & eResearch Technology Inc, where he was responsible for designing and developing high traffic web applications, highly scalable and maintainable data pipelines for reporting platforms using AWS services and Serverless computing.-


 Raji Sivasubramaniam is a Specialist Solutions Architect at AWS, focusing on Analytics. Raji has 20 years of experience in architecting end-to-end Enterprise Data Management, Business Intelligence and Analytics solutions for Fortune 500 and Fortune 100 companies across the globe. She has in-depth experience in integrated healthcare data and analytics with wide variety of healthcare datasets including managed market, physician targeting and patient analytics. In her spare time, Raji enjoys hiking, yoga and gardening.