Post Syndicated from Jose Kunnackal original https://aws.amazon.com/blogs/big-data/amazon-quicksight-2021-in-review/
With AWS re:Invent just around the corner, we at the Amazon QuickSight team have put together this post to provide you with a handy list of all the key updates this year. We’ve broken this post into three key sections: insights for every user, embedded analytics with QuickSight, scaling and governance.
Insights for every user
Amazon QuickSight allows every user in the organization to get a better understanding of data – through simple natural language questions and interactive dashboards for end-users, or ML-powered data exploration for business analysts. Developers can add embedded visualizations, dashboards, and Q to their apps to differentiate and enhance user experiences. Let’s take a look at the new experiences and features that you can deploy to your users from our 2021 updates.
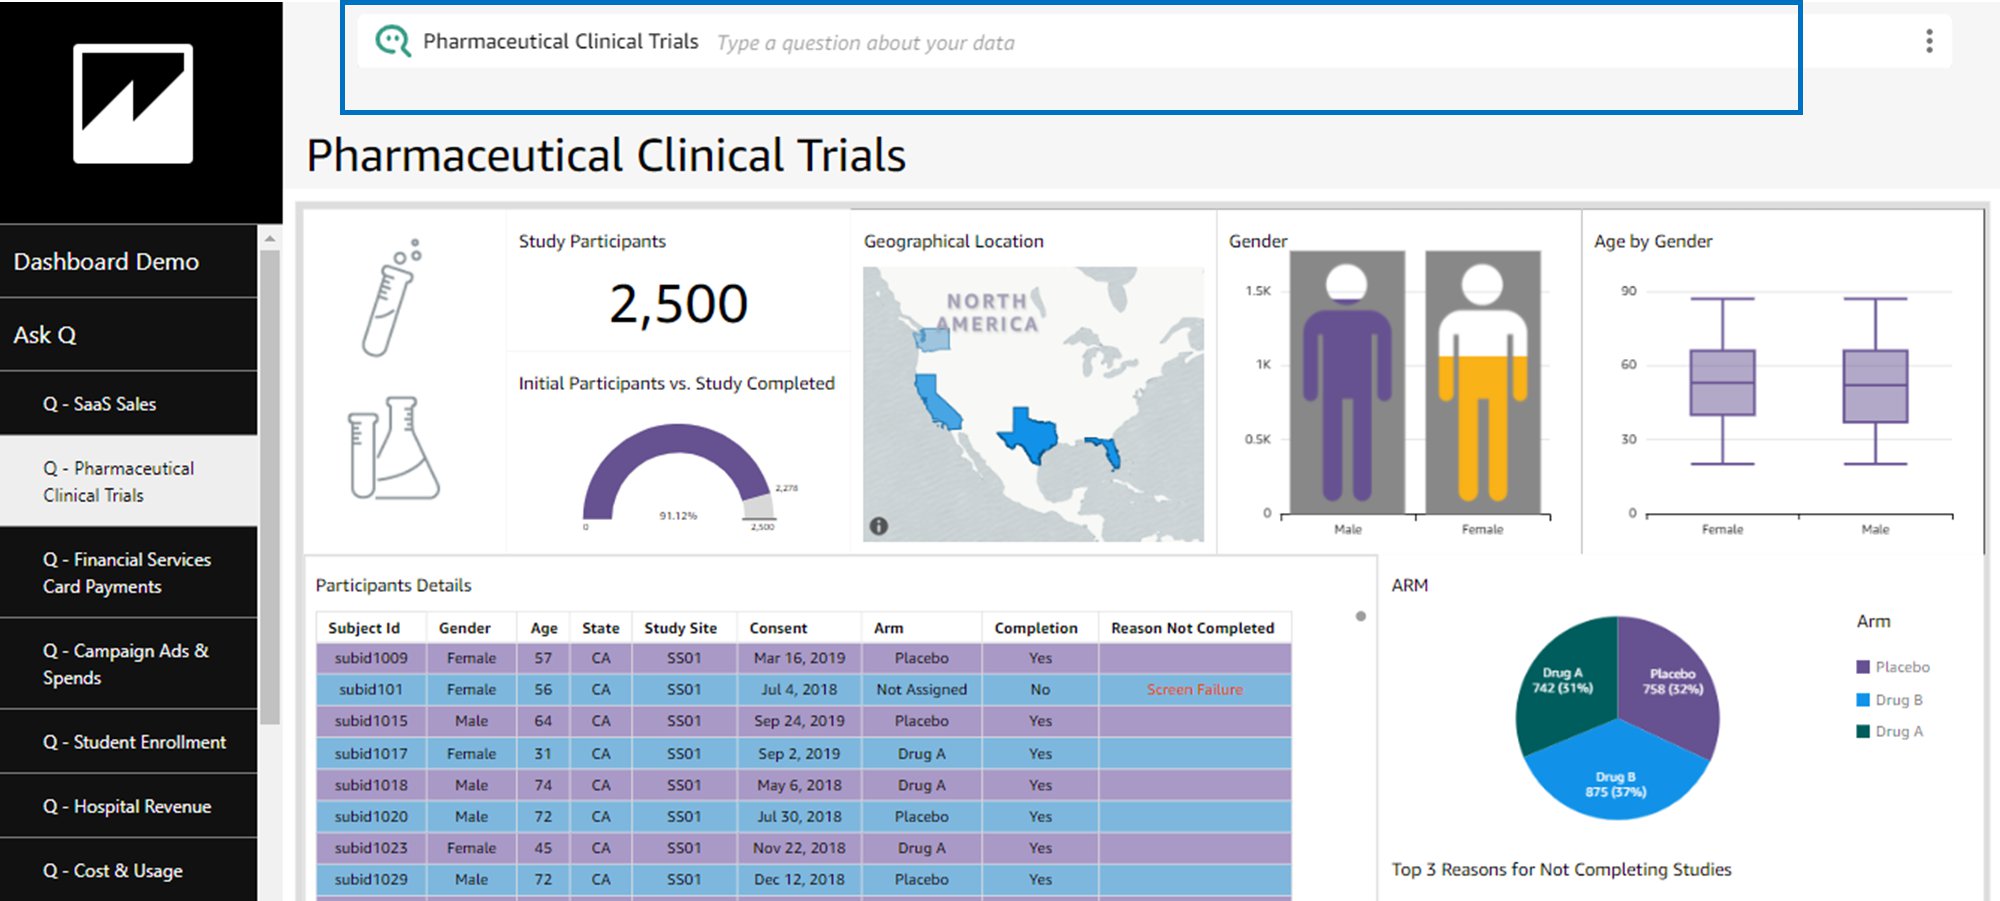
Amazon QuickSight Q for true self-service for end-users
Earlier this year, Amazon QuickSight Q became generally available, making machine learning (ML) powered Q&A available for end-users to simply ask questions of their data—no training or preparation needed. End-users can go beyond what is presented in the dashboard with Q, avoiding the typical back-and-forth exchanges between the end-user and business intelligence (BI) teams, and the often weeks-long wait associated with adding a new dashboard or visual. It also allows end-users to more intuitively understand data, without having to interpret different visualizations, or understand filters or other elements in a traditional BI dashboard.
For example, a sales manager can simply ask the question “What were monthly sales in California this year?” to get a response from Q. To go deeper, they could follow up with “Who were the top five customers by sales in California?” Q presents a visual response to the user, no manual changes or analysis needed. Q can also be embedded into applications, allowing developers to augment and differentiate their application’s experiences. For more information on Q and how to get started, see Amazon QuickSight Q – Business Intelligence Using Natural Language Questions.

Free-form layouts, new chart types, and much more for pixel-perfect, interactive dashboards
Authors of QuickSight dashboards can now use the new free-form layout, which allows precise placement and sizing of dashboard components, overlay of charts and images, and conditional rendering of elements based on parameters. The combination of these features, along with granular customization options now available across charts (such as hiding grid lines, axis labels, and more) allow dashboards in QuickSight to be highly tailored to specific use cases or designs. The following screenshots show examples of customized dashboards using the free-form layout.


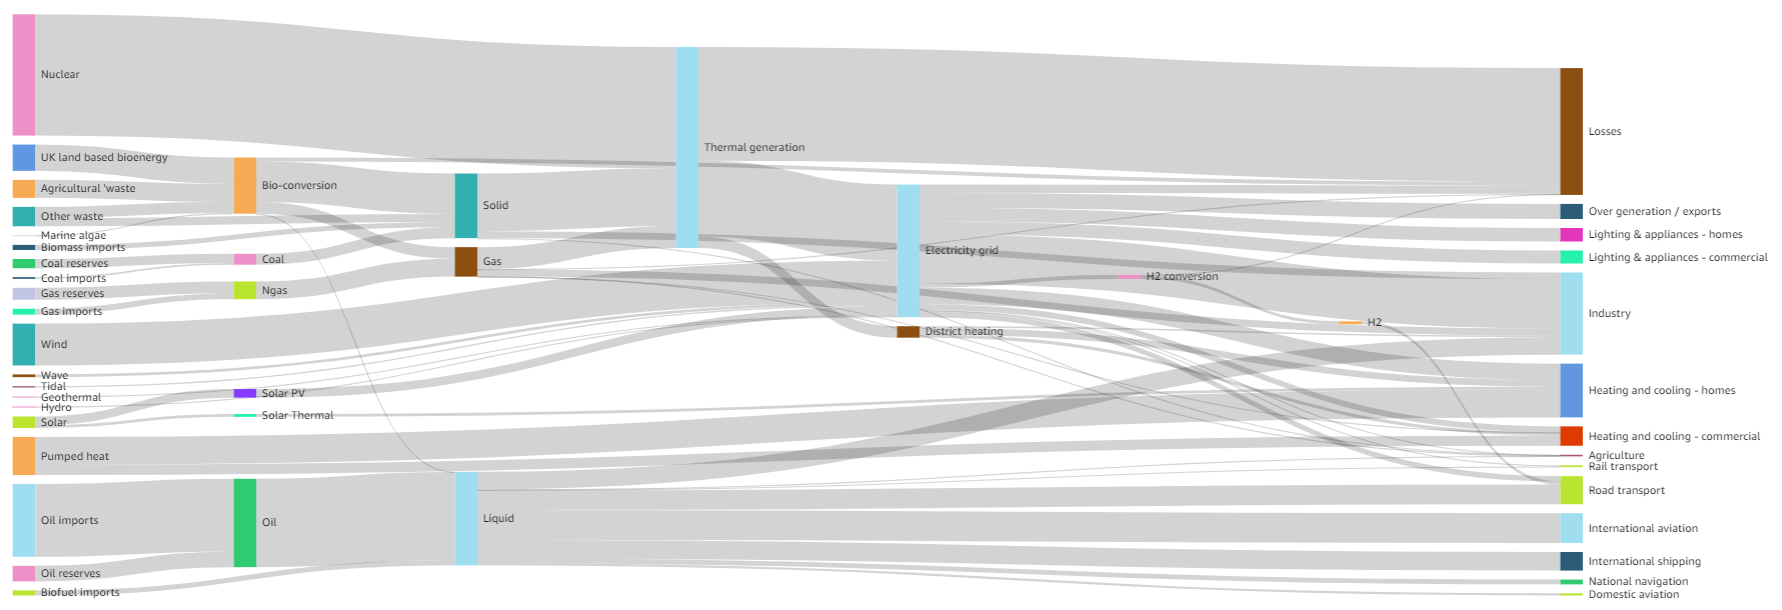
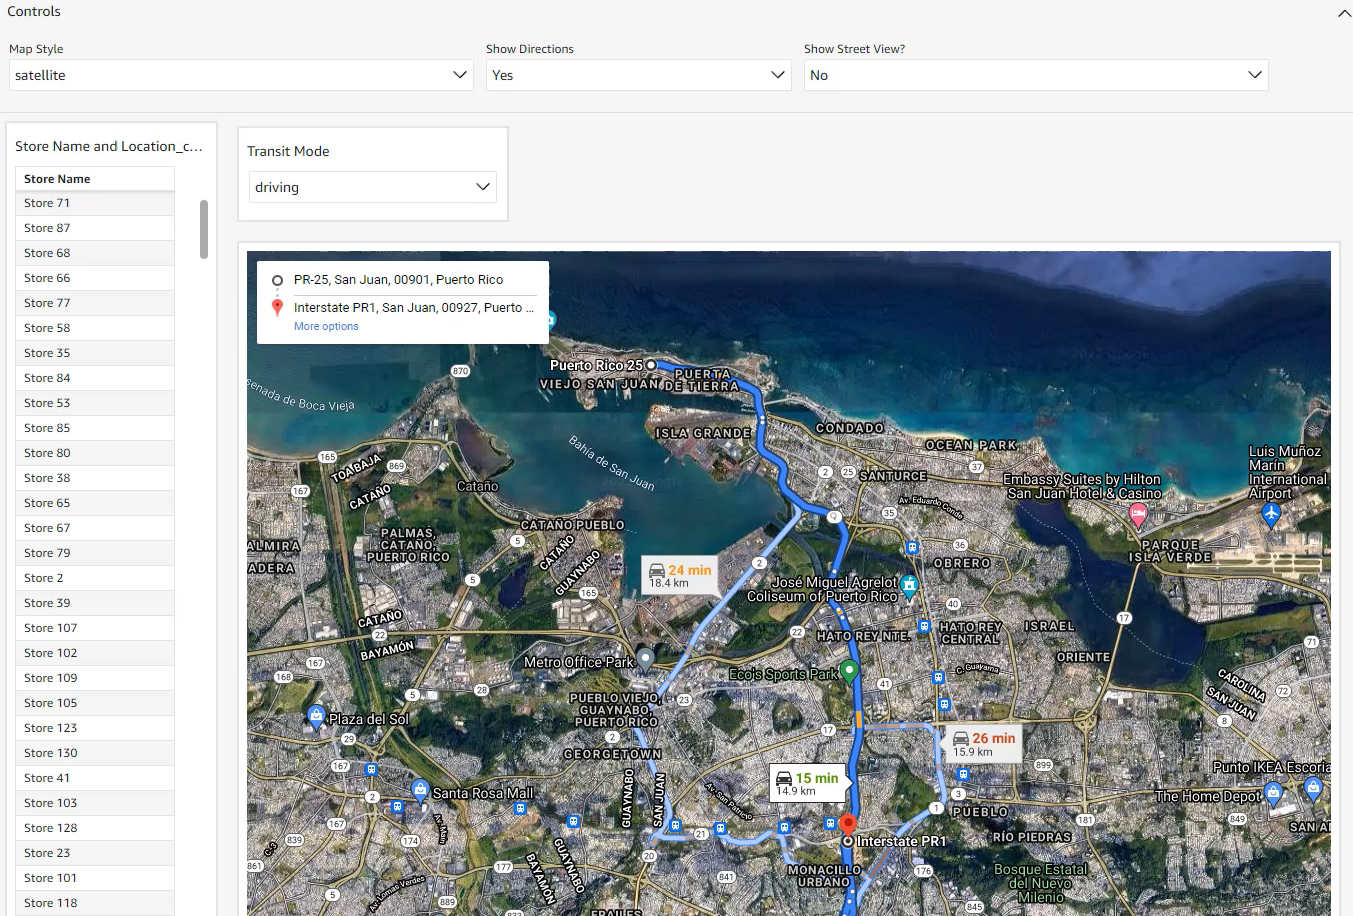
Authors can also use new visual types in QuickSight, such as the dual axis line chart and Sankey, to quickly add new ways of presenting data in dashboards. Sankey charts in particular have been very popular among QuickSight users, allowing visualization of cash flows, process steps, or visitor flows on a website—without having to extensively customize charts or license external plug-ins. We also added the option to add custom web components in dashboards, which allows you to embed images, videos, web pages, or external apps. When combined with the ability to pass parameter values into the custom components, this provides dashboard authors with a very broad set of creative possibilities.
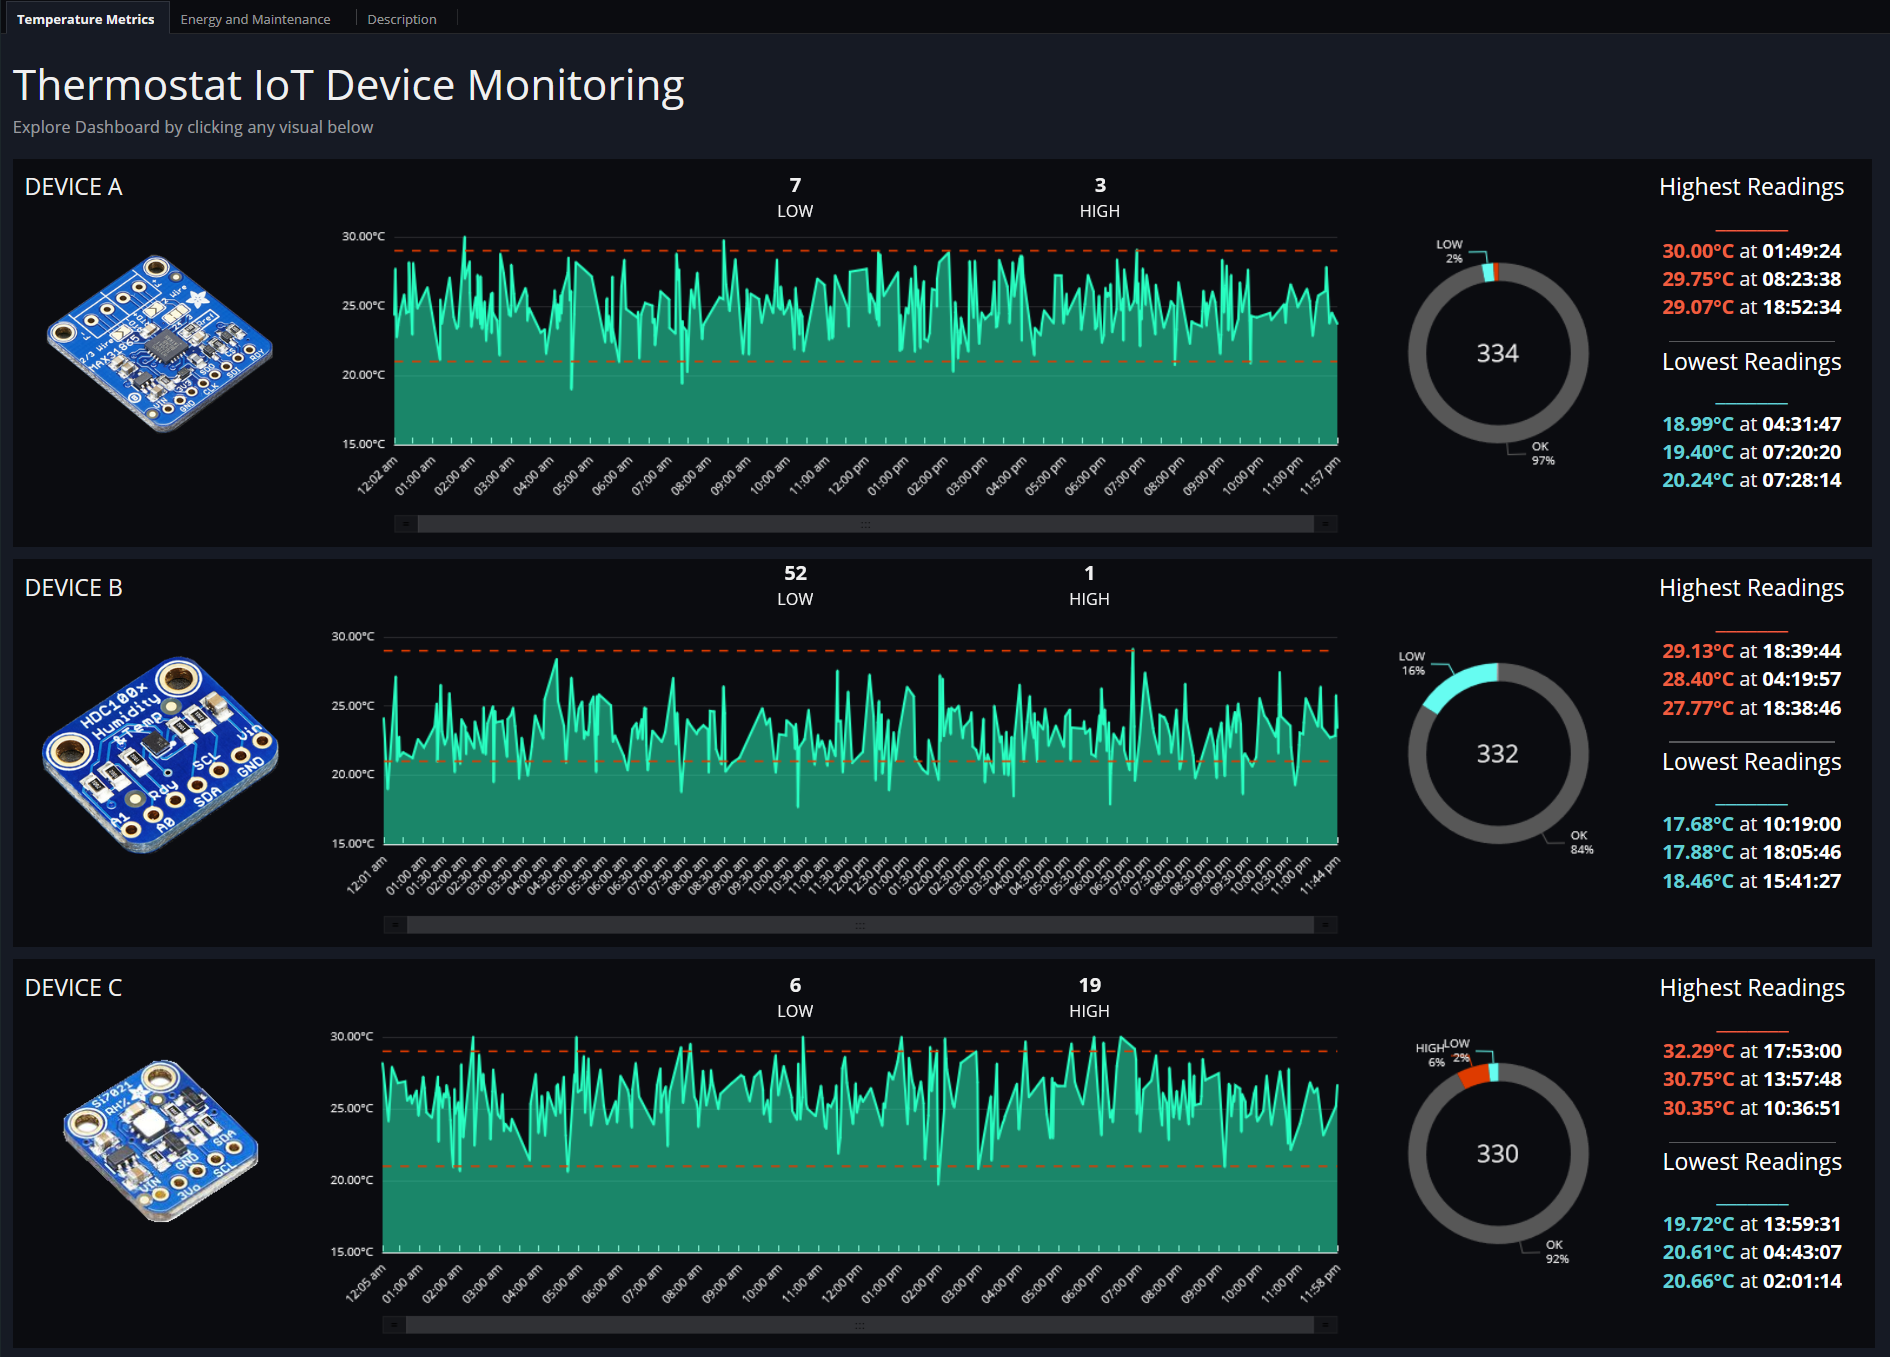
The screenshot below shows an example of dual axis line chart (on the left) where high and volume metrics are mapped on two different scales within the same chart.

The screenshot below shows a Sankey chart showing consumption modes and channels for different energy sources.
The following screenshot shows an example of embedded web content (physical store navigation by different transit modes) within a QuickSight dashboard.
Tables and pivot tables have also received a broad set of updates, allowing authors to customize these extensively to meet organizational design standards, with new features allowing you to do the following:
- Increase row height
- Wrap text
- Vertically align content
- Customize background color, font color, borders, grid lines, and banding
- Style and highlight your totals and subtotals
- Style and hyperlink content to external resources
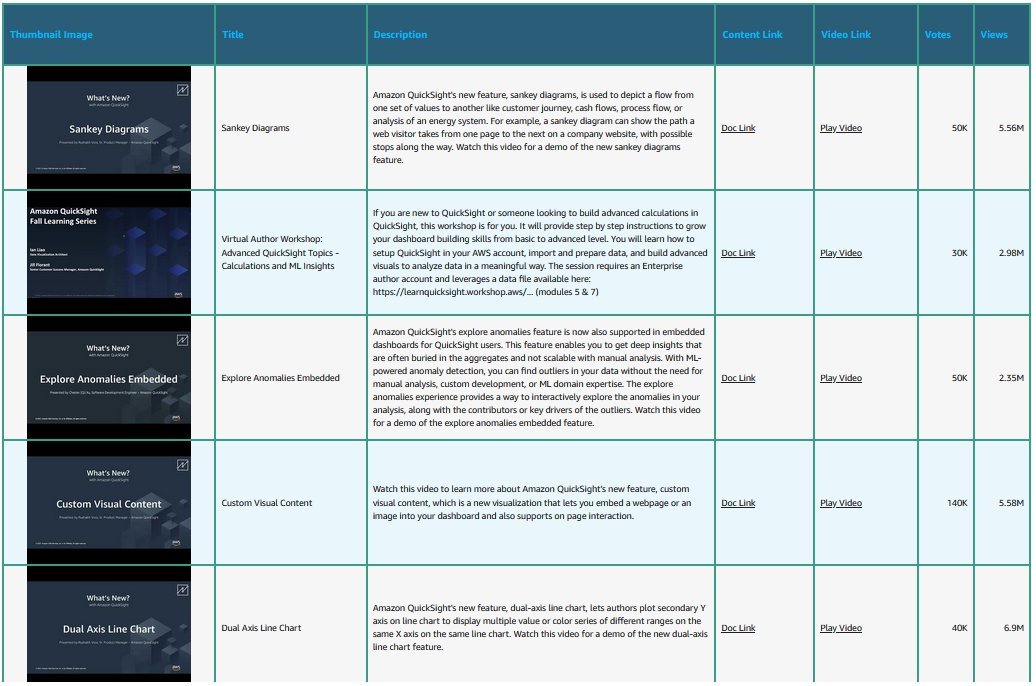
- Add images within table cells
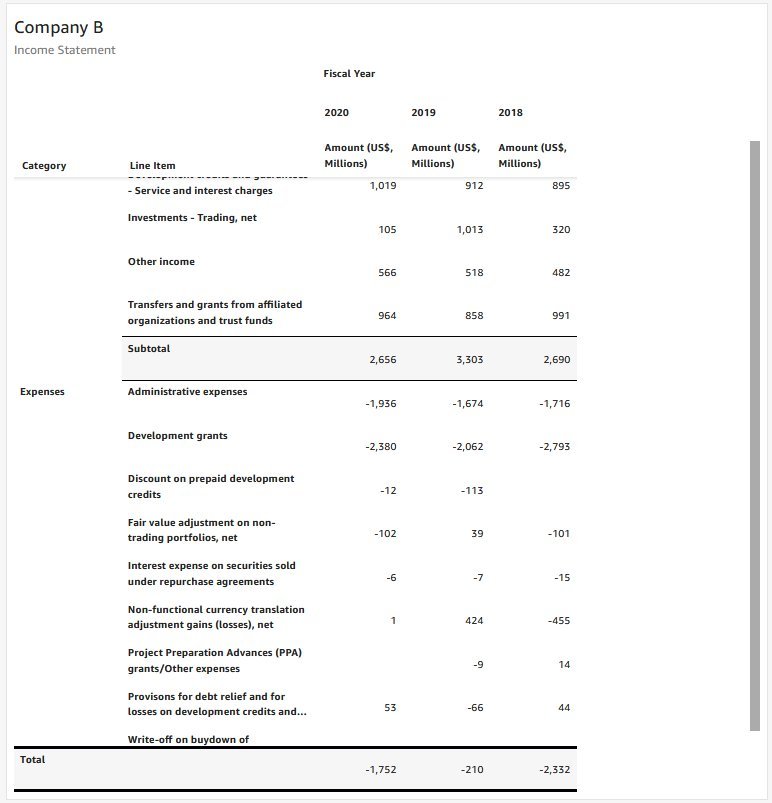
The following screenshot shows a customized table visual with links, images, font color, borders, grid lines, banding, text wrap, and custom row height.
The following screenshot shows a pivot table with custom styling for totals and sub-totals.
For deeper analytical exploration of data, we’ve enabled custom sorting of content in visualizations and pivot tables to allow well-defined presentation of content. Custom tooltips allow dashboard authors to add additional context beyond what’s readily available from the visual data on screen. You can now use parameters to dynamically populate titles and subtitles of visuals in dashboards. Time data can be aggregated to seconds, which is helpful for Internet of Things (IoT) and industrial use cases, and filters now allow exclusion of time fields completely to support business-facing use cases where day/month/year are the primary factors.
In filters, we’ve added wildcard search for faster filters for authors and end-users, multi-line filters to allow multiple values to be easily pasted for filtering, and an update to the relative date control to allow readers to select a custom date range over a relative period that has been selected besides selecting time period relative to today.
Consume and collaborate on dashboards
For easier collaboration within an organization, QuickSight now supports 1-click embedding of dashboards in wikis, SharePoint, Google sites, and more, requiring zero development efforts. This makes embedding dashboards as easy as embedding your favorite music video. We’ve also introduced link-based sharing of dashboards, which means that if desired, you can share a dashboard with all users in your organization without having to enable specific users or groups individually.
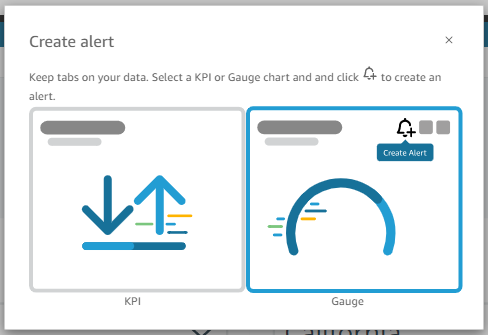
Threshold-based alerts in QuickSight allow dashboard readers to be notified when specific thresholds are breached by KPIs in a dashboard. Together with available ML-powered automated anomaly alerts, this allows readers to set up notification mechanisms when there are important expected or unexpected changes in data.
This year, we also launched the ability to share a view of a QuickSight dashboard, which allows readers to generate and provide a unique URL to others that captures the state of their filters. This allows for easy discussions around the shared view of data.
For offline access, readers can now receive PDF snapshots of their data, personalized to their specific roles and use cases. Authors set this up using the new personalized email reports feature, allowing unique emails to be sent to thousands of users at a predefined interval, each showing the end-user’s specific view of the data.
Create a reusable data architecture
Whether in a large organization or in a developer setting, creating and reusing datasets plays a significant role in ensuring that shared interpretations of data across the organization are accurate. To support this, QuickSight introduced dataset as a source, a new feature that allows a QuickSight dataset to be a source for creating another dataset. This creates a data lineage across the datasets. Updates related to calculated fields, data refreshes, row-level security, and column-level security can be configured to automatically propagate to datasets, providing a powerful data management tool. For more information, see Creating a Dataset Using an Existing Dataset in Amazon QuickSight.
As part of the logical information contained in the dataset, you can now create field folders to group fields, add metadata to fields, or include aggregate calculations in your dataset, which allows standardized calculations to be predefined and shared for easy inclusion in dashboards by authors.
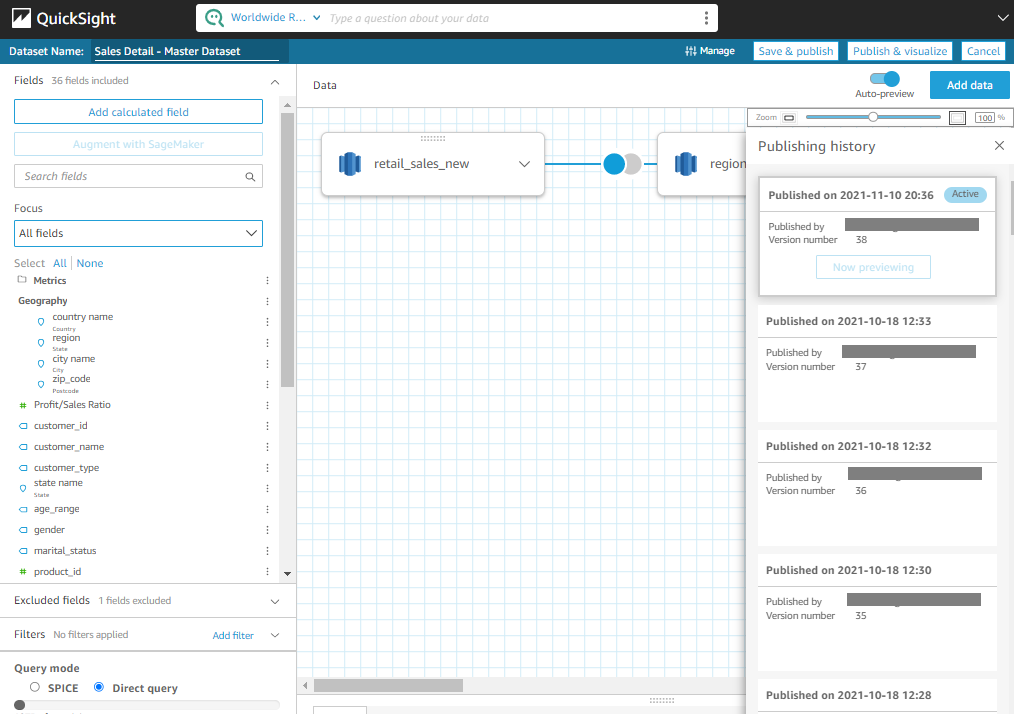
Datasets are now also versioned, allowing authors and data owners to quickly switch from one version to another, with no API calls or changes needed.
The screenshot below shows an example of version/publishing history of dataset from the preparation screen.
Lastly, QuickSight continues to add to existing live analytics options across Amazon Redshift, Snowflake, SQL Server, Oracle, and other data warehouses with the addition of Exasol. This allows authors a range of options in exploring PB-scale datasets directly from the cloud.
Embed insights into apps
Customers such as 3M, Bolt, Blackboard, NFL, Comcast, and Panasonic Avionics use QuickSight for embedded analytics that serve their customers and partners, saving months and years of development and ongoing maintenance time that would otherwise be needed to create a rich analytics layer in their products. QuickSight also lets customers introduce the latest advancements in BI such as ML-powered Insights and Natural Language Querying in end-user facing applications.
Getting started with embedded dashboards for proofs of concept in software as a service (SaaS) app integrations now only takes minutes, with our new 1-click embedding option. For deeper app integration with transparent authentication, we support server-side calls to QuickSight for embedding, including a new tag-based row-level security option so you can easily add non-modifiable filters to your dashboard. This means that you can embed a multi-tenant embedded dashboard for hundreds of thousands of users without all the heavy lifting needed to duplicate and manage these users in QuickSight or another BI product.
Developers now also have the powerful differentiator of Q as part of QuickSight’s embedded feature set. Q can be embedded into applications, allowing end-users to simply ask questions of data, along with shared context of insights provided through embedded QuickSight dashboards in the app. Some sample embedded dashboards are available on DemoCentral.
For developers and independent software vendors looking to consolidate their interactive dashboards and email reports in QuickSight, we also introduced the ability to customize email reports. This allows customization of the from address, logo, background color, and footer in the email, as shown in the following screenshot.
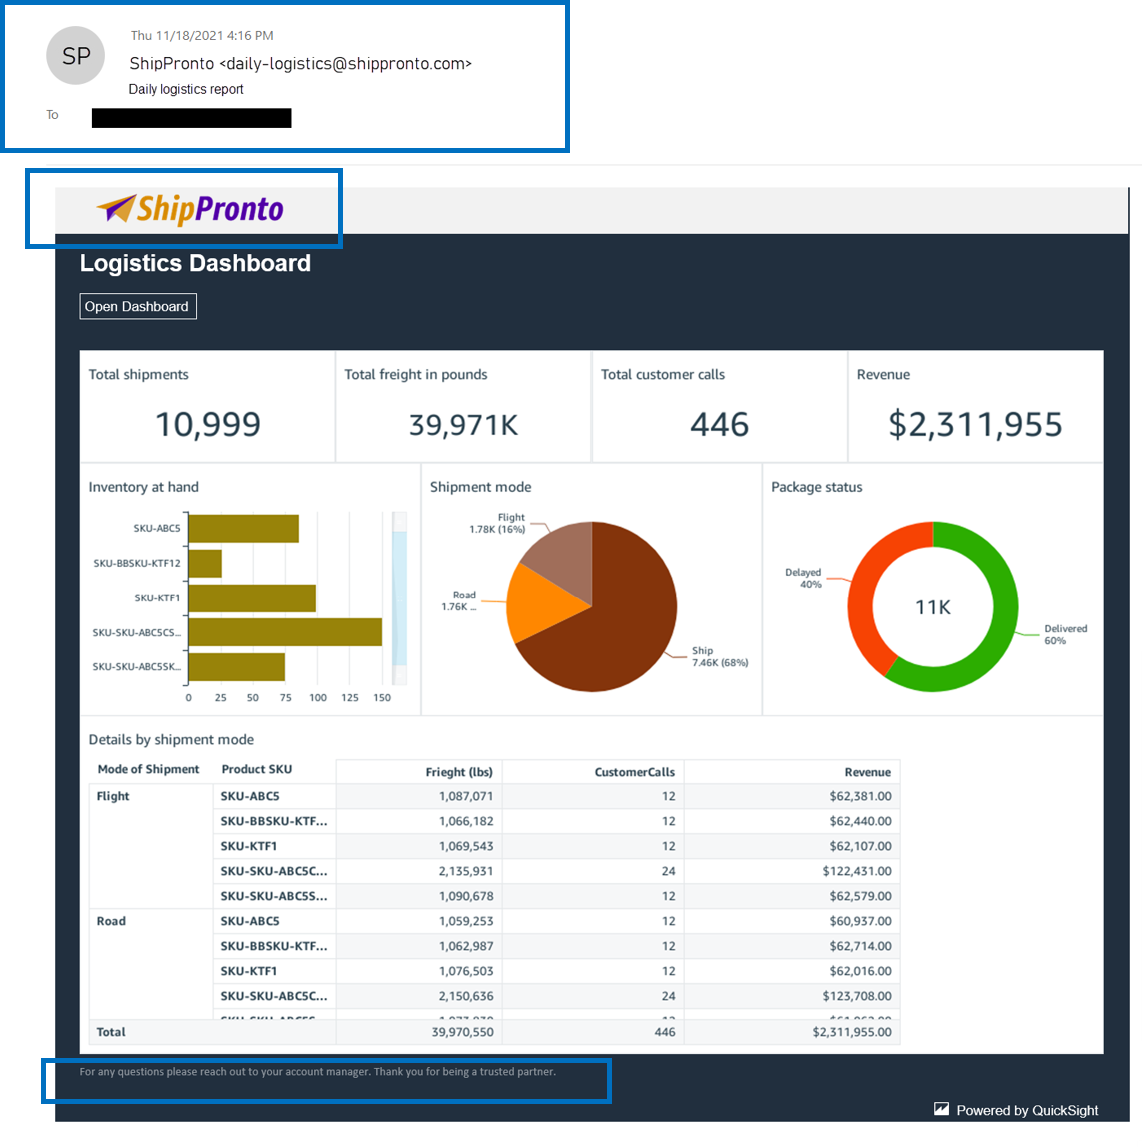
When combined with the existing functionality of embedding the QuickSight authoring experience, QuickSight now provides developers with a strong suite of embedded analytics capabilities ranging from embedded interactive dashboards, embedded ML-powered Q&A with Q, embedded authoring, and customized email reports.
Scaling and governance
The fully managed, cloud-native architecture of QuickSight has been a delighter for our broad customer base—no servers or nodes to set up, no software updates or patches to manage, and absolutely no infrastructure to think about.
SPICE, the in-memory calculation engine in QuickSight, has been a key pillar of this serverless architecture, allowing data to scale from tens of users to hundreds of thousands without any customer intervention. We have doubled our SPICE data limits to 500 million rows of data per dataset, and now support incremental data refreshes for SQL-based data sources, such as Amazon Redshift, Amazon Athena, PostgreSQL, or Snowflake every 15 minutes, which cuts down time between data updates by 75%. Incremental refreshes also update SPICE datasets in a fraction of the time a full refresh would take, enabling access to the most recent insights much sooner.
This year, we introduced multiple simplifications and security mechanisms as you create your QuickSight account. Administrators signing up to QuickSight can pick from an existing role in their AWS account instead of QuickSight creating a custom service role for the account. This allows you to set up your own role for a group of codependent AWS services and QuickSight that you want to work together.
Admins can now use service control policies (SCPs) to control QuickSight sign-up options within your organization. For example, admins can set up service control policies that deny sign-ups for QuickSight Standard Edition and turn off the ability to invite any users other than those possible via federated single sign-on (SSO).
Admins can also set up QuickSight with SSO such that email addresses for end-users are automatically synced at first-time login, avoiding any manual errors during entry, and preventing use of personal email addresses. See Secure and simplify account setup and access management with new Amazon QuickSight administrative controls to learn more.
QuickSight admins can now also enforce source IP restrictions on access to the QuickSight UI, mobile app, as well as embedded pages. This allows you to secure your data within QuickSight and only keep it for trusted sources to access. See Use IP restrictions to control access to Amazon QuickSight to learn more.
Lastly, adding to our existing certifications (SOC, PCI, HIPAA, and more), we’re now FedRamp High compliant in US GovCloud (West), providing government workloads with the same serverless benefits that our customers have enjoyed.
Conclusion
QuickSight serves millions of dashboard views weekly, enabling data-driven decision-making in organizations of all sizes. Best Western Hotels and Resorts use QuickSight to improve operations worldwide, and provides hotel operators with a real-time look at key metrics that are critical to the business, with over 23,000 users of QuickSight. True Blue, a company focused on specialized workforce solutions, including staffing, talent management, and recruitment process outsourcing, uses QuickSight to deliver more accurate pricing and grow their business across over 500 locations. Vyaire Medical, a global company focused on breathing in every stage of life, used QuickSight to scale up production of ventilators by 20 times during the COVID-19 pandemic. Accelo, a leading cloud-based platform for managing client work from prospect to payment for professional services companies, chose QuickSight to provide embedded analytics to their end-users within their web application.
The features we discussed in this post provide a key summary of the changes over this year that have helped accelerate these and other customers adopt QuickSight.
At re:Invent 2021, you will hear from the NFL—the world’s biggest sports league—about how QuickSight powers their Next Gen Stats portal and provides the NFL clubs, broadcasters, and researchers with real-time and historical stats. You’ll also learn and how Q will revolutionize how data is consumed.
On the embedded analytics front, we will have 3M, a pioneer in global healthcare, and Bolt, which is redefining the online checkout space for millions of users, speak about how QuickSight powers analytics for their end-users and lets them scale to all of their users without any infrastructure overheads.
We also have Accenture and Amazon’s own finance team speaking about how QuickSight allows them to move away from legacy BI to a cloud-native future, while providing the governance and compliance needs typical in the finance world.
This year, you can simply register for re:Invent online and view these sessions from the comfort of your chair. We look forward to connecting with you at re:Invent, whether in-person at our booth and sessions or virtually, and as always look forward to your feedback.
About the Author
 Jose Kunnackal, is a principal product manager for Amazon QuickSight, AWS’ cloud-native, fully managed BI service. Jose started his career with Motorola, writing software for telecom and first responder systems. Later he was Director of Engineering at Trilibis Mobile, where he built a SaaS mobile web platform using AWS services. Jose is excited by the potential of cloud technologies and looks forward to helping customers with their transition to the cloud.
 Sahitya Pandiri is a technical program manager with Amazon Web Services.