All posts by Jose Kunnackal

AWS recognized as a Challenger in the 2023 Gartner Magic Quadrant for Analytics and Business Intelligence Platforms

Post Syndicated from Jose Kunnackal original https://aws.amazon.com/blogs/big-data/aws-recognized-as-a-challenger-in-the-2023-gartner-magic-quadrant-for-analytics-and-business-intelligence-platforms/

AWS has been named a Challenger in the 2023 Gartner Magic Quadrant for Analytics and Business Intelligence (ABI) Platforms. Previously, AWS was positioned as a Niche player in the Magic Quadrant for ABI platforms. The Gartner Magic Quadrant evaluates 20 ABI companies based on their Ability to Execute and Completeness of Vision.

In our view, this recognition in the Magic Quadrant reinforces the progress we have made by tirelessly innovating on behalf of our customers. And this is just the beginning.

Benefits of QuickSight

AWS built QuickSight from the ground up as a cloud BI service to overcome challenges customers faced with alternative offerings. QuickSight powers data-driven organizations with unified business intelligence at hyperscale. With QuickSight, organizations of any size can meet the analytical needs of all users from the same source of truth through modern interactive dashboards, paginated reports, embedded analytics, and natural language queries. Since introducing QuickSight in 2016, we have been on a journey to democratize access to data for everyone in an organization. In 2022 alone, QuickSight added more than 80 capabilities, making it easier for you to deliver valuable business insights throughout your organization, when and where needed.

Today, over 100,000 customers use QuickSight as their BI service. Organizations of all sizes are choosing QuickSight for their BI needs and enabling users to understand, visualize, and derive insights and predictions from data, regardless of technical expertise.

Review the Gartner Magic Quadrant

 2023 Gartner Magic Quadrant for Analytics and Business Intelligence Platforms

Access a complimentary copy of the full report to see why Gartner positioned AWS as a Challenger, and dive deep into the strengths and cautions of AWS.

We are excited about our momentum, strong vision, and the pace at which we are enabling our customers to democratize access to data for everyone in their organization.


Gartner Disclaimer

Gartner does not endorse any vendor, product or service depicted in its research publications, and does not advise technology users to select only those vendors with the highest ratings. Gartner research publications consist of the opinions of Gartner’s research organization and should not be construed as statements of fact. Gartner disclaims all warranties, expressed or implied, with respect to this research, including any warranties of merchantability or fitness for a particular purpose.

Gartner, Magic Quadrant for Analytics and Business Intelligence Platforms, Kurt Schlegel, Julian Sun, David Pidsley, Anirudh Ganeshan, Fay Fei, Aura Popa, Radu Miclaus, Edgar Macari, Kevin Quinn, Christopher Long, 5 April 2023

Gartner is a registered trademark and service mark and Magic Quadrant is a registered trademark of Gartner, Inc. and/or its affiliates in the U.S. and internationally and are used herein with permission. All rights reserved

This graphic was published by Gartner, Inc. as part of a larger research document and should be evaluated in the context of the entire document. The Gartner document is available upon request from Amazon Web Services, Inc.


About the Author

Jose Kunnackal is Director of Product Management for Amazon QuickSight, AWS’ cloud-native, fully managed BI service. Jose started his career with Motorola, writing software for telecom and first responder systems. Later he was Director of Engineering at Trilibis Mobile, where he built a SaaS mobile web platform using AWS services. Jose is excited by the potential of cloud technologies to help customers make the most of their data.

Amazon QuickSight: 2021 in review

Post Syndicated from Jose Kunnackal original https://aws.amazon.com/blogs/big-data/amazon-quicksight-2021-in-review/

With AWS re:Invent just around the corner, we at the Amazon QuickSight team have put together this post to provide you with a handy list of all the key updates this year. We’ve broken this post into three key sections: insights for every user, embedded analytics with QuickSight, scaling and governance.

Insights for every user

Amazon QuickSight allows every user in the organization to get a better understanding of data – through simple natural language questions and interactive dashboards for end-users, or ML-powered data exploration for business analysts. Developers can add embedded visualizations, dashboards, and Q to their apps to differentiate and enhance user experiences. Let’s take a look at the new experiences and features that you can deploy to your users from our 2021 updates.

Amazon QuickSight Q for true self-service for end-users

Earlier this year, Amazon QuickSight Q became generally available, making machine learning (ML) powered Q&A available for end-users to simply ask questions of their data—no training or preparation needed. End-users can go beyond what is presented in the dashboard with Q, avoiding the typical back-and-forth exchanges between the end-user and business intelligence (BI) teams, and the often weeks-long wait associated with adding a new dashboard or visual. It also allows end-users to more intuitively understand data, without having to interpret different visualizations, or understand filters or other elements in a traditional BI dashboard.

For example, a sales manager can simply ask the question “What were monthly sales in California this year?” to get a response from Q. To go deeper, they could follow up with “Who were the top five customers by sales in California?” Q presents a visual response to the user, no manual changes or analysis needed. Q can also be embedded into applications, allowing developers to augment and differentiate their application’s experiences. For more information on Q and how to get started, see Amazon QuickSight Q – Business Intelligence Using Natural Language Questions.

Free-form layouts, new chart types, and much more for pixel-perfect, interactive dashboards

Authors of QuickSight dashboards can now use the new free-form layout, which allows precise placement and sizing of dashboard components, overlay of charts and images, and conditional rendering of elements based on parameters. The combination of these features, along with granular customization options now available across charts (such as hiding grid lines, axis labels, and more) allow dashboards in QuickSight to be highly tailored to specific use cases or designs. The following screenshots show examples of customized dashboards using the free-form layout.

Authors can also use new visual types in QuickSight, such as the dual axis line chart and Sankey, to quickly add new ways of presenting data in dashboards. Sankey charts in particular have been very popular among QuickSight users, allowing visualization of cash flows, process steps, or visitor flows on a website—without having to extensively customize charts or license external plug-ins. We also added the option to add custom web components in dashboards, which allows you to embed images, videos, web pages, or external apps. When combined with the ability to pass parameter values into the custom components, this provides dashboard authors with a very broad set of creative possibilities.

The screenshot below shows an example of dual axis line chart (on the left) where high and volume metrics are mapped on two different scales within the same chart.

The screenshot below shows a Sankey chart showing consumption modes and channels for different energy sources.

The following screenshot shows an example of embedded web content (physical store navigation by different transit modes) within a QuickSight dashboard.

Tables and pivot tables have also received a broad set of updates, allowing authors to customize these extensively to meet organizational design standards, with new features allowing you to do the following:

  • Increase row height
  • Wrap text
  • Vertically align content
  • Customize background color, font color, borders, grid lines, and banding
  • Style and highlight your totals and subtotals
  • Style and hyperlink content to external resources
  • Add images within table cells

The following screenshot shows a customized table visual with links, images, font color, borders, grid lines, banding, text wrap, and custom row height.

The following screenshot shows a pivot table with custom styling for totals and sub-totals.

For deeper analytical exploration of data, we’ve enabled custom sorting of content in visualizations and pivot tables to allow well-defined presentation of content. Custom tooltips allow dashboard authors to add additional context beyond what’s readily available from the visual data on screen. You can now use parameters to dynamically populate titles and subtitles of visuals in dashboards. Time data can be aggregated to seconds, which is helpful for Internet of Things (IoT) and industrial use cases, and filters now allow exclusion of time fields completely to support business-facing use cases where day/month/year are the primary factors.

In filters, we’ve added wildcard search for faster filters for authors and end-users, multi-line filters to allow multiple values to be easily pasted for filtering, and an update to the relative date control to allow readers to select a custom date range over a relative period that has been selected besides selecting time period relative to today.

Consume and collaborate on dashboards

For easier collaboration within an organization, QuickSight now supports 1-click embedding of dashboards in wikis, SharePoint, Google sites, and more, requiring zero development efforts. This makes embedding dashboards as easy as embedding your favorite music video. We’ve also introduced link-based sharing of dashboards, which means that if desired, you can share a dashboard with all users in your organization without having to enable specific users or groups individually.

Threshold-based alerts in QuickSight allow dashboard readers to be notified when specific thresholds are breached by KPIs in a dashboard. Together with available ML-powered automated anomaly alerts, this allows readers to set up notification mechanisms when there are important expected or unexpected changes in data.

This year, we also launched the ability to share a view of a QuickSight dashboard, which allows readers to generate and provide a unique URL to others that captures the state of their filters. This allows for easy discussions around the shared view of data.

For offline access, readers can now receive PDF snapshots of their data, personalized to their specific roles and use cases. Authors set this up using the new personalized email reports feature, allowing unique emails to be sent to thousands of users at a predefined interval, each showing the end-user’s specific view of the data.

Create a reusable data architecture

Whether in a large organization or in a developer setting, creating and reusing datasets plays a significant role in ensuring that shared interpretations of data across the organization are accurate. To support this, QuickSight introduced dataset as a source, a new feature that allows a QuickSight dataset to be a source for creating another dataset. This creates a data lineage across the datasets. Updates related to calculated fields, data refreshes, row-level security, and column-level security can be configured to automatically propagate to datasets, providing a powerful data management tool. For more information, see Creating a Dataset Using an Existing Dataset in Amazon QuickSight.

As part of the logical information contained in the dataset, you can now create field folders to group fields, add metadata to fields, or include aggregate calculations in your dataset, which allows standardized calculations to be predefined and shared for easy inclusion in dashboards by authors.

Datasets are now also versioned, allowing authors and data owners to quickly switch from one version to another, with no API calls or changes needed.

The screenshot below shows an example of version/publishing history of dataset from the preparation screen.

Lastly, QuickSight continues to add to existing live analytics options across Amazon Redshift, Snowflake, SQL Server, Oracle, and other data warehouses with the addition of Exasol. This allows authors a range of options in exploring PB-scale datasets directly from the cloud.

Embed insights into apps

Customers such as 3M, Bolt, Blackboard, NFL, Comcast, and Panasonic Avionics use QuickSight for embedded analytics that serve their customers and partners, saving months and years of development and ongoing maintenance time that would otherwise be needed to create a rich analytics layer in their products. QuickSight also lets customers introduce the latest advancements in BI such as ML-powered Insights and Natural Language Querying in end-user facing applications.

Getting started with embedded dashboards for proofs of concept in software as a service (SaaS) app integrations now only takes minutes, with our new 1-click embedding option. For deeper app integration with transparent authentication, we support server-side calls to QuickSight for embedding, including a new tag-based row-level security option so you can easily add non-modifiable filters to your dashboard. This means that you can embed a multi-tenant embedded dashboard for hundreds of thousands of users without all the heavy lifting needed to duplicate and manage these users in QuickSight or another BI product.

Developers now also have the powerful differentiator of Q as part of QuickSight’s embedded feature set. Q can be embedded into applications, allowing end-users to simply ask questions of data, along with shared context of insights provided through embedded QuickSight dashboards in the app. Some sample embedded dashboards are available on DemoCentral.

For developers and independent software vendors looking to consolidate their interactive dashboards and email reports in QuickSight, we also introduced the ability to customize email reports. This allows customization of the from address, logo, background color, and footer in the email, as shown in the following screenshot.

When combined with the existing functionality of embedding the QuickSight authoring experience, QuickSight now provides developers with a strong suite of embedded analytics capabilities ranging from embedded interactive dashboards, embedded ML-powered Q&A with Q, embedded authoring, and customized email reports.

Scaling and governance

The fully managed, cloud-native architecture of QuickSight has been a delighter for our broad customer base—no servers or nodes to set up, no software updates or patches to manage, and absolutely no infrastructure to think about.

SPICE, the in-memory calculation engine in QuickSight, has been a key pillar of this serverless architecture, allowing data to scale from tens of users to hundreds of thousands without any customer intervention. We have doubled our SPICE data limits to 500 million rows of data per dataset, and now support incremental data refreshes for SQL-based data sources, such as Amazon Redshift, Amazon Athena, PostgreSQL, or Snowflake every 15 minutes, which cuts down time between data updates by 75%. Incremental refreshes also update SPICE datasets in a fraction of the time a full refresh would take, enabling access to the most recent insights much sooner.

This year, we introduced multiple simplifications and security mechanisms as you create your QuickSight account. Administrators signing up to QuickSight can pick from an existing role in their AWS account instead of QuickSight creating a custom service role for the account. This allows you to set up your own role for a group of codependent AWS services and QuickSight that you want to work together.

Admins can now use service control policies (SCPs) to control QuickSight sign-up options within your organization. For example, admins can set up service control policies that deny sign-ups for QuickSight Standard Edition and turn off the ability to invite any users other than those possible via federated single sign-on (SSO).

Admins can also set up QuickSight with SSO such that email addresses for end-users are automatically synced at first-time login, avoiding any manual errors during entry, and preventing use of personal email addresses. See Secure and simplify account setup and access management with new Amazon QuickSight administrative controls to learn more.

QuickSight admins can now also enforce source IP restrictions on access to the QuickSight UI, mobile app, as well as embedded pages. This allows you to secure your data within QuickSight and only keep it for trusted sources to access. See Use IP restrictions to control access to Amazon QuickSight to learn more.

Lastly, adding to our existing certifications (SOC, PCI, HIPAA, and more), we’re now FedRamp High compliant in US GovCloud (West), providing government workloads with the same serverless benefits that our customers have enjoyed.

Conclusion

QuickSight serves millions of dashboard views weekly, enabling data-driven decision-making in organizations of all sizes. Best Western Hotels and Resorts use QuickSight to improve operations worldwide, and provides hotel operators with a real-time look at key metrics that are critical to the business, with over 23,000 users of QuickSight. True Blue, a company focused on specialized workforce solutions, including staffing, talent management, and recruitment process outsourcing, uses QuickSight to deliver more accurate pricing and grow their business across over 500 locations. Vyaire Medical, a global company focused on breathing in every stage of life, used QuickSight to scale up production of ventilators by 20 times during the COVID-19 pandemic. Accelo, a leading cloud-based platform for managing client work from prospect to payment for professional services companies, chose QuickSight to provide embedded analytics to their end-users within their web application.

The features we discussed in this post provide a key summary of the changes over this year that have helped accelerate these and other customers adopt QuickSight.

At re:Invent 2021, you will hear from the NFL—the world’s biggest sports league—about how QuickSight powers their Next Gen Stats portal and provides the NFL clubs, broadcasters, and researchers with real-time and historical stats. You’ll also learn and how Q will revolutionize how data is consumed.

On the embedded analytics front, we will have 3M, a pioneer in global healthcare, and Bolt, which is redefining the online checkout space for millions of users, speak about how QuickSight powers analytics for their end-users and lets them scale to all of their users without any infrastructure overheads.

We also have Accenture and Amazon’s own finance team speaking about how QuickSight allows them to move away from legacy BI to a cloud-native future, while providing the governance and compliance needs typical in the finance world.

This year, you can simply register for re:Invent online and view these sessions from the comfort of your chair. We look forward to connecting with you at re:Invent, whether in-person at our booth and sessions or virtually, and as always look forward to your feedback.


About the Author

Jose Kunnackal, is a principal product manager for Amazon QuickSight, AWS’ cloud-native, fully managed BI service. Jose started his career with Motorola, writing software for telecom and first responder systems. Later he was Director of Engineering at Trilibis Mobile, where he built a SaaS mobile web platform using AWS services. Jose is excited by the potential of cloud technologies and looks forward to helping customers with their transition to the cloud.

Sahitya Pandiri is a technical program manager with Amazon Web Services.

Create stunning, pixel perfect dashboards with the new free-form layout mode in Amazon QuickSight

Post Syndicated from Jose Kunnackal original https://aws.amazon.com/blogs/big-data/create-stunning-pixel-perfect-dashboards-with-the-new-free-form-layout-mode-in-amazon-quicksight/

The latest update of Amazon QuickSight introduces a new free-form dashboard layout option, along with granular per-visual interaction controls and conditional rendering options that open up a range of creative possibilities for dashboard authors. In this post, we look at the new capabilities available and how you can use them to create and share stunning dashboards, whether for QuickSight readers in your organization or to embed in your application for end-users.

What’s new in QuickSight dashboard layouts?

Layout modes in QuickSight determine how visuals in a dashboard are sized and presented to end-users, and the degree of flexibility authors have in modifying the dashboard to meet their visual styling needs. QuickSight now supports three layout options for dashboards:

  • Tiled – Visuals snap to a grid layout, minimizing effort needed to resize and arrange visuals. Authors can choose the base screen size they’re building for (for example, laptops or HD monitors), and the dashboard scales automatically to any screen width or display, zooming in or out as needed to scale and display the content on the user’s screen as designed by the author. In mobile view, the visuals display as designed when in landscape mode and automatically arrange to a single column when in portrait mode. As the name suggests, visuals are tiled in this mode, and can’t overlap each other.
  • Free-form (new!) – This mode allows visuals to be placed anywhere, including overlapping other visuals, along with pixel-level control over elements on the dashboard. This offers very precise control and detail-oriented design approaches. In this mode, authors still pick a screen size they’re designing for, and dashboards display as designed on all screens, zooming in or out as needed. Because dashboards are designed intricately with overlaps and images, QuickSight doesn’t automatically adjust this view for mobile access, and so mobile users see the author-created layout as is, scaled to fit on their landscape or portrait screen orientation on smaller screens. This mode also offers a new capability of conditionally rendering a visual based on QuickSight parameter-based rules, which opens up creative possibilities for interactive dashboards.
  • Classic – This is the legacy layout mode, where visuals snap to a grid layout. In this mode, QuickSight might show or hide content based on screen sizes, which can cause dashboards to display content differently on different devices.

Existing dashboards will remain in classic mode until authors explicitly modify and republish them in tiled or free-form mode as necessary.

Get started with free-form mode

You can get started with free-form mode in five easy steps:

  1. Open a new QuickSight analysis and change the layout setting to Free-form.
    1. Optionally, set the View to Fit to window if you prefer seeing the full canvas (scaled up or down).
  2. Try resizing and moving the initial visual around. See how the visual stays where you drop it.

When using mouse to move the visuals, they still snap to the closest grid for ease of alignment. Try using the arrow keys for finer adjustments.

  1. Add another visual and move it on top of the first visual. See how the visual overlaps the first visual.
  2. Make the second visual fully overlap the first visual.
  3. To access the first visual without moving the second visual, choose the visual menu of the second bigger visual and send it backward.

Wondering if you can switch your existing analysis to free-form mode? Sure thing! Choose Settings on the left panel of the analysis and choose Free-form from the Layout options.

Get proficient in free-form layout

Now that you know the basics, let’s dive deeper. Four groups of settings are key to building in free-form layout: placement, style, interactions, and rules.

You can access these settings from each visual’s Format visual panel.

  • Placement – This lets you control the exact position and size of each visual on your dashboard. You do this by specifying the X,Y coordinates (for the top left corner of your visual) and the desired height and width. Keep in mind that the X,Y coordinates start from the top left of your dashboard (the top left point of your dashboard is 0,0 (X,Y)). You can use the mouse to resize and position a visual, but the placement control gives you an easier way to get perfect alignment.
  • Style – With style controls, you can set the background, border and selection colors, their transparencies, or turn these off. Disabling the background makes the visual fully transparent. This is extremely useful when you’re layering visuals on top of other visuals for awesome effects.
  • Interactions – With these controls, you can remove all the visual-level interactions (like drill-downs, sorting, maximizing visuals, and exporting data) when desired. These settings apply to the dashboard view only, and allow you to overlay charts on other charts or images to create the impression of a single composite visual to the end-user.
  • Rules – You can set rules to show or hide visuals based on parameter values. All visuals are visible by default. You can add rules on when they should be hidden. Alternatively, you can flip the default state of the visual to hidden and configure rules on when to show the visual. Pair this with overlaid placement of visuals to build dynamic dashboards that respond to user selections or inputs from the parent application (when used in embedded context).

You can explore a sample dashboard for inspiration, and examine the analysis view to see how it is built.

Also check out the QuickSight dashboard gallery with samples from our partners.

Conclusion

With the new free-form layout, QuickSight enables you to build dashboards that can be tailored to meet your exact dashboard specifications, which can then be distributed to hundreds of thousands of users via the QuickSight portal, mobile app, email, or embedded within your own applications.


About the Authors

Jose Kunnackal, is a principal product manager for Amazon QuickSight, AWS’ cloud-native, fully managed BI service. Jose started his career with Motorola, writing software for telecom and first responder systems. Later he was Director of Engineering at Trilibis Mobile, where he built a SaaS mobile web platform using AWS services. Jose is excited by the potential of cloud technologies and looks forward to helping customers with their transition to the cloud.

Arun Santhosh is a Senior Solution Architect for Amazon QuickSight. Arun started his career at IBM as a developer and progressed on to be an Application Architect. Later, he worked as a Technical Architect at Cognizant. Business Intelligence has been his core focus in these prior roles as well.

Amazon QuickSight: 2020 in review

Post Syndicated from Jose Kunnackal original https://aws.amazon.com/blogs/big-data/amazon-quicksight-2020-in-review/

As 2020 draws to a close, we’ve put together this post to walk you through all that’s changed in Amazon QuickSight in 2020. For your reading convenience, this post is broken up into the following sections:

  • Embedded Analytics at scale
  • Faster insights with Q & Machine Learning (ML)
  • Business Intelligence (BI) with QuickSight
    • Build Rich, Interactive Dashboards
    • Scale your data with SPICE
    • Centralized governance, security, and administration
  • QuickSight learning resources

Embedded Analytics at scale

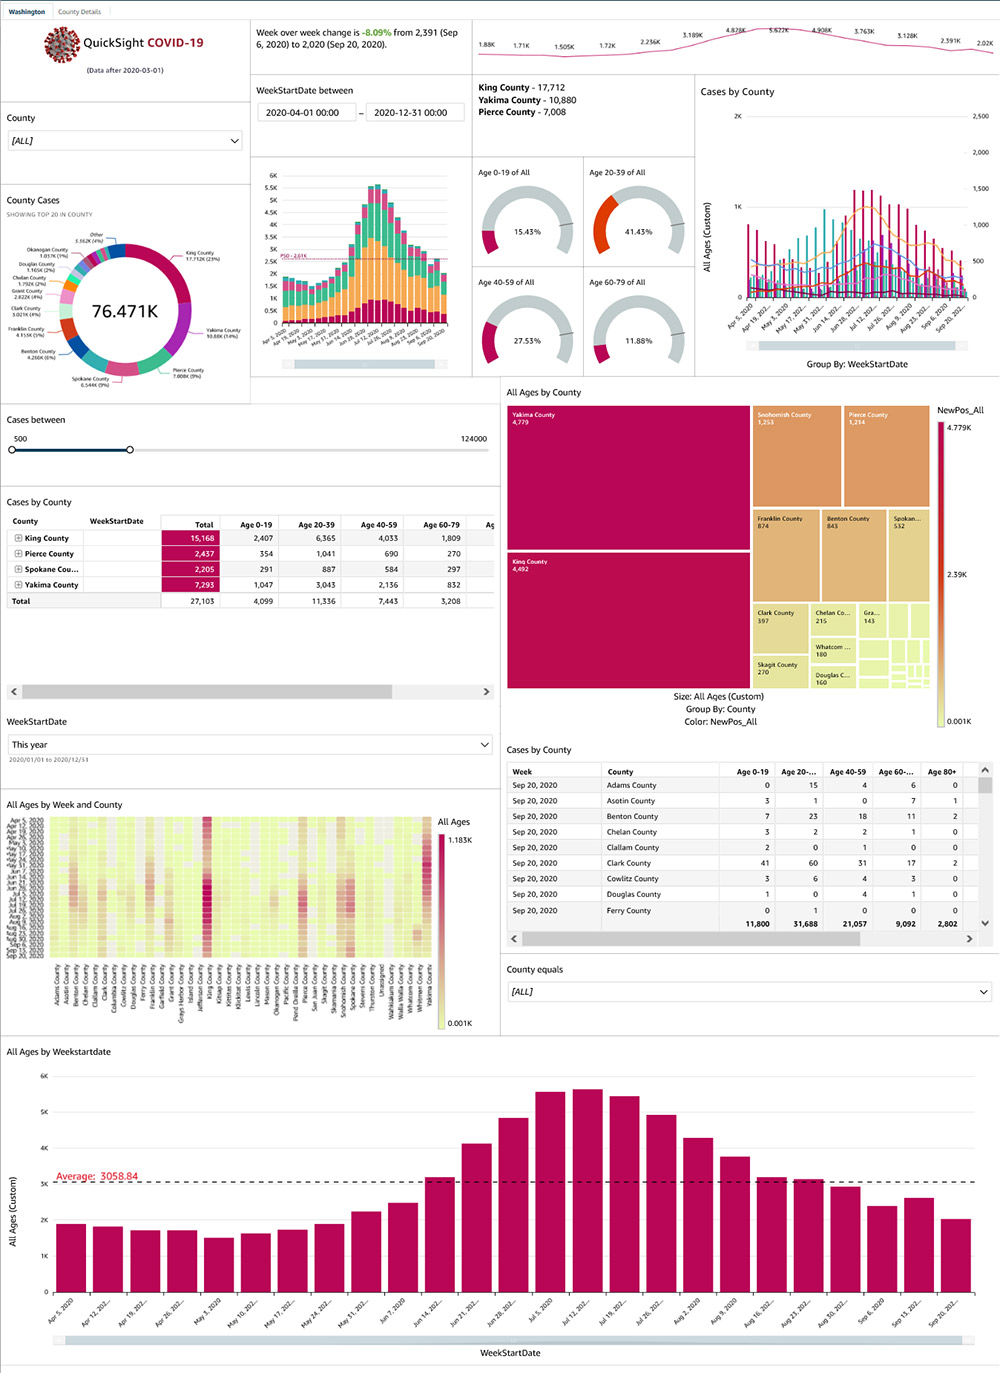
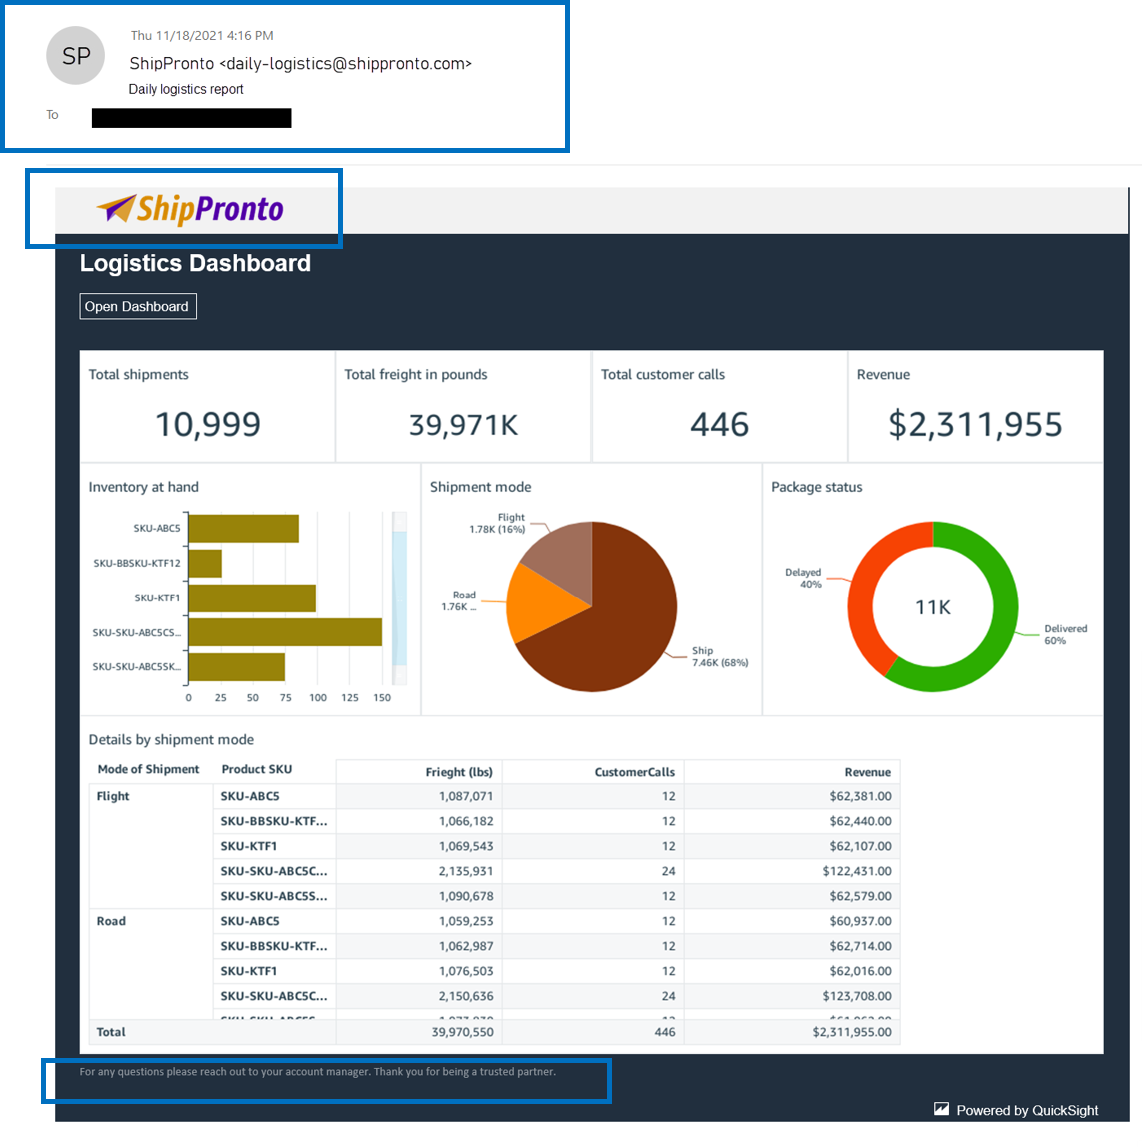
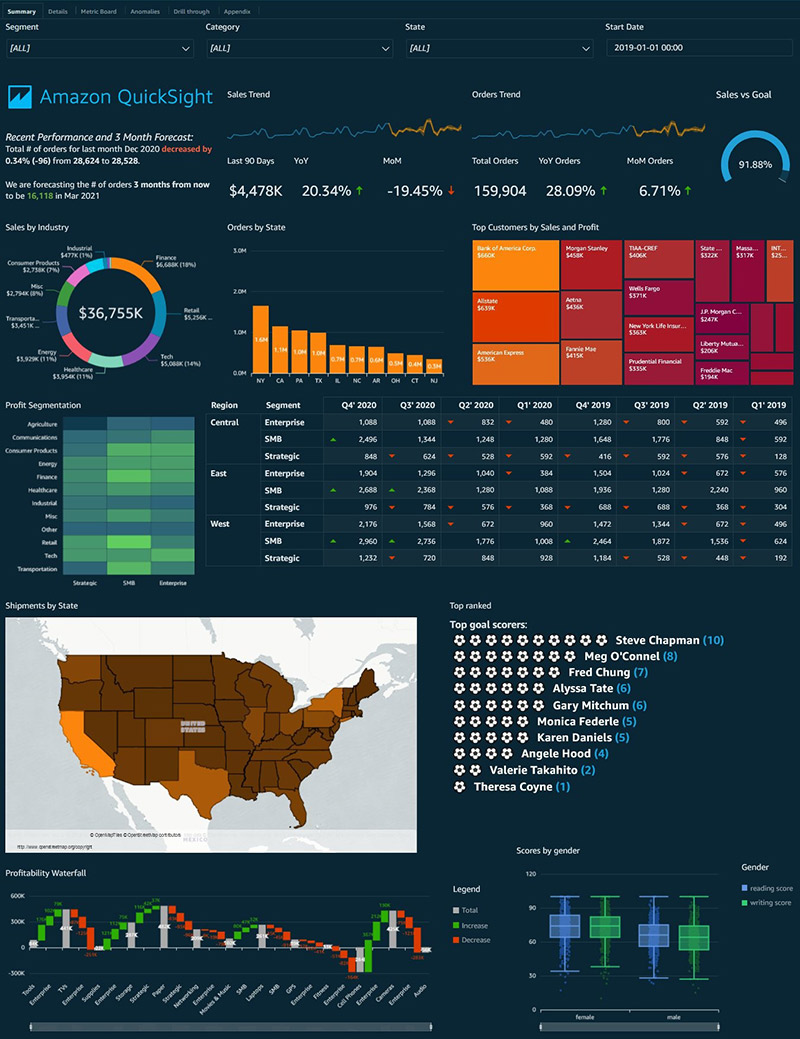
Embedded analytics has been a key focus area for both independent software vendors (ISVs) and enterprises in the past year. Thousands of customers have since chosen to launch embedded dashboards in QuickSight for both their internal and external end-users, including the NFL, Blackboard, Comcast, Panasonic Avionics, EHE Health, and more, with the ability to scale from tens of users to tens of thousands without any server provisioning or management. Embedding analytics within existing end-user workflows has meant better engagement in apps and portals, and less fatigue for users as they do not need to browse multiple apps for insights.

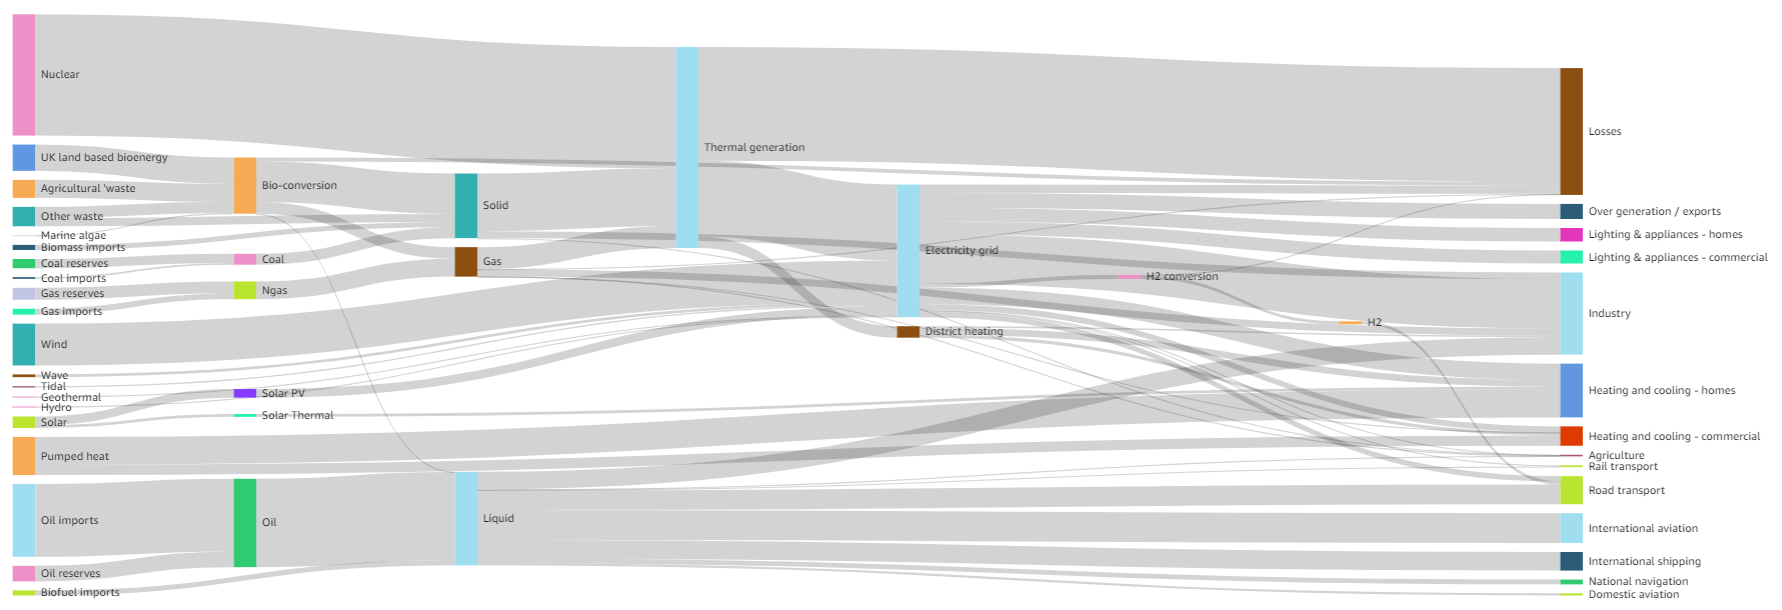
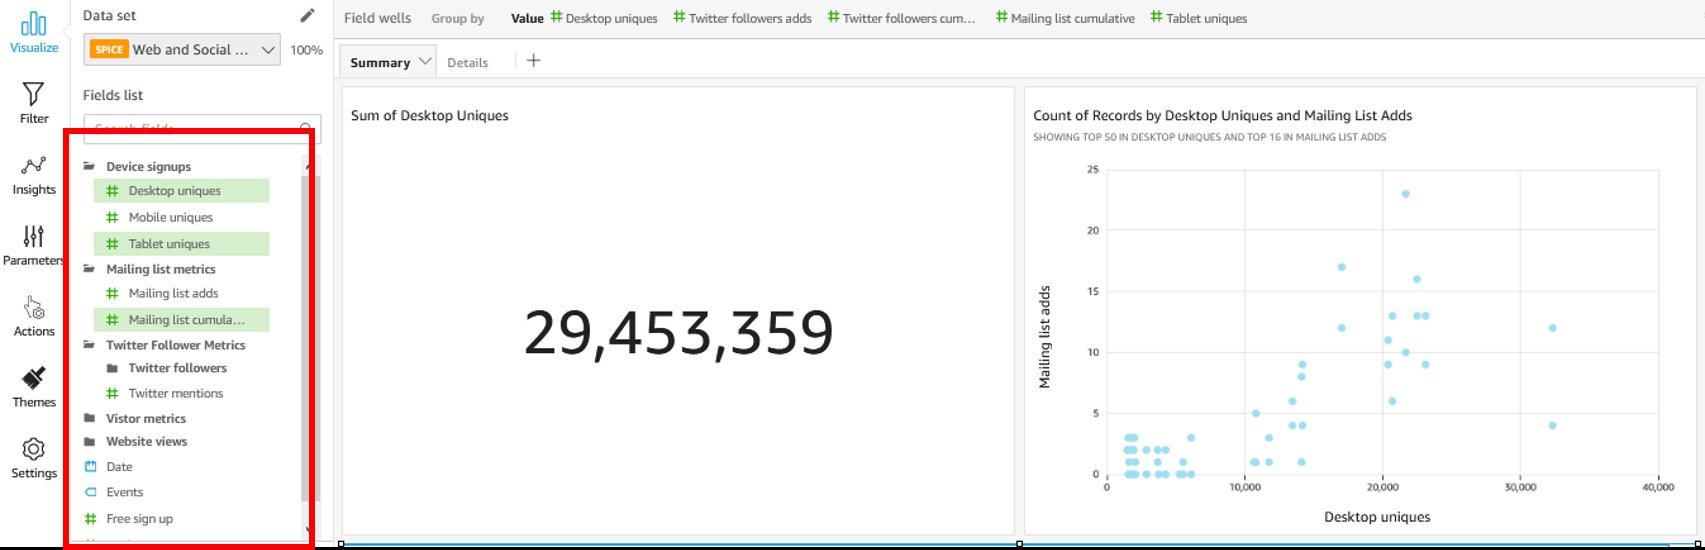
Dashboard embedded within the website of a fictional company

In 2020, we launched namespaces in QuickSight adding native support for multi-tenancy, an important consideration for developers and ISVs looking for in-app analytics. Together with embedded QuickSight authoring (dashboard creation capabilities), namespaces allow developers and ISVs to use QuickSight to provide self-service data exploration and dashboard creation options to specific users of an application or portal. E.g., ISVs can empower power users to build their own dashboards and share with other end-users from the same organization, which provides feature differentiation for the ISV’s app and also new revenue opportunities for ISVs. We also updated the QuickSight JavaScript SDK  to allow you to pass parameters into an embedded dashboard, switch tabs, change languages, and listen to events within an embedded dashboard.

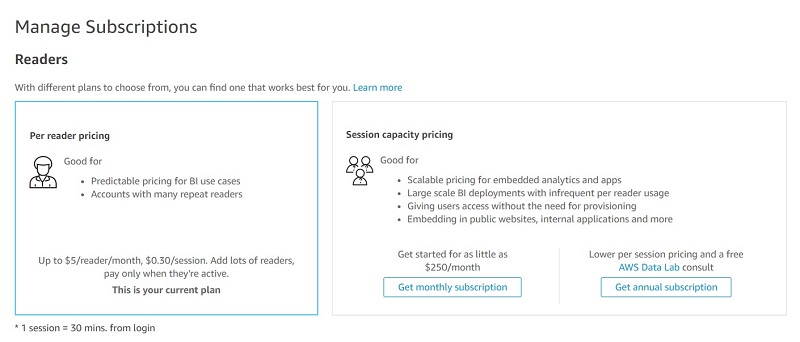
As developers, ISVs, and enterprises roll out analytics with QuickSight for hundreds of thousands, we also saw the need for a pricing model that scales with growth. The QuickSight per-user model for dashboard readers offers a per-user max charge of $5 per reader per month, offering a low per-user price point for BI use cases. However, as dashboards are rolled out to hundreds of thousands of users, we find that average session consumption per user is usually low (less than 10 sessions a month), but aggregate session usage across users within the account is high.

To ensure scalable pricing for growth, we launched a new session capacity pricing model that allows you to commit to session usage in bulk, and benefit from increased per-session discounts with commitments. With session capacity pricing, sessions are simply charged in 30-minute blocks of usage starting with first access. Unlike traditional options for capacity pricing, which require a server with annual commitments, session capacity pricing allows you to get started easily with a $250 per month starter option. After starting with the monthly option, you can move to one of the annual session capacity tiers as your session usage increases—ensuring that costs scale with growing usage. Annual session capacities allow sessions to be consumed across the year, providing flexibility in ramping up on production traffic, balancing session needs across busy or lean periods of the year (the first or last week of the month are busy, holidays may be slow or busy depending on the nature of the business). For more details on the new pricing options, see Amazon QuickSight Pricing.

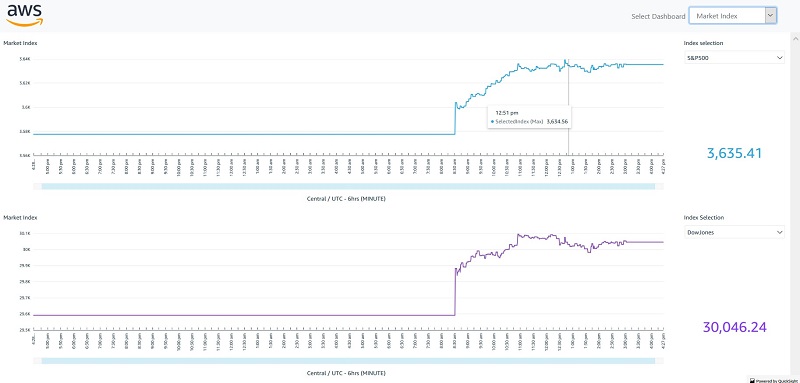
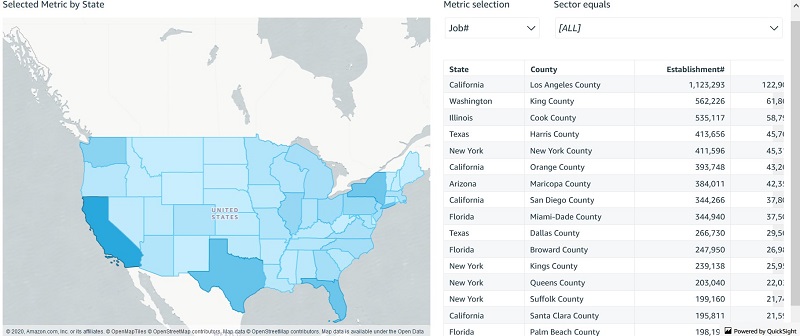
With this new model in place, we now also support embedding QuickSight dashboards in scenarios where provisioning and managing end-user reader identities might not be convenient (or even possible). Examples of these situations include embedded dashboards for sharing public statistics within a city or county, dashboards of company-wide statistics available to all users to be embedded on an internal corporate portal, or embedded dashboards with the same data intended for tens of thousands of users per customer, department, or job location or site within an app.

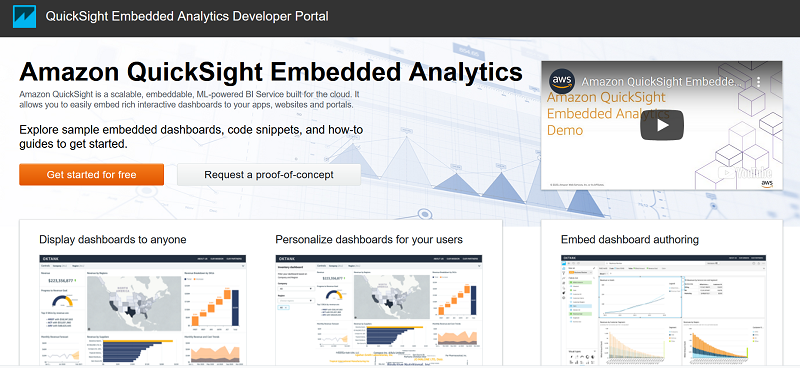
To make it easier to get started with QuickSight embedded analytics, we also have a new embedded analytics developer portal. Learn more about how to embed, view code samples, see capabilities of the JavaScript SDK, and interact with embedded dashboards as well as the authoring experience without having to sign up or code!

Faster insights with Q and ML

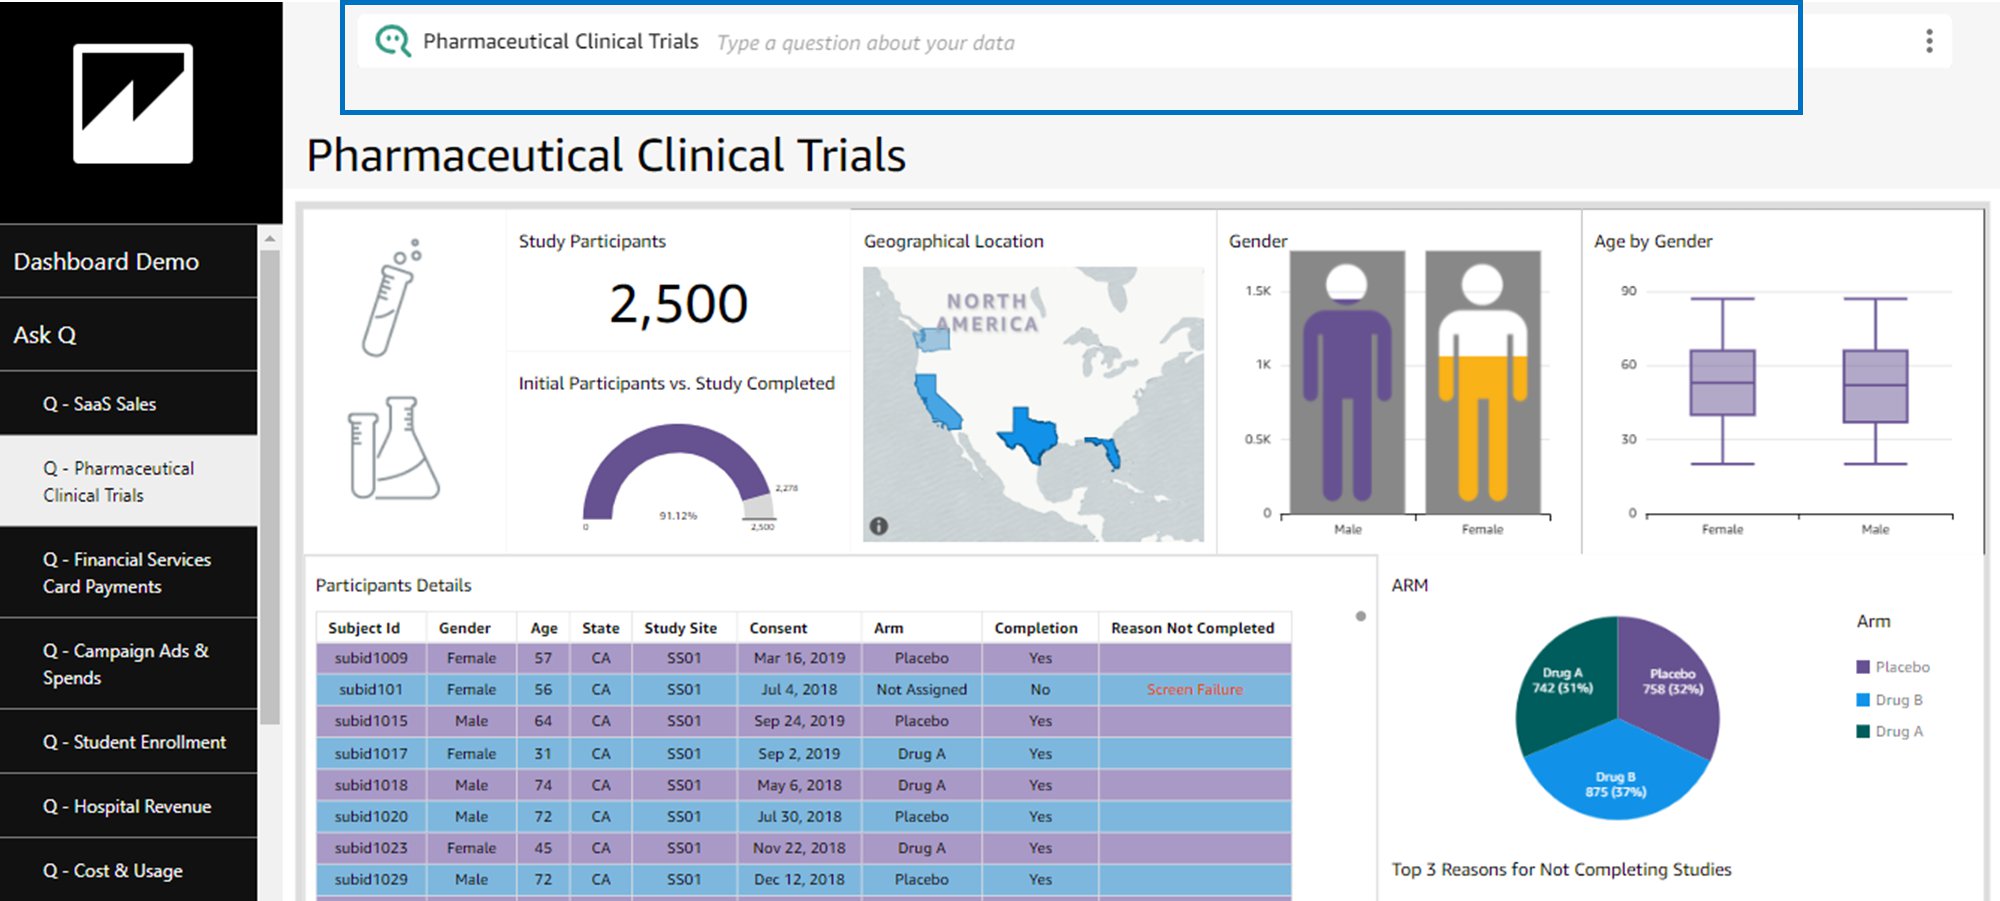
While embedding dashboards provides a way to present users with key statistics and insights that are curated ahead of time, end-users often want to dig in further and ask detailed questions. While embedded authoring capabilities allow for such detailed exploration, it is often power users or analysts who leverage such features. For most regular end users, it is either the app developer (in case of embedded apps) or the BI team (in case of BI dashboards) that provides answers to such detailed questions. Both app devs and BI teams are often backlogged, and take time to respond. As a result, this workflow can be tedious and time consuming, and disruptive to both the decision-makers and the data teams. This prompted us to develop Q, the machine learning (ML)-powered natural language query capability in QuickSight. With Q, business users of QuickSight can ask questions in everyday business language and get answers in seconds. For more information on Amazon Quicksight Q, see the product page and our blog post New – Amazon Quicksight Q answers natural-language questions about business data. Q is now available in preview, sign up now.

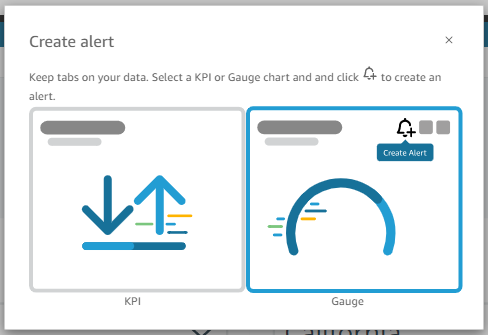
Separately, we have also continued our efforts to integrate AWS advances in ML into QuickSight to provide easy-to-use ML capabilities for business analysts and end-users. The most popular feature of our ML-Insights suite has been natural language narratives in QuickSight, which use natural language generation to provide key insights that you can customize and add to dashboards. We added the ability to add images and links to these insights (and conditionally showing them as needed), allowing you to use these as a versatile component of your dashboards, which can present up-to-date insights in simple business language for easy consumption by end-users.

We also made Amazon SageMaker integration generally available this year. With this integration, you can perform ML-powered inferences on your datasets with just a few clicks. These include predicting the likelihood of customer churn, scoring leads to prioritize sales activity, assessing credit risk for loan applications, and more. With a native integration, data scientists and data engineering teams no longer have to do the heavy lifting of writing code for ETL jobs, consuming inference APIs, storing output in a queryable source, and finally importing to QuickSight. For more information, see Visualizing Amazon SageMaker machine learning predictions with Amazon QuickSight. For customers who want to understand anomalies in their data better without setting up or managing Sagemaker, we continue to enhance anomaly detection in QuickSight. Anomaly detection runs against your data in a database, data warehouse, data lake, or in the QuickSight SPICE in-memory store, and alerts you to anomalous data points. For more information, see Setting Up ML-Powered Anomaly Detection for Outlier Analysis.

Business Intelligence (BI) with QuickSight

With a serverless architecture, QuickSight allows customers to get started with rich interactive BI dashboards in no time. Customers such as Capital One, Best Western, Rio Tinto, and the NFL have taken the stage at re:Invent previously to talk about how a serverless model has allowed a launch to tens of thousands of users without the typical infrastructure planning and monitoring aspects. Additionally, the completely web-based dashboard authoring experience in QuickSight means analysts don’t need to download any clients to create and publish dashboards. Administrators also don’t spend weeks of time and effort in software updates, because QuickSight is fully managed, with updates twice a month. Overall, this translates to an easy setup and rollout of QuickSight as a business intelligence (BI) solution for thousands of users.

Build Rich, Interactive Dashboards

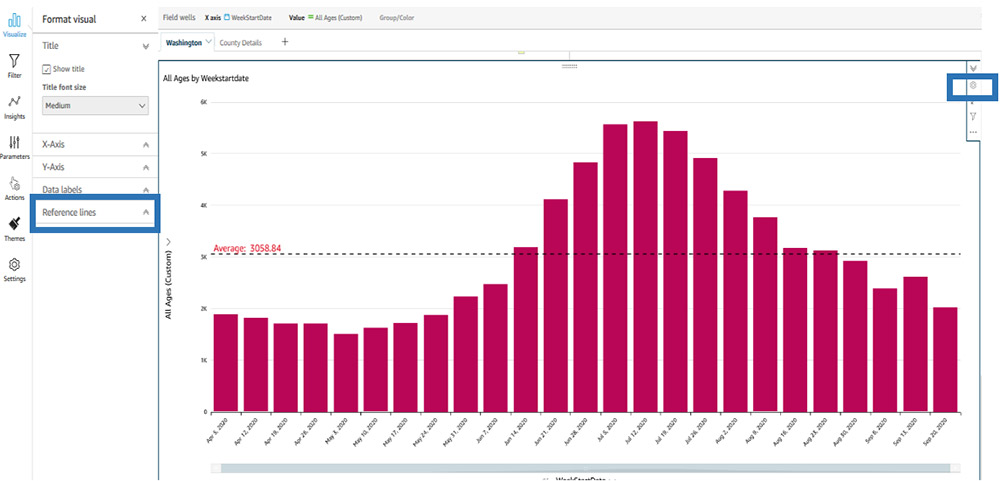
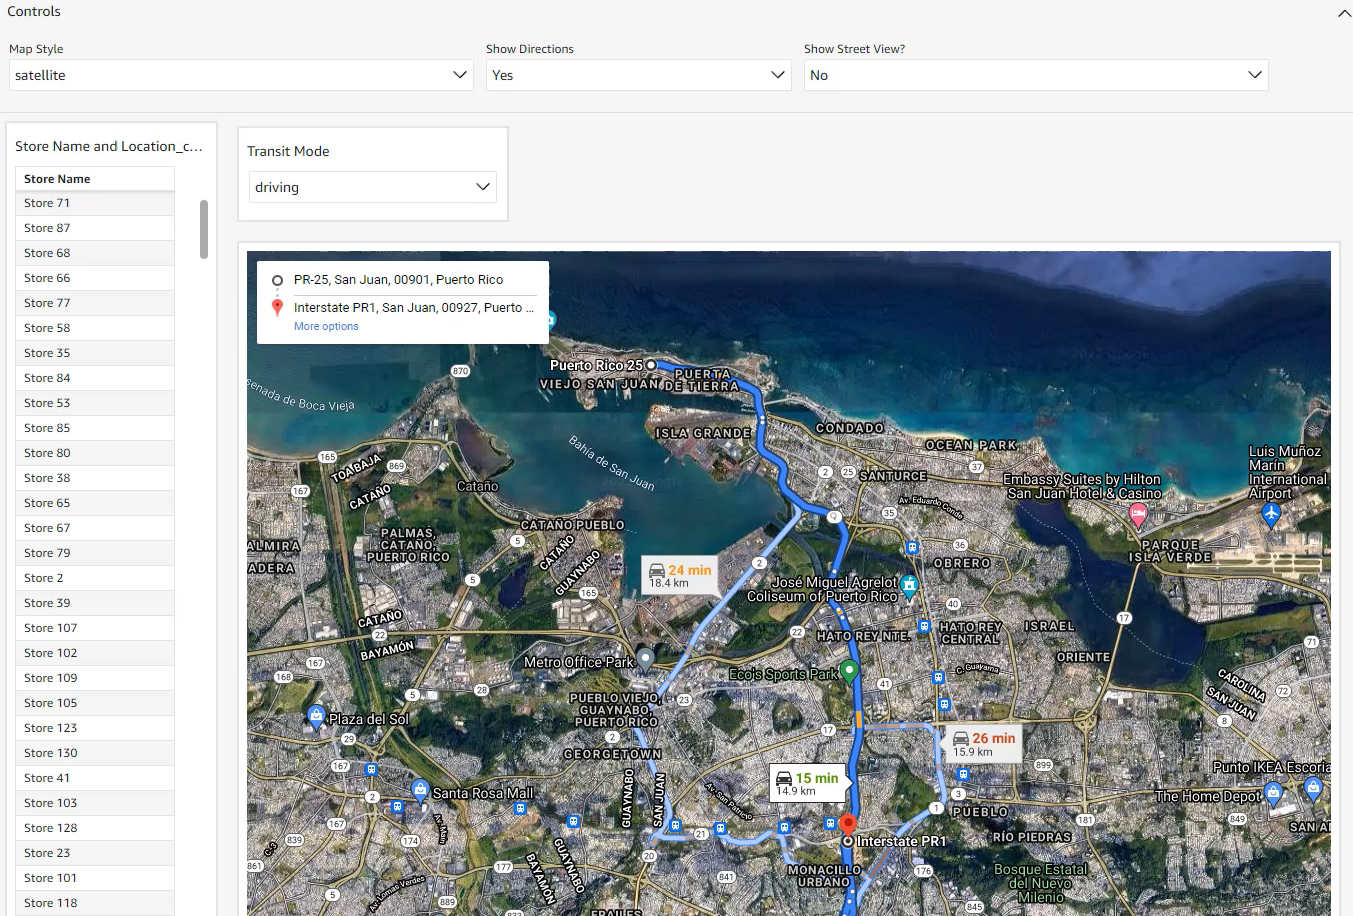
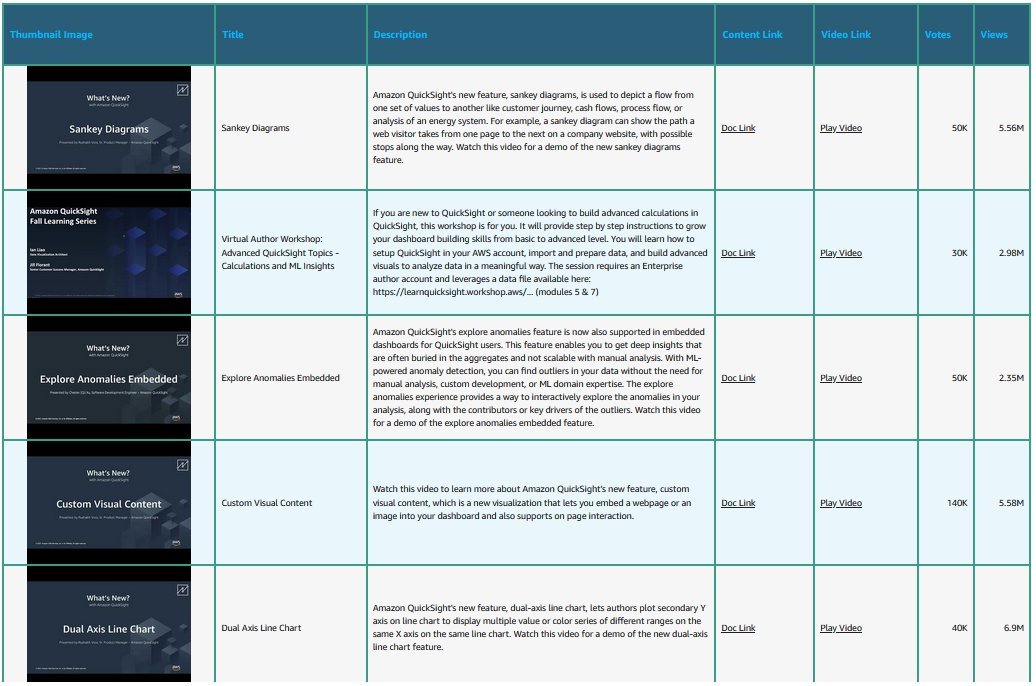
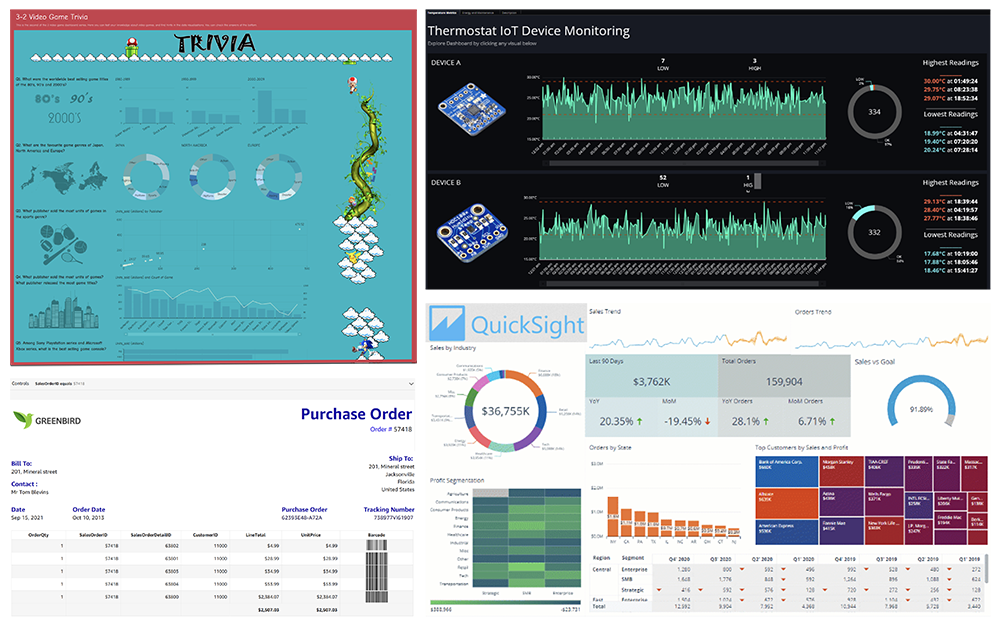
We introduced a significant number of enhancements around dashboards and the dashboard creation experience in 2020. We introduced six new chart types: filled (choropleth) map, histogram, funnel chart, stacked area chart, waterfall chart, and boxplot, bringing the total number of supported charts to 28. QuickSight now also supports reference lines, either based on a value from the chart itself or an external calculated field, which allow authors to convey additional information to the reader. QuickSight charts now also support custom sorting using a field not present in the visual, thereby performing custom ordering of fields based on business context. Through the narrative component available as part of ML-Insights, you can also add relevant text, images, and links into dashboard, allowing for rich visual layouts.

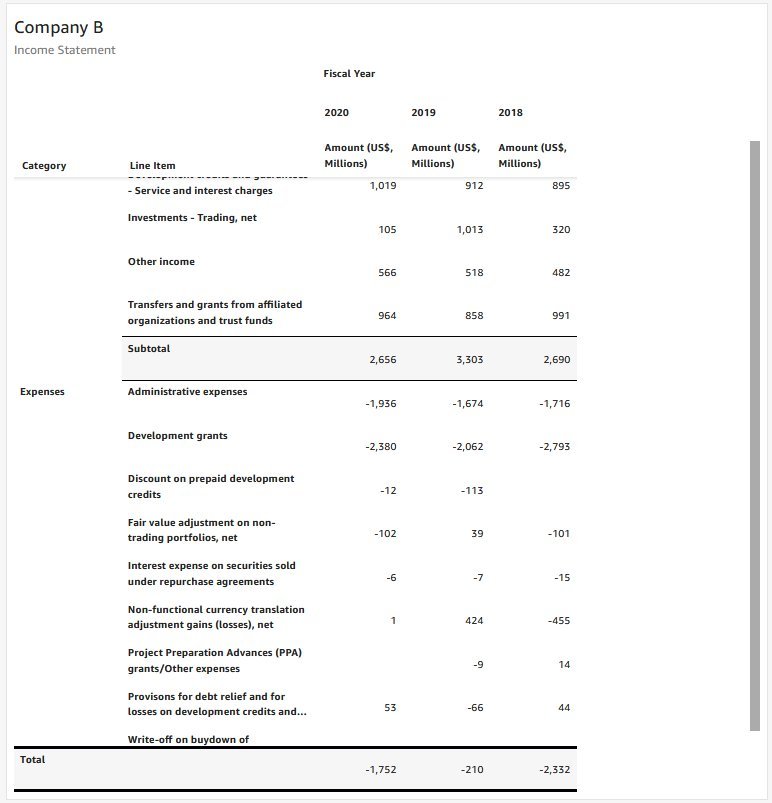
Tables and pivot tables are among the most popular visual types among business users, and we’ve introduced a number of enhancements to these, including text wrap for headers, text alignment for content and headers, customization of header and total text, representing null data, and more. You can also now export tables and pivot tables to Excel, in addition to the existing CSV option.

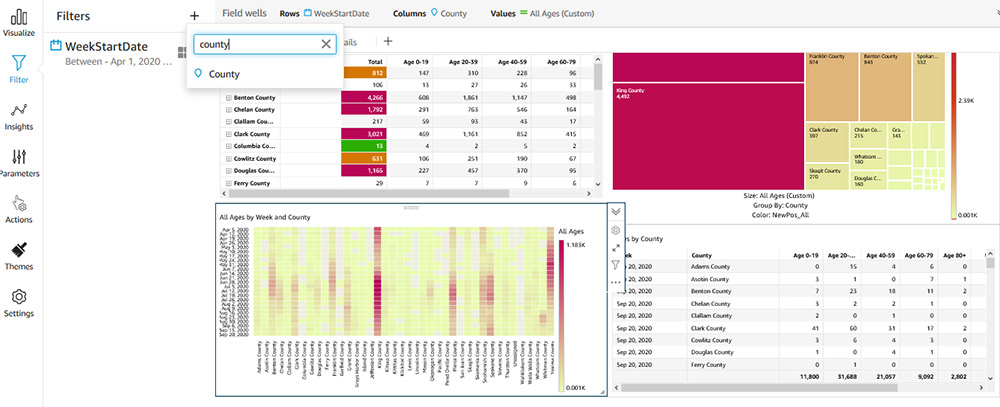
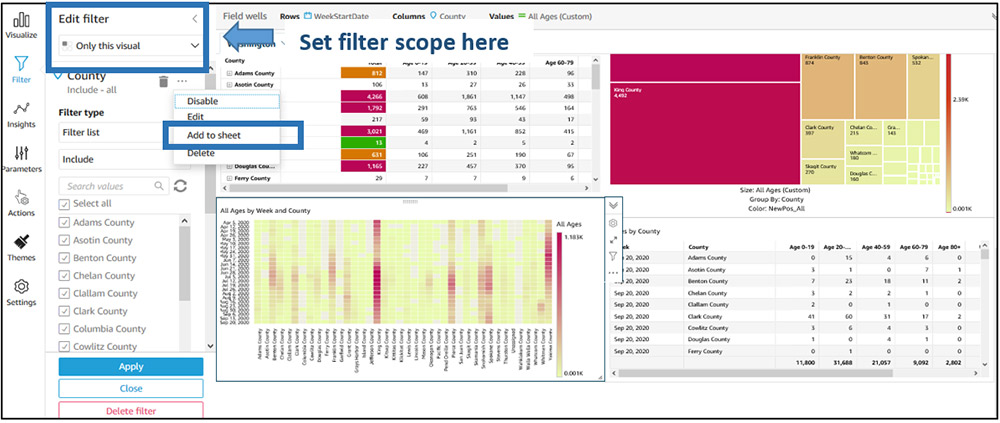
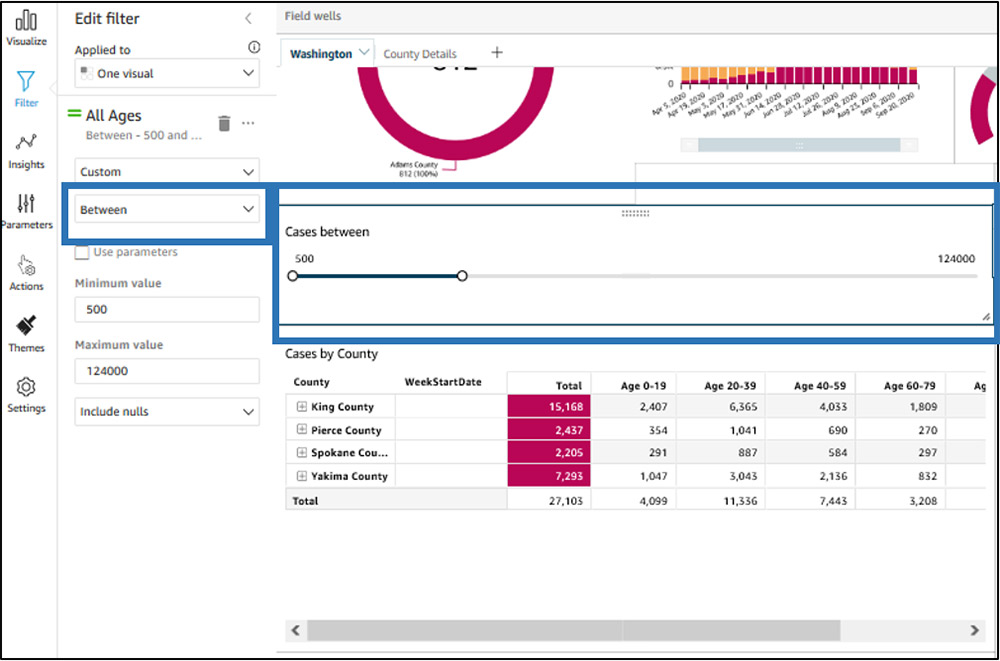
On the filtering front, we’ve added support for on-sheet filter controls. You can create these controls with a single click, and also scope them to work across multiple datasets used on the dashboard sheet. Available controls include drop-downs, date/time pickers, slider controls, date range controls, and relative data controls—allowing for a breadth of options for dashboards. You can set these controls to cascade so that one filters the other and only shows relevant values to the end-user.

We also followed up on filter actions launched last year to add the ability to cascade these interactive options for users. This means you can choose a state from a visual on a dashboard, which filters the entire dashboard by the state selected, and then drill down further based on the counties presented within the state coming from another visual. Lastly, we introduced dashboard persistence for readers, allowing them to pick up on dashboards where they had left them. This means that filter control and sheet selections are retained for users based on where they last left off.

Authors of dashboards continue to see new calculations available, with support added for:

  • Minimums and maximums for date fields
  • Modulo operations
  • First and last values of metrics and dimensional values
  • Discrete and continuous percentile

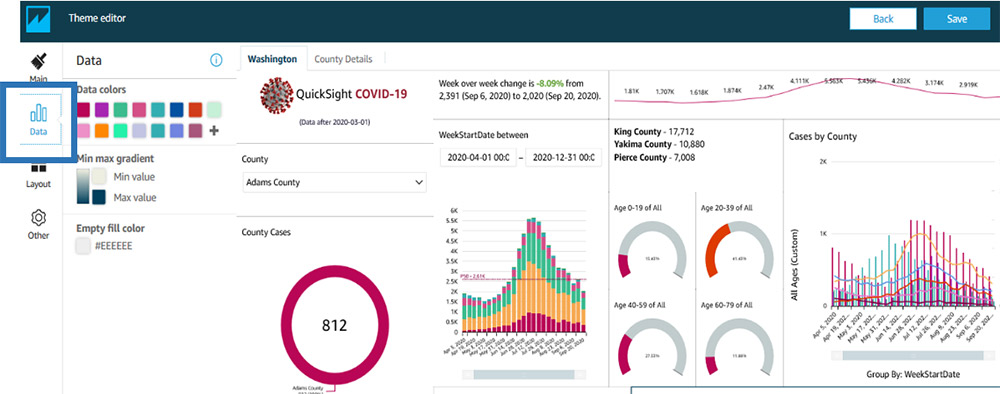
Themes for dashboards now also support a selection of fonts, allowing you to pick the font that aligns well with your design language and corporate standards.

Lastly, QuickSight dashboards now support an optimized scaling mode, which ensures that a dashboard is optimized for the most common screen size expected, yet scaled beautifully when on a projector or a larger screen, or emailed to end-users.

We also continue to invest in our mobile apps (iOS and Android), which allow you to access your dashboards on the go, and interact with filters, actions, drill downs, and more.


Scale your data with SPICE

One of the key benefits of choosing QuickSight for your BI needs is QuickSight’s SPICE in-memory data store, which provides fast, interactive access to data for both authors and readers, and automatically scales to meet high concurrency needs. Each dataset in SPICE can now be up to 250 million rows in size (or 500 GB), up from 100 million rows previously. SPICE data can be ingested from supported database or SaaS sources via an API or a scheduled, with email notifications available upon failures.

For relational data sources and Athena, QuickSight supports both SPICE and direct query options, giving you the choice depending on your use case and performance needs. Choosing SPICE with summarized sets of data allows you to reduce traffic on your backend data stores while also automatically scaling to peaks in usage (such as at the end of the month) without lifting a finger. At the same time, direct query is useful when data may change frequently, or you need access to historical data residing in a data warehouse for occasional analysis. Dashboards in QuickSight can support a combination of both SPICE and direct query datasets, with cross visual filters and actions allowing fluid interactions.

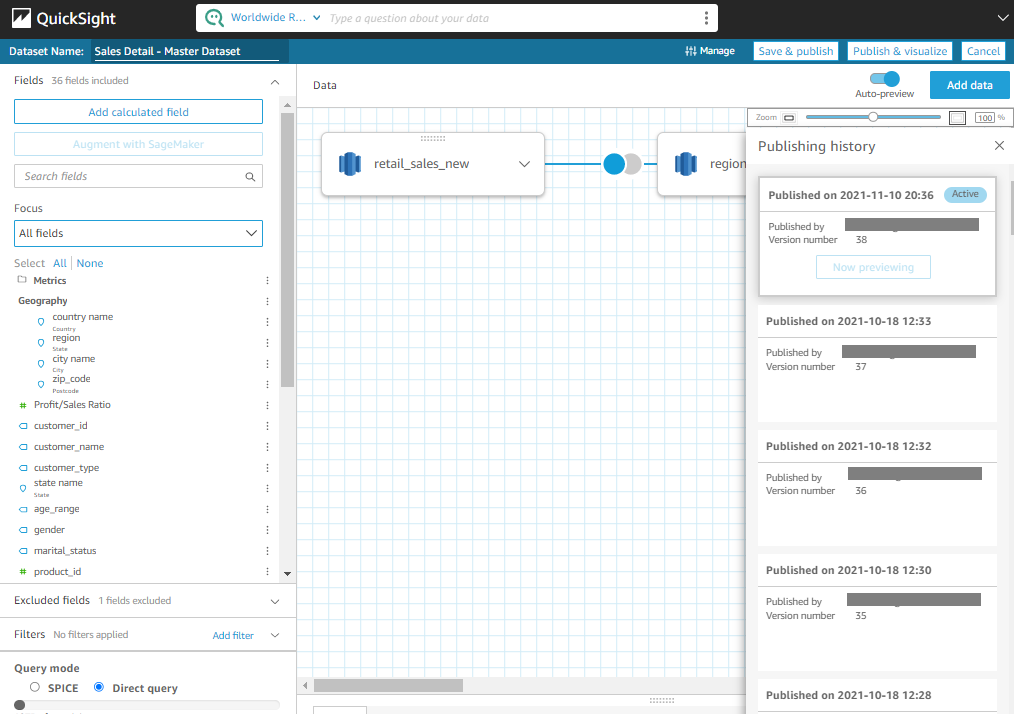
Authors and data admins in QuickSight can combine data across multiple data sources (e.g., flat file, Amazon Redshift, Snowflake, Amazon RDS) and bring the resultant data into SPICE for dashboarding and analysis. In 2020, we added support for joining datasets using custom SQL statements with tables from another data source, other custom SQL datasets, or flat files. For more information, see Joining Data.

Centralized governance, security, and administration

With many organizations moving operations almost completely remote, governance, security, and administration have been key areas of focus this year. Within QuickSight, all operations are logged to AWS CloudTrail, providing auditability, alerting, and traceability as users make changes and access data or assets in QuickSight. Unlike many BI options in the market, QuickSight doesn’t follow a disjoint client/server model, but instead offers centralized control over data, assets, and user capabilities. We launch two key features that further emphasize these: folders and user permissions.

Folders in QuickSight come in two types: personal folders that authors can use to organize content for themselves, or shared folders that admins can create and share with authors and readers (at the user or group level), with the ability to delegate permissions to authors. Shared folders allow strong permissions to be enforced across the organization and help control user access to data and sharing. User permissions customization allow admins to restrict user permissions to actions such as sharing assets, creating folders, or downloading data as CSV. The combination of CloudTrail logging, shared folders, and user-level permissions management allows admins to create strong governance around a QuickSight account.

A key element in a governed analytics setup is enforcing security controls and common definitions in datasets used across the organization. We introduced column-level security as a native option in QuickSight, easily configurable from the UI or APIs. This feature compliments the existing row-level security feature. Together, they give authors control over who can access what data within their visualizations. QuickSight now also allows data owners to create datasets that provide pre-built calculations, column-level metadata, and other customizations that make it easier for authors consuming the dataset to understand the data and build on it.

QuickSight is the only BI tool to provide native AWS Identity and Access Management (IAM) permissions-based control over Amazon Simple Storage Service (Amazon S3), Amazon Athena, and other AWS native data sources. QuickSight has AWS PrivateLink support for secure data connectivity to databases in your VPC, data warehouses such as Amazon Redshift or Snowflake, or big data options such as Presto. QuickSight now also supports AWS Lake Formation permissions for data accessed via Athena and has added native connectivity to Amazon Timestream and Amazon Elasticsearch Service (Amazon ES). QuickSight also supports Oracle databases, either Amazon Relational Database Service (Amazon RDS) or running on Amazon Elastic Compute Cloud (Amazon EC2) or on premises.

On the account administration and management front, we launched APIs (including analysis and theme APIs) that enable admins to create a centralized view of assets within the account, and offer customizations that allow ISVs to provide a more integrated experience for embedded analytics users, including a default organization-specific theme for authors.

Admins will also appreciated QuickSight’s support for a variety of authentication options, including Active Directory (using AWS AD Connector acting as a proxy to the on-premises AD) or federated IAM users via an identity provider such as Azure AD, Okta, Ping, or others. We refined the end-user experience for the latter by introducing options for the user to authenticate from the QuickSight login page (SP-initiated login), as opposed to navigating to the identity provider every time. This enables a business user-friendly experience. Customers wanting to turn off non-federated users within accounts can also do so by logging a support request.

Finally, we continue to expand to make QuickSight accessible to more users and use cases, with expansion to India (Mumbai) and US GovCloud (West) Regions, as well as support for five new European languages: Danish, Dutch, Finnish, Norwegian, and Swedish, making us available in 12 AWS Regions and 15 languages.

QuickSight learning resources

New to QuickSight? Use our 2-month free trial (four authors free for 2 months) to take a quick test drive. You will be asked to sign up for AWS if you don’t have an AWS account. If you already have an account from your company or organization, navigate to the AWS Management Console and choose QuickSight to get started. To learn more about embedding QuickSight, use our embedded developer portal and check out our API documentation.

If you’re an existing QuickSight user, or have used QuickSight in the past, check out our YouTube channel, or dive into one of the following workshops to learn more about your area of interest:

  • Build Advanced Analytics and Dashboards with Amazon QuickSight Part 1, Part 2 – If you’re new to QuickSight or looking to build advanced calculations in QuickSight, this workshop is for you. It provides step-by-step instructions to grow your dashboard building skills from basic to advanced level. You learn how to set up QuickSight in your AWS account, import and prepare data, and build advanced visuals to analyze data in a meaningful way.
  • Embed Amazon QuickSight Dashboards – In this virtual, instructor-led workshop, our Global QuickSight Solutions Architect walks you through setting up a reusable embedding framework. We also include a cloud formation template to quickly spin up this framework.
  • Administration on QuickSight – This virtual, instructor-led workshop is designed with a real-world ISV use case in mind. The ISV pipeline for data curation, data analysis, and dashboard publishing is addressed with distinct end-user personas. We also discuss how development, test, and production environments can be managed and operationalized by admins in a single or multiple QuickSight accounts.
  • Administration Level-Up – This virtual, instructor-led workshop is designed with a real-world ISV use case in mind. Learning objectives include automating dashboard deployment, customizing access to the QuickSight console, configuring for team collaboration, and implementing multi-tenancy and client user segregation.
  • Cost Intelligence Dashboard Setup – Existing AWS admins can check out this video of how to use QuickSight to quickly set up dashboards of their AWS Cost and Usage Report data and provide access to business users within the organization.

Looking ahead

To see the full list of 2020 launches, see What’s New in Amazon QuickSight or subscribe to the Amazon QuickSight YouTube channel for the latest training and feature walkthroughs. You can also check out the repository of QuickSight blogs in the AWS Big Data Blog.

We have a packed roadmap for 2021, and continue to focus on enabling you with insights from all your data that you can share with your users, while not having to worry about operations and servers. Thank you for your support.

We wish you all the very best in the New Year!


About the Authors

Jose Kunnackal John is a principal product manager for Amazon QuickSight.


Sahitya Pandiri is a technical program manager with Amazon Web Services.


New in Amazon QuickSight – session capacity pricing for large scale deployments, embedding without user provisioning, and developer portal for embedded analytics

Post Syndicated from Jose Kunnackal original https://aws.amazon.com/blogs/big-data/new-in-amazon-quicksight-embedding-without-user-provisioning-session-capacity-pricing-and-embedded-developer-portal/

Amazon QuickSight Enterprise edition now offers a new, session capacity-based pricing model starting at $250/month, with annual commitment options that provide scalable pricing for embedded analytics and BI rollouts to 100s of 1000s of users. QuickSight now also supports embedding dashboards in apps, websites, and wikis without the need to provision and manage users (readers) in QuickSight, which utilizes this new pricing model. Lastly, we also have a new developer portal for embedded analytics that allows you to learn more about the different embedded solutions available with QuickSight and experience it first-hand.

Session Capacity Pricing

Amazon QuickSight’s new session capacity-based pricing model provides scalable pricing for large scale deployments. Session capacity pricing allows Developers, Independent Software Vendors (ISVs) and Enterprises to benefit from lower per-session rates as they roll out embedded analytics and BI to 100s of 1000s of users. In such scenarios, average session consumption per user is usually low (<10 sessions/month) but aggregate session usage across users within the account is high. With session capacity pricing, sessions are simply charged in 30-minute blocks of usage starting with first access. Session capacity pricing is also required for embedding without user management, where per-user pricing is not meaningful. Unlike traditional options for capacity pricing which require a server with annual commitments, QuickSight’s session capacity pricing allows you to get started easily with a $250/month starter option. QuickSight’s session capacities do not slow down with increased user concurrency or higher analytical complexity of dashboards (both common in a server-based model), but instead automatically scale to ensure a consistent, fast, end-user experience. After starting with the monthly option, you can move to one of QuickSight’s annual session capacity tiers as your sessions usage increases – ensuring that costs scale with growing usage. Any usage beyond the committed levels (monthly or annual) is charged at the overage session rates indicated, with no manual intervention for scaling needed – no more scrambling to add servers as you have bursts in usage or just greater success with your application/website. Annual session capacities are billed for monthly usage of sessions, with consumption of all committed sessions expected by end of the period. Annual session capacities allow sessions to be consumed across the year, providing flexibility in ramping up on production traffic, balancing session needs across busy/lean periods of the year (e.g., first/last week of the month are busy, holidays may be slow or busy depending on the nature of the business). For more details on the new pricing options, visit the QuickSight pricing page.

Embedding without user provisioning

Before this launch, Amazon QuickSight provided embedding dashboards in apps and portals where each end-user could be identified and provisioned in QuickSight, and charged using QuickSight’s per-user pricing model. This works well for situations where each end user can be uniquely identified, and often has permissions associated with their data access levels. The NFL chose QuickSight to embed dashboards in their next-gen stats portal and share insights with clubs, broadcasters and editorial teams. 1000s of customers have since chosen to launch embedded dashboards in QuickSight for both their internal and external end-users, including Blackboard, Comcast, Panasonic Avionics, EHE Health. Customers can scale from 10s of users to 100s of 1000s without any server provisioning or management and also benefit from being able to utilize embedded QuickSight authoring capabilities to enable self-service dashboard creation.

With today’s launch, QuickSight will now also enable use cases with dashboards for 100s of 1000s of readers, where it is not possible to provision and manage users (or is highly inconvenient to do so).

Examples of these situations include embedded dashboards for sharing public statistics within a city/county, dashboards of company-wide statistics available to all users to be embedded on an internal corporate portal, or embedded dashboards with the same data intended for 10s or 1000s of users per customer, department or job location/site within an app.

Let’s take a look at a couple of examples and then how to embed these dashboards. First, a dashboard that shows a live stream of the three main stock indices (S&P 500, DOW Jones, and NASDAQ) that uses QuickSight’s newly launched connector to Amazon Timestream to provide a real-time view of the market index in US Central Time.

Second, a dashboard showing industries and count of firms in those industries using a choropleth map at the state level with the ability to drill down to county-level data.

Both dashboards are setup so that they can be accessed without any user restrictions, and we don’t have to setup users to roll this out. You can see these dashboards accessible for anyone here. To try this out, you can use the AWS Command Line Interface (AWS CLI); note that the AWS CLI used here is simply to illustrate this process, and for actual integration into a website/app you have to use the AWS SDK to obtain an embeddable URL for every new visit to the page.

4 steps to embed a dashboard

  1. Configure an AWS Identity and Access Management (IAM) role for your application to use for embedding
    arn:aws:iam::xxxxxxxxxxxx:role/YourApplicationRole

  2. Attach the following policy to the role so the role can run the GetDashboardEmbedURL API for anonymous identity type:
    {
       "Version":"2012-10-17",
       "Statement":[
          {
             "Effect":"Allow",
             "Action":[
                "quicksight:GetDashboardEmbedUrl",
                "quickSight:GetAnonymousUserEmbedUrl"
             ],
             "Resource":[
                "replace with ARN for dashboard1",
                "replace with ARN for dashboard2",
                "replace with ARN for dashboard3"
             ]
          }
       ]
    }

  3. Run the GetDashboardEmbedURL API with IdentityType set to ANONYMOUS. This returns a response with the EmbedURL:
    INPUT
    aws quicksight get-dashboard-embed-url \
        --region us-west-2 \
        --namespace default \
        --dashboard-id c6e91d20-0909-4836-b87f-e4c115a88b65 \
        --identity-type ANONYMOUS \
        --aws-account-id 123456789012
        
    RESPONSE
    {
        "Status": 200,
        "EmbedUrl": "https://us-west-2.quicksight.aws.amazon.com/embed/bc973ae439ce45b49e011c9fc8c855ea/dashboards/c6e91d20-0909-4836-b87f-e4c115a88b65?code=AYABeJcLJ0WqjqtWBi0sdFZ2GP8AAAABAAdhd3Mta21zAEthcm46YXdzOmttczp1cy13ZXN0LTI6ODQ1MzU0MDA0MzQ0OmtleS85ZjYzYzZlOS0xMzI3LTQxOGYtODhmZi1kM2Y3ODExMzI5MmIAuAECAQB421ynKsVxdYWD7qmNX3Zzbra88wGZIZL-RXp78eF_lpIBMX2cuRvnCU-OpFLUps57PQAAAH4wfAYJKoZIhvcNAQcGoG8wbQIBADBoBgkqhkiG9w0BBwEwHgYJYIZIAWUDBAEuMBEEDOfOUSMMuEepqj8bzAIBEIA77tMfykw7WnJT__2sRSInn0gymHK1_vXmBAWAlyG2mwcNsD-HGI3xNNUoaSEUdvFQ6c0XuFQAgLz8ufICAAAAAAwAABAAAAAAAAAAAAAAAAAAHkJ674fL1usbIVG0oIYfCv____8AAAABAAAAAAAAAAAAAAABAAAAm3wfjZv5rICOROeYqIPsu6jFmWxU6fBEnSHTBkaw4ZPLnIGr3Cr1HU0D7DJM90dmCQ6t9kTVOy2XdgwNm606yqoEhSjwq4OWU-_rjGilwbKpes_5uKZR0IZNh2SMqgUPuu4Q1z884FhHQmX3yRI_RxWEyTnjR2sajl1m6OQCgvRJ3kEeh3cB0wWSsSdcUeZt-iNxYRbckKa3Eb6viPXHYRs-Q_skcSTsjfJ6GQ%3D%3D&identityprovider=quicksight&isauthcode=true",
        "RequestId": "1c82321c-6934-45b0-83f4-a8ce2f641067"
    }

You can embed the returned URL in the IFRAME code of your application. Make sure your application is added to the allow list in QuickSight. This is a single-use URL and has to be generated dynamically by invoking get-dashboard-embed-url from the backend compute layer upon each load of the parent page.

  1. Embed the dashboard in your application with the following HTML code:
    <head>
        <title>Basic Embed</title>
        <!-- You can download the latest QuickSight embedding SDK version from https://www.npmjs.com/package/amazon-quicksight-embedding-sdk -->
        <!-- Or you can do "npm install amazon-quicksight-embedding-sdk", if you use npm for javascript dependencies -->
        <script src="./quicksight-embedding-js-sdk.min.js"></script>
        <script type="text/javascript">
            var dashboard;
    
            function embedDashboard() {
                var containerDiv = document.getElementById("embeddingContainer");
                var options = {
                    // replace this dummy url with the one generated via embedding API
                    url: "https://us-east-1.quicksight.aws.amazon.com/sn/dashboards/dashboardId?isauthcode=true&identityprovider=quicksight&code=authcode",  
                    container: containerDiv,
                    scrolling: "no",
                    height: "700px",
     
                    footerPaddingEnabled: true
                };
                dashboard = QuickSightEmbedding.embedDashboard(options);
            }
        </script>
    </head>
    
    <body onload="embedDashboard()">
        <div id="embeddingContainer"></div>
    </body>
    
    </html> 

If you use NPM to manage you front end dependencies, run npm install amazon-quicksight-embedding-sdk. And then you can add use the following code to embed the URL in your application:

import { embedDashboard } from 'amazon-quicksight-embedding-sdk';

var options = {
    url: "https://us-west-2.quicksight.aws.amazon.com/embed/bc973ae439ce45b49e011c9fc8c855ea/dashboards/c6e91d20-0909-4836-b87f-e4c115a88b65?code=AYABeJcLJ0WqjqtWBi0sdFZ2GP8AAAABAAdhd3Mta21zAEthcm46YXdzOmttczp1cy13ZXN0LTI6ODQ1MzU0MDA0MzQ0OmtleS85ZjYzYzZlOS0xMzI3LTQxOGYtODhmZi1kM2Y3ODExMzI5MmIAuAECAQB421ynKsVxdYWD7qmNX3Zzbra88wGZIZL-RXp78eF_lpIBMX2cuRvnCU-OpFLUps57PQAAAH4wfAYJKoZIhvcNAQcGoG8wbQIBADBoBgkqhkiG9w0BBwEwHgYJYIZIAWUDBAEuMBEEDOfOUSMMuEepqj8bzAIBEIA77tMfykw7WnJT__2sRSInn0gymHK1_vXmBAWAlyG2mwcNsD-HGI3xNNUoaSEUdvFQ6c0XuFQAgLz8ufICAAAAAAwAABAAAAAAAAAAAAAAAAAAHkJ674fL1usbIVG0oIYfCv____8AAAABAAAAAAAAAAAAAAABAAAAm3wfjZv5rICOROeYqIPsu6jFmWxU6fBEnSHTBkaw4ZPLnIGr3Cr1HU0D7DJM90dmCQ6t9kTVOy2XdgwNm606yqoEhSjwq4OWU-_rjGilwbKpes_5uKZR0IZNh2SMqgUPuu4Q1z884FhHQmX3yRI_RxWEyTnjR2sajl1m6OQCgvRJ3kEeh3cB0wWSsSdcUeZt-iNxYRbckKa3Eb6viPXHYRs-Q_skcSTsjfJ6GQ%3D%3D&identityprovider=quicksight&isauthcode=true",
    container: document.getElementById("embeddingContainer"),
    parameters: {
        country: "United States",
        states: [
            "California",
            "Washington"
        ]
    },
    scrolling: "no",
    height: "700px",
    width: "1000px",
    locale: "en-US",
    footerPaddingEnabled: true
};
const dashboardSession = embedDashboard(options);

If you want to embed multiple dashboards and switch between them, you can pass more dashboard IDs by using the additional-dashboard-ids option while generating the URL. This generates the URL with authorization for all specified dashboard IDs and launches the dashboard specified under the dashboard-id option. See the following code:

INPUT
aws quicksight get-dashboard-embed-url \
    --region us-west-2 \
    --namespace default \
    --dashboard-id c6e91d20-0909-4836-b87f-e4c115a88b65 \
    --identity-type ANONYMOUS \
    --aws-account-id 123456789012
    --additional-dashboard-ids dashboardid1 dashboardid2
    
RESPONSE
{
    "Status": 200,
    "EmbedUrl": "https://us-west-2.quicksight.aws.amazon.com/embed/bc973ae439ce45b49e011c9fc8c855ea/dashboards/c6e91d20-0909-4836-b87f-e4c115a88b65?code=AYABeJcLJ0WqjqtWBi0sdFZ2GP8AAAABAAdhd3Mta21zAEthcm46YXdzOmttczp1cy13ZXN0LTI6ODQ1MzU0MDA0MzQ0OmtleS85ZjYzYzZlOS0xMzI3LTQxOGYtODhmZi1kM2Y3ODExMzI5MmIAuAECAQB421ynKsVxdYWD7qmNX3Zzbra88wGZIZL-RXp78eF_lpIBMX2cuRvnCU-OpFLUps57PQAAAH4wfAYJKoZIhvcNAQcGoG8wbQIBADBoBgkqhkiG9w0BBwEwHgYJYIZIAWUDBAEuMBEEDOfOUSMMuEepqj8bzAIBEIA77tMfykw7WnJT__2sRSInn0gymHK1_vXmBAWAlyG2mwcNsD-HGI3xNNUoaSEUdvFQ6c0XuFQAgLz8ufICAAAAAAwAABAAAAAAAAAAAAAAAAAAHkJ674fL1usbIVG0oIYfCv____8AAAABAAAAAAAAAAAAAAABAAAAm3wfjZv5rICOROeYqIPsu6jFmWxU6fBEnSHTBkaw4ZPLnIGr3Cr1HU0D7DJM90dmCQ6t9kTVOy2XdgwNm606yqoEhSjwq4OWU-_rjGilwbKpes_5uKZR0IZNh2SMqgUPuu4Q1z884FhHQmX3yRI_RxWEyTnjR2sajl1m6OQCgvRJ3kEeh3cB0wWSsSdcUeZt-iNxYRbckKa3Eb6viPXHYRs-Q_skcSTsjfJ6GQ%3D%3D&identityprovider=quicksight&isauthcode=true",
    "RequestId": "1c82321c-6934-45b0-83f4-a8ce2f641067"
}

In the preceding code, we assign our primary dashboard’s ID to the --dashboard-id option, and the other dashboard IDs to the --additional-dashboard-ids option as a space-separated value. You can pass up to 20 dashboard IDs in this option.

The EmbedURL value in the response is the URL for the primary dashboard. You can embed this dashboard in your app, wiki, or website and use the JavaScript SDK to switch between dashboards. To switch to another dashboard without having to generate a fresh embed URL, invoke the navigateToDashboard function (available in our JavaScript library) with any of the dashboard IDs that were initially included in the get-dashboard-embed-url call. See the following example code:

var options = 
     {
      dashboardId: "dashboardid1", 
      parameters: 
       {
         country: 
          [
            "United States"
          ]
     }
    };
dashboard.navigateToDashboard(options);

For more information about the JavaScript SDK, see the GitHub repo.

Embedding without users is now generally available to all Amazon QuickSight Enterprise Edition users and requires session capacity pricing. 

To opt-in for session capacity pricing and embed dashboards without user provisioning, or simply enable discounted QuickSight usage for large scale deployments, you can opt-into session capacity pricing starting with the $250/month option via the “Manage QuickSight” > “Your subscriptions” page accessible to QuickSight administrators.

Embedded Developer Portal

We have a new embedded developer portal at https://developer.quicksight.aws that allows you to quickly interact with three key embedded scenarios – 1) embedded dashboards accessible to anyone accessing a website or portal (no user provisioning required), 2) embedded dashboards accessible to only authenticated users, and 3) embedded dashboard authoring for power users of apps.

The interactive dashboards, code snippets and setup instructions allow you to learn more about the rich capabilities of QuickSight embedding, easily get started with embedding QuickSight.

Summary

With new embedding capability, QuickSight offers a modern, serverless approach to deploying dashboards and visualizations into websites, apps and corporate portals in hours, without any user provisioning or management needed to scale to 100s of 1000s of users. Unlike traditional server-based models, QuickSight’s session capacity model allows you to start at a low $250/month, month-to-month price point. As usage grows, the available annual commitment models offer scalable pricing by reducing the per-session cost – enabling both ISVs and Enterprises to roll out embedded QuickSight dashboards at large scale, whether for internal or external users. Finally, with QuickSight’s new developer portal, you have instant access to samples of interactive embedded QuickSight dashboards as well as steps to integrating various embedded capabilities into your own websites, apps and portals.


About the Authors

Jose Kunnackal John is Sr. Manager for Amazon QuickSight, AWS’ cloud-native, fully managed BI service. Jose started his career with Motorola, writing software for telecom and first responder systems. Later he was Director of Engineering at Trilibis Mobile, where he built a SaaS mobile web platform using AWS services. Jose is excited by the potential of cloud technologies and looks forward to helping customers with their transition to the cloud.


Kareem Syed-Mohammed is a Product Manager at Amazon QuickSight. He focuses on embedded analytics, APIs, and developer experience. Prior to QuickSight he has been with AWS Marketplace and Amazon retail as a PM. Kareem started his as a career developer and then PM for call center technologies, Local Expert and Ads for Expedia. He worked as a consultant with McKinsey and Company for a short while.


Arun Santhosh is a Specialized World Wide Solution Architect for Amazon QuickSight. Arun started his career at IBM as a developer and progressed on to be an Application Architect. Later, he worked as a Technical Architect at Cognizant. Business Intelligence has been his core focus in these prior roles as well

Amazon QuickSight adds support for on-sheet filter controls

Post Syndicated from Jose Kunnackal original https://aws.amazon.com/blogs/big-data/amazon-quicksight-adds-support-for-on-sheet-filter-controls/

Amazon QuickSight now supports easy and intuitive filter controls that you can place beside visuals on dashboards, allowing readers to quickly slice and dice data in the context of its visual representation. You can create these filter controls from existing or new filters with a single click, and configure them to support different operations, such as filtering specific dates, relative dates, or date rages; setting upper and lower thresholds for numeric values; adding drop-downs with single-select or multi-select options; and more.

In this post, we review how these filtering improvements, together with themes and dashboard layout options, let you create stunning, interactive dashboards that you can share with tens of thousands of users, whether in QuickSight or using embedded dashboards within apps, without any server provisioning or management needed, and paying for what you use. For this use case, we use the COVID-19 public dataset for Washington state. The following screenshot shows the dashboard with on-sheet filters added.

Using the new filter controls

Let us take a deeper look at the new filter controls, which are now placed across the sheet between visuals. Creating these controls is easy— simply add a new filter on the required dimension or metric, set the scope to either filter the entire dashboard or specific visuals within, and add it to the sheet. QuickSight now automatically maps filters across multiple datasets used within a sheet, so actions on the filter can apply to every visual on the sheet if so desired. For example, to add a new filter on the county field, create a filter on the field using the left hand navigation pane when authoring the dashboard.

Set the scope of the filter as desired, and choose Add to sheet to add a control to the sheet.

QuickSight then creates a moveable control that you can place anywhere on the sheet. QuickSight chooses the control type depending on the type of filter created. For example, when creating filters on dimensional fields, QuickSight adds a multi-select drop-down control by default. You can change the control type by choosing the Settings icon in the control’s visual menu.

In the Edit control section, you can make further updates to your control.

You can also place these controls in the control drawer on top of the sheet by choosing Pin to top.

On-sheet controls

The on-sheet controls currently supported include those previously supported with QuickSight parameter controls (single-select drop-downs, multi-select drop-downs, date and time picker, single-sided slider, single-line text box). QuickSight now supports new controls for date and time range selection, relative date selection, and numeric range selection. You can move existing parameter controls on the sheet and place them beside the new filter controls.

Let’s take a quick look at these new controls. You can use date and time range selection controls when you have a BETWEEN date range filter on your dashboard.

Relative date controls provide readers with powerful functionality to apply date filters at yearly, quarterly, monthly, weekly, daily, hourly, and minute levels. For example, you can choose to filter by current year, previous year, year to date, and last or next N years. These controls provide a great way to ensure your users always see the latest data whether viewing data in dashboards or email reports.

With a two-sided slider control, you can set lower and upper bounds on metric filters. To add a two-sided filter, you simply add the numeric BETWEEN filter to the sheet.

Additional dashboard features

In this section, we look at some other aspects of the dashboard.

Customizing your dashboard layout and theme

This dashboard uses a different set of colors and highlights than the regular palette in QuickSight. We achieve this by using a custom theme, which lets you pick a color palette for data values, background and foreground colors, fonts, and more. You can also choose to remove borders around the visual, show or remove spacing between visuals, and add margins around the sheet.

To create themes for your dashboards, go to the Themes from the left hand menu when authoring the dashboard. You can choose one of starter themes available in QuickSight and choose Save as to customize your own and use the theme editor to visualize changes before saving the theme.

On the Main page of the theme editor, you can customize your background color, foreground color, and font.

On the Data page, you can customize your data colors.

For more information about QuickSight themes, see Evolve your analytics with Amazon QuickSight’s new APIs and theming capabilities.

Images and rich text

You can use the QuickSight insight editor (available in Enterprise Edition) to add rich text and images to dashboards. To add an image, go to the insight editor, choose the Image icon, and provide the hosted location of the image. You can also hyperlink this image to any URL.

Reference lines

The bar chart within the dashboard also includes a reference line, which you can easily add to a QuickSight line or bar visual. You can configure a reference line from the visual menu.

Conditional formatting

Tables in the dashboard use conditional formatting, which you can add from the table menu.

Scaling

QuickSight dashboards default to auto-fit mode, so they are responsive based on screen size. Instead, you can choose to pick a specific screen resolution to optimize for, based on the devices your audience most commonly uses to view the dashboard. To adjust the scaling mode, choose Settings in the navigation pane while in dashboard authoring (analysis) mode.

For this post, our dashboard was built for a 1366px screen, and scales that view to a larger or smaller screen to ensure that all users see the same content (mobile devices continue to fall back to a single column, mobile-specific layout to ensure usability). Opting for the optimized mode also makes sure that your email reports look exactly like the dashboard that your viewers interact with.

Conclusion

With denser dashboards, custom themes, and new on-sheet filter controls in QuickSight, you can provide richer dashboards for your readers. Visit our user guide to learn more about on-sheet filter controls, themes, dashboard scaling options and more. For more information about authoring dashboards in QuickSight, watch Part 1 and Part 2 of our two-part interactive workshop.


About the authors

Jose Kunnackal John is a principal product manager for Amazon QuickSight.


Sahitya Pandiri is a technical program manager with Amazon Web Services. Sahitya has been in product/program management for 6 years now, and has built multiple products in the retail, healthcare, and analytics space.