Post Syndicated from Liz Snyder original https://aws.amazon.com/blogs/big-data/understanding-the-jvmmemorypressure-metric-changes-in-amazon-opensearch-service/
Amazon OpenSearch Service is a managed service that makes it easy to secure, deploy, and operate OpenSearch and legacy Elasticsearch clusters at scale.
In the latest service software release of Amazon OpenSearch Service, we’ve changed the behavior of the JVMMemoryPressure metric. This metric now reports the overall heap usage, including young and old pools, for all domains that use the G1GC garbage collector. If you’re using Graviton-based data nodes (C6, R6, and M6 instances), or if you enabled Auto-Tune and it has switched your garbage collection algorithm to G1GC, this change will improve your ability to detect and respond to problems with OpenSearch’s Java heap.
Basics of Java garbage collection
Objects in Java are allocated in a heap memory, occupying half of the instance’s RAM up to approximately 32 GB. As your application runs, it creates and destroys objects in the heap, leaving the heap fragmented and making it harder to allocate new objects. Java’s garbage collection algorithm periodically goes through the heap and reclaims the memory of any unused objects. It also compacts the heap when necessary to provide more contiguous free space.
The heap is allocated into smaller memory pools:
Young generation – The young generation memory pool is where new objects are allocated. The young generation is further divided into an Eden space, where all new objects start, and two survivor spaces (S0 and S1), where objects are moved from Eden after surviving one garbage collection cycle. When the young generation fills up, Java performs a minor garbage collection to clean up unmarked objects. Objects that remain in the young generation age until they eventually move to the old generation.
Old generation – The old generation memory pool stores long-lived objects. When objects reach a certain age after multiple garbage collection iterations in the young generation, they are then moved to the old generation.
Permanent generation – The permanent generation contains metadata required by the JVM to describe the classes and methods used in the application at runtime. It is not populated when the old generation’s objects reach a certain age.

Java processes can employ different garbage collection algorithms, selected by command-line option.
- Concurrent Mark Sweep (CMS) – The different pools are segregated in memory. Stop-the-world pauses, and heap compaction are regular occurrences. The young generation pool is small. All non-Graviton data nodes use CMS.
- G1 Garbage Collection (G1GC) – All heap memory is a single block, with different areas of memory (regions) allocated to the different pools. The pools are interleaved in physical memory. Stop-the-world pauses and heap compaction are infrequent. The young generation pool is larger. All Graviton data nodes use G1GC. Amazon OpenSearch Service’s Auto-Tune feature can choose G1GC for non-Graviton data nodes.
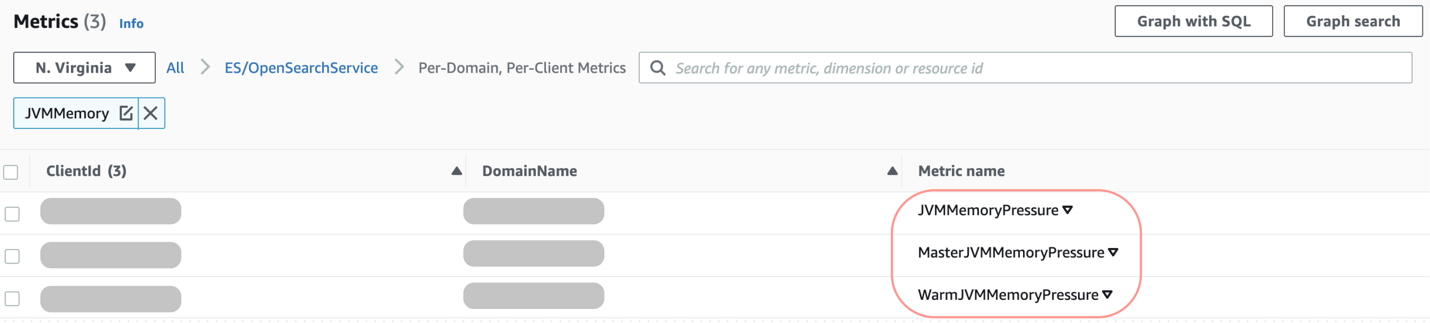
You can use the CloudWatch console to retrieve statistics about those data points as an ordered set of time-series data, known as metrics. Amazon OpenSearch Service currently publishes three metrics related to JVM memory pressure to CloudWatch:
- JVMMemoryPressure – The maximum percentage of the Java heap used for all data nodes in the cluster.
- MasterJVMMemoryPressure – The maximum percentage of the Java heap used for all dedicated master nodes in the cluster.
- WarmJVMMemoryPressure – The maximum percentage of the Java heap used for UltraWarm nodes in the cluster.
In the latest service software update, Amazon OpenSearch Service improved the logic that it uses to compute these metrics in order to more accurately reflect actual memory utilization.
The problem
Previously, all data nodes used CMS, where the young pool was a small portion of memory. The JVM memory pressure metrics that Amazon OpenSearch Service published to CloudWatch only considered the old pool of the Java heap. You could detect problems in the heap usage by looking only at old generation usage.
When the domain uses G1GC, the young pool is larger, representing a larger percentage of the total heap. Since objects are created first in the young pool, and then moved to the old pool, a significant portion of the usage could be in the young pool. However, the prior metric reported only on the old pool. This leaves domains vulnerable to invisibly running out of memory in the young pool.
What’s changing?
In the latest service software update, Amazon OpenSearch Service changed the logic for the three JVM memory pressure metrics that it sends to CloudWatch to account for the total Java heap in use (old generation and young generation). The goal of this update is to provide a more accurate representation of total memory utilization across your Amazon Opensearch Service domains, especially for Graviton instance types, whose garbage collection logic makes it important to consider all memory pools to calculate actual utilization.
What you can expect
After you update your Amazon OpenSearch Service domains to the latest service software release, the following metrics that Amazon OpenSearch Service sends to CloudWatch will begin to report JVM memory usage for the old and young generation memory pools, rather than just old: JVMemoryPressure, MasterJVMMemoryPressure, and WarmJVMMemoryPressure.
You might see an increase in the values of these metrics, predominantly in G1GC configured domains. In some cases, you might notice a different memory usage pattern altogether, because the young generation memory pool has more frequent garbage collection. Any CloudWatch alarms that you have created around these metrics might be triggered. If this keeps happening, consider scaling your instances vertically up to 64 GiB of RAM, at which point you can scale horizontally by adding instances.
As a standard practice, for domains that have low available memory, Amazon OpenSearch Service blocks further write operations to prevent the domain from reaching red status. You should monitor your memory utilization after the update to get a sense of the actual utilization on your domain. The _nodes/stats/jvm API offers a useful summary of JVM statistics, memory pool usage, and garbage collection information.
Conclusion
Amazon OpenSearch Service recently improved the logic that it uses to calculate JVM memory usage to more accurately reflect actual utilization. The JVMMemoryPressure, MasterJVMMemoryPressure, and WarmJVMMemoryPressure CloudWatch metrics now account for both old and young generation memory pools when calculating memory usage, rather than just old generation. For more information about these metrics, see Monitoring OpenSearch cluster metrics with Amazon CloudWatch.
With the updated metrics, your domains will start to more accurately reflect memory utilization numbers, and might breach CloudWatch alarms that you previously configured. Make sure to monitor your alarms for these metrics and scale your clusters accordingly to maintain optimal memory utilization.
Stay tuned for more exciting updates and new features in Amazon OpenSearch Service.
About the Authors
 Liz Snyder is a San Francisco-based technical writer for Amazon OpenSearch Service, OpenSearch OSS, and Amazon CloudSearch.
 Jon Handler is a Senior Principal Solutions Architect, specializing in AWS search technologies – Amazon CloudSearch, and Amazon OpenSearch Service. Based in Palo Alto, he helps a broad range of customers get their search and log analytics workloads deployed right and functioning well.