Post Syndicated from Grab Tech original https://engineering.grab.com/graph-concepts
Introduction
In an introductory article, we talked about the importance of Graph Networks in fraud detection. In this article, we will be adding some further context on graphs, graph technology and some common use cases.
Connectivity is the most prominent feature of today’s networks and systems. From molecular interactions, social networks and communication systems to power grids, shopping experiences or even supply chains, networks relating to real-world systems are not random. This means that these connections are not static and can be displayed differently at different times. Simple statistical analysis is insufficient to effectively characterise, let alone forecast, networked system behaviour.
As the world becomes more interconnected and systems become more complex, it is more important to employ technologies that are built to take advantage of relationships and their dynamic properties. There is no doubt that graphs have sparked a lot of attention because they are seen as a means to get insights from related data. Graph theory-based approaches show the concepts underlying the behaviour of massively complex systems and networks.
What are graphs?
Graphs are mathematical models frequently used in network science, which is a set of technological tools that may be applied to almost any subject. To put it simply, graphs are mathematical representations of complex systems.
Origin of graphs
The first graph was produced in 1736 in the city of Königsberg, now known as Kaliningrad, Russia. In this city, there were two islands with two mainland sections that were connected by seven different bridges.
Famed mathematician Euler wanted to plot a journey through the entire city by crossing each bridge only once. Euler proceeded to abstract the four regions of the city and the seven bridges into edges but he demonstrated that the problem was unsolvable. A simplified abstract graph is shown in Fig 1.
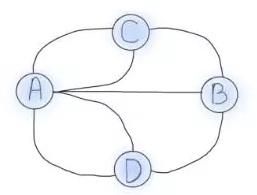
The graph’s four dots represent Königsberg’s four zones, while the lines represent the seven bridges that connect them. Zones connected by an even number of bridges is clearly navigable because several paths to enter and exit are available. Zones connected by an odd number of bridges can only be used as starting or terminating locations because the same route can only be taken once.
The number of edges associated with a node is known as the node degree. If two nodes have odd degrees and the rest have even degrees, the Königsberg problem could be solved. For example, exactly two regions must have an even number of bridges while the rest have an odd number of bridges. However, as illustrated in Fig 1, no Königsberg location has an even number of bridges, rendering this problem unsolvable.
Definition of graphs
A graph is a structure that consists of vertices and edges. Vertices, or nodes, are the objects in a problem, while edges are the links that connect vertices in a graph.
Vertices are the fundamental elements that a graph requires to function; there should be at least one in a graph. Vertices are mathematical abstractions that refer to objects that are linked by a condition.
On the other hand, edges are optional as graphs can still be defined without any edges. An edge is a link or connection between any two vertices in a graph, including a connection between a vertex and itself. The idea is that if two vertices are present, there is a relationship between them.
We usually indicate V={v1, v2, …, vn} as the set of vertices, and E = {e1, e2, …, em} as the set of edges. From there, we can define a graph G as a structure G(V, E) which models the relationship between the two sets:
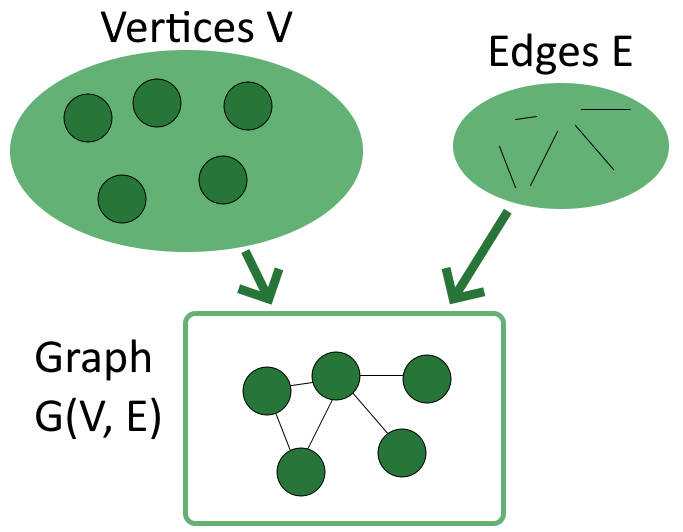
It is worth noting that the order of the two sets within parentheses matters, because we usually express the vertices first, followed by the edges. A graph H(X, Y) is therefore a structure that models the relationship between the set of vertices X and the set of edges Y, not the other way around.
Graph data model
Now that we have covered graphs and their typical components, let us move on to graph data models, which help to translate a conceptual view of your data to a logical model. Two common graph data formats are Resource Description Framework (RDF) and Labelled Property Graph (LPG).
Resource Description Framework (RDF)
RDF is typically used for metadata and facilitates standardised exchange of data based on their relationships. RDFs typically consist of a triple: a subject, a predicate, and an object. A collection of such triples is an RDF graph. This can be depicted as a node and a directed edge diagram, with each triple representing a node-edge-node graph, as shown in Fig 3.

The three types of nodes that can exist are:
- Internationalised Resource Identifiers (IRI) – online resource identification code.
- Literals – data type value, i.e. text, integer, etc.
- Blank nodes – have no identification; similar to anonymous or existential variables.
Let us use an example to illustrate this. We have a person with the name Art and we want to plot all his relationships. In this case, the IRI is http://example.org/art and this can be shortened by defining a prefix like ex.
In this example, the IRI http://xmlns.com/foaf/0.1/knows defines the relationship knows. We define foaf as the prefix for http://xmlns.com/foaf/0.1/. The following code snippet shows how a graph like this will look.
@prefix foaf: <http://xmlns.com/foaf/0.1/>
@prefix ex: <http://example.org/>

ex:art foaf:knows ex:bob
ex:art foaf:knows ex:bea
ex:bob foaf:knows ex:cal
ex:bob foaf:knows ex:cam
ex:bea foaf:knows ex:coe
ex:bea foaf:knows ex:cory
ex:bea foaf:age 23
ex:bea foaf:based_near_:o1
In the last two lines, you can see how a literal and blank node would be depicted in an RDF graph. The variable foaf:age is a literal node with the integer value of 23, while foaf:based_near is an anonymous spatial entity with a node identifier of underscore. Outside the context of this graph, o1 is a data identifier with no meaning.
Multiple IRIs, intended for use in RDF graphs, are typically stored in an RDF vocabulary. These IRIs often begin with a common substring known as a namespace IRI. In some cases, namespace IRIs are also associated with a short name known as a namespace prefix. In the example above, http://xmlns.com/foaf/0.1/ is the namespace IRI and foaf and ex are namespace prefixes.
Note: RDF graphs are considered atemporal as they provide a static snapshot of data. They can use appropriate language extensions to communicate information about events or other dynamic properties of entities.
An RDF dataset is a set of RDF graphs that includes one or more named graphs as well as exactly one default graph. A default graph is one that can be empty, and has no associated IRI or name, while each named graph has an IRI or a blank node corresponding to the RDF graph and its name. If there is no named graph specified in a query, the default graph is queried (hence its name).
Labelled Property Graph (LPG)
A labelled property graph is made up of nodes, links, and properties. Each node is given a label and a set of characteristics in the form of arbitrary key-value pairs. The keys are strings, and the values can be any data type. A relationship is then defined by adding a directed edge that is labelled and connects two nodes with a set of properties.
In Fig 4, we have an LPG that shows two nodes: art and bea. The bea node has two characteristics, age and proximity, that are connected by a known edge. This edge has the attribute since because it commemorates the year that art and bea first met.
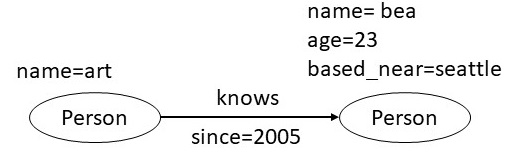
Nodes, edges and properties must be defined when designing an LPG data model. In this scenario, based_near might not be applicable to all vertices, but they should be defined. You might be wondering, why not represent the city Seattle as a node and add an edge marked as based_near that connects a person and the city?
In general, if there is a value linked to a large number of other nodes in the network and it requires additional properties to correlate with other nodes, it should be represented as a node. In this scenario, the architecture defined in Fig 5 is more appropriate for traversing based_near connections. It also gives us the ability to link any new attributes to the based_near relationship.

Now that we have the context of graphs, let us talk about graph databases, how they help with large data queries and the part they play in Graph Technology.
Graph database
A graph database is a type of NoSQL database that stores data using network topology. The idea is derived from LPG, which represents data sets with vertices, edges, and attributes.
- Vertices are instances or entities of data that represent any object to be tracked, such as people, accounts, locations, etc.
- Edges are the critical concepts in graph databases which represent relationships between vertices. The connections have a direction that can be unidirectional (one-way) or bidirectional (two-way).
- Properties represent descriptive information associated with vertices. In some cases, edges have properties as well.
Graph databases provide a more conceptual view of data that is closer to reality. Modelling complex linkages becomes simpler because interconnections between data points are given the same weight as the data itself.
Graph database vs. relational database
Relational databases are currently the industry norm and take a structured approach to data, usually in the form of tables. On the other hand, graph databases are agile and focus on immediate relationship understanding. Neither type is designed to replace the other, so it is important to know what each database type has to offer.
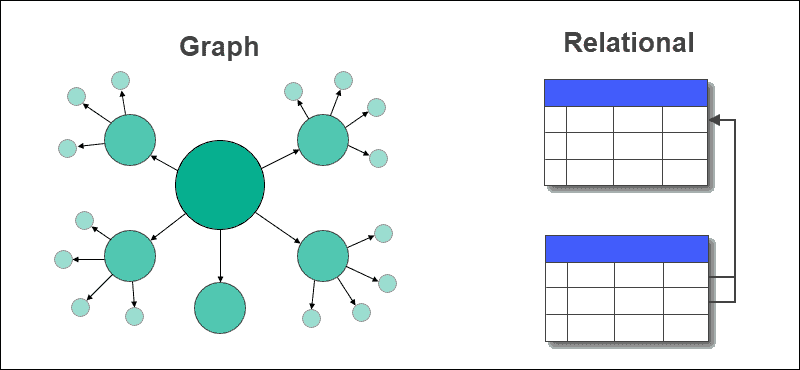
There is a domain for both graph and relational databases. Graph databases outperform typical relational databases, especially in use cases involving complicated relationships, as they take a more naturalistic and flowing approach to data.
The key distinctions between graph and relational databases are summarised in the following table:
| Type | Graph | Relational |
|---|---|---|
| Format | Nodes and edges with properties | Tables with rows and columns |
| Relationships | Represented with edges between nodes | Created using foreign keys between tables |
| Flexibility | Flexible | Rigid |
| Complex queries | Quick and responsive | Requires complex joins |
| Use case | Systems with highly connected relationships | Transaction focused systems with more straightforward relationships |
Advantages and disadvantages
Every database type has its advantages and disadvantages; knowing the distinctions as well as potential options for specific challenges is crucial. Graph databases are a rapidly evolving technology with improved functions compared with other database types.
Advantages
Some advantages of graph databases include:
- Agile and flexible structures.
- Explicit relationship representation between entities.
- Real-time query output – speed depends on the number of relationships.
Disadvantages
The general disadvantages of graph databases are:
- No standardised query language; depends on the platform used.
- Not suitable for transactional-based systems.
- Small user base, making it hard to find troubleshooting support.
Graph technology
Graph technology is the next step in improving analytics delivery. Traditional analytics is insufficient to meet complicated business operations, distribution, and analytical concerns as data quantities expand.
Graph technology aids in the discovery of unknown correlations in data that would otherwise go undetected or unanalysed. When the term graph is used to describe a topic, three distinct concepts come to mind: graph theory, graph analytics, and graph data management.
- Graph theory – A mathematical notion that uses stack ordering to find paths, linkages, and networks of logical or physical objects, as well as their relationships. Can be used to model molecules, telephone lines, transport routes, manufacturing processes, and many other things.
- Graph analytics – The application of graph theory to uncover nodes, edges, and data linkages that may be assigned semantic attributes. Can examine potentially interesting connections in data found in traditional analysis solutions, using node and edge relationships.
- Graph database – A type of storage for data generated by graph analytics. Filling a knowledge graph, which is a model in data that indicates a common usage of acquired knowledge or data sets expressing a frequently held notion, is a typical use case for graph analytics output.
While the architecture and terminology are sometimes misunderstood, graph analytics’ output can be viewed through visualisation tools, knowledge graphs, particular applications, and even some advanced dashboard capabilities of business intelligence tools. All three concepts above are frequently used to improve system efficiency and even to assist in dynamic data management. In this approach, graph theory and analysis are inextricably linked, and analysis may always rely on graph databases.
Graph-centric user stories
Fraud detection
Traditional fraud prevention methods concentrate on discrete data points such as individual accounts, devices, or IP addresses. However, today’s sophisticated fraudsters avoid detection by building fraud rings using stolen and fake identities. To detect such fraud rings, we need to look beyond individual data points to the linkages that connect them.
Graph technology greatly transcends the capabilities of a relational database, by revealing hard-to-find patterns. Enterprise businesses also employ Graph technology to supplement their existing fraud detection skills to tackle a wide range of financial crimes, including first-party bank fraud, fraud, and money laundering.
Real-time recommendations
An online business’s success depends on systems that can generate meaningful recommendations in real time. To do so, we need the capacity to correlate product, customer, inventory, supplier, logistical, and even social sentiment data in real time. Furthermore, a real-time recommendation engine must be able to record any new interests displayed during the consumer’s current visit in real time, which batch processing cannot do.
Graph databases outperform relational and other NoSQL data stores in terms of delivering real-time suggestions. Graph databases can easily integrate different types of data to get insights into consumer requirements and product trends, making them an increasingly popular alternative to traditional relational databases.
Supply chain management
With complicated scenarios like supply chains, there are many different parties involved and companies need to stay vigilant in detecting issues like fraud, contamination, high-risk areas or unknown product sources. This means that there is a need to efficiently process large amounts of data and ensure transparency throughout the supply chain.
To have a transparent supply chain, relationships between each product and party need to be mapped out, which means there will be deep linkages. Graph databases are great for these as they are designed to search and analyse data with deep links. This means they can process enormous amounts of data without performance issues.
Identity and access management
Managing multiple changing roles, groups, products and authorisations can be difficult, especially in large organisations. Graph technology integrates your data and allows quick and effective identity and access control. It also allows you to track all identity and access authorisations and inheritances with significant depth and real-time insights.
Network and IT operations
Because of the scale and complexity of network and IT infrastructure, you need a configuration management database (CMDB) that is far more capable than relational databases. Neptune is an example of a CMDB and graph database that allows you to correlate your network, data centre, and IT assets to aid troubleshooting, impact analysis, and capacity or outage planning.
A graph database allows you to integrate various monitoring tools and acquire important insights into the complicated relationships that exist between various network or data centre processes. Possible applications of graphs in network and IT operations range from dependency management to automated microservice monitoring.
Risk assessment and monitoring
Risk assessment is crucial in the fintech business. With multiple sources of credit data such as ecommerce sites, mobile wallets and loan repayment records, it can be difficult to accurately assess an individual’s credit risk. Graph Technology makes it possible to combine these data sources, quantify an individual’s fraud risk and even generate full credit reviews.
One clear example of this is IceKredit, which employs artificial intelligence (AI) and machine learning (ML) techniques to make better risk-based decisions. With Graph technology, IceKredit has also successfully detected unreported links and increased efficiency of financial crime investigations.
Social network
Whether you’re using stated social connections or inferring links based on behaviour, social graph databases like Neptune introduce possibilities for building new social networks or integrating existing social graphs into commercial applications.
Having a data model that is identical to your domain model allows you to better understand your data, communicate more effectively, and save time. By decreasing the time spent data modelling, graph databases increase the quality and speed of development for your social network application.
Artificial intelligence (AI) and machine learning (ML)
AI and ML use statistical and analytical approaches to find patterns in data and provide insights. However, there are two prevalent concerns that arise – the quality of data and effectiveness of the analytics. Some AI and ML solutions have poor accuracy because there is not enough training data or variants that have a high correlation to the outcome.
These ML data issues can be solved with graph databases as it’s possible to connect and traverse links, as well as supplement raw data. With Graph technology, ML systems can recognise each column as a “feature” and each connection as a distinct characteristic, and then be able to identify data patterns and train themselves to recognise these relationships.
Conclusion
Graphs are a great way to visually represent complex systems and can be used to easily detect patterns or relationships between entities. To help improve graphs’ ability to detect patterns early, businesses should consider using Graph technology, which is the next step in improving analytics delivery.
Graph technology typically consists of:
- Graph theory – Used to find paths, linkages and networks of logical or physical objects.
- Graph analytics – Application of graph theory to uncover nodes, edges, and data linkages.
- Graph database – Storage for data generated by graph analytics.
Although predominantly used in fraud detection, Graph technology has many other use cases such as making real-time recommendations based on consumer behaviour, identity and access control, risk assessment and monitoring, AI and ML, and many more.
Check out our next blog article, where we will be talking about how our Graph Visualisation Platform enhances Grab’s fraud detection methods.
References
- https://www.baeldung.com/cs/graph-theory-intro
- https://web.stanford.edu/class/cs520/2020/notes/What_Are_Graph_Data_Models.html
Join us
Grab is the leading superapp platform in Southeast Asia, providing everyday services that matter to consumers. More than just a ride-hailing and food delivery app, Grab offers a wide range of on-demand services in the region, including mobility, food, package and grocery delivery services, mobile payments, and financial services across 428 cities in eight countries.
Powered by technology and driven by heart, our mission is to drive Southeast Asia forward by creating economic empowerment for everyone. If this mission speaks to you, join our team today!