Post Syndicated from original https://www.backblaze.com/blog/hard-drive-life-expectancy/
For the last several years, we have written about drive failure, or more specifically, the annualized failure rates for the hard drives and SSDs we use for our cloud storage platform. In this post, we’ll look at drive failure from a different angle: life expectancy.
By looking at life expectancy, we can answer the question, “How long is the drive I am buying today expected to last?” This line of thinking matches the way we buy many things. For example, knowing that a washing machine has an annualized failure rate of 4% is academically interesting, but what we really want to know is, “How long can I expect the washing machine to last before I need to replace it?”
Using the Drive Stats data we’ve collected since 2013, we have selected 10 drive models that have a sufficient number of both drives and drive days to produce Kaplan-Meier life expectancy curves we can use to easily visualize their life expectancy. Using these life expectancy curves we’ll compare drive models in cohorts of 4TB, 8TB, 12TB, and 14TB to see what we can find.
What Is a Kaplan-Meier Curve?
Kaplan-Meier curves are most often used in biological sciences to forecast life expectancy by measuring the fraction of subjects living for a certain amount of time after receiving treatment. That said, the application of the technique to other fields is not unusual.
Comparing 4TB Drives
The two 4TB drive models we selected for comparison had the most 4TB drives in operation as of March 31, 2022. The Drive Stats for each drive model as of March 31, 2022 is shown below, followed by the Kaplan-Meier curve for each drive.
| MFG | Model | Drives in Operation | Lifetime Drive Failures | Lifetime Drive Days | Lifetime AFR |
|---|---|---|---|---|---|
| HGST | HMS5C4040BLE640 | 12,728 | 343 | 30,025,871 | 0.40% |
| Seagate | ST4000DM000 | 18,495 | 4,581 | 68,104,520 | 2.45% |
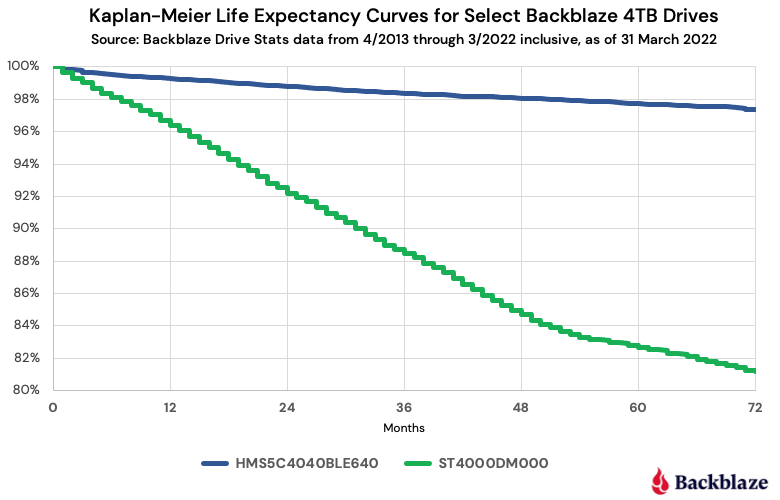
What Is the Graph Telling Us?
- If you purchased an HGST drive at time zero, there is a 97% chance that drive would still be operational after six years (72 months).
- If you purchased a Seagate drive at time zero, there is an 81% chance that drive would still be operational after six years.
Case closed—we were stupid to buy any Seagate 4TB drives, right? Not so fast, there are other factors at work here: cost, availability, time, and maintenance, to name a few. For example, suppose I told you that the HGST drive you wanted was 1.2 to 1.5 times as expensive as the Seagate drive. In addition, the Seagate drive was readily available while the HGST drive was harder to get, and finally, at the time of purchase there was over an 80% chance that the Seagate drive would still be alive after six years. How does that change your perception?
In the case of buying one or two drives, you may find a single factor like, “how much do you have to spend” is the only thing that matters. In our case, these factors are intertwined. We explain some of the thinking behind our decision-making in our “How Backblaze Buys Hard Drives” post.
Was It Worth the Savings?
In the simple case, if the time and effort we spent replacing the failed Seagate drives was more than the savings, we failed. So, let’s do a little back-of-the-envelope math to see how we landed.
We replaced a little over 4,200 more Seagate drives over a six year period than HGST drives. That is 700 drives a year or about two Seagate drives per day we had to replace. That’s 30-40 minutes a day someone spent doing that task spread across multiple data centers. Yes, it’s work, but hardly something you would need to hire a person specifically to do.
Why Buy HGST Drives at All?
Fair question. At the time we were purchasing these Seagate and HGST drive models back in 2013 through 2015, there were no life expectancy curves and Drive Stats was just starting. We had anecdotal information that the HGST drives were better, but little else. In short, sometimes, the pricing and availability of the HGST was good enough so we bought them.
Comparing 8TB Drives
The two 8TB drives we’ve chosen to compare using life expectancy curves have done battle before. The 8TB Seagate model: ST8000DM002 is classified as a consumer drive, while the 8TB Seagate model: ST8000NM0055 is classified as an enterprise drive. Their lifetime annualized failure rates tell an interesting story. All data is as of March 31, 2022.
| Type | Model | Drives in Operation | Lifetime Drive Failures | Lifetime Drive Days | Lifetime AFR |
|---|---|---|---|---|---|
| Consumer | ST8000DM002 | 9,678 | 628 | 19,815,919 | 1.13% |
| Enterprise | ST8000NM0055 | 14,323 | 915 | 24,999,738 | 1.35% |
Let’s take a look at the life expectancy curves and see what else we can learn.
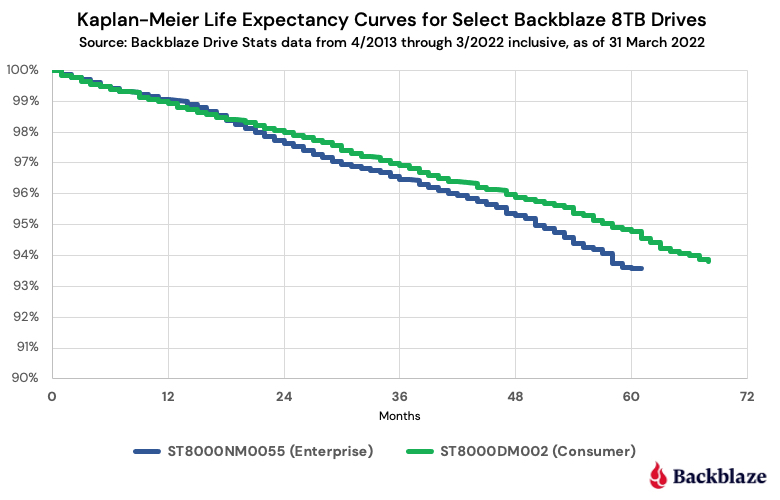
Observations
- If you purchased either drive, the life expectancy is nearly the same for early on, but starts to separate at about two years and the difference increases over the next three years.
- For the consumer model (ST8000DM002) you would expect nearly 95% of the drives to survive five years.
- For the enterprise model (ST8000NM0055) you would expect 93.6% of the drives to survive five years.
These results seem at odds with the warranties for each model. Consumer drives typically have two-year warranties, while enterprise drives typically have five-year warranties. Yet at five years, the consumer drives, in this case, are more likely to survive, and the trend starts at two years—the end of the typical consumer drive warranty period. It’s almost like we got the data backwards. We didn’t.
Even with this odd difference, both drives performed well. If you wanted to buy an 8TB drive and the salesperson said there would be a 93.6% chance the drive would last five years, well, that’s pretty good. Regardless of the failure rate or life expectancy, there are other reasons to purchase an enterprise class drive, including the ability to tune the drive, tweak the firmware, or get a replacement via the warranty for three more years versus the consumer drive. All are good reasons and may be worth the premium you will pay for an enterprise class drive, but in this case at least, long live the consumer drive.
A Word About Drive Warranties
One of the advantages we get for buying drives in bulk from a manufacturer or one of their top tier resellers is that they will honor the warranty period ascribed to the drive. When you are buying from a retailer (typically an online retailer, but not always), you may find the warranty terms and conditions to be less straightforward. Here are three common situations:
- The retailer purchases the drive or takes the drive on consignment from the manufacturer/distributor/reseller/etc., and that event triggers the start of the manufacturer warranty. When you buy the drive six months later, the warranty is no longer “X” years, but “X” years minus six months.
- The retailer replaces the warranty with their own time period. While this is usually done for refurbished drives, we have seen this done by online retailers for new drives as well. In one case we saw, the original five-year warranty period was reduced to one year.
- The retailer is only a storefront while the actual seller is different. At that point, determining the warranty period and who services the drive can be, shall we say, challenging. Of course, you can always buy the add-on warranty that’s offered—it’s always nice to pay for something that was supposed to be included.
As a drive model gets older, these types of shenanigans are more likely to happen. For example, a given drive model gathers dust awaiting shipment while new models are coming to market at competitive prices. The multiple players on the path from a drive’s manufacture to its eventual sale are looking for ways to “move” these aging drives along that path. One option is to lower or eliminate the warranty period to help reduce the cost of the drive. The warranty becomes a casualty of the supply chain and you, as the last buyer, are left with the results.
Comparing 12TB Drives
If you are serious about storing copious amounts of data, you’re probably looking at 12TB drives and higher. Your Plex media server or eight-bay NAS system demands nothing less. To that end, we selected three 12TB models for which we have at least two years worth of data to base our life expectancy curves upon. The Drive Stats data for these three drives is as of March 31, 2022.
| MFR | Model | Drives in Operation | Lifetime Drive Failures | Lifetime Drive Days | Lifetime AFR |
|---|---|---|---|---|---|
| HGST | HUH721212ALN604 | 10,813 | 148 | 11,813,149 | 0.48% |
| Seagate | ST12000NM001G | 12,269 | 104 | 6,166,144 | 0.63% |
| Seagate | ST12000NM0008 | 20,139 | 449 | 14,802,577 | 1.12% |
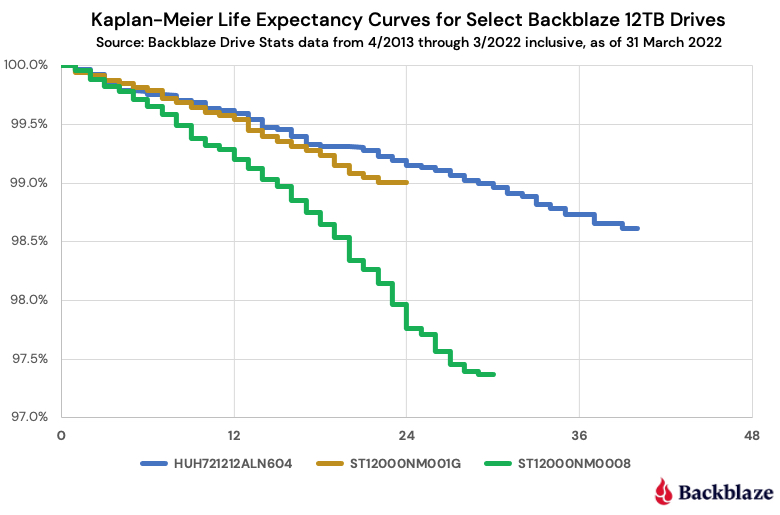
Observations and Thoughts
For any of the three models, at least 98% of the drives are expected to survive two years. I suspect that most of us would take that bet. While none of us wants to own the one or two drives out of 100 that will fail in that two years period, we know there are no 100% guarantees when it comes to hard drives.
That brings us to asking: What is the cost of each drive, and would that affect the buying decision? As we’ve noted previously, we buy in bulk and the price we pay is probably not reflective of the price you may pay in the consumer market. To that end, below are the current prices, via the Amazon website, for the three drive models. We’ve assumed that these are new drives and they have the same warranty coverage of five years.
- HUH721212ALN604 – $413
- ST12000NM001G – $249
- ST12000NM0008 – $319
The Seagate model: ST12000NM001G and the HGST model: HUH721212ALN604 have about the same life expectancy after two years, but their price is significantly different. Which one do you buy today? If you are expecting the drive to last (i.e., survive) two years, you would select the Seagate drive and save yourself $164, plus tax. Some of you will disagree, and given we know nothing beyond the two-year point for the Seagate drive, you may be right. Time will tell.
One thing that may be perplexing here is why the Seagate model: ST12000NM0008 is more expensive than the Seagate model: ST12000NM001G even though the ST12000NM008 fails more often and has a lower life expectancy after two years? The reason is simple: Drive pricing is basically driven by supply and demand. We suspect that annualized failure rates and life expectancy curves are not part of the pricing math done by the various companies (manufacturers/distributors/resellers/etc.) along the supply chain.
By the way, if you purchase the 12TB HGST drive, it may say Western Digital (WDC) on the label. For the first couple of years when these drives were produced, they had HGST on the label, but that changed somewhere in the last couple of years. In either case, both “versions” report as HGST drives and have the same model number, HUH721212ALN604. The new Western Digital label is part of the continuing rebranding effort being done by WDC to update the HGST assets they purchased a few years back.
Comparing 14TB Drives
We will finish up our look at hard drive life expectancy curves with three models from our collection of 14TB drives. While the data ranges from 14 to 41 months depending on the drive model, this is the one cohort where we have comparable data on drives from all three of the major manufacturers: Seagate, Toshiba, and WDC. The Drive Stats data is below, followed by the life expectancy curves for the same models.
| MFR | Model | Drives in Operation | Lifetime Drive Failures | Lifetime Drive Days | Lifetime AFR |
|---|---|---|---|---|---|
| Toshiba | MG07ACA14TA | 38,210 | 454 | 19,834,886 | 0.83% |
| Seagate | ST14000NM001G | 10,734 | 123 | 4,474,417 | 1.00% |
| WDC | WUH721414ALE6L4 | 8,268 | 35 | 3,941,427 | 0.33% |
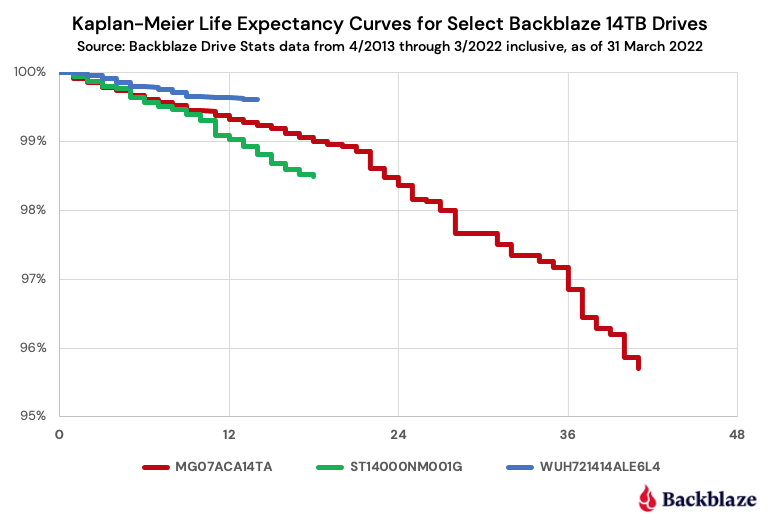
Observations and Thoughts
All three drives have a life expectancy of 99% or more after one year. Previously, we examined the bathtub curve for drive failure and made the observation that the early mortality rate for hard drives, those that failed during their first year in operation, was now nearly the same as the random failure rate. That seems to be the case for this collection of drives as the observed early mortality effect is nominal.
When considering the bathtub curve, the Toshiba model seems to be an outlier beginning at 22 months. At that point, the downward curvature in the line suggests an accelerating failure rate when the failure rate should be steady, as seen below.
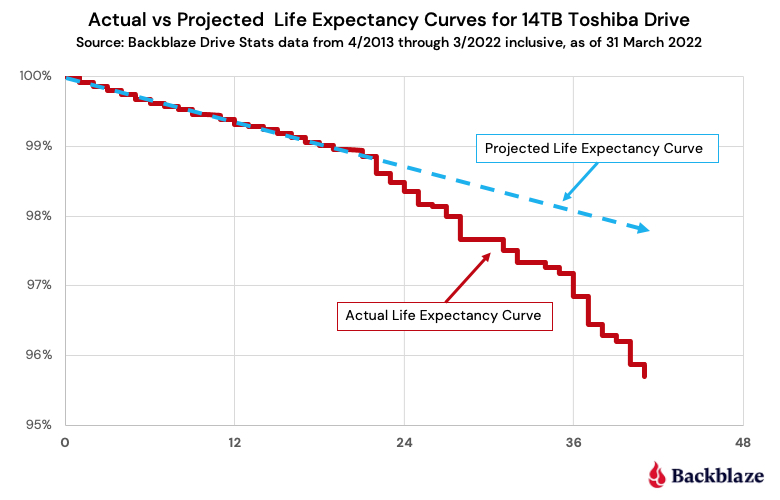
The projected life expectancy curve line is derived by extending the random failure rate from the first 22 months. That said, 97% of the Toshiba drives survived for three years while the projected number was 98%, or simply put, the failure rate was one drive per hundred more over a three-year period.
Interested in More Drive Stats Insights?
Physical disk drives remain essential elements of business and personal tech. That’s why Backblaze publishes performance data and analysis on 200,000+ HDDs: to offer useful insights into how different drive models stack up in our data center. As SSDs increasingly become the norm in many computers and servers, Backblaze is now also sharing data for the thousands of SSDs we use as boot drives.
- Check out our 2021 Year-end Drive Stats Report.
- Read our first SSD-based Drive Stats Report.
Methodology
The raw data comes from the Backblaze Drive Stats data and is based on the raw value of SMART attribute 9 (power on hours) for a defined cohort of drives. After removing outliers, we basically compared the number of drives which failed after a specific number of months versus the number of drives which managed to survive that many months. The math is absolutely more complex than that and I want to thank Dr. Charles Zaiontz, Ph.D. for providing an excellent tutorial on Kaplan-Meier curves and, more specifically, how to use Microsoft Excel to do the math.
Refresher: What Are SMART Stats?
SMART stands for Self-monitoring, Analysis, and Reporting Technology and is a monitoring system included in hard drives that reports on various attributes of the state of a given drive. Each day, Backblaze records the SMART stats that are reported by the hard drives we have in our data centers. Check out this post to learn more about SMART stats and how we use them.
Standing on the Shoulders
Using our Drive Stats data in combination with Kaplan-Meier curves has been done previously in various forms by others including Ross Lazarus, Simon Erni, and Tom Baldwin. We thank them for their collective efforts and for providing us with the inspiration to produce the current curves that enabled the comparisons we did in this post.
The post Hard Drive Life Expectancy appeared first on Backblaze Blog | Cloud Storage & Cloud Backup.