Post Syndicated from Jiseong Kim original https://aws.amazon.com/blogs/big-data/deep-dive-into-the-aws-proserve-hadoop-migration-delivery-kit-tco-tool/
In the post Introducing the AWS ProServe Hadoop Migration Delivery Kit TCO tool, we introduced the AWS ProServe Hadoop Migration Delivery Kit (HMDK) TCO tool and the benefits of migrating on-premises Hadoop workloads to Amazon EMR. In this post, we dive deep into the tool, walking through all steps from log ingestion, transformation, visualization, and architecture design to calculate TCO.
Solution overview
Let’s briefly visit the HMDK TCO tool’s key features. The tool provides a YARN log collector to connect Hadoop Resource Manager to collect YARN logs. A Python-based Hadoop workload analyzer, called the YARN log analyzer, scrutinizes Hadoop applications. Amazon QuickSight dashboards showcase the results from the analyzer. The same results also accelerate the design of future EMR instances. Additionally, a TCO calculator generates the TCO estimation of an optimized EMR cluster for facilitating the migration.
Now let’s look at how the tool works. The following diagram illustrates the end-to-end workflow.

In the next sections, we walk through the five main steps of the tool:
- Collect YARN job history logs.
- Transform the job history logs from JSON to CSV.
- Analyze the job history logs.
- Design an EMR cluster for migration.
- Calculate the TCO.
Prerequisites
Before getting started, make sure to complete the following prerequisites:
- Clone the hadoop-migration-assessment-tco repository.
- Install Python 3 on your local machine.
- Have an AWS account with permission on AWS Lambda, QuickSight (Enterprise edition), and AWS CloudFormation.
Collect YARN job history logs
First, you run a YARN log collector, start-collector.sh, on your local machine. This step collects Hadoop YARN logs and places the logs on your local machine. The script connects your local machine with the Hadoop primary node and communicates with Resource Manager. Then it retrieves the job history information (YARN logs from application managers) by calling the YARN ResourceManager application API.
Prior to running the YARN log collector, you need to configure and establish the connection (HTTP: 8088 or HTTPS: 8090; the latter is recommended) to verify the accessibility of YARN ResourceManager and enabled YARN Timeline Server (Timeline Server v1 or later are supported). You may need to define the YARN logs’ collection interval and retention policy. To ensure that you collect consecutive YARN logs, you can use a cron job to schedule the log collector in a proper time interval. For example, for a Hadoop cluster with 2,000 daily applications and the setting yarn.resourcemanager.max-completed-applications set to 1,000, theoretically, you have to run the log collector at least twice to get all the YARN logs. In addition, we recommend collecting at least 7 days of YARN logs for analyzing holistic workloads.
For more details on how to configure and schedule the log collector, refer to the yarn-log-collector GitHub repo.
Transform the YARN job history logs from JSON to CSV
After obtaining YARN logs, you run a YARN log organizer, yarn-log-organizer.py, which is a parser to transform JSON-based logs to CSV files. These output CSV files are the inputs for the YARN log analyzer. The parser also has other capabilities, including sorting events by time, removing dedicates, and merging multiple logs.
For more information on how to use the YARN log organizer, refer to the yarn-log-organizer GitHub repo.
Analyze the YARN job history logs
Next, you launch the YARN log analyzer to analyze the YARN logs in CSV format.
With QuickSight, you can visualize YARN log data and conduct analysis against the datasets generated by pre-built dashboard templates and a widget. The widget automatically creates QuickSight dashboards in the target AWS account, which configured in a CloudFormation template.
The following diagram illustrates the HMDK TCO architecture.

The YARN log analyzer provides four key functionalities:
- Upload transformed YARN job history logs in CSV format (for example,
cluster_yarn_logs_*.csv) to Amazon Simple Storage Service (Amazon S3) buckets. These CSV files are the outputs from the YARN log organizer. - Create a manifest JSON file (for example,
yarn-log-manifest.json) for QuickSight and upload it to the S3 bucket: - Deploy QuickSight dashboards using a CloudFormation template, which is in YAML format. After deploying, choose the refresh icon until you see the stack’s status as
CREATE_COMPLETE. This step creates datasets on QuickSight dashboards in your AWS target account.

- On the QuickSight dashboard, you can find insights of the analyzed Hadoop workloads from various charts. These insights help you design future EMR instances for migration acceleration, as demonstrated in the next step.


Design an EMR cluster for migration
The results of the YARN log analyzer help you understand the actual Hadoop workloads on the existing system. This step accelerates designing future EMR instances for migration by using an Excel template. The template contains a checklist for conducting workload analysis and capacity planning:
- Are the applications running on the cluster being used appropriately with their current capacity?
- Is the cluster under load at a certain time or not? If so, when is the time?
- What types of applications and engines (such as MR, TEZ, or Spark) are running on the cluster, and what is the resource usage for each type?
- Are different jobs’ run cycles (real-time, batch, ad hoc) running in one cluster?
- Are any jobs running in regular batches, and if so, what are these schedule intervals? (For example, every 10 minutes, 1 hour, 1 day.) Do you have jobs that use a lot of resources during a long time period?
- Do any jobs need performance improvement?
- Are any specific organizations or individuals monopolizing the cluster?
- Are any mixed development and operation jobs operating in one cluster?
After you complete the checklist, you’ll have a better understanding of how to design the future architecture. For optimizing EMR cluster cost effectiveness, the following table provides general guidelines of choosing the proper type of EMR cluster and Amazon Elastic Compute Cloud (Amazon EC2) family.
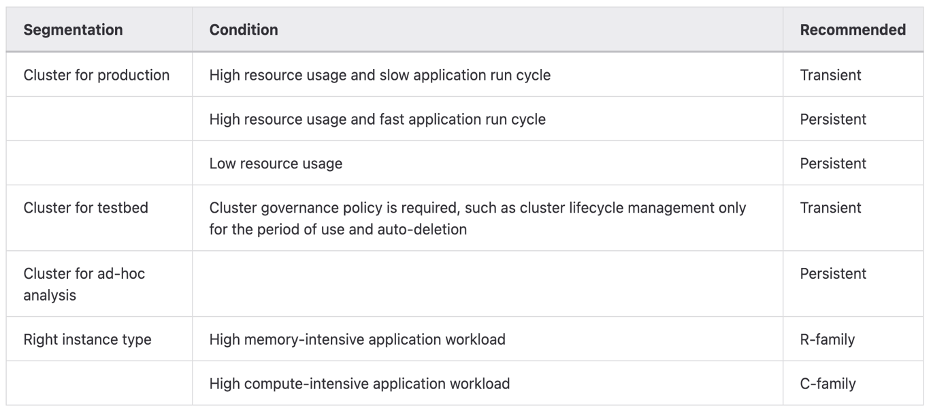
To choose the proper cluster type and instance family, you need to perform several rounds of analysis against YARN logs based on various criteria. Let’s look at some key metrics.
Timeline
You can find workload patterns based on the number of Hadoop applications run in a time window. For example, the daily or hourly charts “Count of Records by Startedtime” provide the following insights:
- In daily time series charts, you compare the number of application runs between working days and holidays, and among calendar days. If the numbers are similar, it means the daily utilizations of the cluster are comparable. On the other hand, if the deviation is large, the proportion of ad hoc jobs is significant. You also can figure out the possible weekly or monthly jobs on particular days. In the situation, you can easily see specific days in a week or a month with high workload concentration.
- In hourly time series charts, you further understand how applications are run in hourly windows. You can find peak and off-peak hours in a day.
Users
The YARN logs contain the user ID of each application. This information helps you understand who submits an application to a queue. Based on the statistics of individual and aggregated application runs per queue and per user, you can determine the existing workload distribution by user. Usually, users at the same team have shared queues. Sometime, multiple teams have shared queues. When designing queues for users, you now have insights to help you design and distribute application workloads that are more balanced across queues than they previously were.
Application types
You can segment workloads based on various application types (such as Hive, Spark, Presto, or HBase) and run engines (such as MR, Spark, or Tez). For the compute-heavy workloads such as MapReduce or Hive-on-MR jobs, use CPU-optimized instances. For memory-intensive workloads such as Hive-on-TEZ, Presto, and Spark jobs, use memory-optimized instances.
ElapsedTime
You can categorize applications by runtime. The embedded CloudFormation template automatically creates an elapsedGroup field in a QuickSight dashboard. This enables a key feature to allow you to observe long-running jobs in one of four charts on QuickSight dashboards. Therefore, you can design tailored future architectures for these large jobs.
The corresponding QuickSight dashboards include four charts. You can drill down each chart, which is associated to one group.
| Group Number |
Runtime/Elapsed Time of a Job |
| 1 | Less than 10 minutes |
| 2 | Between 10 minutes and 30 minutes |
| 3 | between 30 minutes and 1 hour |
| 4 | Greater than 1 hour |
In the chart of Group 4, you can concentrate on scrutinizing large jobs based on various metrics, including user, queue, application type, timeline, resource usage, and so on. Based on this consideration, you may have dedicated queues on a cluster or a dedicated EMR cluster for large jobs. Meanwhile, you may submit small jobs to shared queues.
Resources
Based on resource (CPU, memory) consumption patterns, you choose the right size and family of EC2 instances for performance and cost effectiveness. For compute-intensive applications, we recommend instances of CPU-optimized families. For memory-intensive applications, the memory-optimized instance families are recommended.
In addition, based on the nature of the application workloads and resource utilization over the time, you may choose a persistent or transient EMR cluster, Amazon EMR on EKS, or Amazon EMR Serverless.
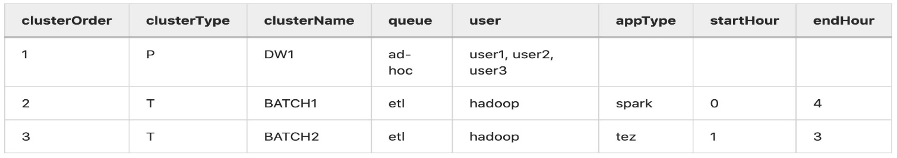
After analyzing YARN logs by various metrics, you’re ready to design future EMR architectures. The following table lists examples of proposed EMR clusters. You can find more details in the optimized-tco-calculator GitHub repo.
Calculate TCO
Finally, on your local machine, run tco-input-generator.py to aggregate YARN job history logs on an hourly basis prior to using an Excel template to calculate the optimized TCO. This step is crucial because the results simulate the Hadoop workloads in future EMR instances.
The prerequisite of TCO simulation is to run tco-input-generator.py, which generates hourly aggregated logs. Next, you open an Excel template file to enable macros and provide your inputs in green cells for calculating the TCO. Regarding the input data, you enter the actual data size without replication, and the hardware specifications (vCore, mem) of the Hadoop primary node and data nodes. You also need to select and upload previously generated hourly aggregated logs. After you set the TCO simulation variables, such as Region, EC2 type, Amazon EMR high availability, engine effect, Amazon EC2 and Amazon EBS discount (EDP), Amazon S3 volume discount, local currency rate, and EMR EC2 task/core pricing ratio and price/hour, the TCO simulator automatically calculates the optimum cost of future EMR instances on Amazon EC2. The following screenshots show an example of HMDK TCO results.
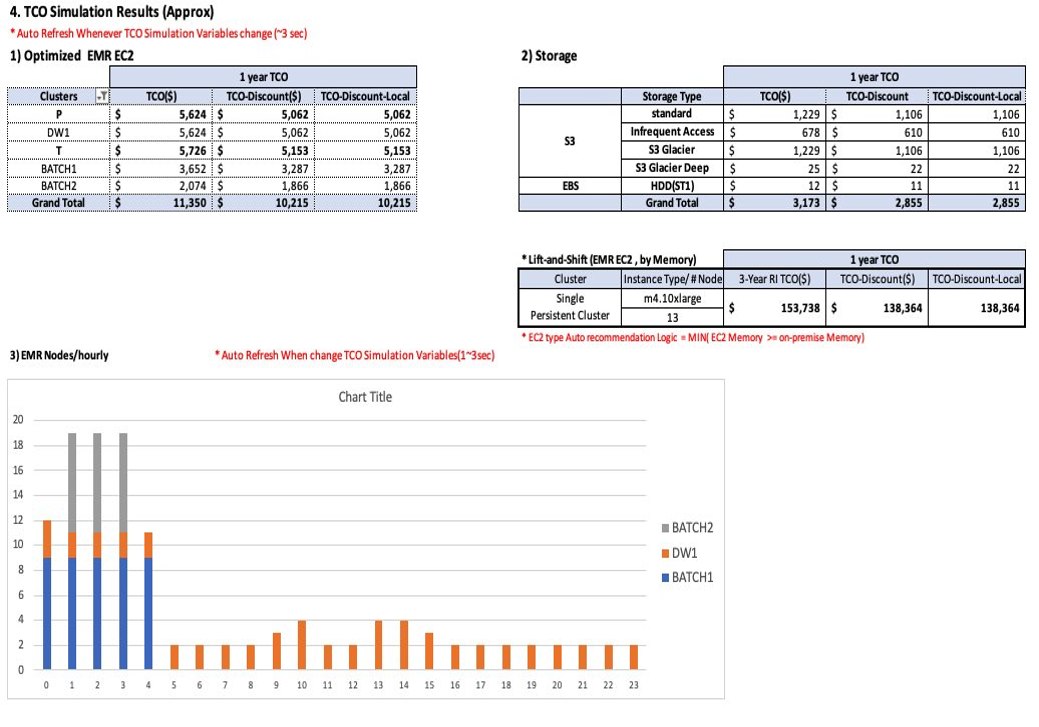
For additional information and instructions of HMDK TCO calculations, refer to the optimized-tco-calculator GitHub repo.
Clean up
After you complete all the steps and finish testing, complete the following steps to delete resources to avoid incurring costs:
- On the AWS CloudFormation console, choose the stack you created.
- Choose Delete.
- Choose Delete stack.
- Refresh the page until you see the status
DELETE_COMPLETE. - On the Amazon S3 console, delete S3 bucket you created.
Conclusion
The AWS ProServe HMDK TCO tool significantly reduces migration planning efforts, which are the time-consuming and challenging tasks of assessing your Hadoop workloads. With the HMDK TCO tool, the assessment usually takes 2–3 weeks. You can also determine the calculated TCO of future EMR architectures. With the HMDK TCO tool, you are able to quickly understand your workloads and resource usage patterns. With the insights generated by the tool, you are equipped to design optimal future EMR architectures. In many use cases, a 1-year TCO of the optimized refactored architecture provides significant cost savings (64–80% reduction) on compute and storage, compared to lift-and-shift Hadoop migrations.
To learn more about accelerating your Hadoop migrations to Amazon EMR and the HMDK CTO tool, refer to the Hadoop Migration Delivery Kit TCO GitHub repo, or reach out to [email protected].
About the authors
 Sungyoul Park is a Senior Practice Manager at AWS ProServe. He helps customers innovate their business with AWS Analytics, IoT, and AI/ML services. He has a specialty in big data services and technologies and an interest in building customer business outcomes together.
 Jiseong Kim is a Senior Data Architect at AWS ProServe. He mainly works with enterprise customers to help data lake migration and modernization, and provides guidance and technical assistance on big data projects such as Hadoop, Spark, data warehousing, real-time data processing, and large-scale machine learning. He also understands how to apply technologies to solve big data problems and build a well-designed data architecture.
 George Zhao is a Senior Data Architect at AWS ProServe. He is an experienced analytics leader working with AWS customers to deliver modern data solutions. He is also a ProServe Amazon EMR domain specialist who enables ProServe consultants on best practices and delivery kits for Hadoop to Amazon EMR migrations. His area of interests are data lakes and cloud modern data architecture delivery.
 Kalen Zhang was the Global Segment Tech Lead of Partner Data and Analytics at AWS. As a trusted advisor of data and analytics, she curated strategic initiatives for data transformation, led data and analytics workload migration and modernization programs, and accelerated customer migration journeys with partners at scale. She specializes in distributed systems, enterprise data management, advanced analytics, and large-scale strategic initiatives.