Post Syndicated from Imtranur Rahman original https://aws.amazon.com/blogs/devops/maintaining-code-quality-with-amazon-codecatalyst-reports/
Amazon CodeCatalyst reports contain details about tests that occur during a workflow run. You can create tests such as unit tests, integration tests, configuration tests, and functional tests. You can use a test report to help troubleshoot a problem during a workflow.
Introduction
In prior posts in this series, I discussed reading The Unicorn Project, by Gene Kim, and how the main character, Maxine, struggles with a complicated Software Development Lifecycle (SDLC) after joining a new team. One of the challenges she encounters is the difficulties in shipping secure, functioning code without an automated testing mechanism. To quote Gene Kim, “Without automated testing, the more code we write, the more money it takes for us to test.”
Software Developers know that shipping vulnerable or non-functioning code to a production environment is to be avoided at all costs; the monetary impact is high and the toll it takes on team morale can be even greater. During the SDLC, developers need a way to easily identify and troubleshoot errors in their code.
In this post, I will focus on how developers can seamlessly run tests as a part of workflow actions as well as configure unit test and code coverage reports with Amazon CodeCatalyst. I will also outline how developers can access these reports to gain insights into their code quality.
Prerequisites
If you would like to follow along with this walkthrough, you will need to:
- Have an AWS Builder ID for signing in to CodeCatalyst.
- Belong to a CodeCatalyst space and have the Space administrator role assigned to you in that space. For more information, see Creating a space in CodeCatalyst, Managing members of your space, and Space administrator role.
- Have an AWS account associated with your space and have the IAM role in that account. For more information about the role and role policy, see Creating a CodeCatalyst service role.
Walkthrough
As with the previous posts in the CodeCatalyst series, I am going to use the Modern Three-tier Web Application blueprint. Blueprints provide sample code and CI/CD workflows to help you get started easily across different combinations of programming languages and architectures. To follow along, you can re-use a project you created previously, or you can refer to a previous post that walks through creating a project using the Three-tier blueprint.
Once the project is deployed, CodeCatalyst opens the project overview. This view shows the content of the README file from the project’s source repository, workflow runs, pull requests, etc. The source repository and workflow are created for me by the project blueprint. To view the source code, I select Code → Source Repositories from the left-hand navigation bar. Then, I select the repository name link from the list of source repositories.

Figure 1. List of source repositories including Mythical Mysfits source code.
From here I can view details such as the number of branches, workflows, commits, pull requests and source code of this repo. In this walkthrough, I’m focused on the testing capabilities of CodeCatalyst. The project already includes unit tests that were created by the blueprint so I will start there.
From the Files list, navigate to web → src → components→ __tests__ → TheGrid.spec.js. This file contains the front-end unit tests which simply check if the strings “Good”, “Neutral”, “Evil” and “Lawful”, “Neutral”, “Chaotic” have rendered on the web page. Take a moment to examine the code. I will use these tests throughout the walkthrough.

Figure 2. Unit test for the front-end that test strings have been rendered properly.
Next, I navigate to the workflow that executes the unit tests. From the left-hand navigation bar, select CI/CD → Workflows. Then, find ApplicationDeploymentPipeline, expand Recent runs and select Run-xxxxx . The Visual tab shows a graphical representation of the underlying YAML file that makes up this workflow. It also provides details on what started the workflow run, when it started, how long it took to complete, the source repository and whether it succeeded.

Figure 3. The Deployment workflow open in the visual designer.
Workflows are comprised of a source and one or more actions. I examined test reports for the back-end in a prior post. Therefore, I will focus on the front-end tests here. Select the build_and_test_frontend action to view logs on what the action ran, its configuration details, and the reports it generated. I’m specifically interested in the Unit Test and Code Coverage reports under the Reports tab:

Figure 4. Reports tab showing line and branch coverage.
Select the report unitTests.xml (you may need to scroll). Here, you can see an overview of this specific report with metrics like pass rate, duration, test suites, and the test cases for those suites:
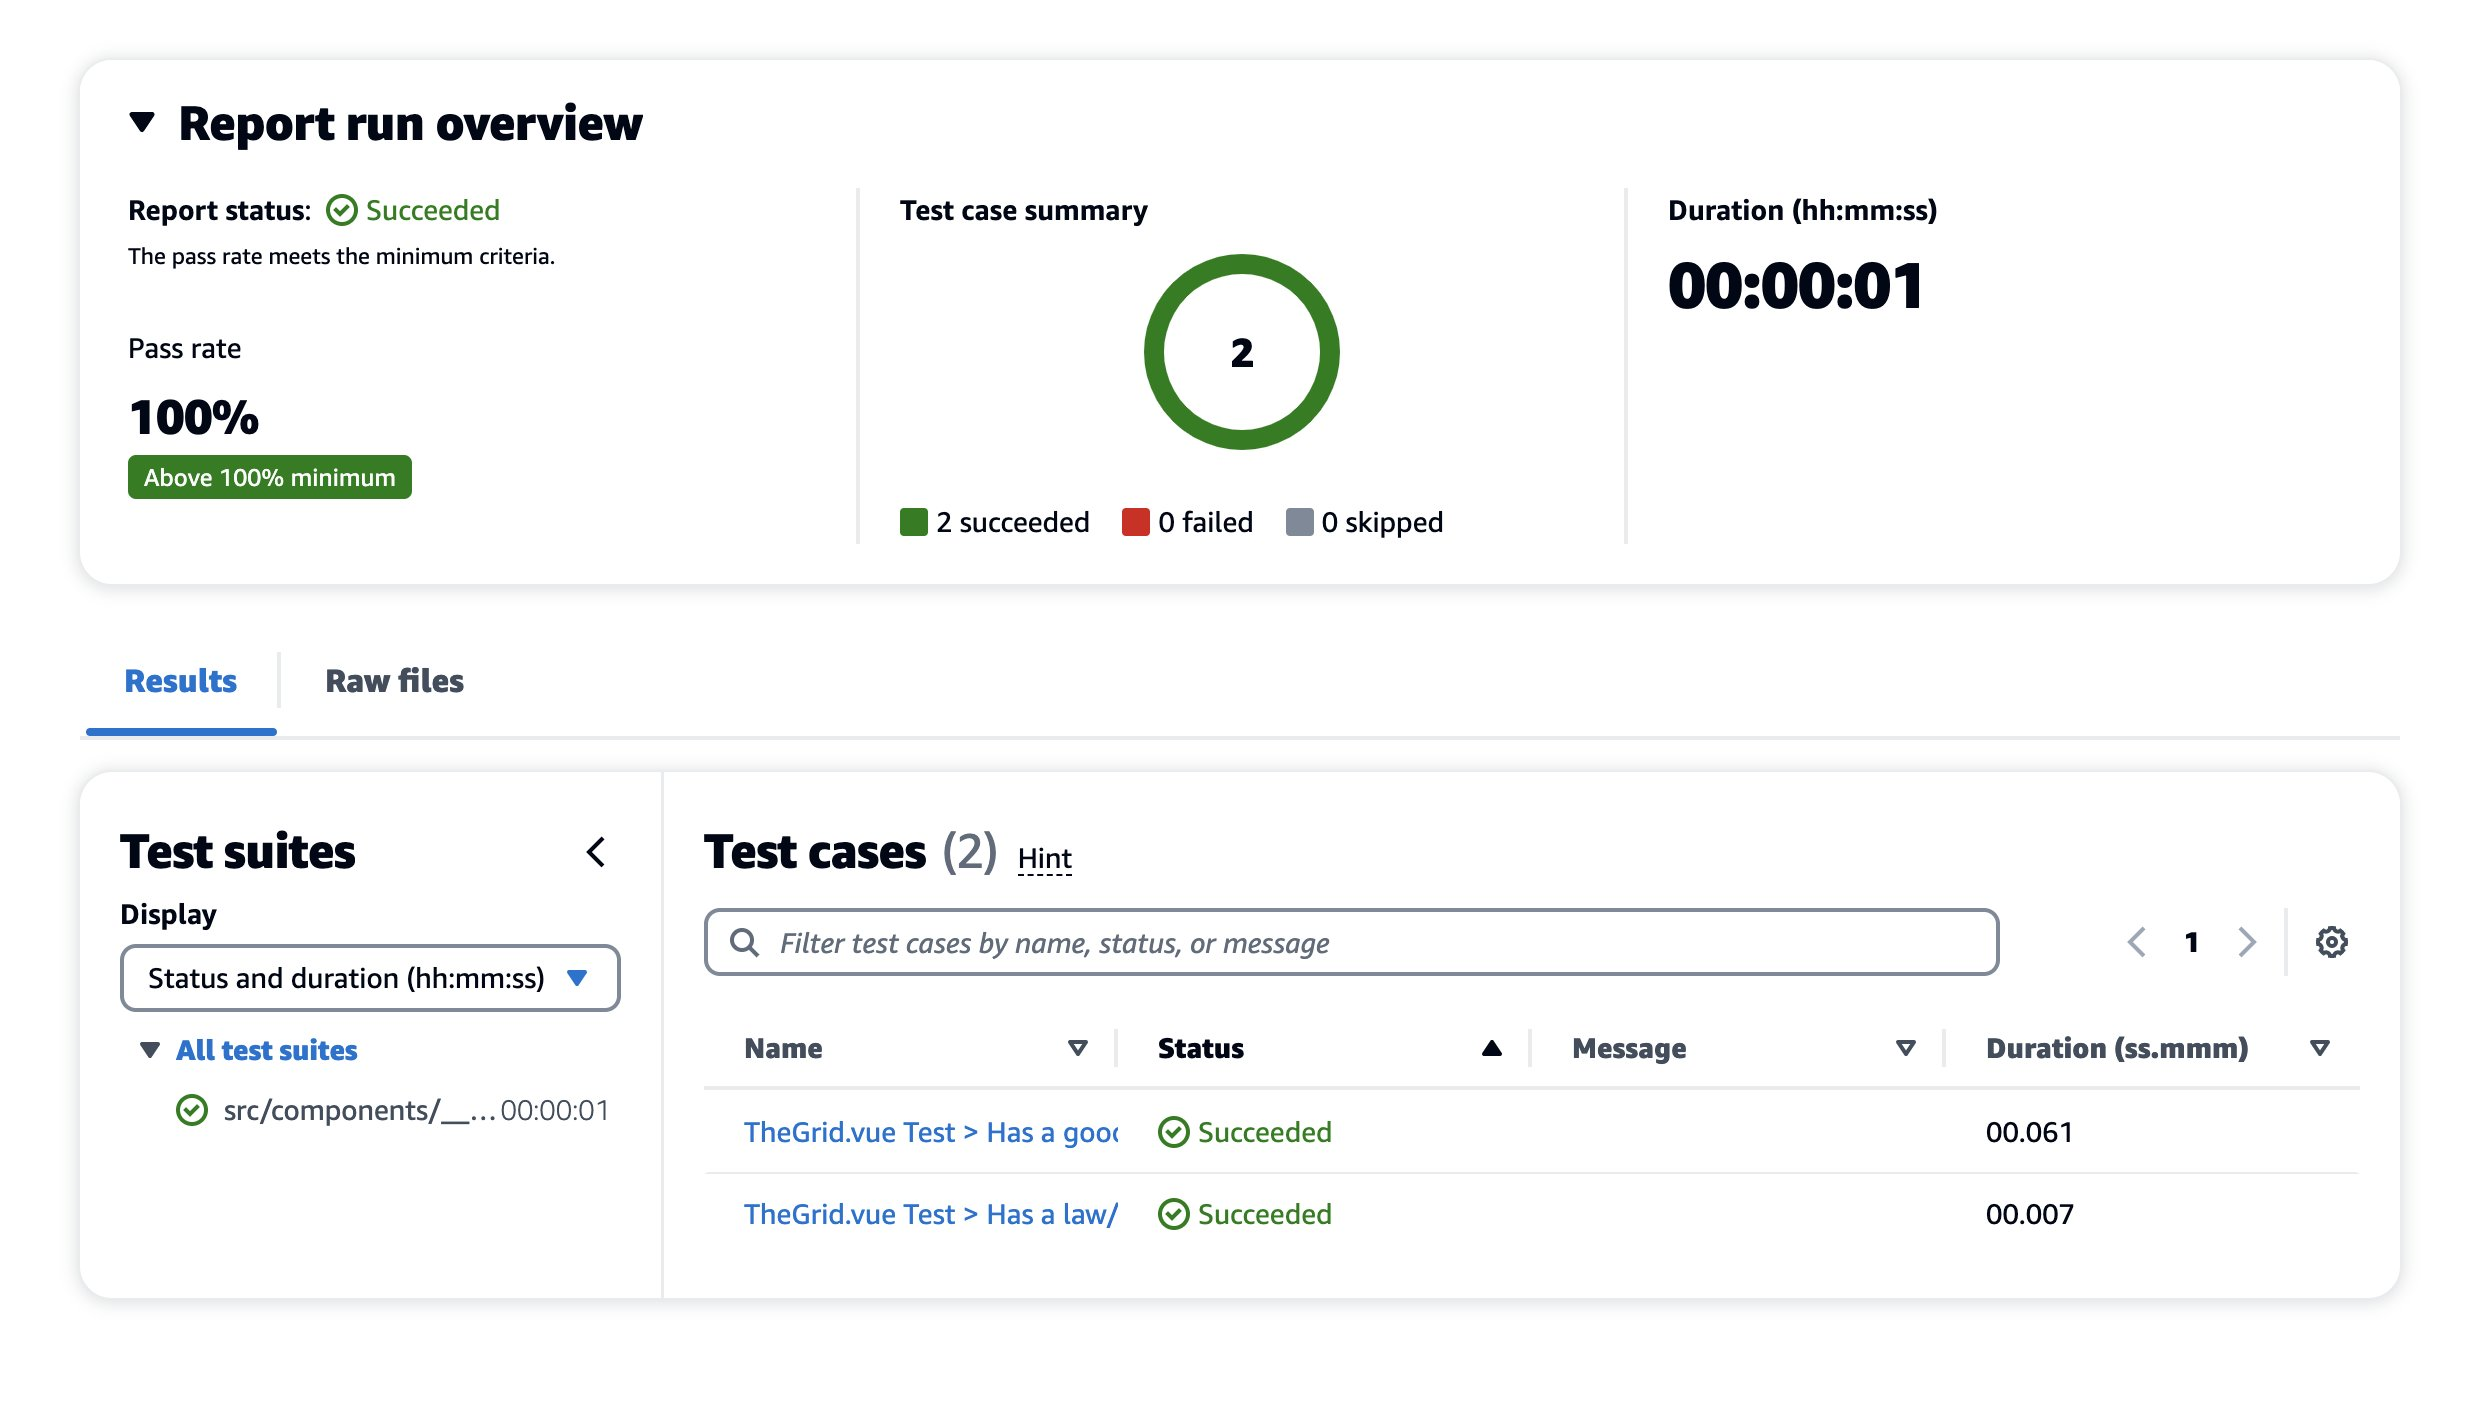
Figure 5. Detailed report for the front-end tests.
This report has passed all checks. To make this report more interesting, I’ll intentionally edit the unit test to make it fail. First, navigate back to the source repository and open web → src → components→ __tests__→TheGrid.spec.js. This test case is looking for the string “Good” so change it to say “Best” instead and commit the changes.

Figure 6. Front-End Unit Test Code Change.
This will automatically start a new workflow run. Navigating back to CI/CD → Workflows, you can see a new workflow run is in progress (takes ~7 minutes to complete).
Once complete, you can see that the build_and_test_frontend action failed. Opening the unitTests.xml report again, you can see that the report status is in a Failed state. Notice that the minimum pass rate for this test is 100%, meaning that if any test case in this unit test ever fails, the build fails completely.
There are ways to configure these minimums which will be explored when looking at Code Coverage reports. To see more details on the error message in this report, select the failed test case.

Figure 7. Failed Test Case Error Message.
As expected, this indicates that the test was looking for the string “Good” but instead, it found the string “Best”. Before continuing, I return to the TheGrid.spec.js file and change the string back to “Good”.
CodeCatalyst also allows me to specify code and branch coverage criteria. Coverage is a metric that can help you understand how much of your source was tested. This ensures source code is properly tested before shipping to a production environment. Coverage is not configured for the front-end, so I will examine the coverage of the back-end.
I select Reports on the left-hand navigation bar, and open the report called backend-coverage.xml. You can see details such as line coverage, number of lines covered, specific files that were scanned, etc.
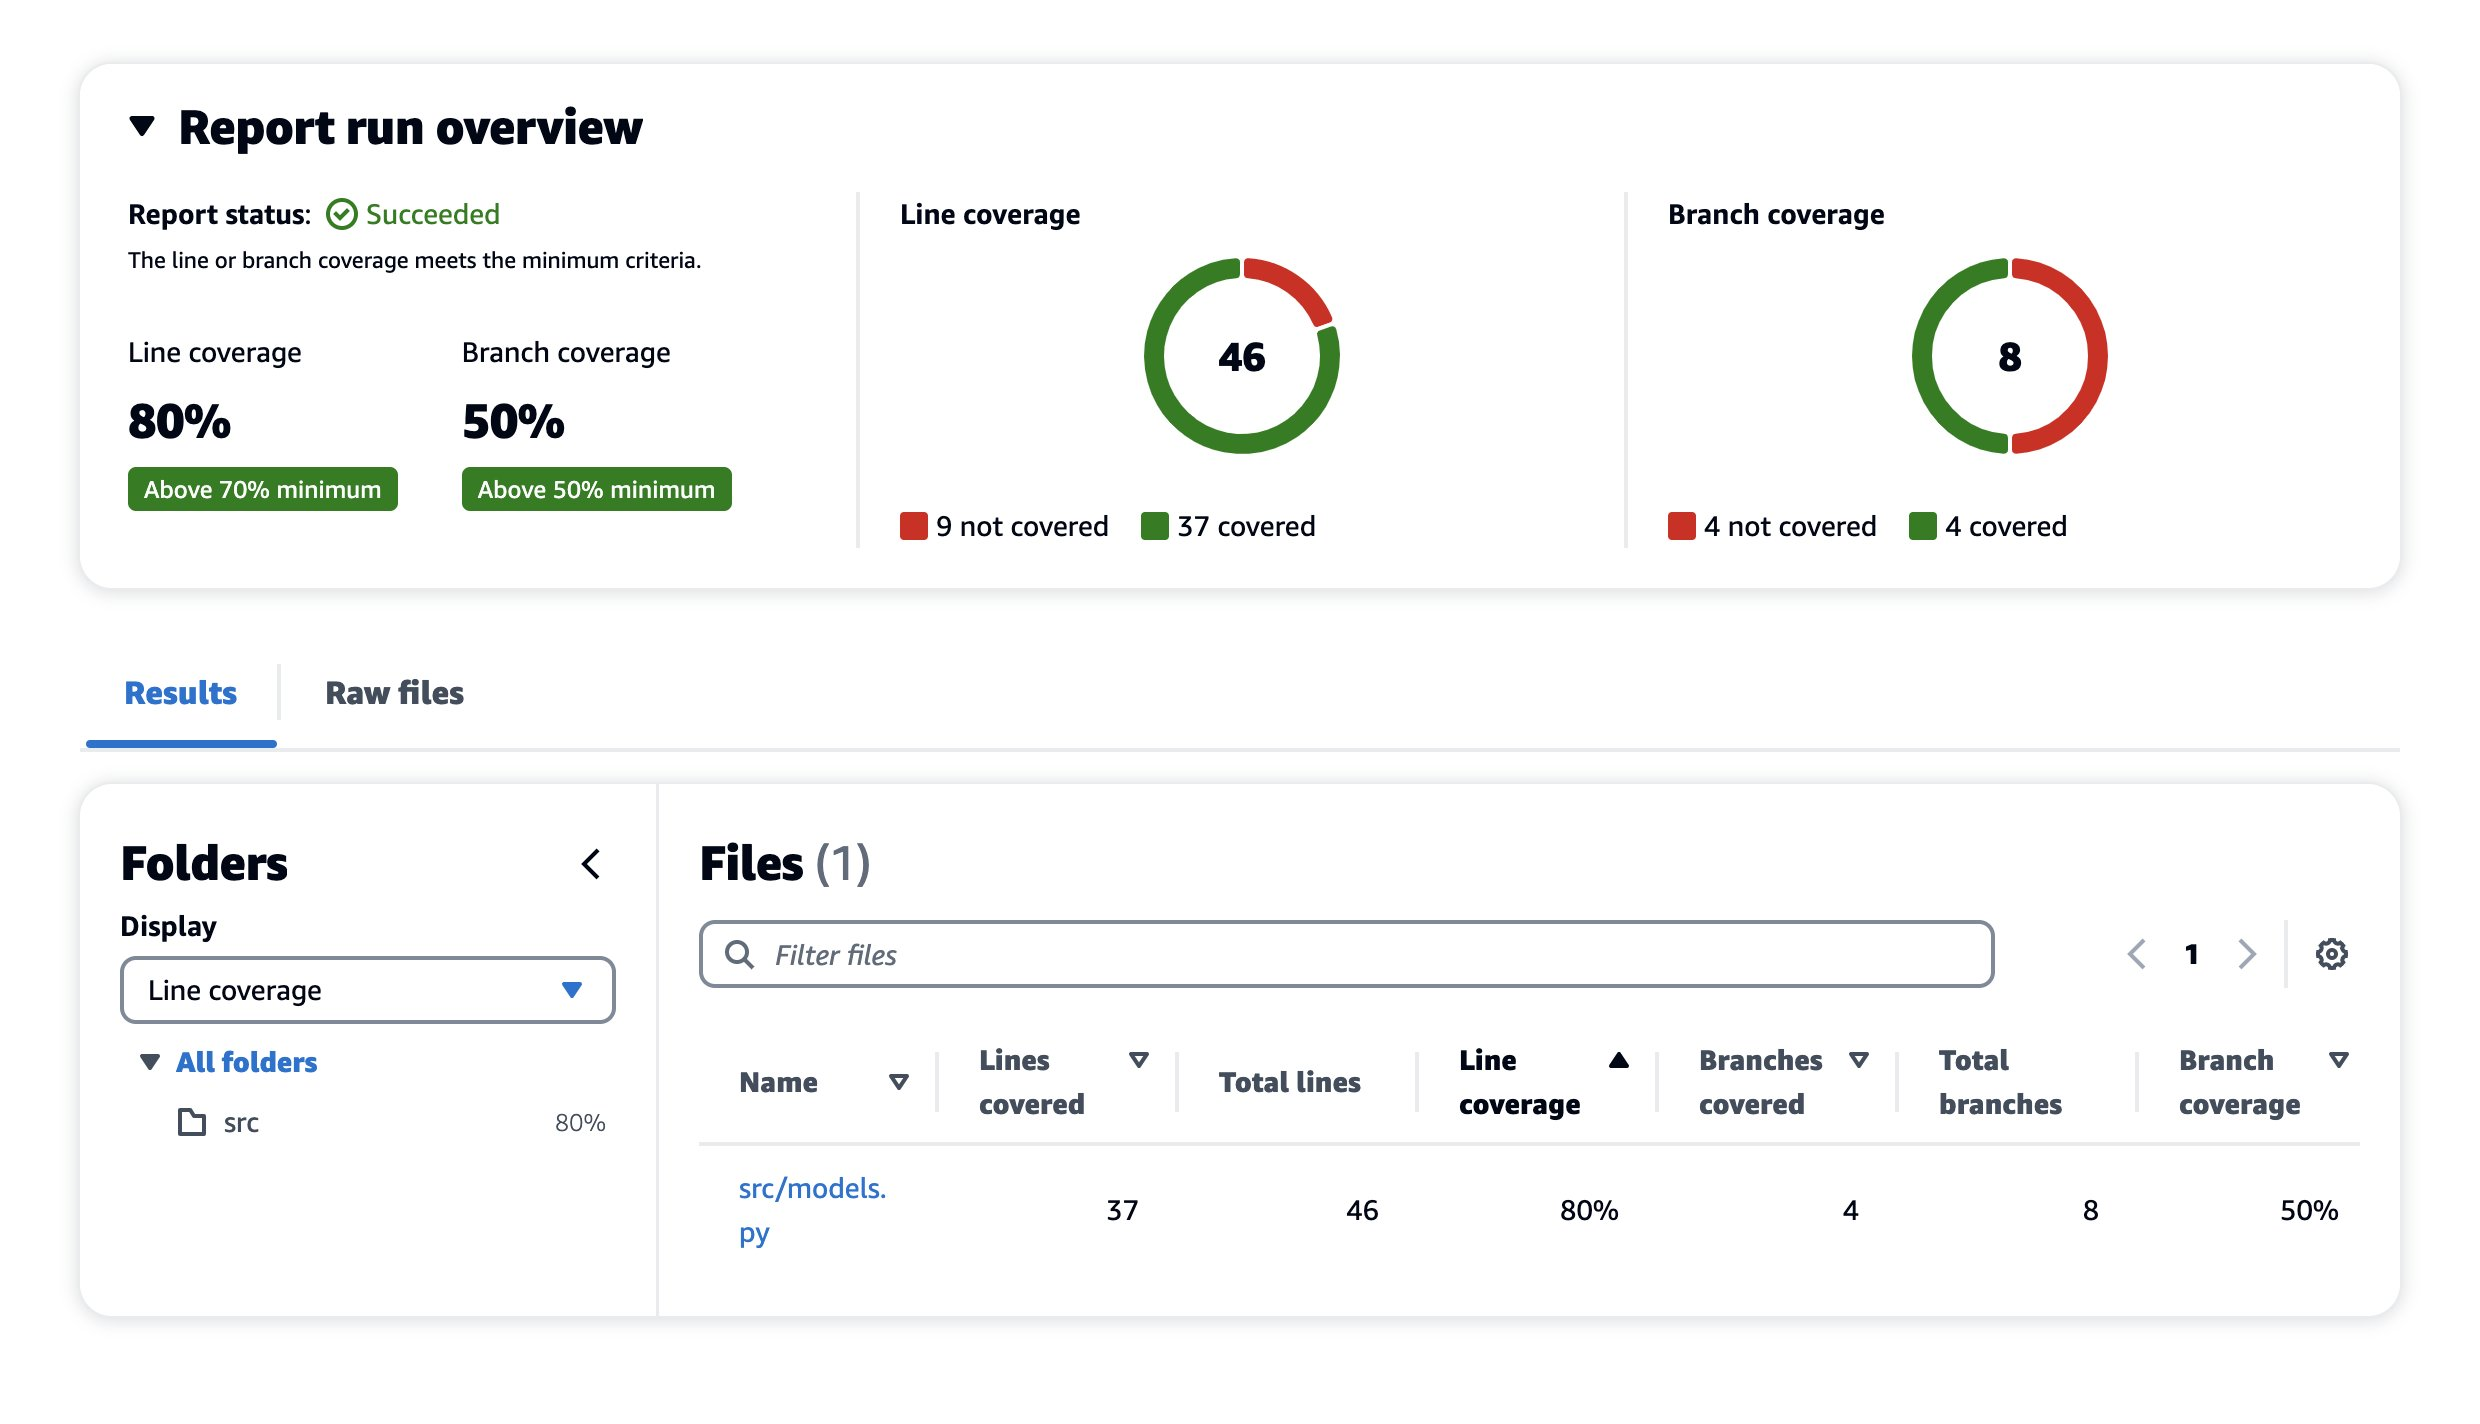
Figure 8. Code Coverage Report Succeeded.
The Line coverage minimum is set to 70% but the current coverage is 80%, so it succeeds. I want to push the team to continue improving, so I will edit the workflow to raise the minimum threshold to 90%. Navigating back to CI/CD → Workflows → ApplicationDeploymentPipeline, select the Edit button. On the Visual tab, select build_backend. On the Outputs tab, scroll down to Success Criteria and change Line Coverage to 90%.
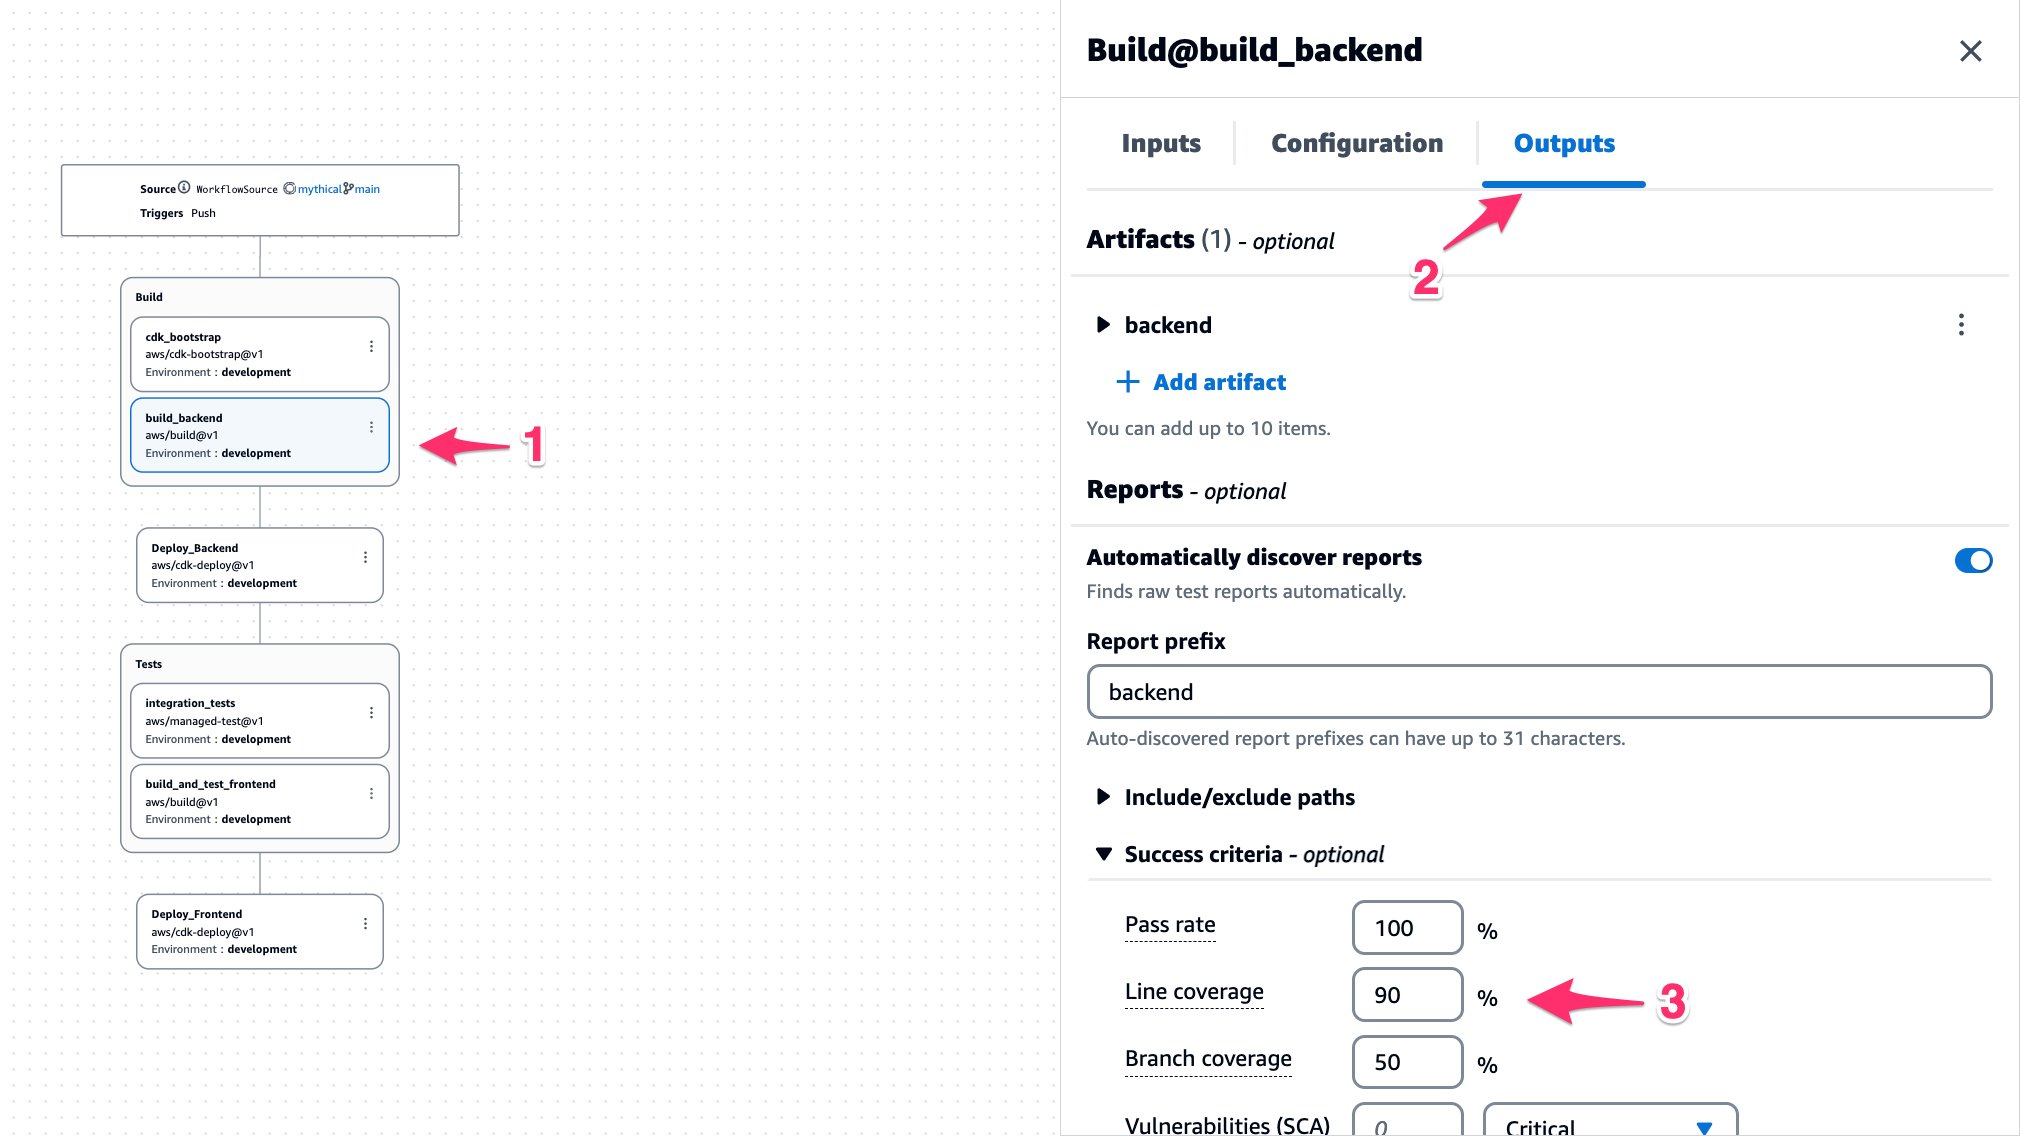
Figure 9. Configuring Code Coverage Success Criteria.
On the top-right, select Commit. This will push the changes to the repository and start a new workflow run. Once the run has finished, navigate back to the Code Coverage report. This time, you can see it reporting a failure to meet the minimum threshold for Line coverage.

Figure 10. Code Coverage Report Failed.
There are other success criteria options available to experiment with. To learn more about success criteria, see Configuring success criteria for tests.
Cleanup
If you have been following along with this workflow, you should delete the resources you deployed so you do not continue to incur charges. First, delete the two stacks that CDK deployed using the AWS CloudFormation console in the AWS account you associated when you launched the blueprint. These stacks will have names like mysfitsXXXXXWebStack and mysfitsXXXXXAppStack. Second, delete the project from CodeCatalyst by navigating to Project settings and choosing Delete project.
Summary
In this post, I demonstrated how Amazon CodeCatalyst can help developers quickly configure test cases, run unit/code coverage tests, and generate reports using CodeCatalyst’s workflow actions. You can use these reports to adhere to your code testing strategy as a software development team. I also outlined how you can use success criteria to influence the outcome of a build in your workflow. In the next post, I will demonstrate how to configure CodeCatalyst workflows and integrate Software Composition Analysis (SCA) reports. Stay tuned!
About the authors: